Developmental, cellular, and behavioral phenotypes in a mouse model of congenital hypoplasia of the dentate gyrus
- Department of Molecular Biology and Genetics, Johns Hopkins University School of Medicine, United States
- Department of Psychiatry and Behavioral Sciences, Johns Hopkins University School of Medicine, United States
- Department of Physiology and Pharmacology, Robert F. Furchgott Center for Behavioral Neuroscience, State University of New York, Downstate Medical Center, United States
- Kavli Institute for Systems Neuroscience and Center for Neural Computation, Norwegian University of Science and Technology, Norway
- Howard Hughes Medical Institute, Johns Hopkins University School of Medicine, United States
- Department of Radiology and Radiological Science, Johns Hopkins University School of Medicine, United States
- Department of Neuroscience, Johns Hopkins University School of Medicine, United States
- Department of Genetic Medicine, Johns Hopkins University School of Medicine, United States
- Center for Neural Science, New York University, United States
- Neuroscience Institute at the New York University Langone Medical Center, New York University, United States
- Department of Ophthalmology, Johns Hopkins University School of Medicine, United States
Figures
Figure 1 with 1 supplement
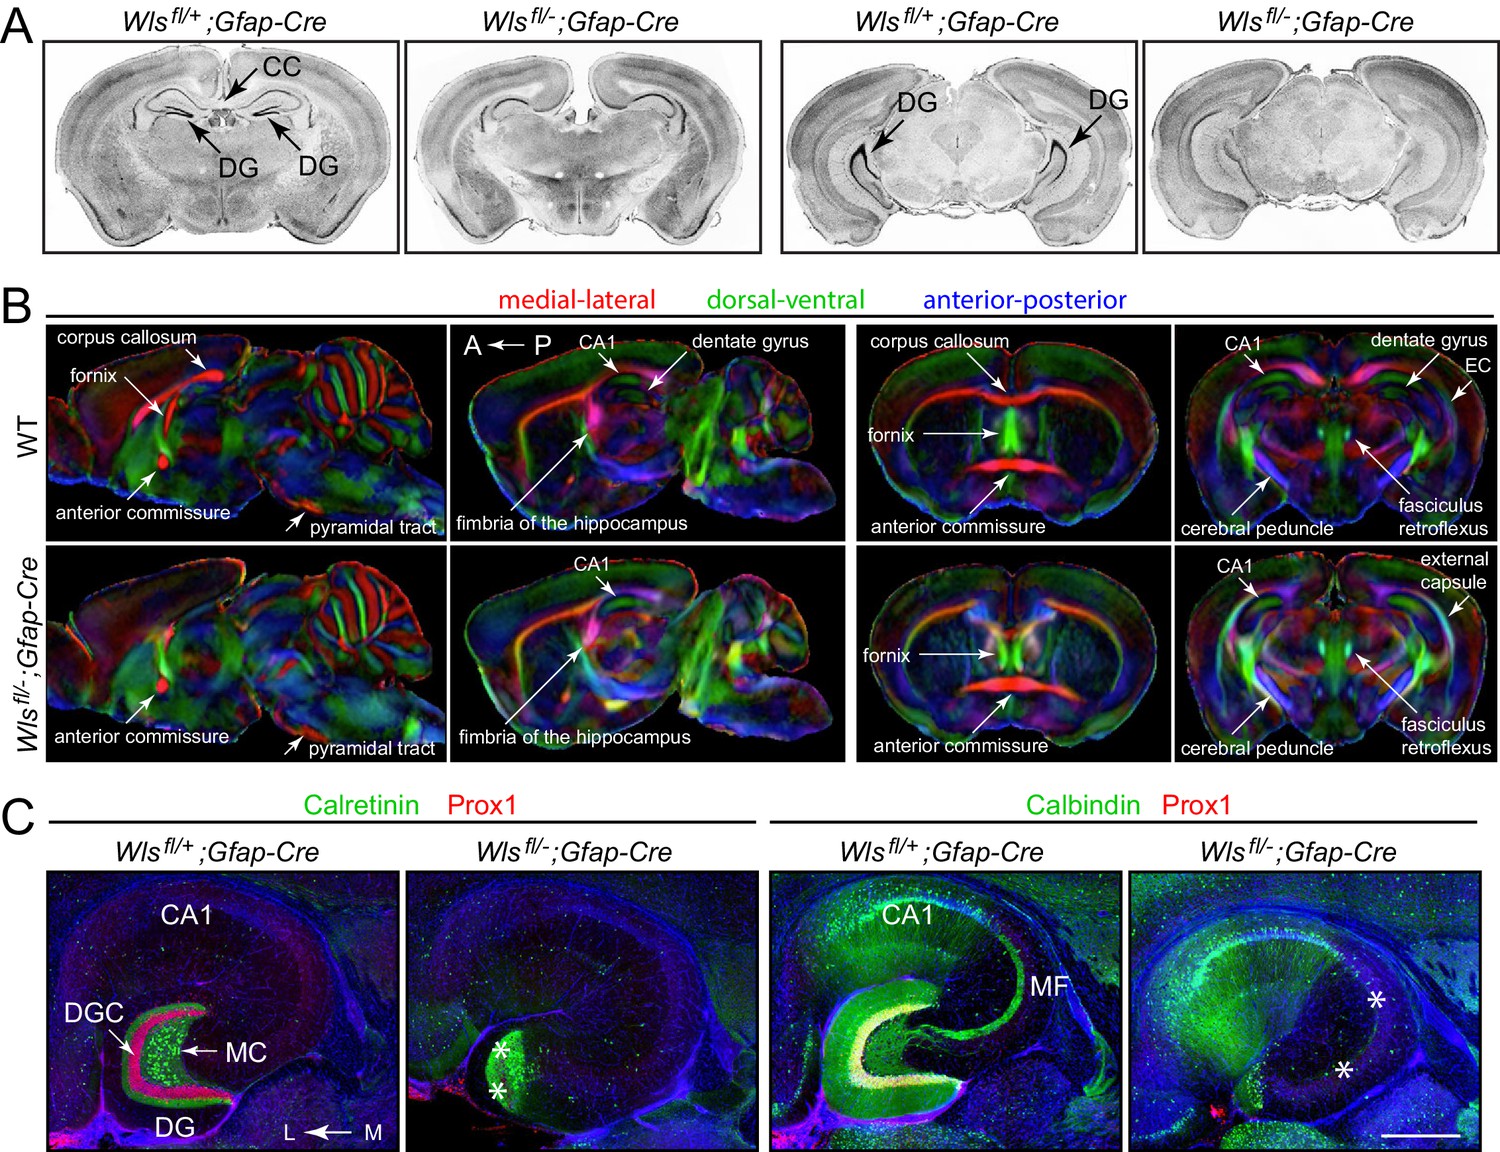
Hypoplasia of the DG and absence of the corpus callosum in adult Wlsfl/-;Gfap-Cre mice.
(A) Coronal brain sections from adult Wlsfl/+;Gfap-Cre and Wlsfl/-;Gfap-Cre mice at the level of the anterior/dorsal hippocampus (left pair of images) and posterior/ventral hippocampus (right pair of images). Additional coronal sections from these two mice and from a second Wlsfl/-;Gfap-Cre mouse are shown in Figure 1—figure supplement 1. (B) μDTI images from 7month-old Wlsfl/+;Gfap-Cre and Wlsfl/-;Gfap-Cre brains. Each image represents an average of three brains of the indicated genotype. Left images, sagittal sections. Right images, coronal sections. (C) Horizontal sections through dorsal adult Wlsfl/+;Gfap-Cre and Wlsfl/-;Gfap-Cre hippocampi, immunostained with the indicated antibodies and counterstained with DAPI. Asterisks mark the locations of missing DGCs and mossy fibers. CC, corpus callosum. DG, dentate gyrus. DGC, dentate granule cells. EC, external capsule. MC, mossy cells. MF, mossy fibers. A, anterior. P, posterior. L, lateral. M, medial. Scale bar in C, 500 μm.
Figure 1—figure supplement 1
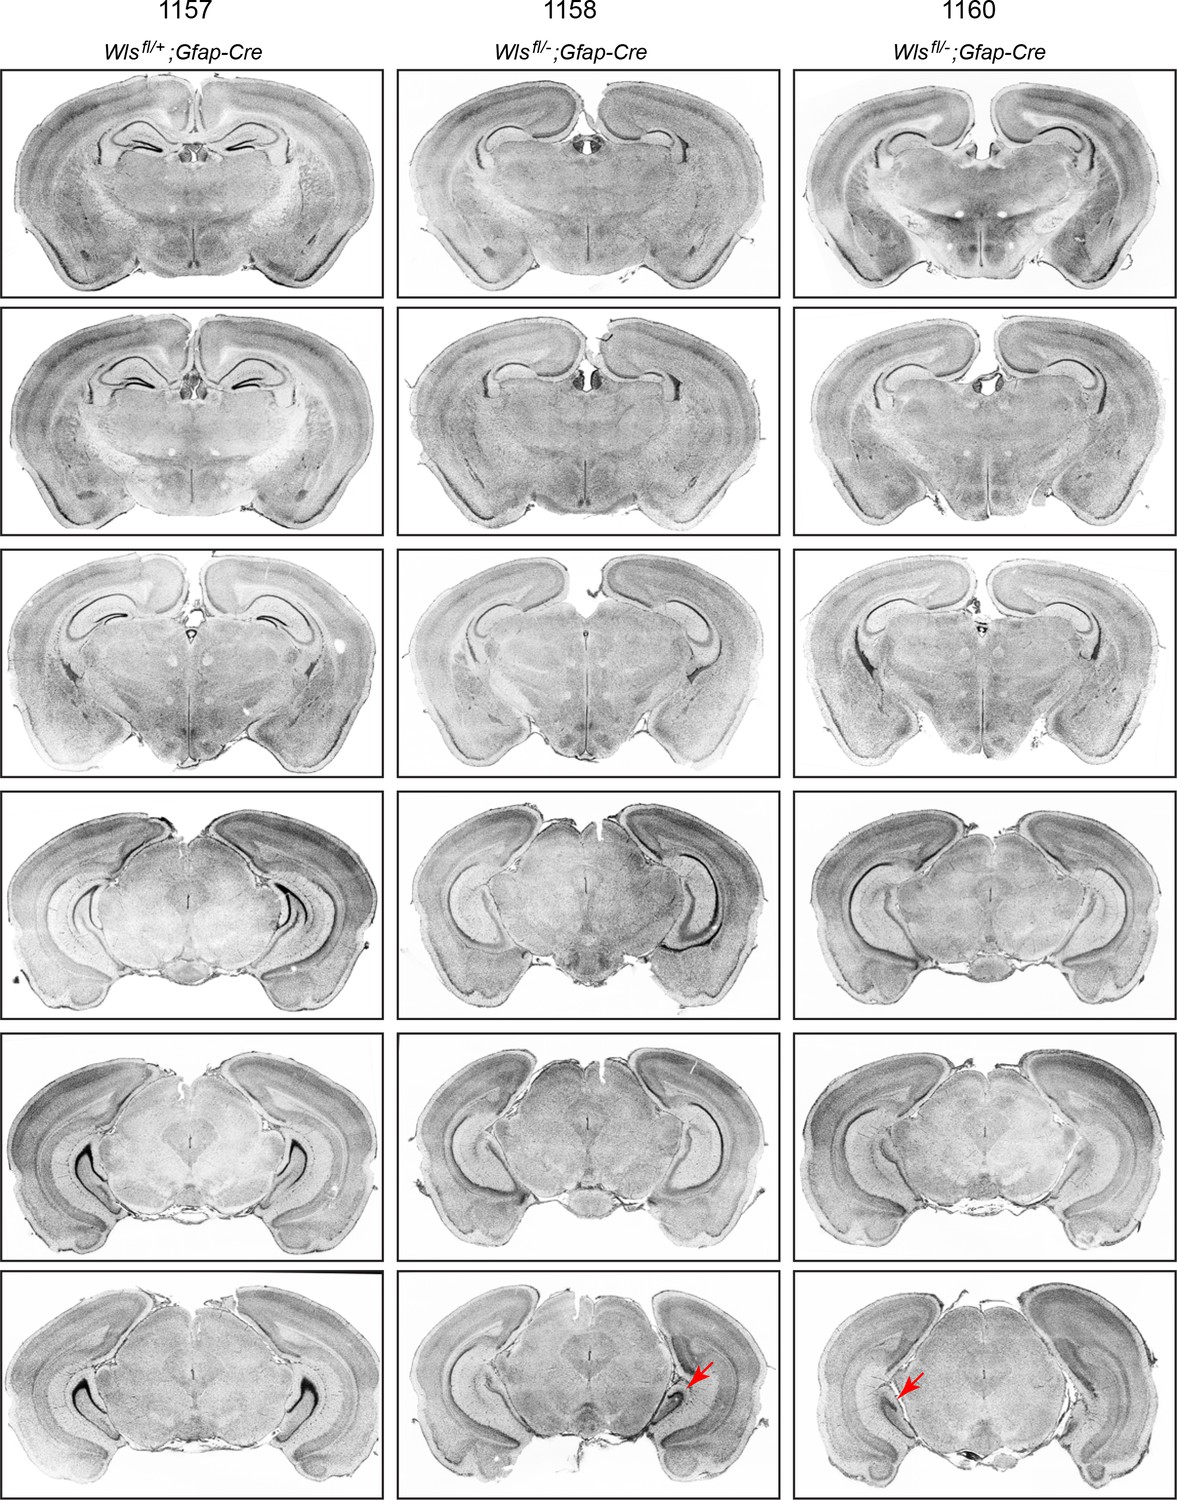
Serial coronal sections of adult Wlsfl/+;Gfap-Cre and Wlsfl/-;Gfap-Cre brains.
Sections were stained with DAPI. In the two Wlsfl/-;Gfap-Cre brains, throughout most of the hippocampus the DG is absent, but in the extreme posterior (ventral) hippocampus, the DG is present in brain 1158 on the right side and in brain 1160 on the left side (red arrows in the lowest panels).
Figure 2 with 1 supplement
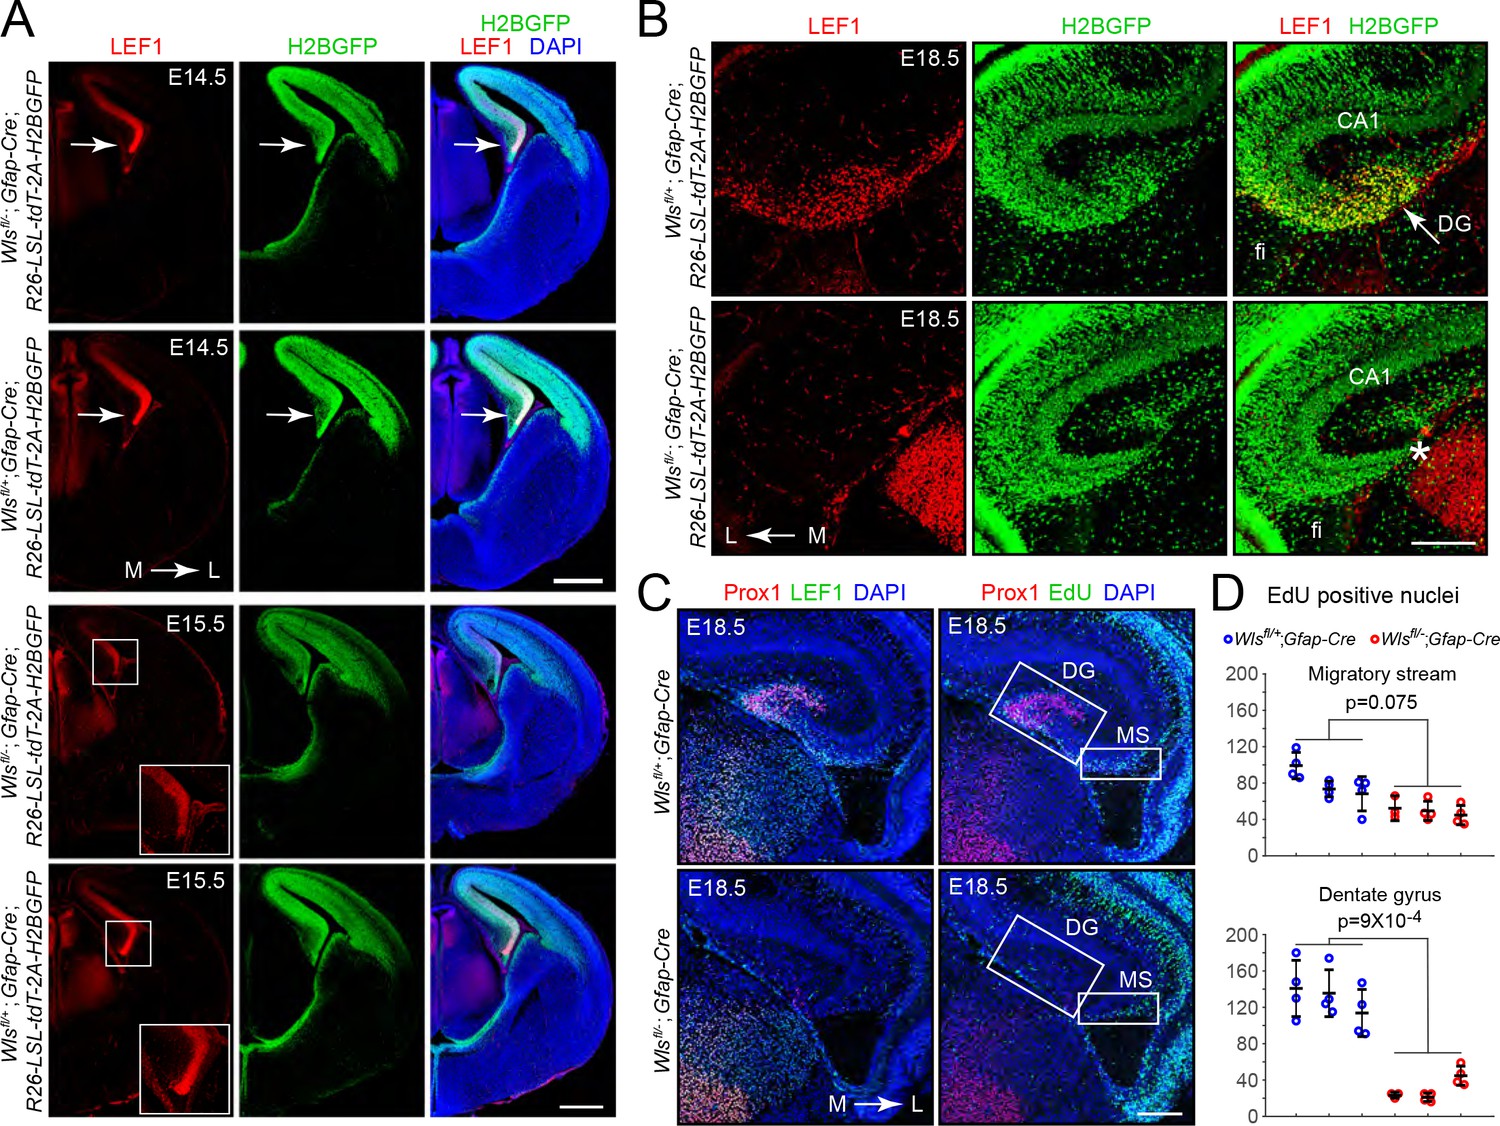
Hypo-proliferation of DG progenitors in Wlsfl/-;Gfap-Cre fetuses.
(A) Coronal sections of E14.5 brains (upper six images) and E15.5 brains (lower six images) from Wlsfl/+;Gfap-Cre;R26-LSL-tdT-2A-H2BGFP and Wlsfl/-;Gfap-Cre;R26-LSL-tdT-2A-H2BGFP fetuses showing (i) the territory of Gfap-Cre expression as indicated by the accumulation of the H2B-GFP reporter and (ii) the location and magnitude of beta-catenin signaling as indicated by the accumulation of LEF1. In the E14.5 images, the arrow points to the cortical hem. In the E15.5 images, the cortical hem region is boxed and enlarged at the lower right. (B) Coronal section and immunostaining as in (A) except at E18.5. Asterisk, location where the DG should be. (C) Horizontal sections of E18.5 Wlsfl/+;Gfap-Cre and Wlsfl/-;Gfap-Cre brains with developing DG pyramidal neurons visualized by Prox1 immunostaining, the response to beta-catenin signaling visualized by LEF1 immunostaining, and cell proliferation visualized by EdU labeling following an injection 2 hr prior to sacrifice. MS, migratory stream. (D) Quantification of EdU- positive nuclei in the developing migratory stream (upper) and the adjacent DG (lower; identified by Prox1 immunostaining) in E18.5 Wlsfl/+;Gfap-Cre and Wlsfl/-;Gfap-Cre brains. Each data point represents the counts from a confocal Z-plane of 15 μm thickness. Bars show mean ± S.D. Fi, fimbria. L, lateral. M, medial. Scale bar in (A), 500 μm. Scale bars in (B) and (D), 200 μm.
Figure 2—figure supplement 1
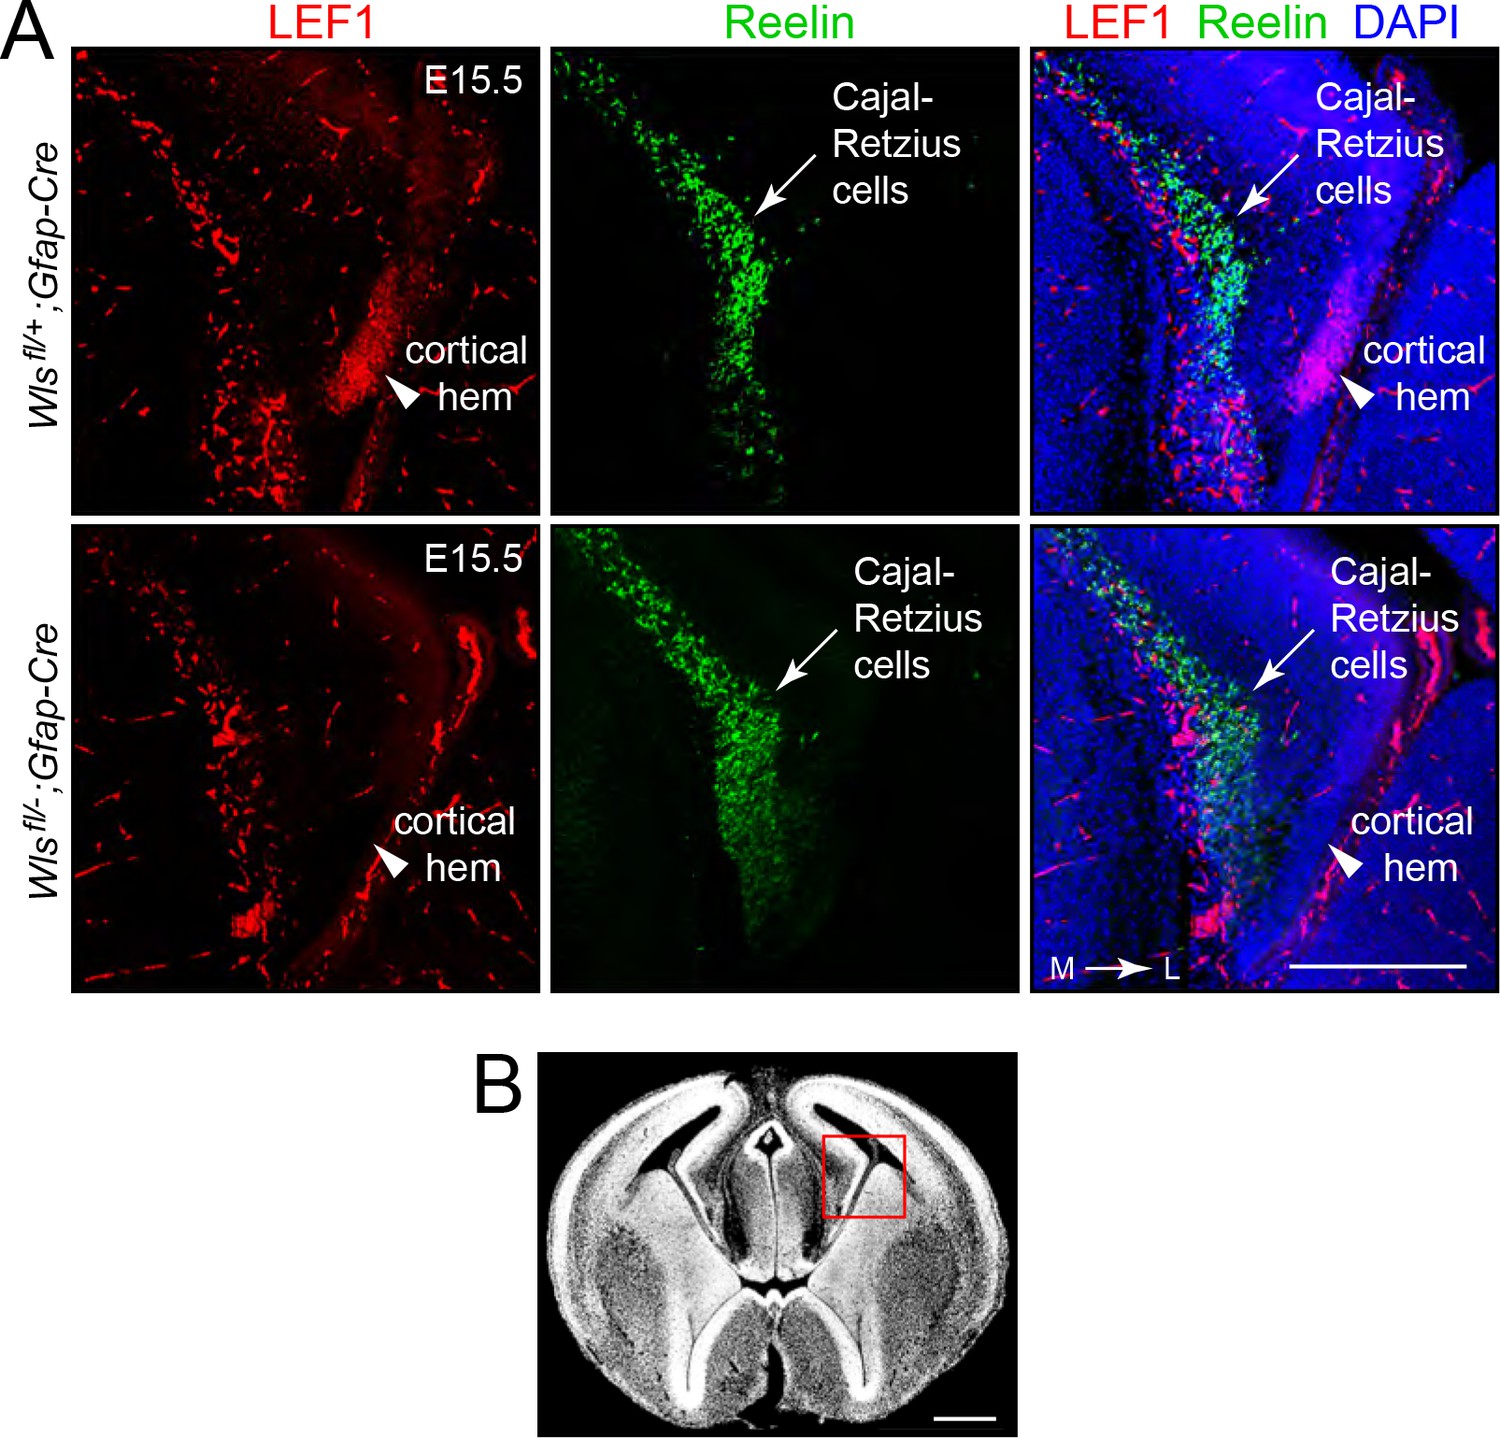
Reduced beta-catenin signaling in DG progenitors in Wlsfl/-;Gfap-Cre fetuses at E15.5.
(A) Coronal brain sections at E15.5 show that the cortical hem, the cluster of cells that are destined to form the DG, accumulate LEF1 in Wlsfl/+;Gfap-Cre fetuses but not in Wlsfl/-;Gfap-Cre fetuses (arrowheads). The adjacent band of Cajal-Retzius cells (marked by Reelin) is unaffected by genotype. Outside of the cortical hem, LEF1 immunostaining is present in vascular endothelial cells. (B) In a coronal brain section at E15.5, the red square shows the location of the images in (A). L, lateral. M, medial. Scale bar in (A), 250 μm. Scale bar in (B), 500 μm.
Figure 3 with 4 supplements
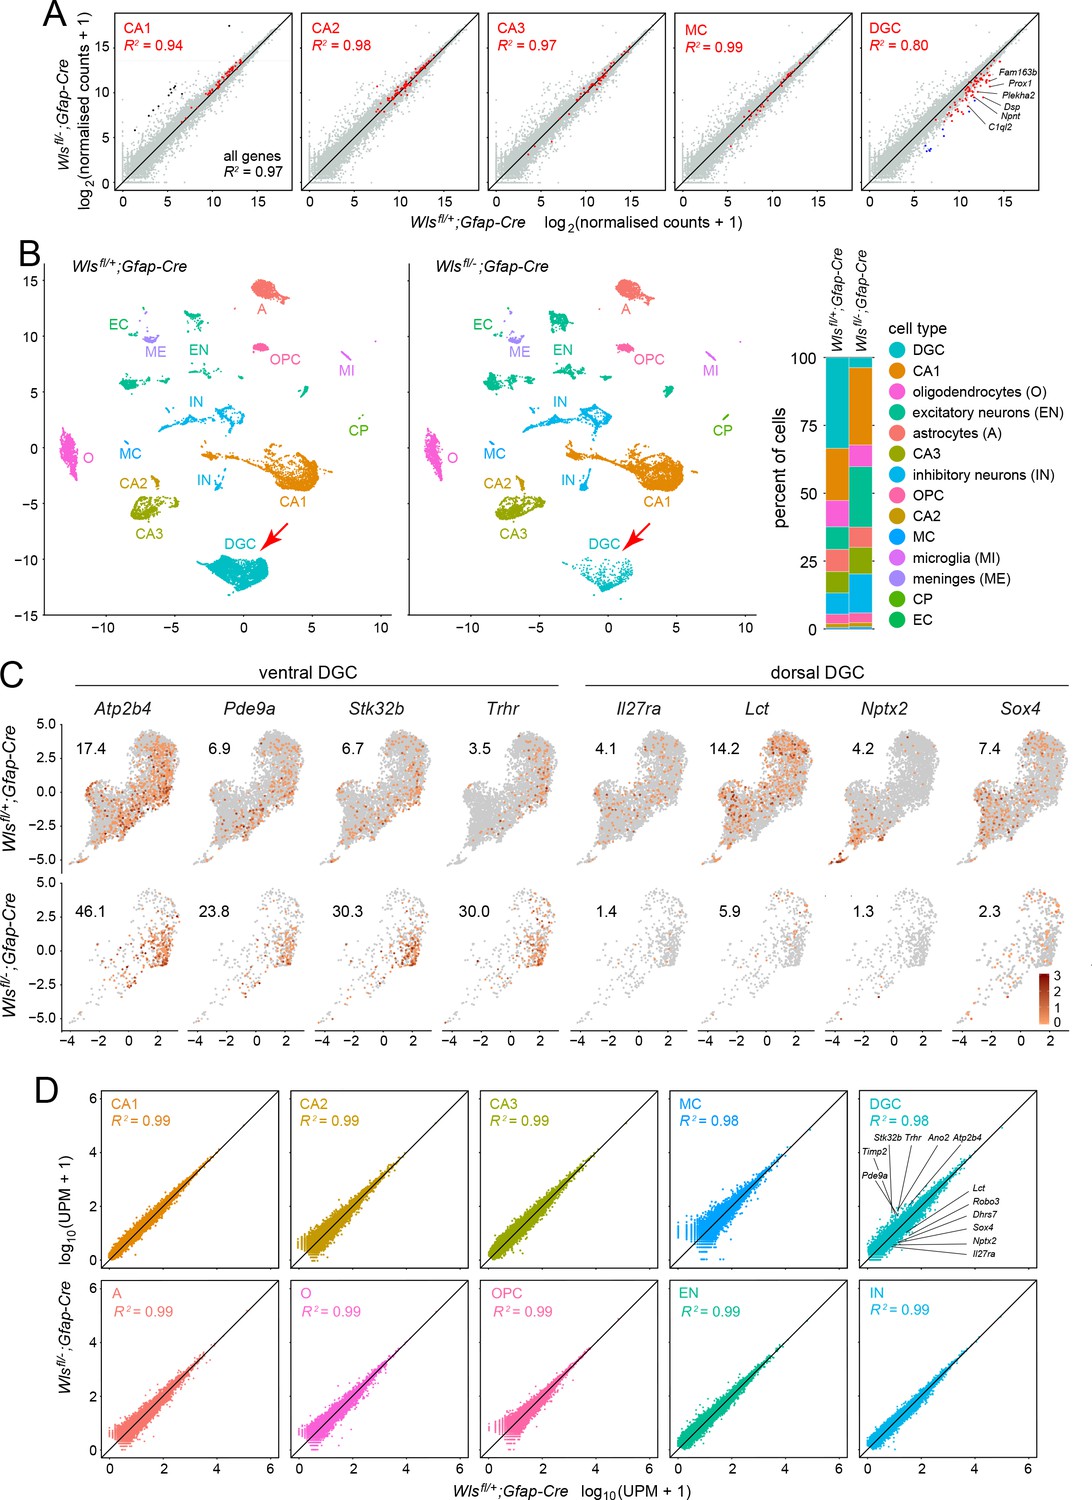
Bulk RNAseq and snRNAseq show loss of granule cells in the dorsal DG, with little change in other hippocampal cell types.
(A) Scatterplots of normalized read counts from bulk RNAseq from ~12 week old Wlsfl/+;Gfap-Cre and Wlsfl/-;Gfap-Cre hippocampi. Gray symbols represent all transcripts. Red symbols represent transcripts previously reported to be enriched in each of the five indicated cell types (from left to right): CA1 pyramidal cells, CA2 pyramidal cells, CA3 pyramidal cells, mossy cells (MC), and dentate granule cells (DGC). Black symbols in the left-most scatter plot represent transcripts enriched in choroid plexus. Blue symbols in the right-most scatter plot represent transcripts enriched in DGCs based on the snRNAseq analysis reported here. In the CA2 scatter plot, the lone red data point that is well above the 45-degree line is expressed in both CA2 pyramidal neurons and the choroid plexus. By snRNAseq, its expression in CA2 pyramidal neurons is unaffected by genotype. (B) UMAP plot of cell clusters from snRNAseq of ~12 week old Wlsfl/+;Gfap-Cre and Wlsfl/-;Gfap-Cre hippocampi. Red arrow, DGC cluster. Right, percentile plots of the major hippocampal cell types in control and mutant snRNAseq datasets. (C) DGC-only UMAP plots showing normalized read counts for transcripts enriched in the ventral DG (left) and the dorsal DG (right) in Wlsfl/-;Gfap-Cre vs. Wlsfl/+;Gfap-Cre hippocampi. Numbers associated with each UMAP plot indicate the percentage of cells expressing the indicated gene.(D) Scatter plots comparing Wlsfl/-;Gfap-Cre vs. Wlsfl/+;Gfap-Cre transcripts for the ten most abundant hippocampal cell types. For each of the ten clusters, read counts were pooled and normalized. For the DGC cluster (upper right), the twelve transcripts shown in Figure 3—figure supplement 2 are identified on the scatter plot: six transcripts are enriched in the ventral DG and reside above the 45-degree line, and six transcripts are enriched in the dorsal DG and reside below the 45-degree line.
Figure 3—figure supplement 1

Hippocampal cell-type clustering based on transcript abundances.
For eight of the most abundant hippocampal cell subtype (horizontal axis), the heatmap shows the normalized expression of 39 transcripts (vertical axis) in each cell. Among the eight cell types shown, CA2 and CA3 pyramidal cells are the most similar in the pattern of gene expression, and this is reflected in the close juxtaposition of their respective clusters in the UMAP plots in Figure 3B. Cell-type-specific read counts were derived from the sum of Wlsfl/-;Gfap-Cre and Wlsfl/+;Gfap-Cre snRNAseq data sets.
Figure 3—figure supplement 2
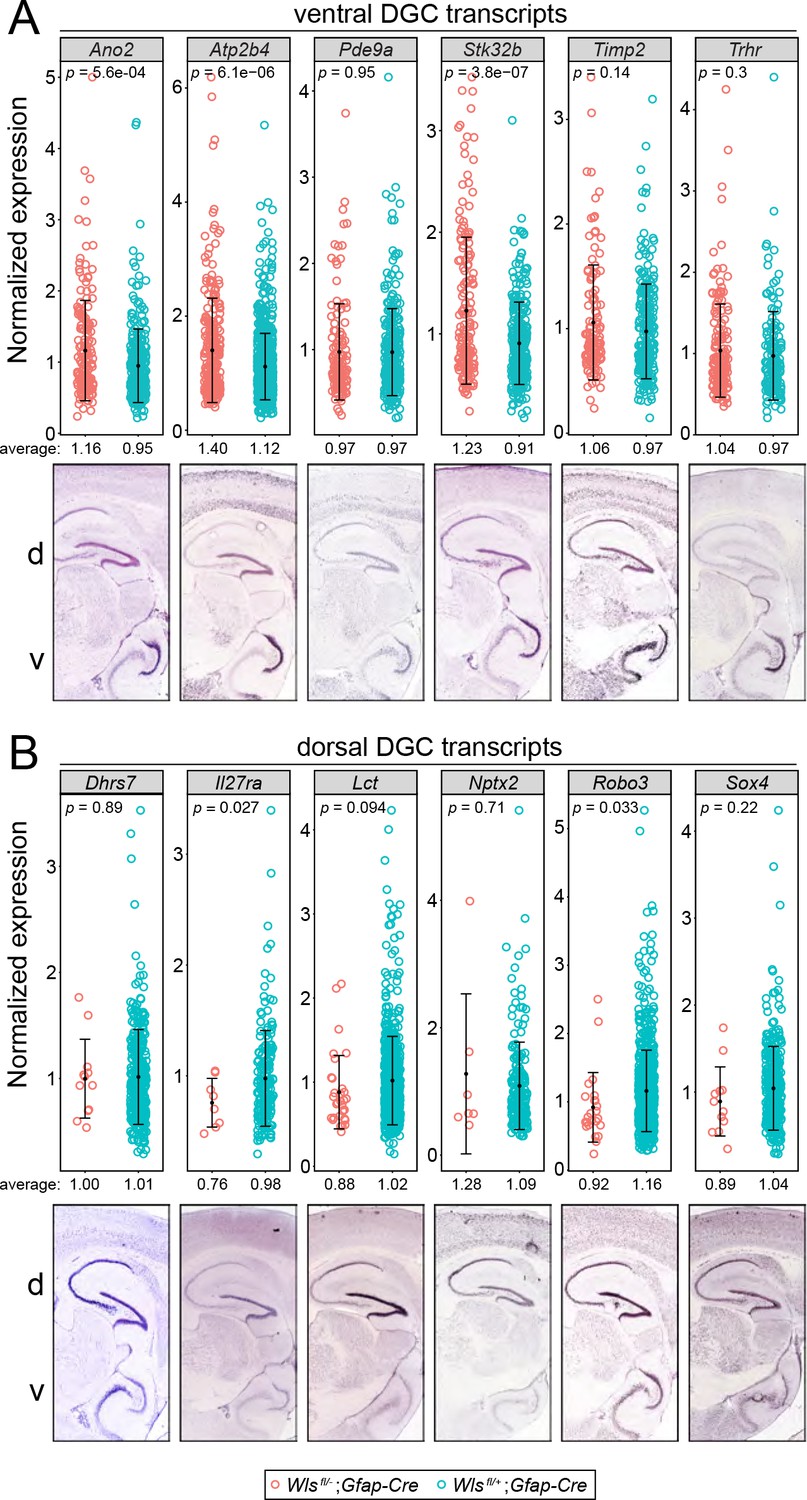
Comparisons of normalized snRNAseq read counts for DGC transcripts enriched in the ventral DG or the dorsal DG in Wlsfl/-;Gfap-Cre vs.Wlsfl/+;Gfap-Cre hippocampi.
(A) Six DGC transcripts enriched in the ventral DG. (B) Six DGC transcripts enriched in the dorsal DG. For each transcript, the lower panel shows in situ hybridization to a parasagittal section of adult mouse brain. The dorsal (d; equivalent to anterior) region of the hippocampus is at the top and the ventral (v; equivalent to posterior) region of the hippocampus is at the bottom. The upper panels in A and B show the normalized read counts in the Wlsfl/-;Gfap-Cre and Wlsfl/+;Gfap-Cre snRNAseq data sets for every DGC that had one or more reads for the indicated transcript. For both ventral-enriched and dorsal-enriched transcripts, the normalized expression levels were similar between the two genotypes. For dorsal DG (B), the number of DGCs was greatly reduced in the Wlsfl/-;Gfap-Cre data set. The low p-values for some of the Wlsfl/-;Gfap-Cre vs. Wlsfl/+;Gfap-Cre comparisons reflect the large numbers of cells being compared. Error bars, mean +/- SD.
© 2020 Allen Institute for Brain Science. All rights reserved. Panels A and B are reproduced from the Allen Brain Atlas. Further reproduction of these panels would need permission from the copyright holder.
Figure 3—figure supplement 3
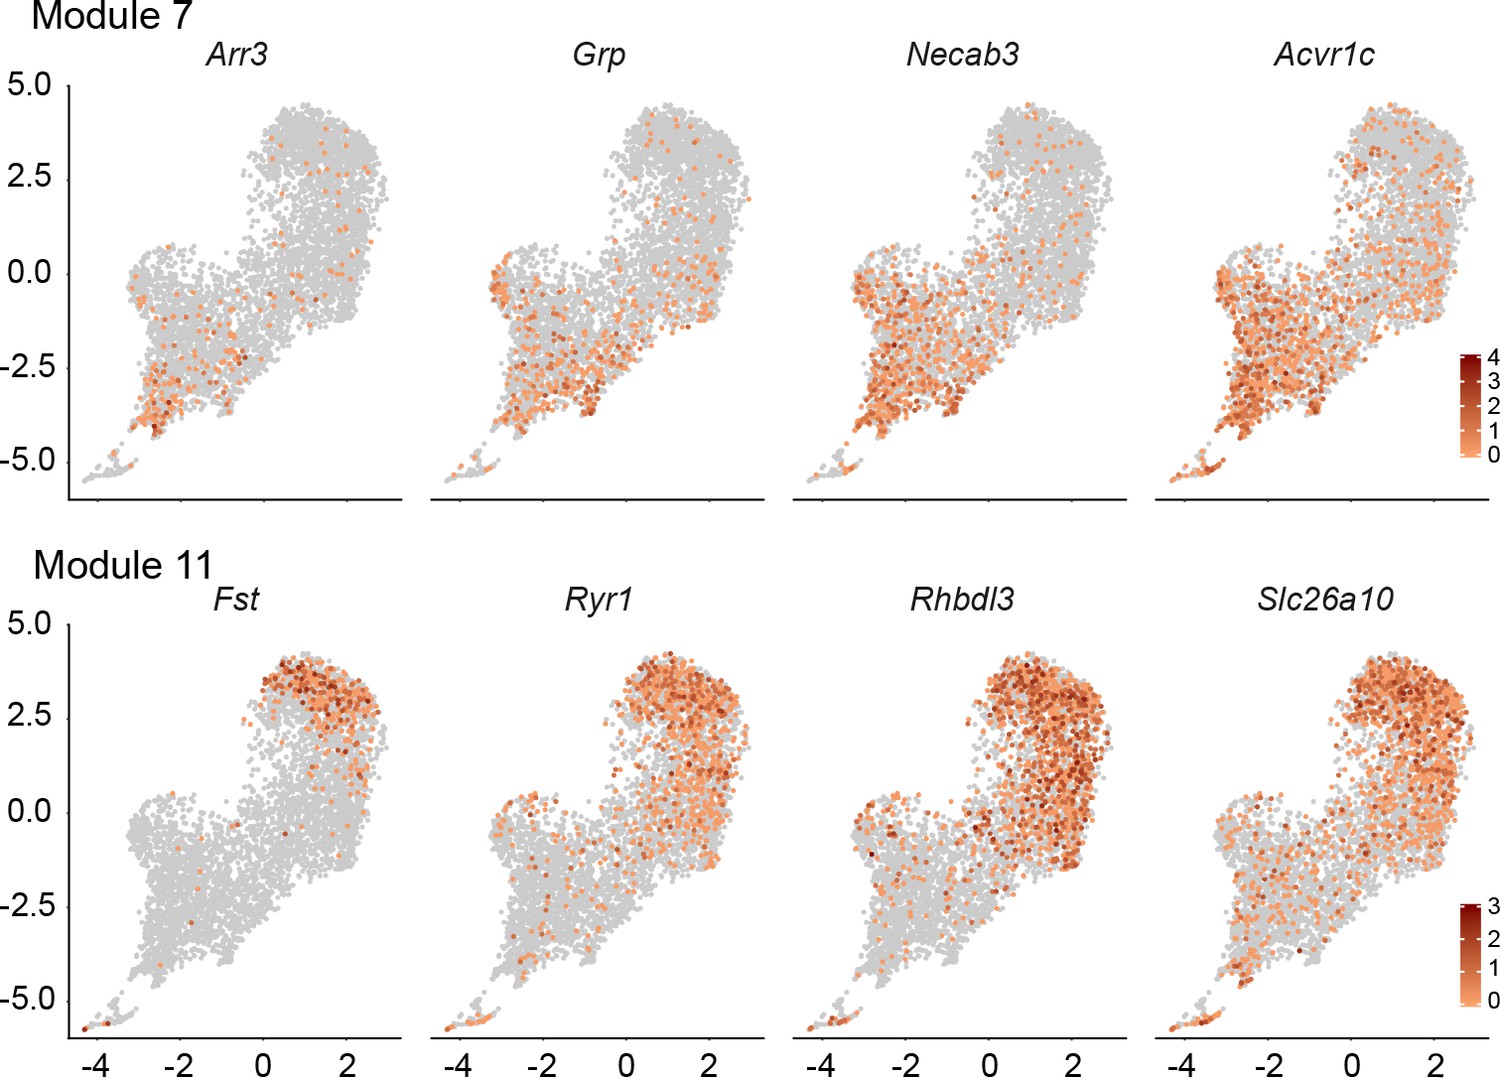
An additional dimension of DGC subclusters in the DGC-only UMAP cluster.
For each transcript, the UMAP plot for Wlsfl/+;Gfap-Cre DGCs (Figure 3C) is shown with transcript abundances color-coded in red. Shown are four transcripts that are enriched in module 7 (upper) and four transcripts that are enriched in module 11 (lower).
Figure 3—figure supplement 4
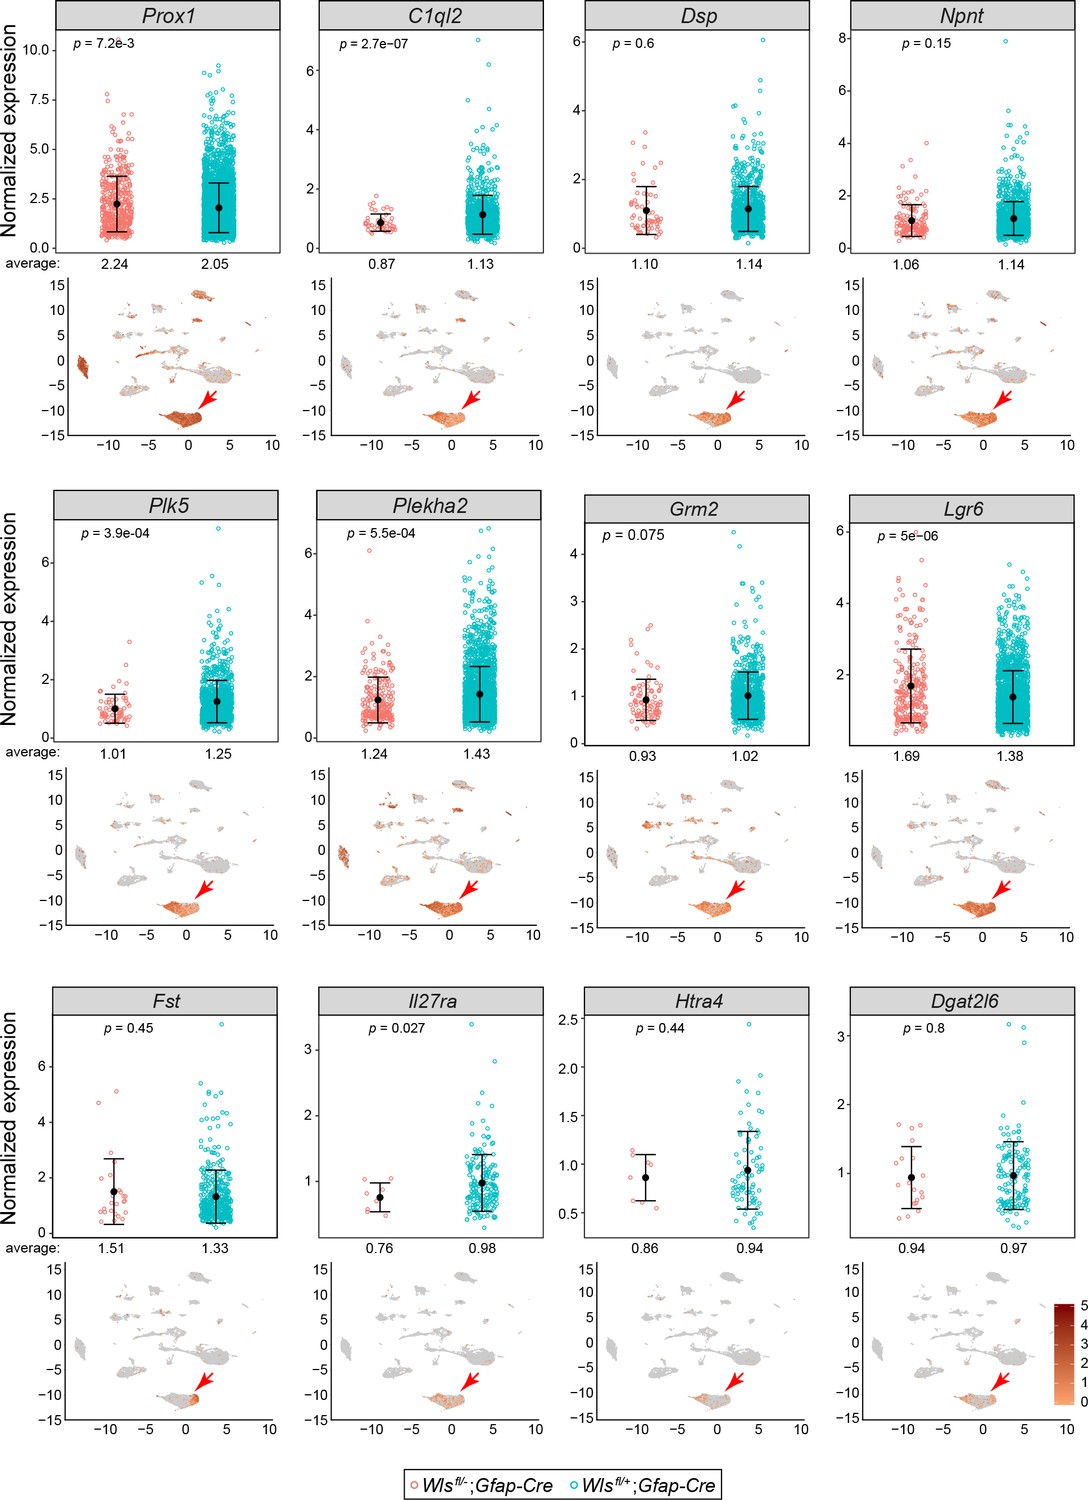
Comparisons of normalized snRNAseq read counts for twelve transcripts in DGCs of Wlsfl/-;Gfap-Cre vs.Wlsfl/+;Gfap-Cre hippocampi.
For each transcript, the lower panel shows the WT control UMAP plot from Figure 3B with transcript abundances color-coded in red. In each plot, a red arrow points to the DGC cluster. The upper panels show the normalized read counts in the Wlsfl/-;Gfap-Cre and Wlsfl/+;Gfap-Cre snRNAseq data sets for every DGC that had one or more reads for the indicated transcript. For all 12 transcripts, the normalized expression levels were similar between the two genotypes. The mean abundances of transcripts and the locations of expressing cells within the DGC cluster vary. For example, DGCs expressing C1ql2, Plk5, and Htra4 cluster toward the left side of the DGC cluster, whereas DGCs expressing Fst cluster toward the right side of the DGC cluster. Error bars, mean +/- SD.
Figure 4

Morphological analyses of CA3 pyramidal cells and their synapses.
(A) CA3 pyramidal cells in dorsal hippocampus, reconstructed from Golgi-stained 2–3-month-old Wlsfl/+;Gfap-Cre and Wlsfl/-;Gfap-Cre brains. Apical is up and basal is down. (B) Lengths of apical and basal dendrites among the 18 reconstructed CA3 pyramidal cells. (C) Numbers and densities of complex and simple dendritic spines on the 18 reconstructed CA3 pyramidal cells. (D,E) Length of complex dendritic spines and spine coverage by simple and complex spines on the 18 reconstructed CA3 pyramidal cells. Box plots show the median and 25th to 75th percentiles, whiskers include all data points not considered outliers, and individual outliers are shown. Scale bar in (A), 200 μm. * represents p<0.05.
Figure 5 with 4 supplements
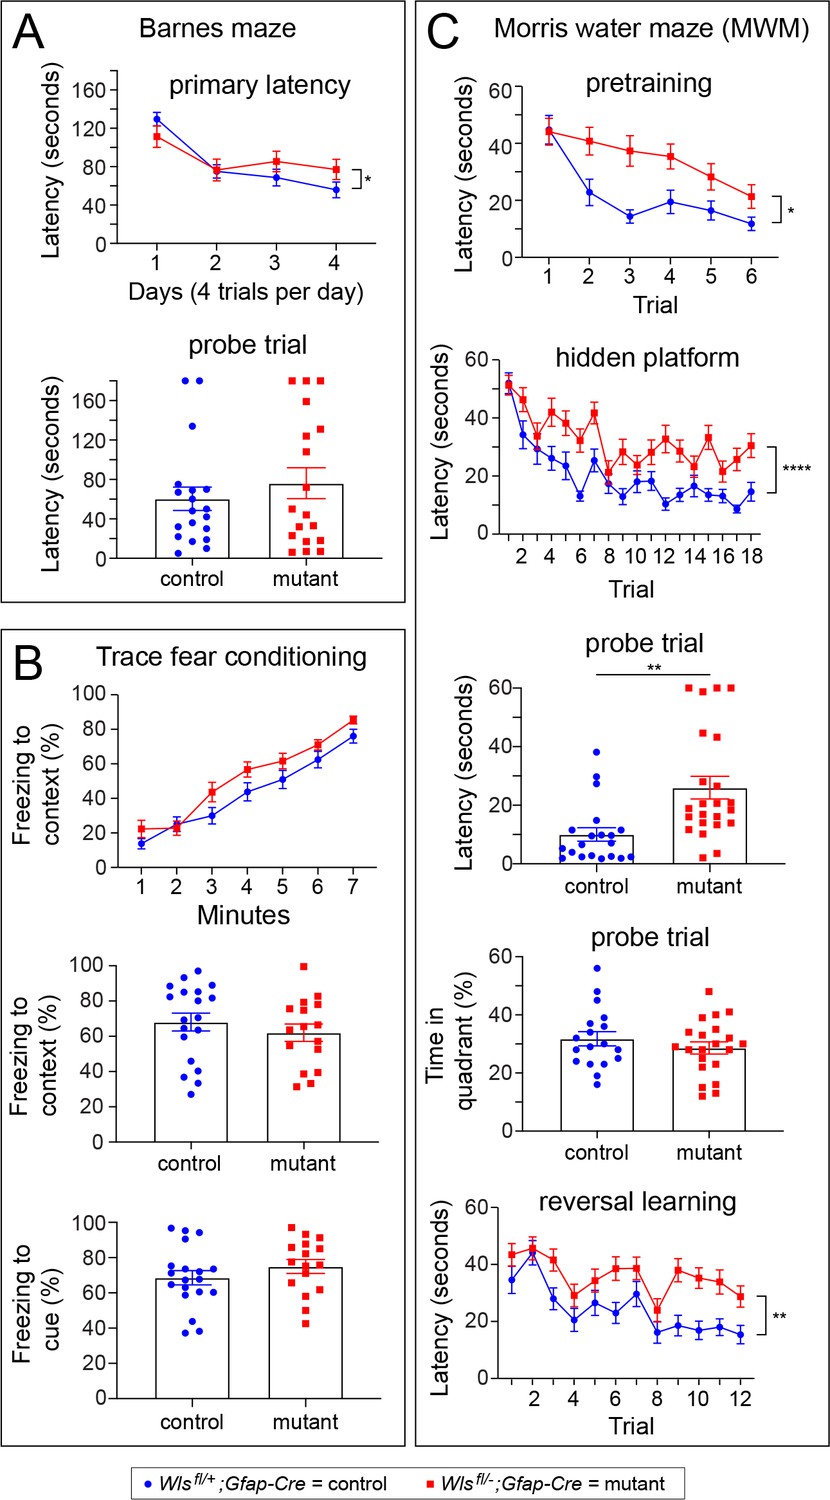
Wlsfl/-;Gfap-Cre mice exhibit defects in the Morris water maze, but not in the Barnes maze or in a trace fear-conditioning task.
Performance was assessed by comparing 10–20 week old Wlsfl/+;Gfap-Cre and Wlsfl/-;Gfap-Cre mice. Data were from approximately equal numbers of males and females for each genotype. See Figure 5—figure supplements 1–3 for the number of males and females for each test and the results separated by sex. For plots showing the latencies for each trial, the vertical bracket indicates the statistical significance for the last trial. (A) Mutant mice exhibited marginally longer latency on day 4 of training in the Barnes maze (p<0.05; A), but no differences between control and mutant mice were found during a probe trial 48 hr later. (B) Freezing following trace fear conditioning showed no statistically significant difference between control and mutant mice during training (top panel) or in response to the context or cue 24 hr after training (bottom two panels). (C) In the MWM pretraining period with a visible platform, mutant mice showed a significantly greater latency than controls on trials 2–6 (p<0.05). During hidden platform training, an overall significant effect of trial was found (p<0.0001) as well as a significant increase in latency among mutant mice (p<0.001). The latency to approach the platform location was longer for mutant mice than controls during a probe trial 24 hr after hidden platform training (p<0.001). During the probe trial, no differences between mutant and control mice were found in percent time spent in the quadrant that previously contained the platform. In a reversal learning task following the probe trial, mutant mice showed a greater latency compared to controls (p<0.01) and there was an overall improvement in performance with successive trials for both genotypes (p<0.0001). *p<0.05, **p<0.01, ***p<0.001, ****p<0.0001, n = 16–21 mice per group. The graphs show mean +/- SEM.
Figure 5—figure supplement 1
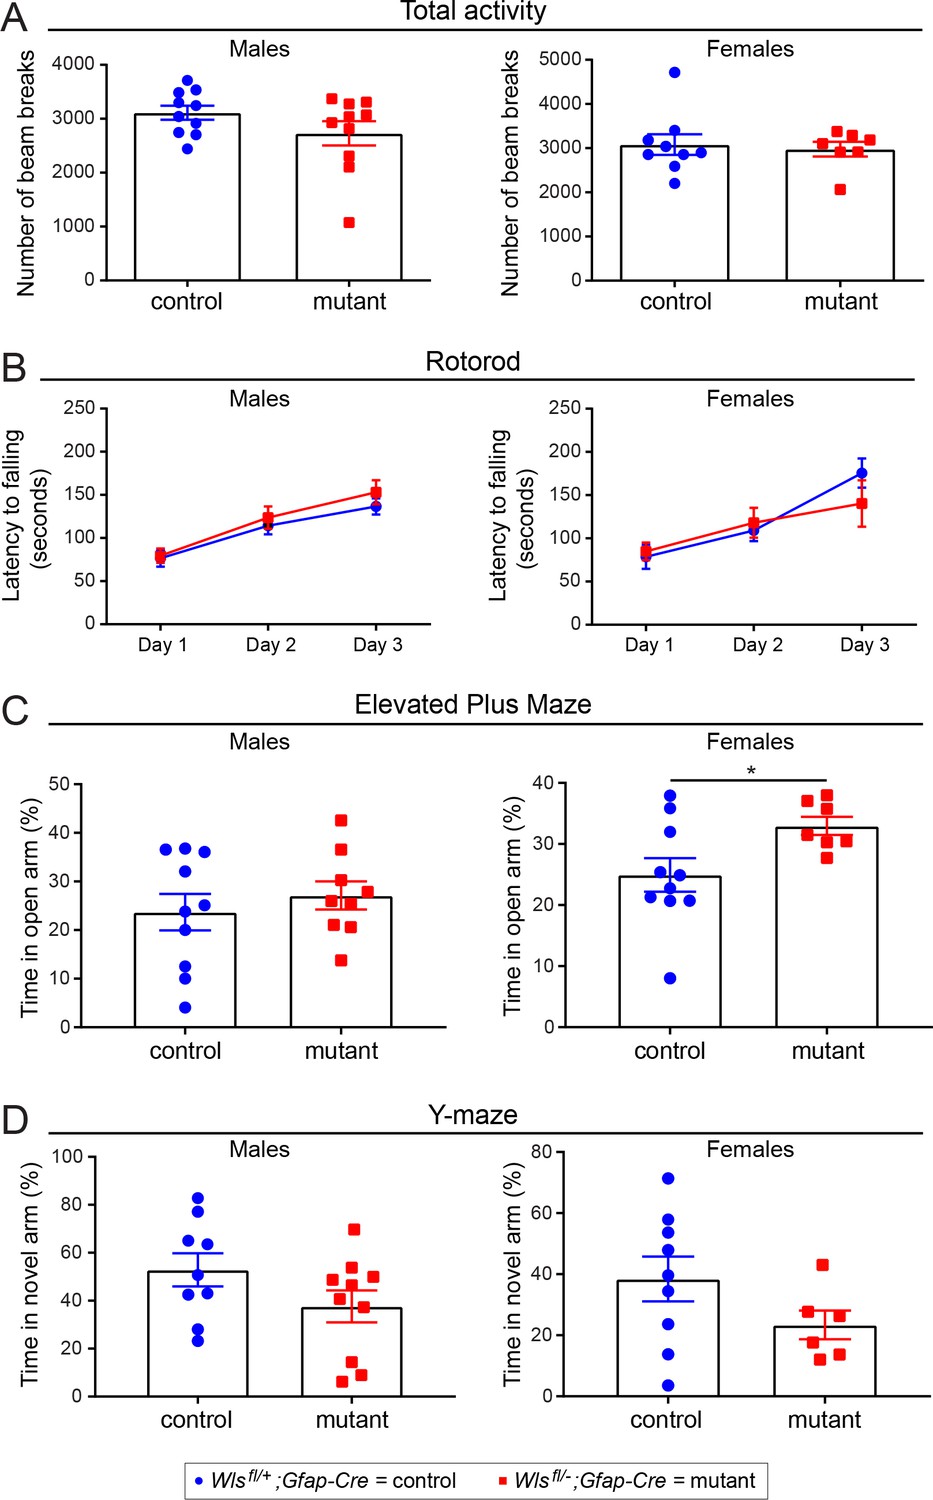
No sex differences between adult Wlsfl/+;Gfap-Cre and Wlsfl/-;Gfap-Cre mice in basic behavioral tasks.
The same data as shown in Figure 5—figure supplement 4 are shown here separated by sex. The graphs show mean +/- SEM. (A) Total activity. (B) Rotorod. (C) Elevated Plus Maze. (D) Y-maze. The graphs show mean +/- SEM.
Figure 5—figure supplement 2
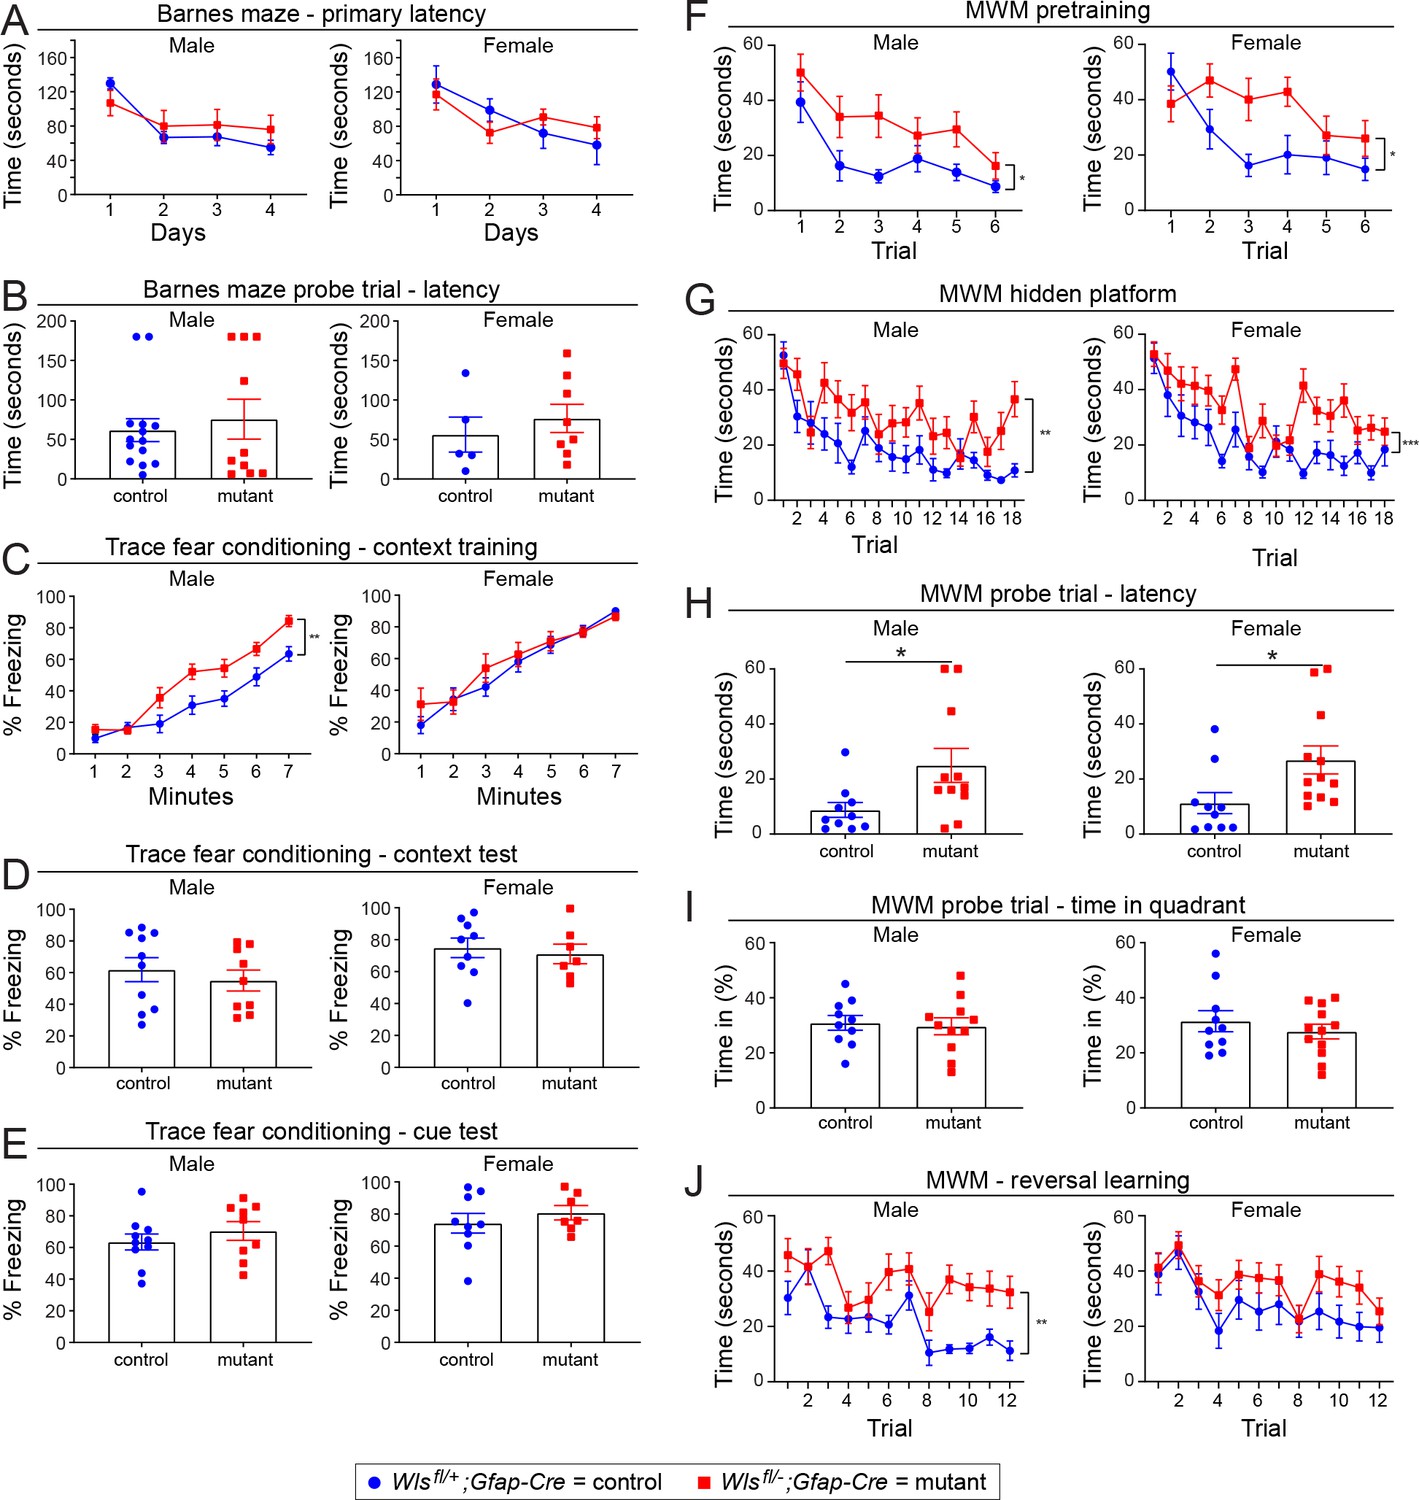
Minimal sex differences between adult Wlsfl/+;Gfap-Cre and Wlsfl/-;Gfap-Cre mice in the Barnes maze, trace fear conditioning, and Morris water maze.
The same data as shown in Figure 5 are shown here separated by sex. (A,B) The Barnes maze. (C-E) Trace fear conditioning. (F-J) The Morris water maze. The graphs show mean +/- SEM.
Figure 5—figure supplement 3
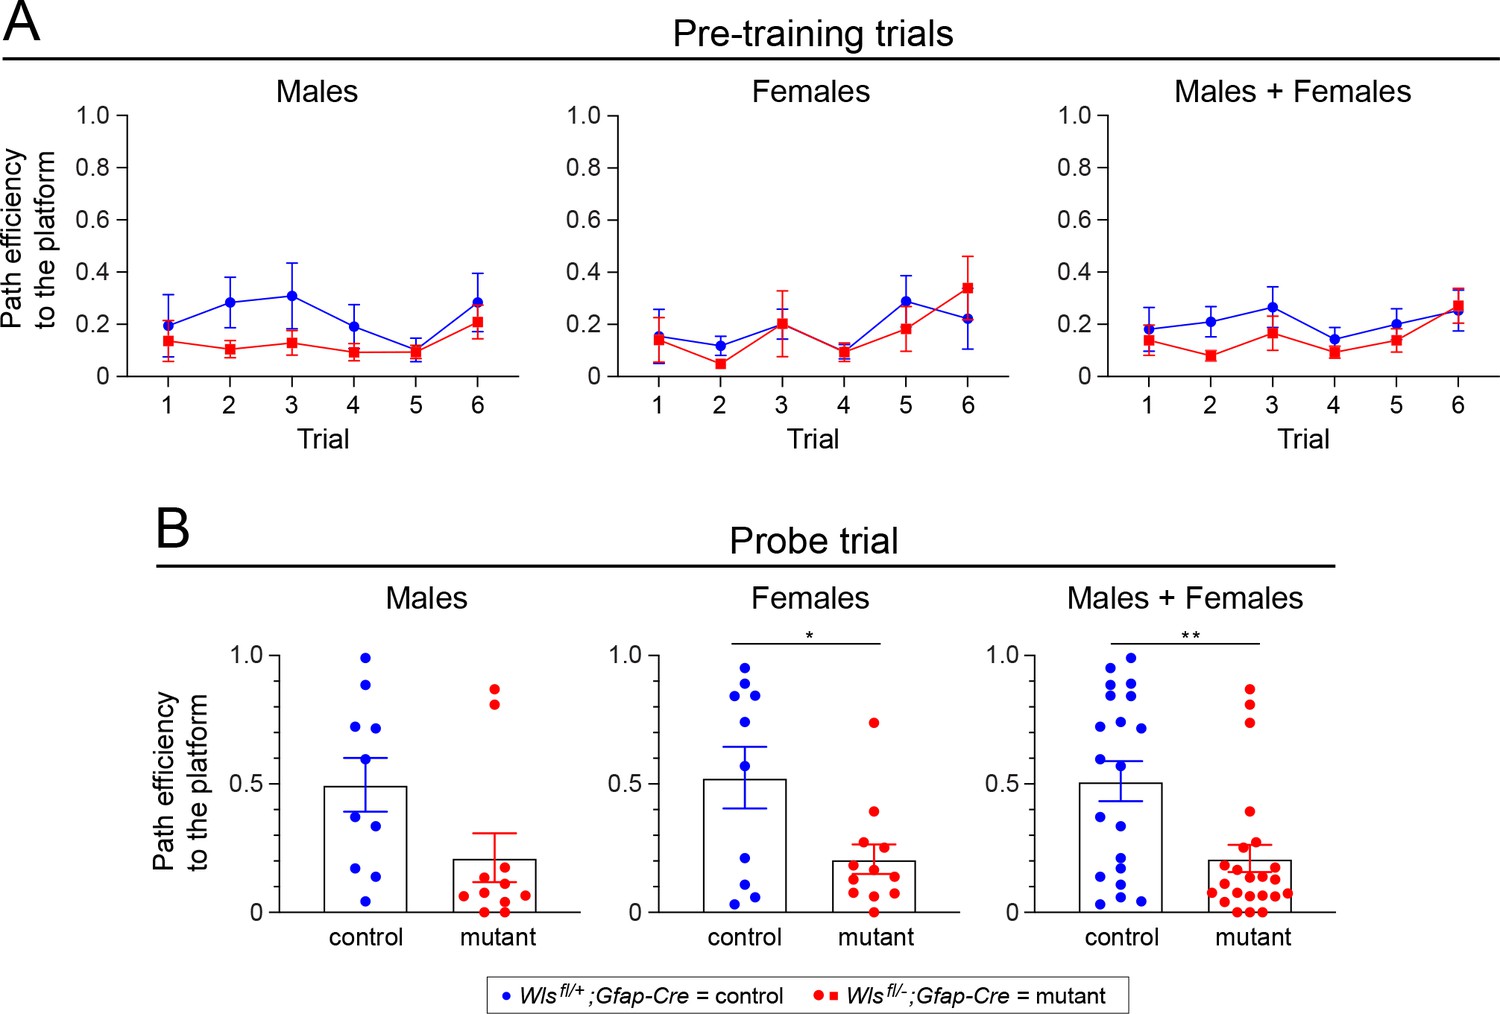
Adult Wlsfl/-;Gfap-Cre mice exhibit reduced path efficiency in both the pretraining trials and in the probe trial in the Morris water maze.
(A) Path efficiency in each of the six pretraining trials. (B) Path efficiency in the single probe trial. Sex differences are minimal. A description of the path efficiency calculation is presented in the ‘Morris water maze’ sub-section under ‘Behavioral testing: spatial cognition and memory’ in Materials and Methods. The graphs show mean +/- SEM.
Figure 5—figure supplement 4
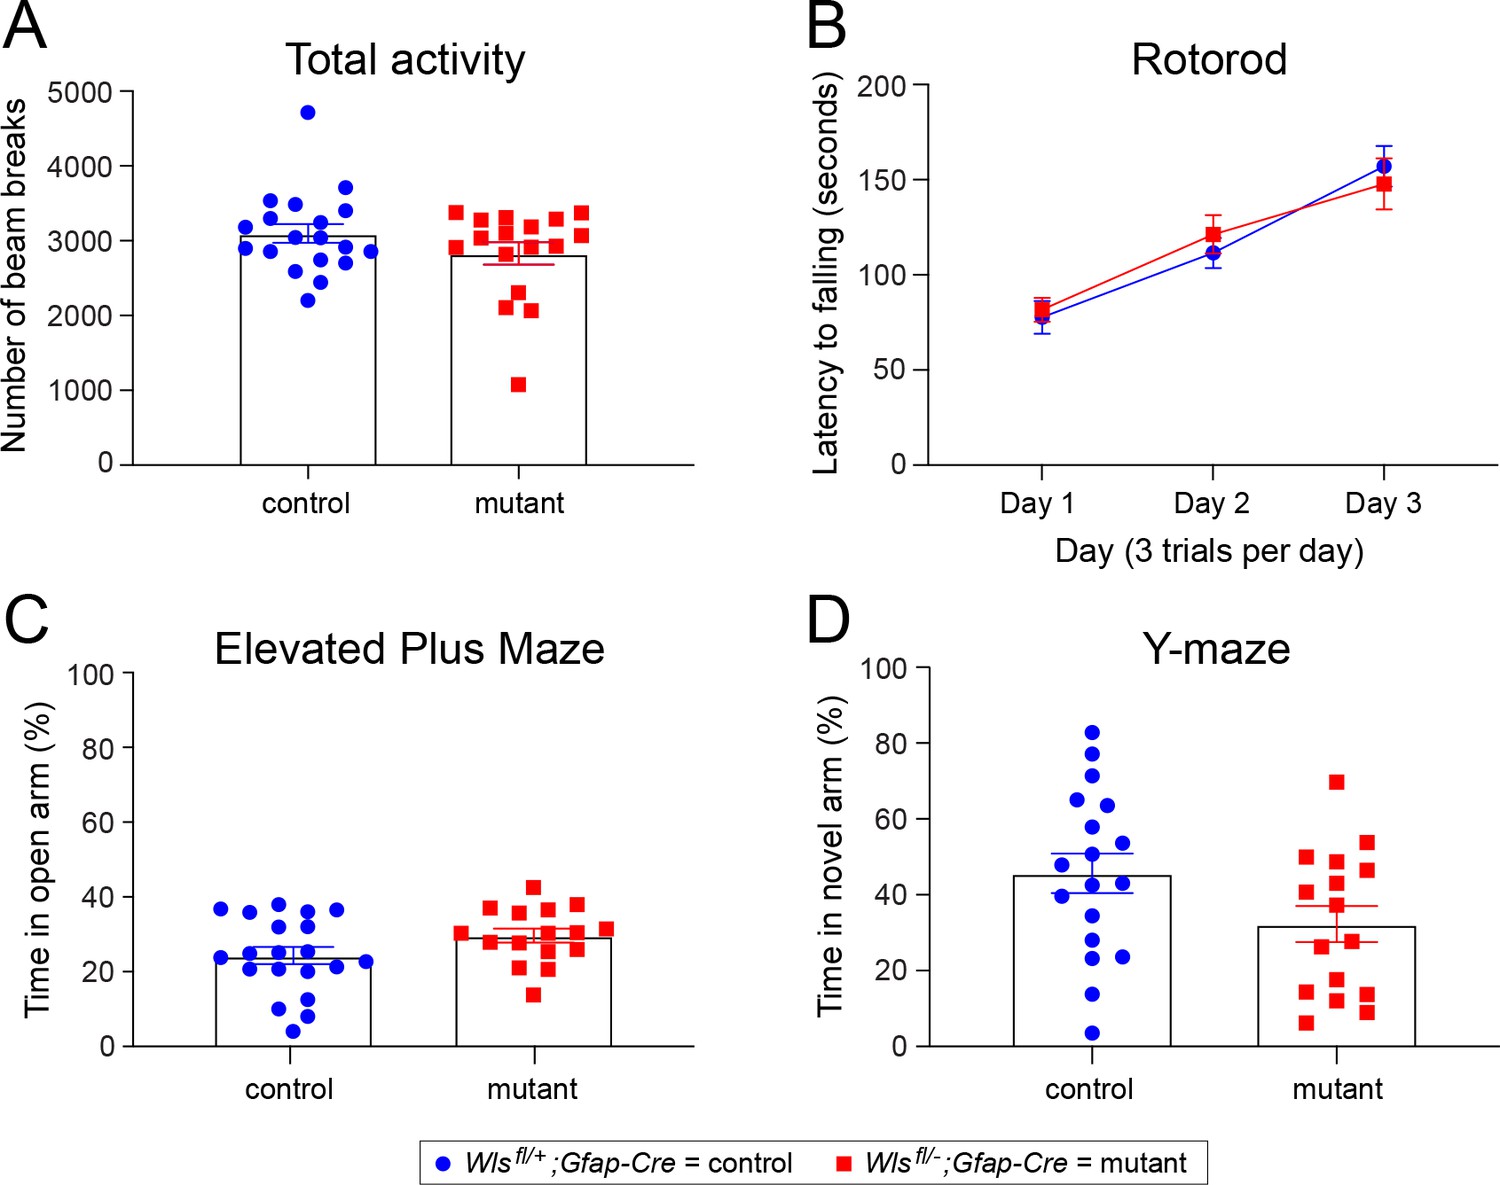
No difference between adult Wlsfl/+;Gfap-Cre and Wlsfl/-;Gfap-Cre mice in basic behavioral tasks.
Locomotor (total) activity, motor learning on a rotorod, anxiety-related behavior in the elevated plus maze, and spatial working memory in the Y-maze were measured in Wlsfl/+;Gfap-Cre and Wlsfl/-;Gfap-Cre mice. There was no effect of genotype on locomotor activity in an open field (A), latency to fall during the accelerated rotarod test (B), percent time spent in the open arms of the elevated plus maze (C) or percent time spent in the novel arm of the Y-maze (D). n = 17–19 mice per group. The graphs show mean +/- SEM.
Figure 6
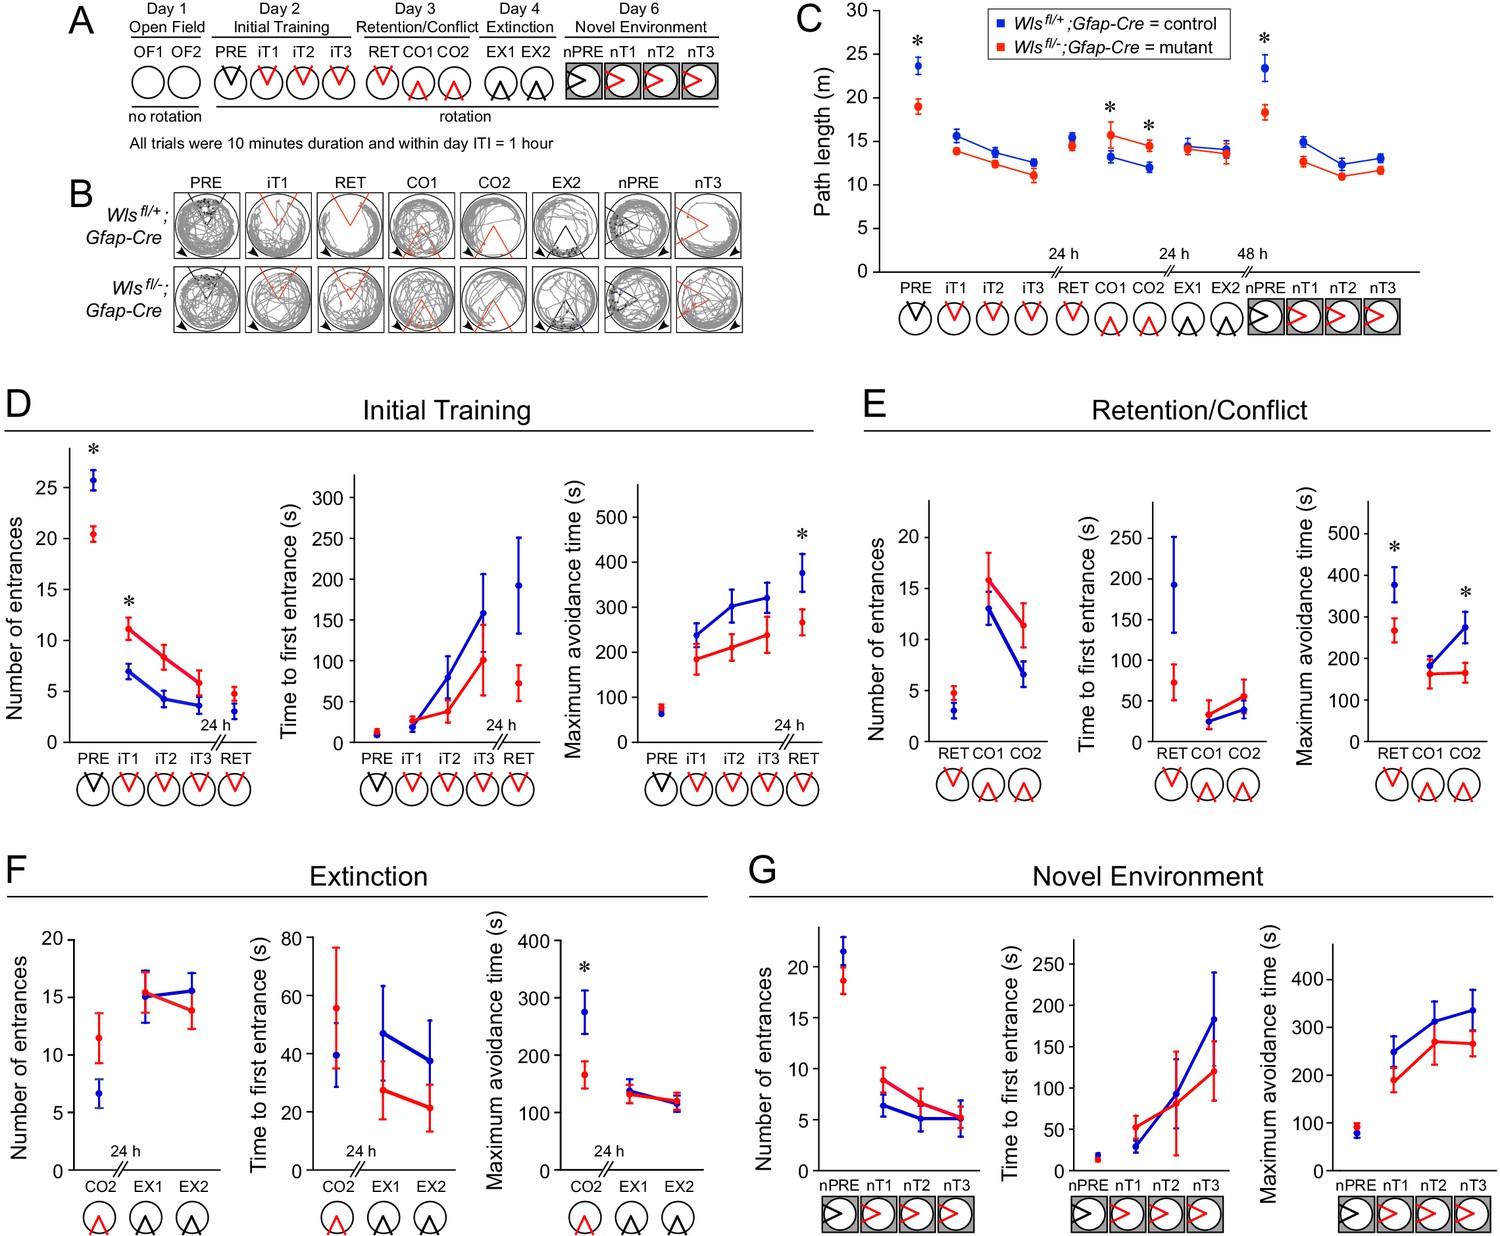
Wlsfl/-;Gfap-Cre mice exhibit mild defects in active avoidance learning tasks.
Fourteen Wlsfl/-;Gfap-Cre and fifteen Wlsfl/+;Gfap-Cre mice were tested. (A) Overview of the behavioral protocol for experiments on the rotating circular arena. A red 60° sector indicates the location of the shock zone. A black 60° sector indicates that the shock was turned off and entrances into this region were counted. The arena rotated at 1 rpm from day two onward. On day 6, the new arena was in a different location (indicated by the dark box). (B) Examples of active place avoidance behavior (shown by the mouse’s trajectory in the room-frame), documented across the rotating arena protocol. Arrowheads show the direction of 1 rpm rotation. A red sector indicates the location of the 60° active shock zone, and a black sector indicates the zone location when the shock was turned off. (C) Path length measured across the rotating arena protocol. (D) Initial active place avoidance learning. Left, number of entrances (errors). Center, time to first enter the shock zone. Right, maximum time the shock zone was avoided. By all three measures of place avoidance, Wlsfl/-;Gfap-Cre mice perform more poorly than the Wlsfl+-;Gfap-Cre littermates. (E) Conflict in active place avoidance learning. Left, center, and right are as described for (D). (F) Extinction of the conditioned place avoidance. Left, center, and right are as described for (D). The mice partially extinguished their previously learned avoidance. (G) Subsequent active place avoidance learning in a novel environment. Left, center, and right are as described for (D). Bars indicate the mean ± SEM; ∗ indicates p<0.05 for comparisons between genotypes.
Figure 7

Wlsfl/-;Gfap-Cre mice perform more poorly in the last trial in an alternating T-maze task.
Fourteen Wlsfl/-;Gfap-Cre and 15 Wlsfl/+;Gfap-Cre mice were tested in the alternating T-maze task. The graph shows mean +/- SEM.
Additional files
-
Supplementary file 1
Sampling parameters chosen for the optical fractionator probe for two hemispheres.
Mouse identification numbers are indicated beneath the genotype.
- https://cdn.elifesciences.org/articles/62766/elife-62766-supp1-v1.docx
-
Supplementary file 2
Area sampling outcomes of the optical fractionator probe for two hemispheres.
Mouse identification numbers and left hemisphere (LH) designation are indicated beneath the genotype.
- https://cdn.elifesciences.org/articles/62766/elife-62766-supp2-v1.docx
-
Supplementary file 3
Stereological analyses of complex spines in CA3.
Using an optical fractionator probe, complex spines were classified and counted in the left hemisphere of Wlsfl/+;Gfap-Cre and Wlsfl/-;Gfap-Cre mice. The table shows the number of counted spines and, in parentheses, stereologically estimated spines. Five distinct complex spine subtypes were classified: basic, big/prototypical, long, thin, and tall.
- https://cdn.elifesciences.org/articles/62766/elife-62766-supp3-v1.docx
-
Supplementary file 4
Baseline neurological tests and their outcomes.
- https://cdn.elifesciences.org/articles/62766/elife-62766-supp4-v1.docx
-
Transparent reporting form
- https://cdn.elifesciences.org/articles/62766/elife-62766-transrepform-v1.pdf
Download links
A two-part list of links to download the article, or parts of the article, in various formats.
Downloads (link to download the article as PDF)
Open citations (links to open the citations from this article in various online reference manager services)
Cite this article (links to download the citations from this article in formats compatible with various reference manager tools)
Developmental, cellular, and behavioral phenotypes in a mouse model of congenital hypoplasia of the dentate gyrus
eLife 9:e62766.
https://doi.org/10.7554/eLife.62766


