Selective dendritic localization of mRNA in Drosophila mushroom body output neurons
- Centre for Neural Circuits and Behaviour, University of Oxford, United Kingdom
- Delft Center for Systems and Control, Delft University of Technology, Netherlands
- Department of Biochemistry, University of Oxford, United Kingdom
- Department of Engineering Science, University of Oxford, United Kingdom
Figures
Figure 1
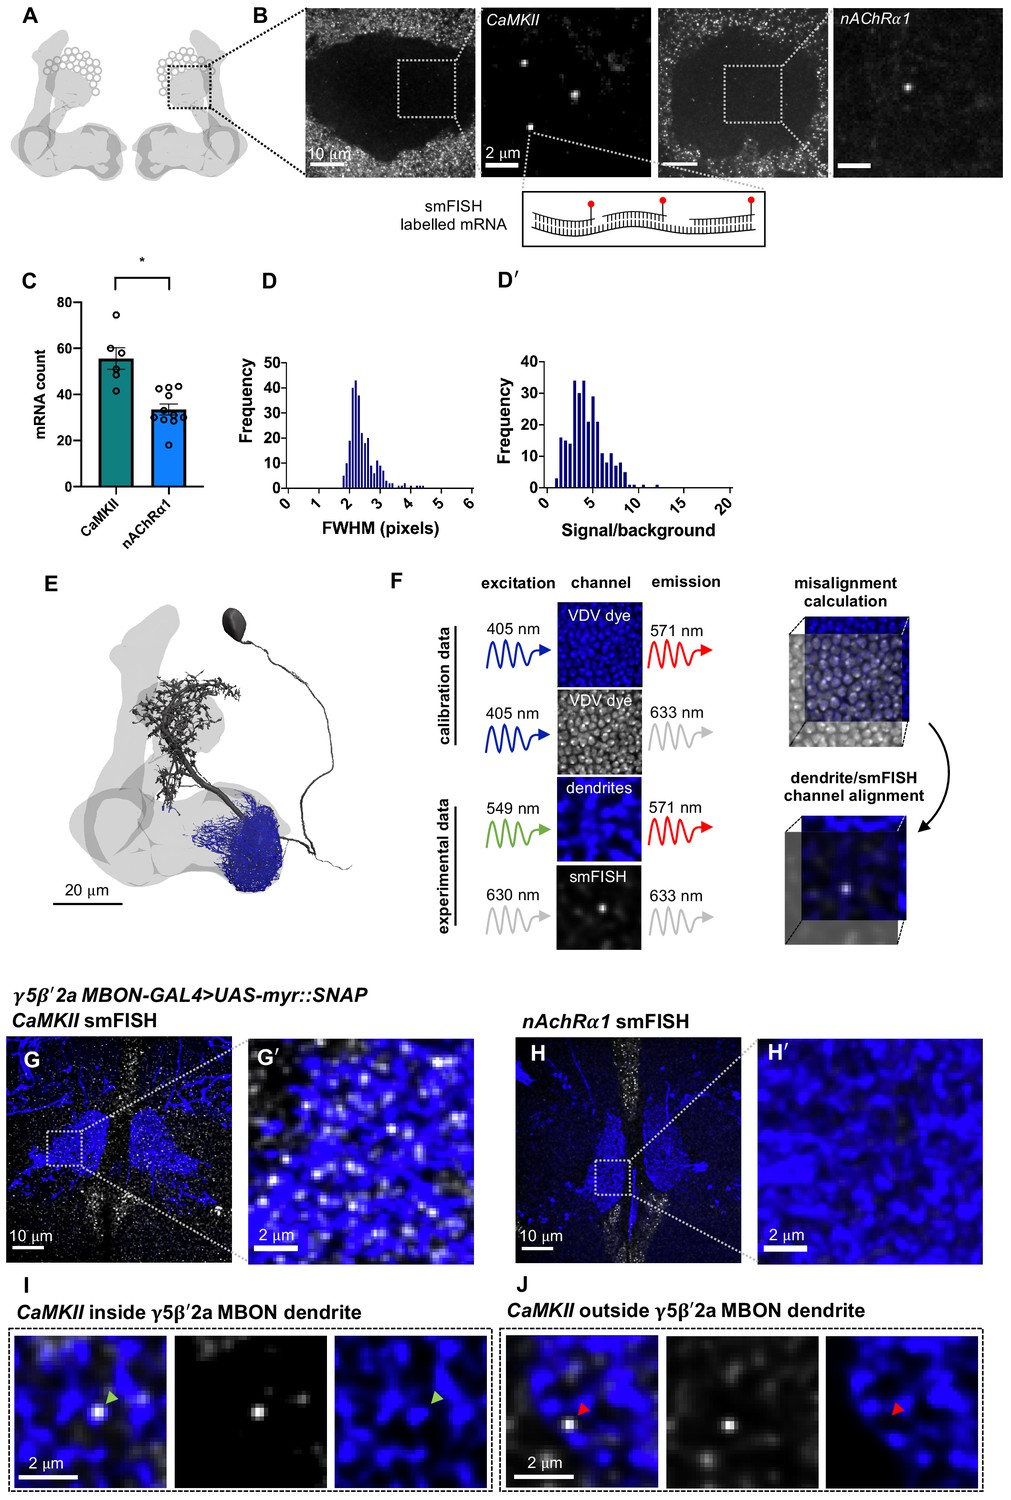
CaMKII and nAChR α1 mRNA visualized in the mushroom body (MB) calyx and γ5β'2a mushroom body output neuron (MBON) dendrites with single-molecule fluorescence in situ hybridization (smFISH).
(A) Schematic of Drosophila MB. smFISH signal was imaged in the calyx, indicated by the dashed box. (B) CaMKII and nAChRα1 mRNAs labeled with smFISH in the MB calyx. Images are maximum intensity projections of ten 0.2 µm z-sections. (C) More CaMKII mRNAs are detected in the MB calyx relative to nAChRα1 (unpaired t-test: p=0.0003, t = 4.727, df = 15). (D) smFISH spot size distribution (full width half maximum, bottom) in MB calyx. (D'). Unimodal smFISH spot intensity distribution (signal/background) indicates imaging at single-molecule resolution. (E) Reconstruction of a γ5β'2a MBON (black) showing the dendritic field (blue) and MB (light gray). The projection to the contralateral MB is truncated. (F) Alignment of dendrite and smFISH imaging channels using co-labeling with dsDNA Vybrant DyeCycle Violet (VDV) dye. VDV is excited with 405 nm and emission is collected in the dendritic and smFISH imaging channels, which were then aligned in x, y, and z planes. (G, G') CaMKII smFISH within the γ5β'2a MBON dendrite co-labeled with R66C08-GAL4-driven UAS-myr::SNAP and visualized with JF547SNAP dye. Images are maximum intensity projections of ten 0.2 μm z-sections. (H, H') nAchRα1 smFISH in γ5β'2aMBONs. Images are maximum intensity projections of ten 0.2 μm z-sections. (I) Single CaMKII smFISH puncta localized within a γ5β'2a MBON dendrite (green arrowhead). Images are single z-sections of 0.2 μm. (J) Single CaMKII smFISH puncta localized outside of the γ5β'2a MBON dendrite (red arrowhead). Images are single z-sections of 0.2 μm.
Figure 2 with 1 supplement

Differential localization of mRNAs in γ5β'2a and γ1pedc>α/β mushroom body output neuron (MBON) dendrites.
(A, A'). CaMKII::YFP mRNA visualized in γ5β'2a MBON dendrites using YFP single-molecule fluorescence in situ hybridization (smFISH) probes. The γ5β'2a MBON is labeled by R66C08-GAL4-driven UAS-myr::SNAP and visualized with JF547SNAP dye. Images are maximum intensity projections of ten 0.2 µm z-sections. (B, B'). YFP smFISH signal in a γ5β'2a MBON in a negative control fly. Images are maximum intensity projections of ten 0.2 µm z-sections. (C) The CaMKII::YFP allele is heterozygous, resulting in detection of half as many CaMKII mRNAs in γ5β'2a MBONs using YFP probes relative to that detected with CaMKII gene-specific probes. (D) Signal/background intensity distribution of YFP probe signals in CaMKII::YFP brains relative to control brains with no threshold on signal detection. The signal/background intensity threshold for quantitative analyses (dotted red line) resulted in a false discovery rate of ≤14% (indicated by the overlap of the histograms on the right side of the dotted red line) (see also Figure 2—figure supplement 1). (E) Reconstruction of a γ5β'2a MBON. Individual postsynapses (turquoise spheres) and presynapses (red spheres) are labeled. The projection to the contralateral mushroom body (MB) is truncated. (F) Reconstruction of a γ1pedc>α/β MBON. Individual postsynapses (turquoise spheres) and presynapses (red spheres) are labeled. The projection to the contralateral MB is truncated. (G) Quantification of mRNA localization in γ5β'2a and γ1pedc>α/β MBON dendrites with YFP smFISH probes and gene-specific nicotinic acetylcholine receptor (nAChR) subunit smFISH probes. More PKA-R2 transcripts localize within the dendrites of γ5β'2a MBONs relative to γ1pedc>α/β MBONs (unpaired t-test: p=0.004, t = 5.069, df = 11). Ten-m mRNAs did not localize to either MBON dendritic field. CaMKII mRNAs were detected in equal abundance. nAchRα1 mRNAs did not localize to the dendrites of either γ5β'2a or γ1pedc>α/β MBONs. More nAchRα5 (unpaired t-test: p=0.004, t = 3.368, df = 15) and nAchRα6 (unpaired t-test: p=0.046, t = 2.274, df = 10) mRNAs localized to γ5β'2a MBON dendrites relative to γ1pedc>α/β MBON dendrites. (H) Quantification of mRNA in γ5β'2a and γ1pedc>α/β MBON somata with YFP smFISH probes and gene-specific nAChR subunit smFISH probes. More CaMKII transcripts were present within γ5β'2a MBON somata relative to γ1pedc>α/β MBON somata (unpaired t-test: p=0.0061, t = 3.103, df = 18). More Ten-m (Mann–Whitney test: p=0.0093, Mann–Whitney U = 120) and nAchRα1 (unpaired t-test: p=0.0359, t = 2.250, df = 20) transcripts were detected in γ1pedc>α/β MBON somata relative to γ5β'2a MBON somata. (I) Example smFISH images of mRNAs localized in γ5β'2a (R66C08-GAL4>UAS-myr::SNAP) and γ1pedc>α/β MBON (MB112C-GAL4>UAS-myr::SNAP) dendrites. Images are maximum intensity projections of ten 0.2 μm z-sections. Asterisks denote significant difference (p<0.05). Data are means ± standard error of mean. Individual data points are displayed.
Figure 2—figure supplement 1
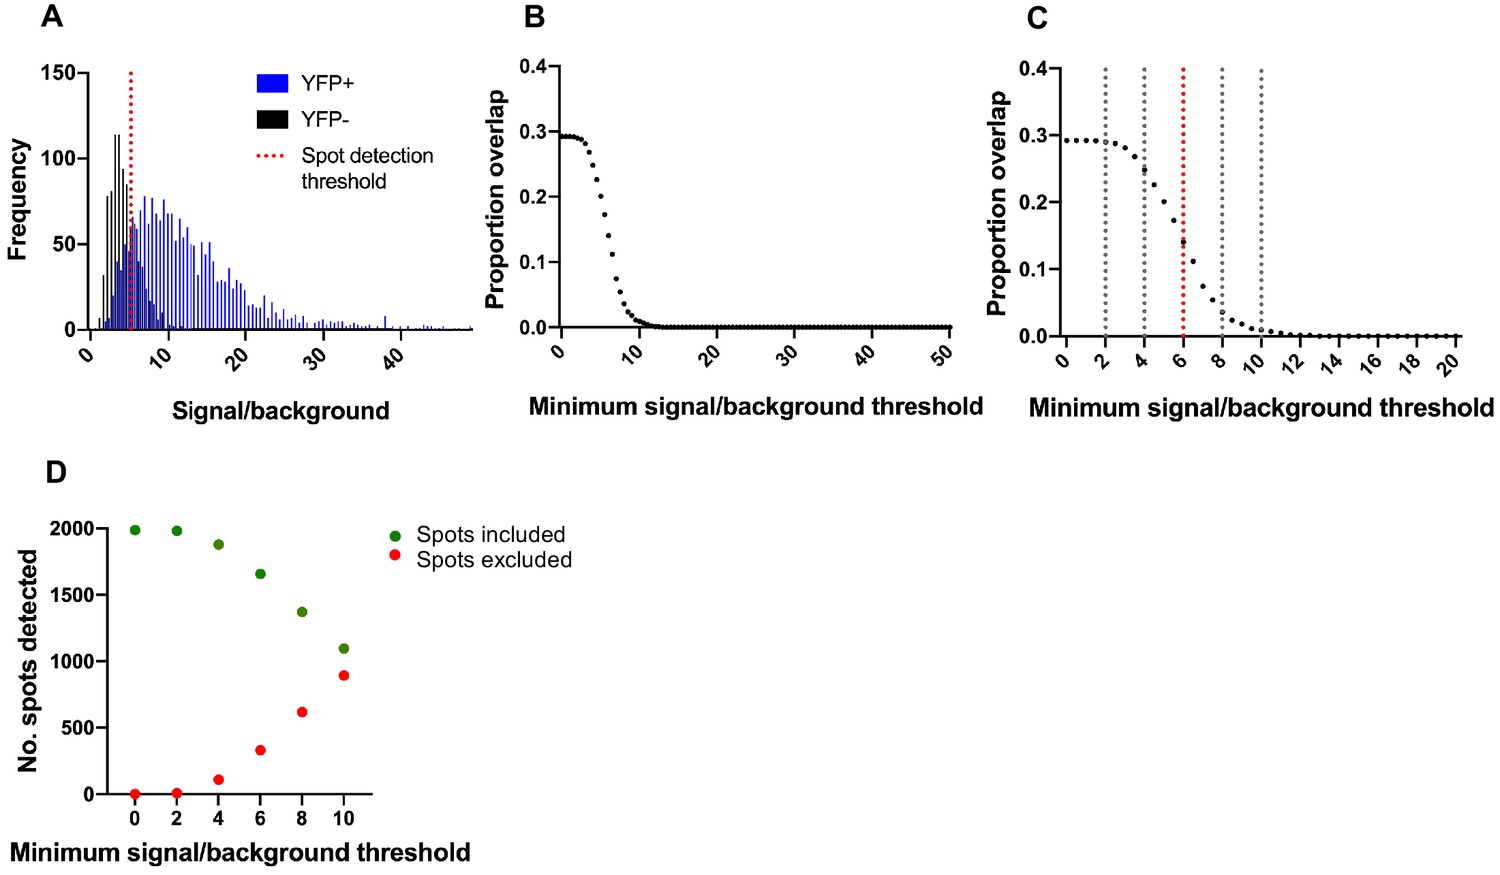
Effect of spot detection threshold on false-positive detections.
(A) Signal/background intensity distribution of YFP probe signals in CaMKII::YFP brains relative to control brains with no threshold on signal detection, as in Figure 2D. (B) Proportion of overlap between YFP probe signals in CaMKII::YFP brains relative to control brains with variable spot detection threshold. Overlap, and hence false detection rate, decreases with increasing threshold on signal/background. (C) Magnification of (B). Overlap when minimal signal/background threshold is 0 = 0.29, 2 = 0.29, 4 = 0.25, 6 = 0.14, 8 = 0.04, and 10 = 0.01. The signal/background spot detection threshold in our analysis was 6, resulting in a maximum false detection rate of <14%. (D) Number of spot detections included and excluded with variable spot detection threshold. Higher signal/background threshold results in more spots being discarded and fewer being counted.
Figure 3 with 2 supplements
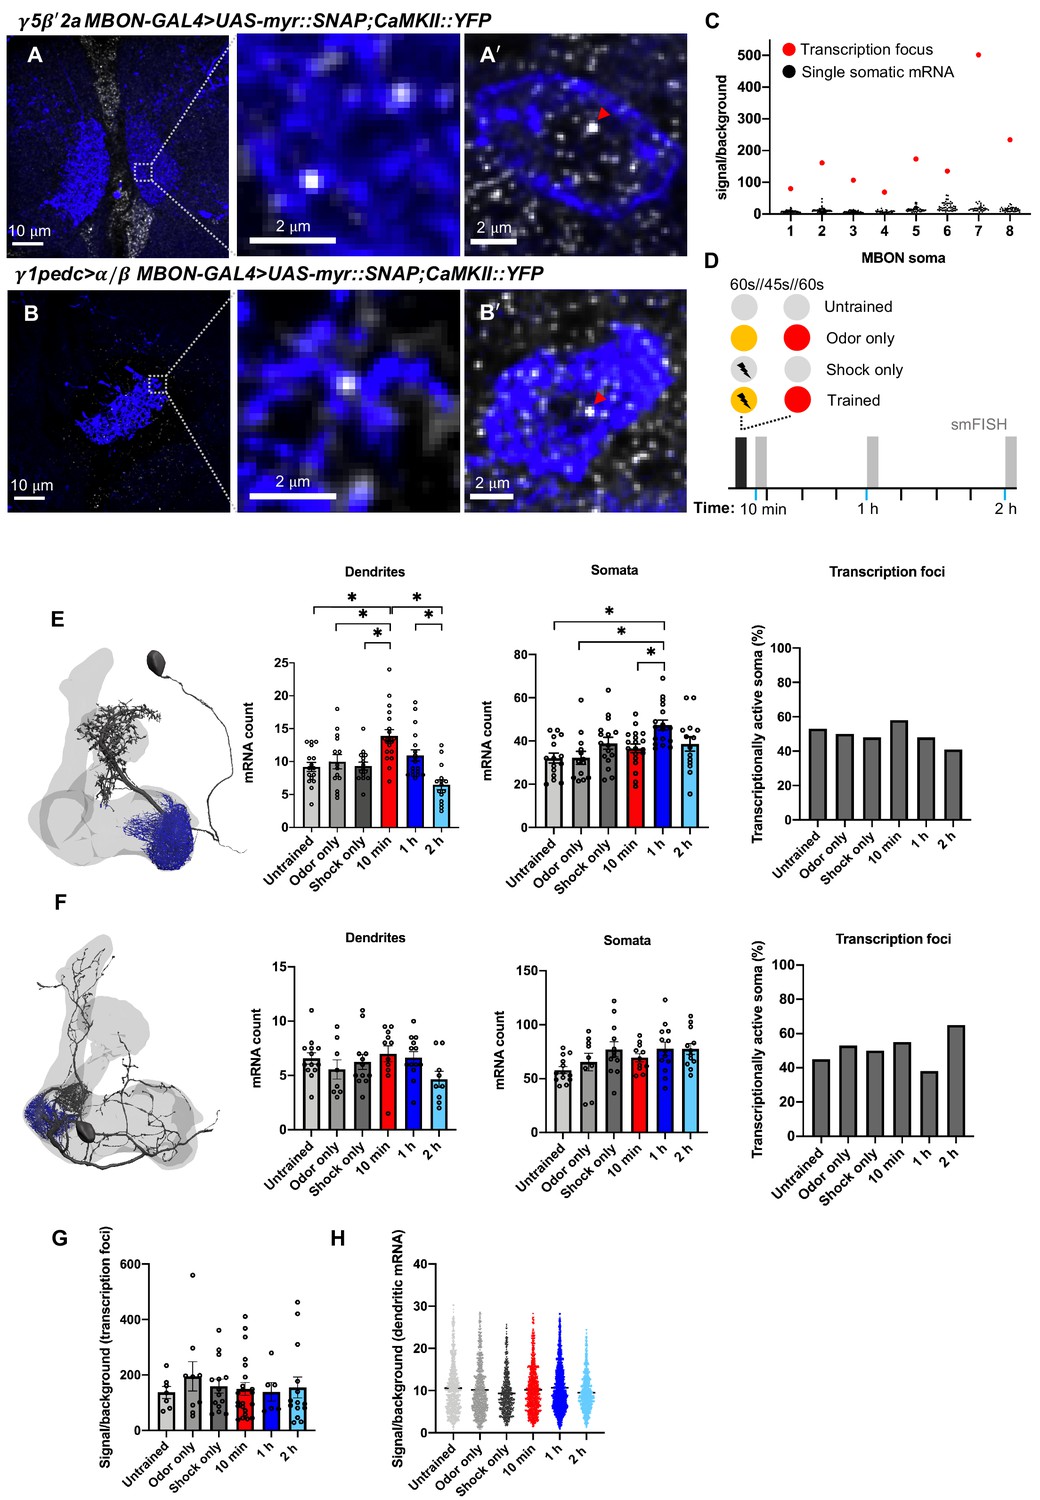
Learning alters CaMKII mRNA abundance in the γ5β'2a mushroom body output neurons (MBONs).
(A, A'). CaMKII::YFP single-molecule fluorescence in situ hybridization (smFISH) in γ5β'2a MBON dendrites and soma (R66C08-GAL4>UAS-myr::SNAP). Images are maximum intensity projections of ten 0.2 μm z-sections. (B, B'). CaMKII::YFP smFISH in γ1pedc>α/β MBON dendrites and soma (MB112C-GAL4>UAS-myr::SNAP). Nuclear transcription foci are indicated (red arrowheads). Images are maximum intensity projections of ten 0.2 µm z-sections. (C) CaMKII::YFP smFISH signal/background in transcriptionally active γ5β'2a somata. Transcription foci are readily distinguished as the brightest puncta in the soma/nucleus (red data points). Note that only one transcription focus can be visualized per cell since the CaMKII::YFP allele is heterozygous. (D) Schematic of aversive training and control protocols followed by smFISH. The yellow and red circles represent the two odors. (E) CaMKII::YFP mRNA numbers in γ5β'2a MBON dendrites increase 10 min after odor–shock pairing, relative to control groups (one-way ANOVA: untrained-10 min p=0.001; odor only-10 min p=0.016; shock only-10 min p=0.002), and decrease to baseline by 2 hr (one-way ANOVA: 10 min-2 h p<0.001; 1–2 h p=0.004). CaMKII::YFP mRNA numbers in γ5β'2a MBON somata increase 1 hr after odor–shock pairing, relative to untrained (one-way ANOVA: p=0.001), odor only (one-way ANOVA: p=0.002), and 10 min post training (one-way ANOVA: p=0.025). The proportion of transcriptionally active γ5β'2a MBON somata is unchanged (X2=2.064, df = 5, p=0.840). (F) CaMKII::YFP mRNA numbers are not changed by aversive odor–shock pairing in γ1pedc>α/β MBON dendrites (one-way ANOVA: f = 1.473, p=0.212), their somata (one-way ANOVA: f = 2.183, p=0.067), and there is no detected change in CaMKII::YFP transcription (X2=3.723, df = 5, p=0.59). (G) Signal/background ratio of CaMKII::YFP transcription foci in γ5β'2a MBON somata. (H) Signal/background ratio of CaMKII::YFP mRNA localized in γ5β'2a MBON dendrites. Asterisks denote significant difference (p<0.05). Data are means ± standard error of mean. Individual data points are displayed.
Figure 3—figure supplement 1
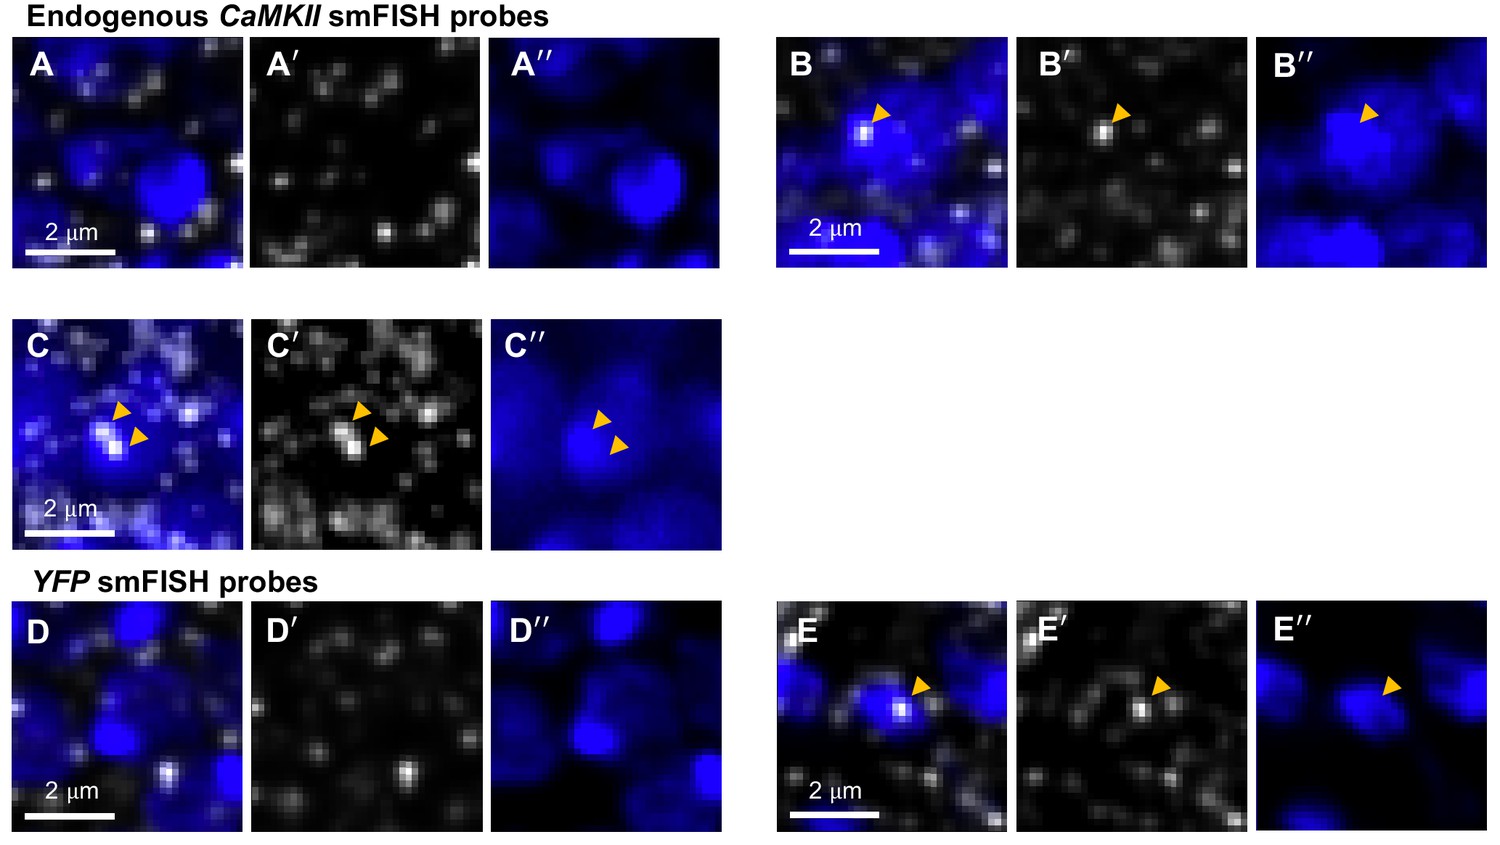
Single-molecule fluorescence in situ hybridization (smFISH) labels different numbers of active CaMKII loci in homozygous and heterozygous flies.
(A–A"). Transcriptionally inactive nucleus visualized with endogenous CaMKII smFISH probes. (B–B"). Monoallelic transcription visualized with endogenous CaMKII smFISH probes. (C–C"). Biallelic transcription visualized with endogenous CaMKII smFISH probes. (D–D"). Transcriptionally inactive nucleus visualized with YFP smFISH probes in a heterozygous CaMKII::YFP brain. (E–E"). Only monoallelic transcription can be visualized with YFP smFISH probes in a heterozygous CaMKII::YFP brain. (A–E) Merge. (A'-C'). Endogenous CaMKII smFISH. (E'-F'). CaMKII::YFP smFISH. (A"–E"). Nuclei labeled with dsDNA binding Vybrant DyeCycle Violet Stain.
Figure 3—figure supplement 2
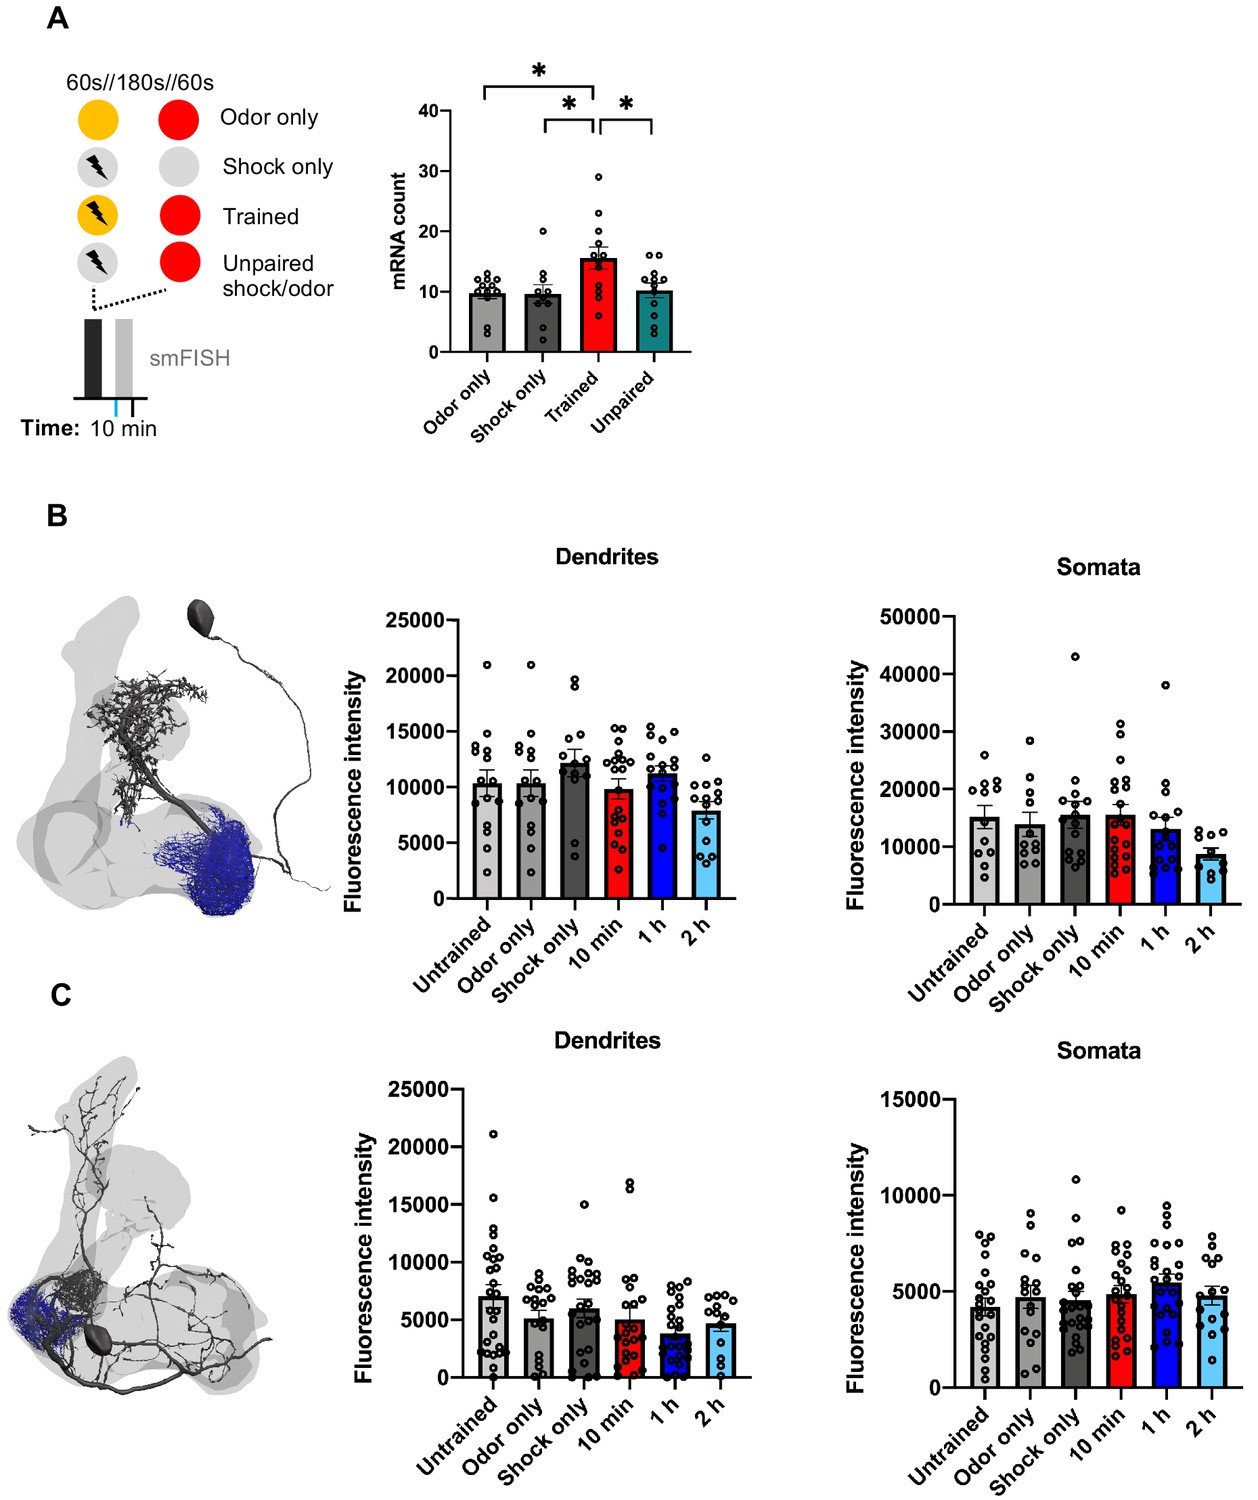
Further unpaired control and quantification of CaMKII::YFP after learning.
(A) Schematic of training protocols. The yellow and red circles represent the two odors. These experiments increased the interval between the two parts of the session from 45 to 180 s to avoid possible trace conditioning in the ‘unpaired’ group. CaMKII mRNA abundance in γ5β'2a mushroom body output neuron (MBON) dendrites increased 10 min after odor–shock pairing relative to the odor only, shock only, and unpaired controls (one-way ANOVA: trained-odor only p=0.0249; trained-shock only p=0.0293; trained-unpaired p=0.0463). (B) CaMKII::YFP fluorescence intensity (adu/voxel) within γ5β'2a MBON dendrites and somata. (C) CaMKII::YFP fluorescence intensity (adu/voxel) within γ1pedc>α/β MBON dendrites and somata. No significant differences between trained and control groups were observed (one-way ANOVA/Kruskal–Wallis p>0.05).
Tables
Key resources table
| Reagent type (species) or resource | Designation | Source or reference | Identifiers | Additional information |
|---|---|---|---|---|
| Gene (Drosophila melanogaster) | CaMKII | NCBI | Gene ID: 43828 | |
| Gene (Drosophila melanogaster) | PKA-R2 | NCBI | Gene ID: 36041 | |
| Gene (Drosophila melanogaster) | Ten-m | NCBI | Gene ID: 40464 | |
| Gene (Drosophila melanogaster) | nAChRα1 | NCBI | Gene ID: 42918 | |
| Gene (Drosophila melanogaster) | nAChRα5 | NCBI | Gene ID: 34826 | |
| Gene (Drosophila melanogaster) | nAChRα6 | NCBI | Gene ID: 34304 | |
| Genetic reagent (Drosophila melanogaster) | R66C08-GAL4 | Bloomington Drosophila Stock Center (Owald et al., 2015) | RRID:BDSC_49412 | |
| Genetic reagent (Drosophila melanogaster) | MB112c-GAL4 | Bloomington Drosophila Stock Center (Perisse et al., 2016) | RRID:BDSC_68263 | |
| Genetic reagent (Drosophila melanogaster) | UAS-myr::SNAPf | Bloomington Drosophila Stock Center | RRID:BDSC_58376 | |
| Genetic reagent (Drosophila melanogaster) | CaMKII::YFP | Kyoto Stock Centre (Lowe et al., 2014) | RRID:DGGR_115127 | |
| Genetic reagent (Drosophila melanogaster) | PKA-R2::YFP | Kyoto Stock Centre (Lowe et al., 2014) | RRID:DGGR_115174 | |
| Genetic reagent (Drosophila melanogaster) | Ten-m::YFP | Kyoto Stock Centre (Lowe et al., 2014) | RRID:DGGR_115131 | |
| Chemical compound | 20% v/v paraformaldehyde | Thermo Fisher Scientific | Cat#15713S | |
| Chemical compound | RNase-free 10× PBS | Thermo Fisher Scientific | Cat#AM9625 | |
| Chemical compound | Triton X-100 | Sigma-Aldrich | Cat#T8787 | |
| Chemical compound | 20× RNase-free SSC | Thermo Fisher Scientific | Cat#AM9763 | |
| Chemical compound | Deionized formamide | Thermo Fisher Scientific | Cat#AM9342 | |
| Chemical compound | 50% dextran sulphate | Millipore | Cat#S4030 | |
| Chemical compound | Vybrant DyeCycle Violet Stain | Thermo Fisher Scientific | Cat#V35003 | |
| Chemical compound | Vectashield anti-fade mounting medium | Vector Laboratories | Cat#H-1000-10 | |
| Chemical compound | JF549-SNAPTag | Grimm et al., 2015 | ||
| Chemical compound | Mineral oil | Sigma-Aldrich | Cat#M5904 | |
| Chemical compound | 4-Methocyclohexanol (98%) | Sigma-Aldrich | Cat#218405 | |
| Chemical compound | 3-Octanol (99%) | Sigma-Aldrich | Cat#153095 | |
| Software, algorithm | FIJI | NIH (Schindelin et al., 2012) | http://fiji.sc/ | |
| Software, algorithm | MATLAB R2019b | The MathWorks, Natick, MA | https://www.mathworks.com/products/matlab.html | |
| Software, algorithm | GraphPad Prism 8 | GraphPad Software, La Jolla, CA | https://www.graphpad.com/scientific-software/prism/ | |
| Software, algorithm | Drosophila brain smFISH analysis | This paper (Mitchell, 2021) | see Data availability section | |
| Software, algorithm | Blender | Blender Foundation, Amsterdam | https://www.blender.org | |
| Software, algorithm | NAVis 0.2.0 | Bates et al., 2020b | https://pypi.org/project/navis/ |
Additional files
-
Supplementary file 1
Oligonucleotide sequences of single-molecule fluorescence in situ hybridization (smFISH) probe sets.
- https://cdn.elifesciences.org/articles/62770/elife-62770-supp1-v3.xlsx
-
Transparent reporting form
- https://cdn.elifesciences.org/articles/62770/elife-62770-transrepform-v3.docx
Download links
A two-part list of links to download the article, or parts of the article, in various formats.
Downloads (link to download the article as PDF)
Open citations (links to open the citations from this article in various online reference manager services)
Cite this article (links to download the citations from this article in formats compatible with various reference manager tools)
Selective dendritic localization of mRNA in Drosophila mushroom body output neurons
eLife 10:e62770.
https://doi.org/10.7554/eLife.62770


