NHR-49/PPAR-α and HLH-30/TFEB cooperate for C. elegans host defense via a flavin-containing monooxygenase
- Department of Microbiology and Physiological Systems, UMass Medical School, United States
- Department of Medical Genetics, University of British Columbia, Canada
- Department of Pediatrics, University of Pittsburgh School of Medicine, United States
- Department of Developmental Biology, University of Pittsburgh School of Medicine, United States
- Department of Cell Biology, University of Pittsburgh School of Medicine, United States
- Department of Physiology, University of Pittsburgh School of Medicine, United States
Figures
Figure 1 with 1 supplement
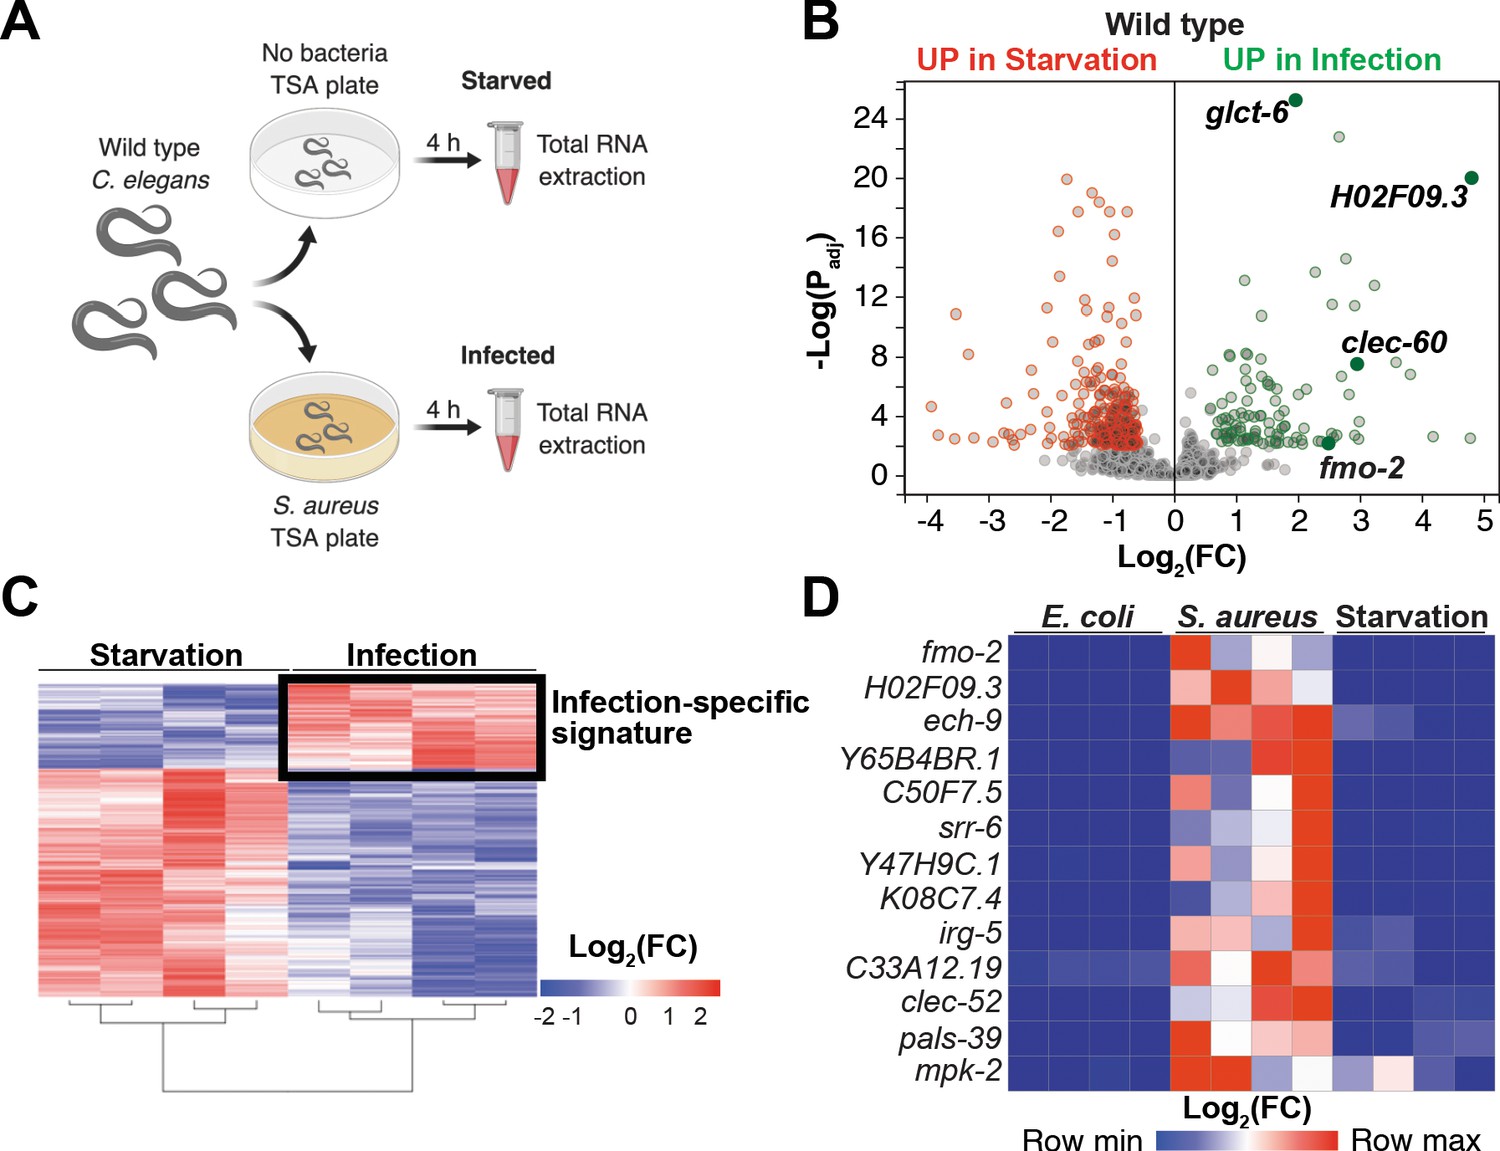
Starvation and S. aureus infection trigger distinct transcriptional responses.
(A) Schematic overview of experimental approach for RNA-seq conditions. Synchronized young adults were subjected to either starvation or infection for 4 hr before RNA extraction. (B) Volcano plot of differentially expressed genes (Padj ≤ 0.01). Genes that were induced in each condition relative to the other are indicated in red (for starvation) and green (for infection). FC, fold change. Padj, adjusted p value. (C) Heat map of differentially expressed genes [Log2(FC)] comparing infection with S. aureus SH1000 to starvation by RNA-seq. The boxed area represents the designated infection-specific expression signature. (D) Heat map of a set of 13 genes most highly induced by S. aureus SH1000 compared to starvation, whose relative transcript levels were measured by RT-qPCR and plotted as row-normalized log2(relative expression), or -ΔCt. Conditions include nonpathogenic E. coli, S. aureus (4 hr), and starvation (4 hr). Columns represent independent biological replicates.
Figure 1—figure supplement 1
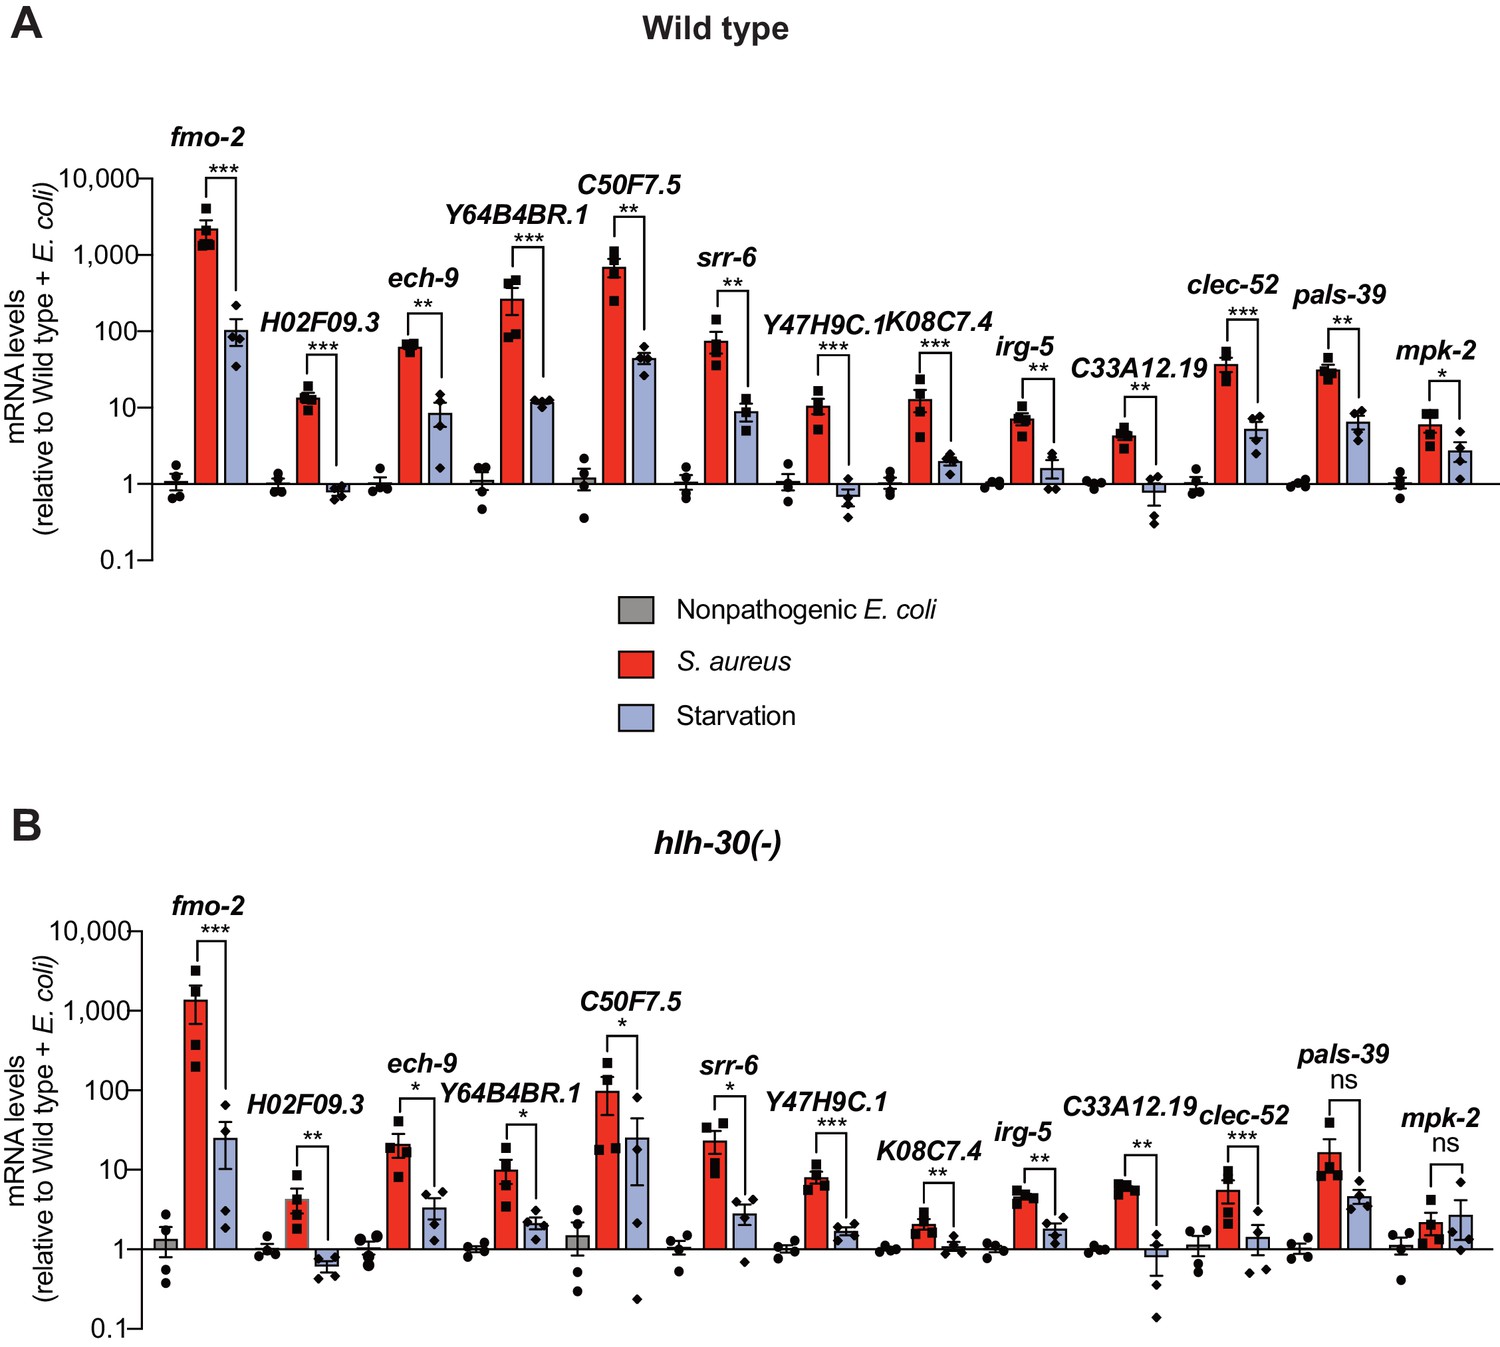
Expression analysis of 13 most highly induced genes.
(A–B) Relative transcript expression of top most highly induced 13 genes from RNA-seq, measured by RT-qPCR, in wild type and hlh-30(-) animals that were fed nonpathogenic E. coli, infected with S. aureus, or starved for 4 hr. Data are normalized to Wild type + E. coli and represent mean ± S.E.M. of three to four biological replicates. *p≤0.05, **p≤0.01, ***p≤0.001, ns = not significant (unpaired two-tailed t test).
-
Figure 1—figure supplement 1—source data 1
mRNA levels of 13 highly induced genes in wild type animals fed nonpathogenic E. coli, infected with S. aureus, or starved.
- https://cdn.elifesciences.org/articles/62775/elife-62775-fig1-figsupp1-data1-v3.xlsx
-
Figure 1—figure supplement 1—source data 2
mRNA levels of 13 highly induced genes in hlh-30(-) mutant animals fed nonpathogenic E. coli, infected with S. aureus, or starved.
- https://cdn.elifesciences.org/articles/62775/elife-62775-fig1-figsupp1-data2-v3.xlsx
Figure 2
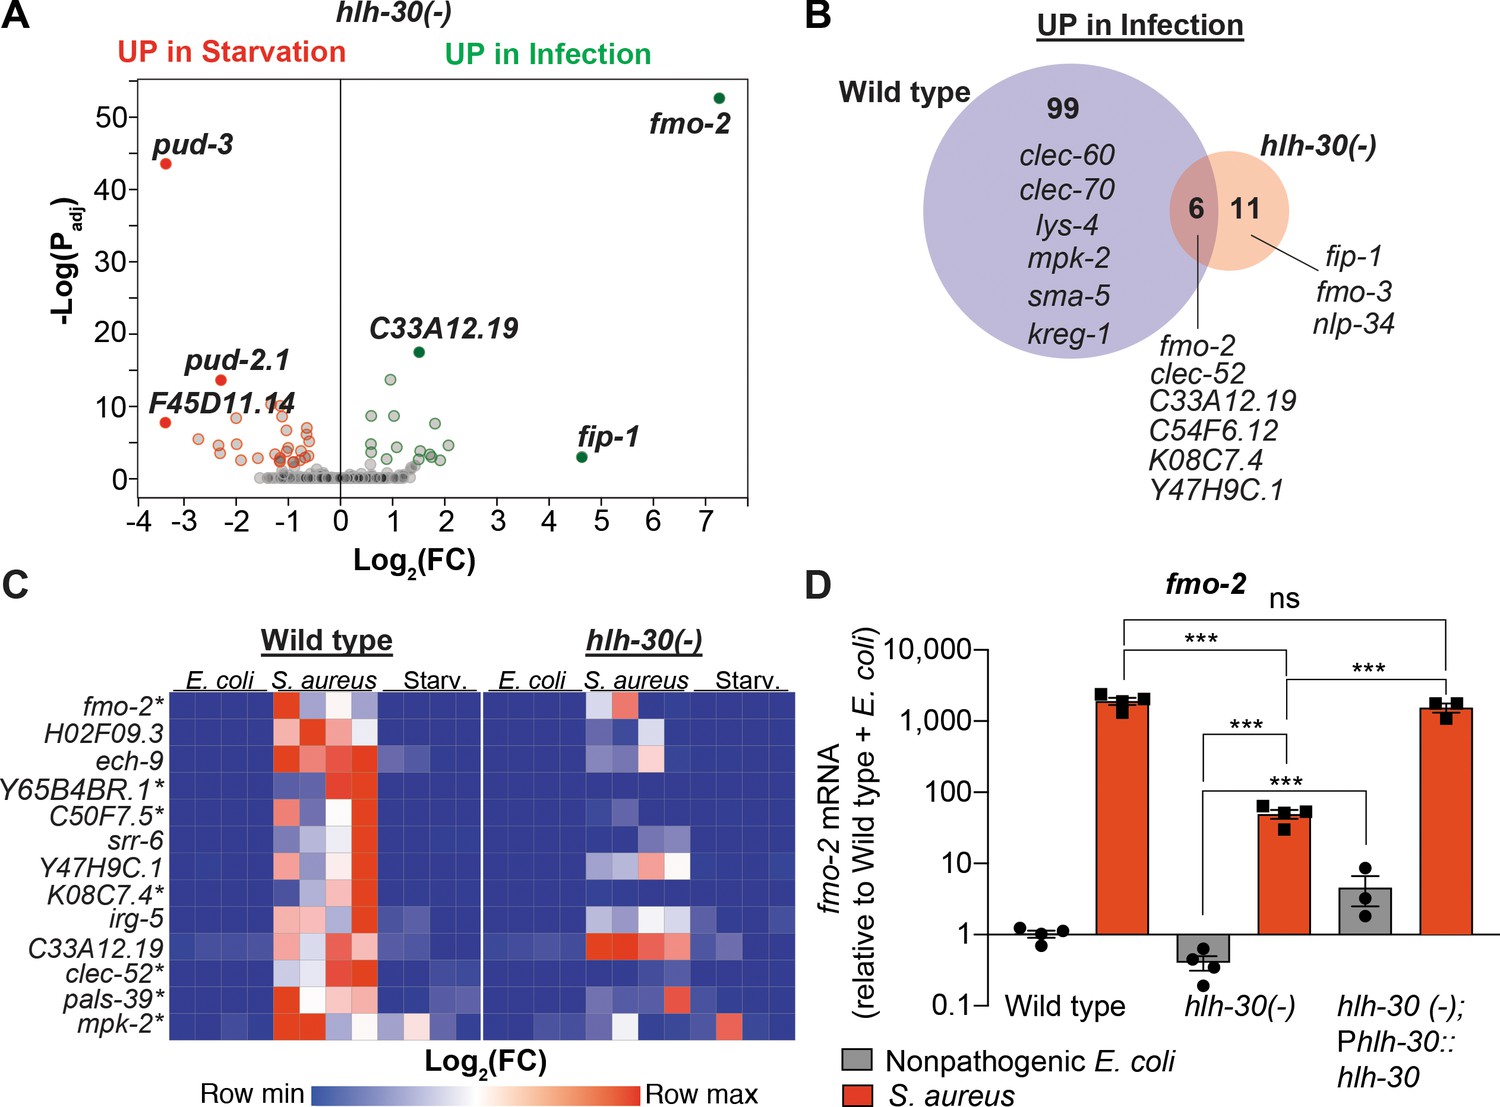
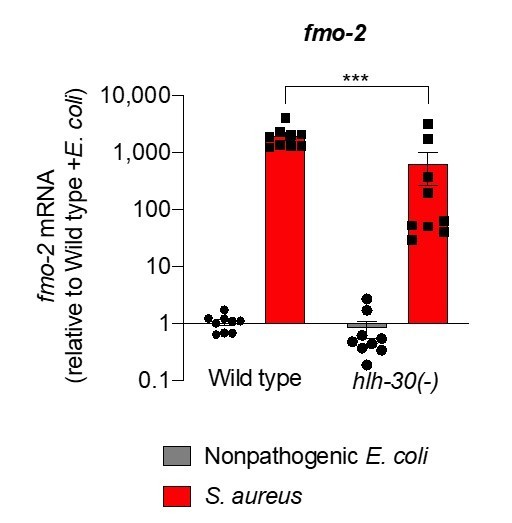
HLH-30/TFEB is critical for host responses to starvation and infection.
(A) Volcano plot of differentially expressed genes in hlh-30/TFEB loss-of-function mutants (PAdj. ≤0.01). Genes that were induced in each condition relative to the other are indicated in red (for starvation) and green (for infection). (B) Venn diagram representing genes that were upregulated during infection compared to starvation in wild type and hlh-30/TFEB mutants. A few selected genes are indicated for reference. (C) Heat map of RT-qPCR (-ΔCt) relative expression values of a set of 13 genes most highly induced by S. aureus v starvation , measured in wild type and hlh-30/TFEB mutants. Conditions include nonpathogenic E. coli, S. aureus, and starvation. Columns represent independent biological replicates. * indicates genes that were highly induced in wild type compared to hlh-30/TFEB mutants during infection, and thus were partially or completely HLH-30/TFEB-dependent. 'Starv.', starvation. (D) RT-qPCR of fmo-2/FMO5 transcript in wild type, hlh-30/TFEB loss-of-function mutants, and hlh-30(-); Phlh-30::hlh-30::gfp (complemented) animals fed nonpathogenic E. coli or infected with S. aureus (4 hr). Data are normalized to wild-type fed nonpathogenic E. coli, means ± SEM (3–4 independent biological replicates). ***p≤0.001, ns = not significant, one-way ANOVA followed by Šídák’s test for multiple comparisons.
-
Figure 2—source data 1
fmo-2 mRNA levels in wild type, hlh-30(-), and hlh-30(-); Phlh-30::hlh-30::gfp (complemented) animals fed nonpathogenic E. coli or infected with S. aureus.
- https://cdn.elifesciences.org/articles/62775/elife-62775-fig2-data1-v3.xlsx
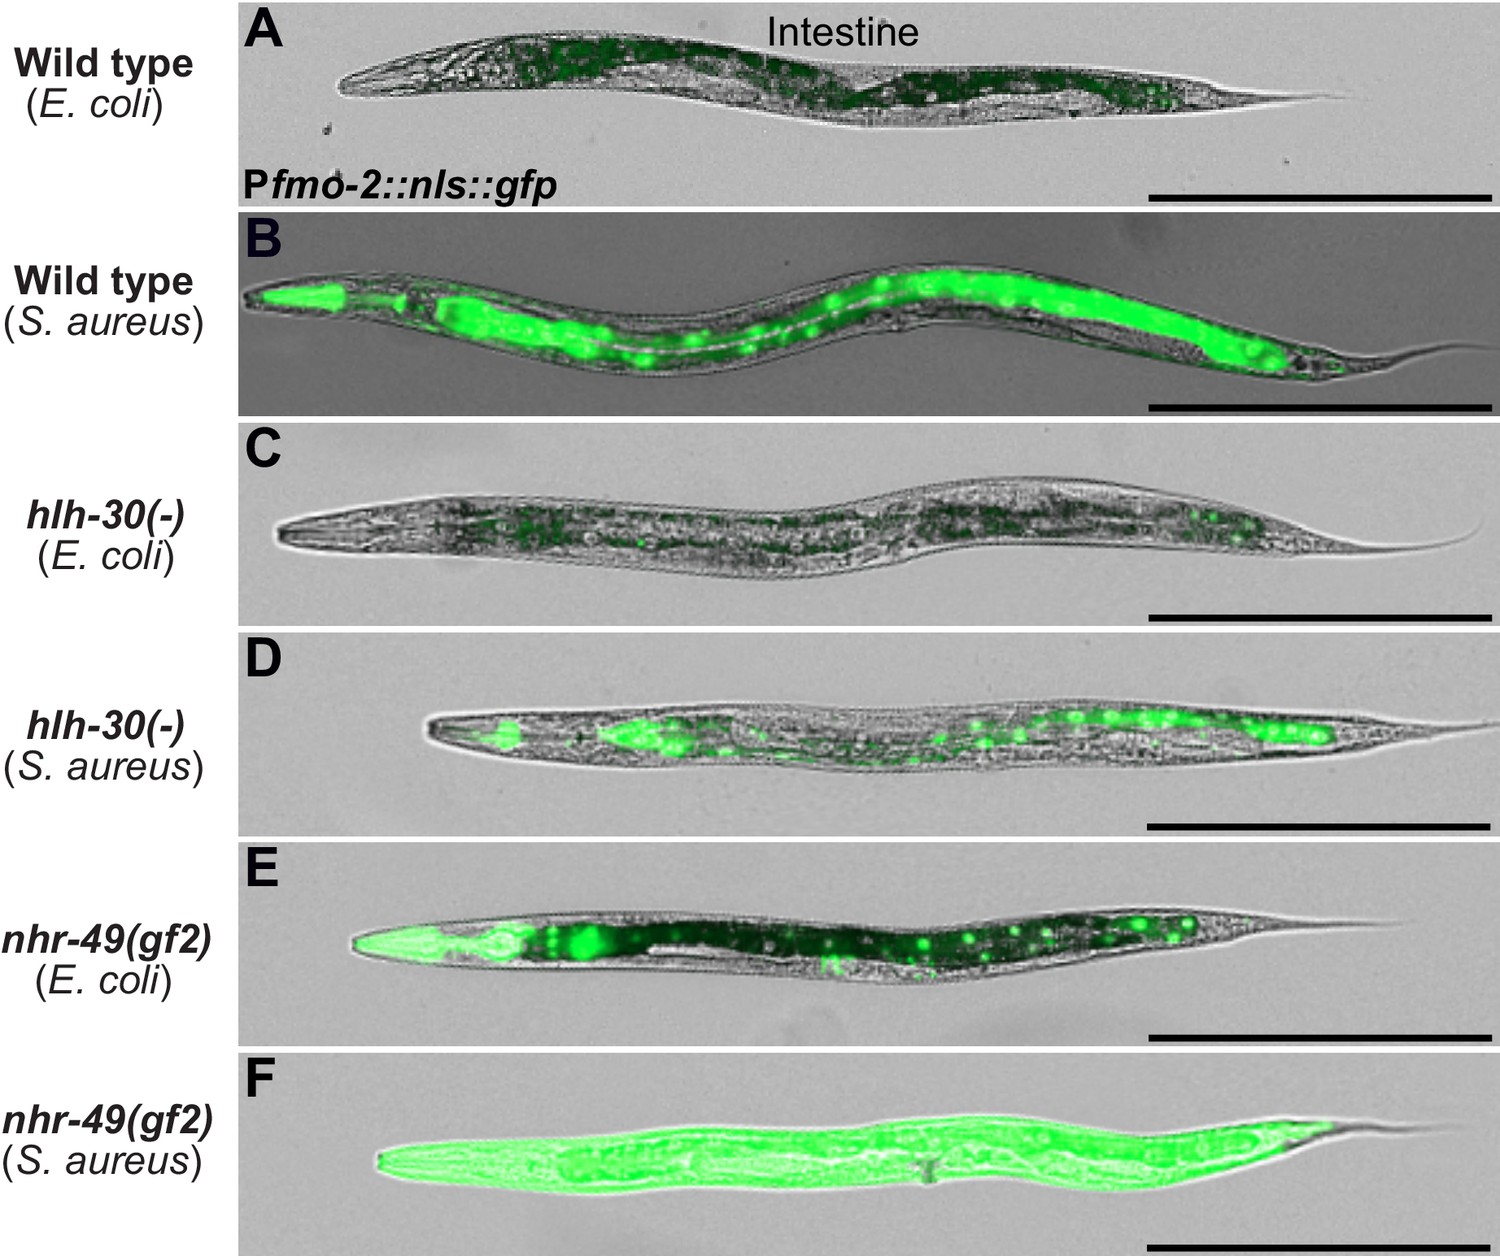
Figure 3 with 3 supplements

Infection induces fmo-2/FMO5 via NHR-49/PPAR-α.
(A–F) Epifluorescence micrographs of animals carrying Pfmo-2::nls::gfp in wild type (A, B), hlh-30/TFEB (C, D), and nhr-49/PPARA mutant backgrounds (E, F) after feeding on E. coli OP50 or infection with S. aureus SH1000 (4 hr). Scale bar = 1000 μm. (G) Quantification of whole-animal Pfmo-2::nls::gfp fluorescence in wild type, hlh-30/TFEB, and nhr-49/PPARA mutant animals after feeding on nonpathogenic E. coli or S. aureus (4 hr). Numbers atop bars indicate total number of animals in each condition. Error bars represent mean ± SEM. **p≤0.01, ***p≤0.001, unpaired two-sample two-tailed t-test. (H–J) High magnification epifluorescence images of Pfmo-2::nls::gfp transgenic animals in wild type, hlh-30(-), or nhr-49(-) mutant backgrounds after infection with S. aureus (4 hr). Scale bar = 300 μm. (K) Quantification of Pfmo-2::nls::gfp fluorescence in the intestines of wild type, hlh-30(-), and nhr-49(-) mutants after infection with S. aureus (4 hr). Numbers atop bars indicate total number of animals in each condition. Error bars represent mean ± SEM. ***p≤0.001, unpaired two-sample two-tailed t-test. (L) Relative expression of fmo-2/FMO5 transcript (RT-qPCR -ΔCt) in wild type, nhr-49(-) mutants, and nhr-49(-); Pnhr-49::nhr-49 (complemented) animals fed nonpathogenic E. coli OP50 or infected with S. aureus SH1000 (4 hr). Data are normalized to wild type on E. coli, means ± SEM (three to four independent biological replicates). ***p≤0.001, ns = not significant, one-way ANOVA followed by Šídák’s test for multiple comparisons.
-
Figure 3—source data 1
Quantification of whole-animal Pfmo-2::nls::gfp fluorescence in wild type, hlh-30(-), and nhr-49(-) animals after feeding on nonpathogenic E. coli or infected with S. aureus.
- https://cdn.elifesciences.org/articles/62775/elife-62775-fig3-data1-v3.xlsx
-
Figure 3—source data 2
Quantification of Pfmo-2::nls::gfp fluorescence in the intestines of wild type, hlh-30(-), and nhr-49(-) mutants after infection with S. aureus.
- https://cdn.elifesciences.org/articles/62775/elife-62775-fig3-data2-v3.xlsx
-
Figure 3—source data 3
fmo-2 mRNA levels in wild type, nhr-49(-) mutants, and nhr-49(-); Pnhr-49::nhr-49 (complemented) animals fed nonpathogenic E. coli or infected with S. aureus.
- https://cdn.elifesciences.org/articles/62775/elife-62775-fig3-data3-v3.xlsx
Figure 3—figure supplement 1
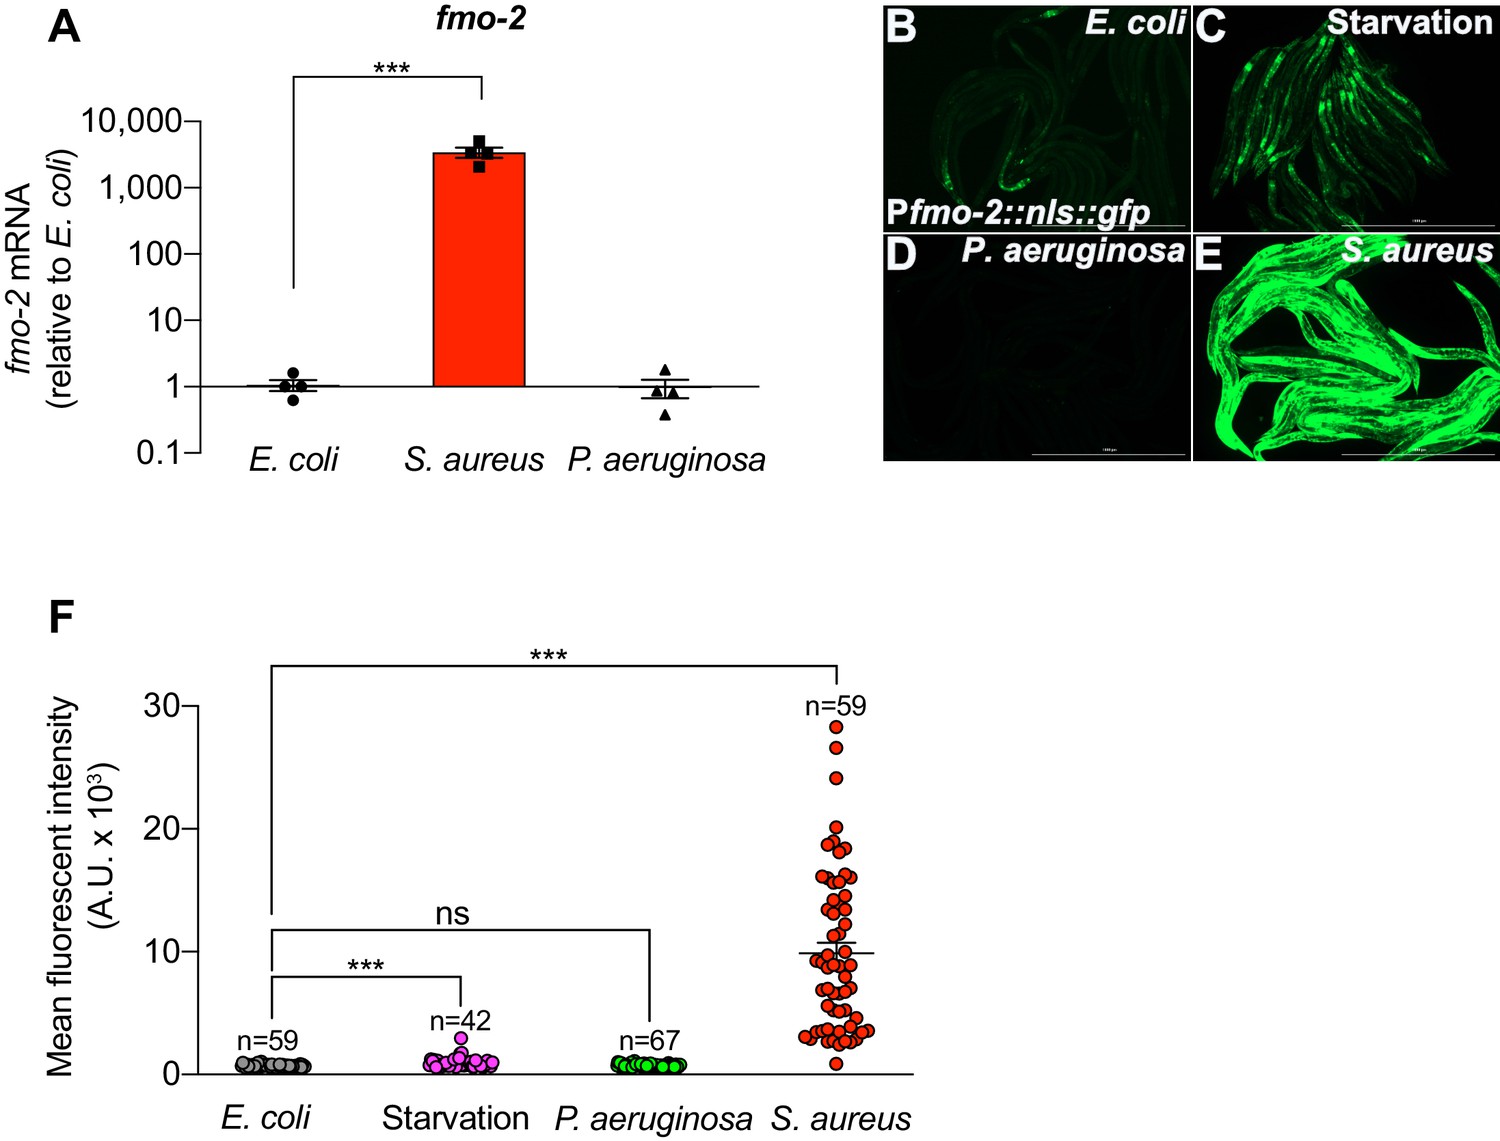
fmo-2/FMO5 is specifically and highly induced by S. aureus.
(A) RT-qPCR of fmo-2/FMO5 transcript in wild type animals fed nonpathogenic E. coli, or infected with S. aureus SH1000 or P. aeruginosa PA14 for 4 hr. Data are normalized to E. coli, means ± SEM (four independent biological replicates). ***p≤0.001, unpaired two-sample two-tailed t-test. (B–E) Epifluorescence micrographs of animals expressing NLS-GFP driven by the endogenous fmo-2/FMO5 promoter (Pfmo-2::nls::gfp) fed on E. coli, infected with S. aureus SH1000 or P. aeruginosa PA14, or starved (4 hr). Scale bar = 1,000 μm. (F) Quantification of Pfmo-2::nls::gfp fluorescence in animals fed on E. coli, infected with S. aureus SH1000 or P. aeruginosa PA14, or starved (4 hr). Numbers atop represent the total number of animals tested. Error bars represent mean ± SEM. ***p≤0.001, ns = not significant, unpaired two-sample two-tailed t-test.
-
Figure 3—figure supplement 1—source data 1
fmo-2 mRNA levels in wild-type animals fed nonpathogenic E. coli, or infected with S. aureus or P. aeruginosa.
- https://cdn.elifesciences.org/articles/62775/elife-62775-fig3-figsupp1-data1-v3.xlsx
-
Figure 3—figure supplement 1—source data 2
Quantification of Pfmo-2::nls::gfp fluorescence in animals fed on E. coli, starved, or infected with P. aeruginosa or S. aureus.
- https://cdn.elifesciences.org/articles/62775/elife-62775-fig3-figsupp1-data2-v3.xlsx
Figure 3—figure supplement 2
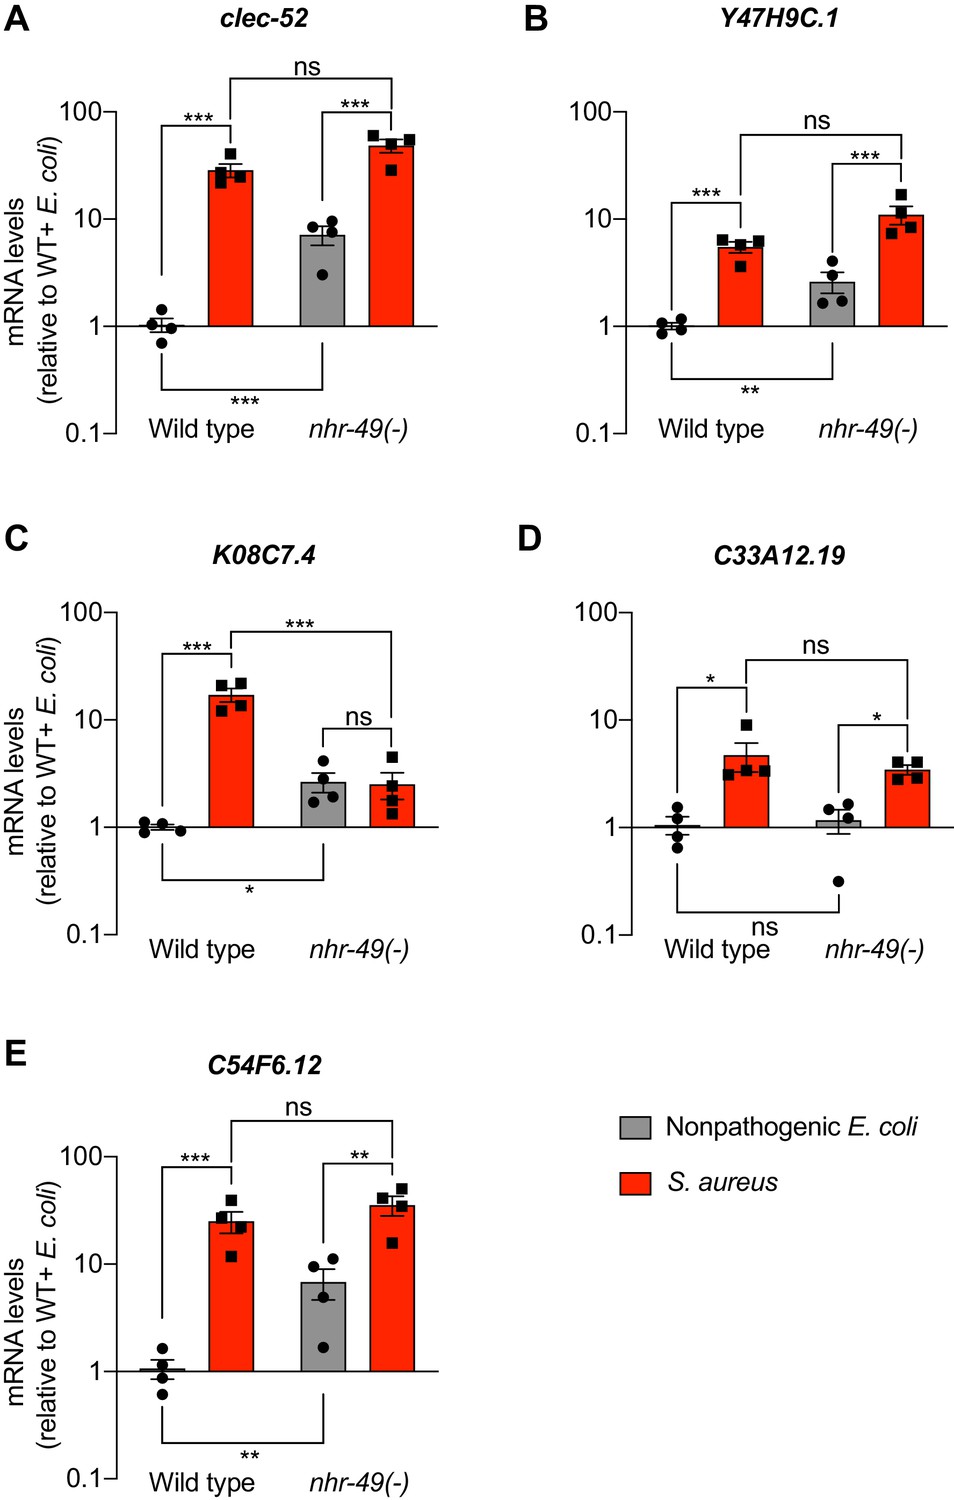
Expression analysis of HLH-30/TFEB-independent genes in nhr-49/PPARA mutants.
(A–E) Relative transcript expression (RT-qPCR) of 5fivegenes in wild type and nhr-49(-) animals fed nonpathogenic E. coli or infected with S. aureus (4 hr), normalized to wild type + E. coli. Data are mean ± SEM (four independent biological replicates). *p≤0.05, **p≤0.01, ***p≤0.001, ns = not significant, one-way ANOVA followed by Šídák’s test for multiple comparisons.
-
Figure 3—figure supplement 2—source data 1
clec-52 mRNA levels in wild type and nhr-49(-) mutant animals fed nonpathogenic E. coli or infected with S. aureus.
- https://cdn.elifesciences.org/articles/62775/elife-62775-fig3-figsupp2-data1-v3.xlsx
-
Figure 3—figure supplement 2—source data 2
Y47H9C.1 mRNA levels in wild type and nhr-49(-) mutant animals fed nonpathogenic E. coli or infected with S. aureus.
- https://cdn.elifesciences.org/articles/62775/elife-62775-fig3-figsupp2-data2-v3.xlsx
-
Figure 3—figure supplement 2—source data 3
K08C7.4 mRNA levels in wild type and nhr-49(-) mutant animals fed nonpathogenic E. coli or infected with S. aureus.
- https://cdn.elifesciences.org/articles/62775/elife-62775-fig3-figsupp2-data3-v3.xlsx
-
Figure 3—figure supplement 2—source data 4
C33A12.19 mRNA levels in wild type and nhr-49(-) mutant animals fed nonpathogenic E. coli or infected with S. aureus.
- https://cdn.elifesciences.org/articles/62775/elife-62775-fig3-figsupp2-data4-v3.xlsx
-
Figure 3—figure supplement 2—source data 5
C54F6.12 mRNA levels in wild type and nhr-49(-) mutant animals fed nonpathogenic E. coli or infected with S. aureus.
- https://cdn.elifesciences.org/articles/62775/elife-62775-fig3-figsupp2-data5-v3.xlsx
Figure 3—figure supplement 3
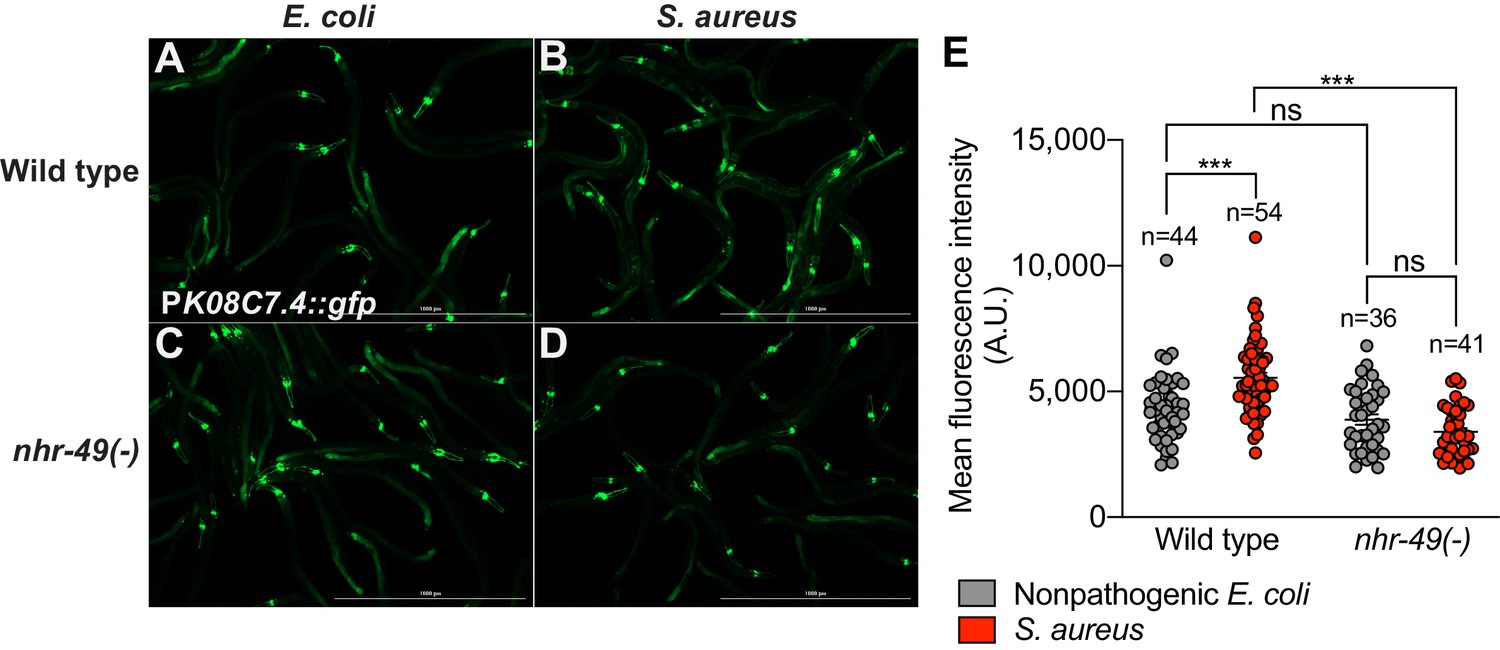
K08C7.4 induction requires NHR-49/PPAR-α.
(A–D) Epifluorescence micrographs of animals carrying PK08C7.4::gfp in wild type (A, B), and nhr-49(-) mutant (C, D) backgrounds, after feeding on E. coli OP50 or infection with S. aureus SH1000 (4 hr). Scale bar = 1000 μm. (E) Quantification of PK08C7.4::gfp fluorescence in wild type and nhr-49(-) mutant backgrounds, after feeding on E. coli OP50 or infection with S. aureus SH1000 (4 hr). Numbers atop represent the total number of animals tested in each condition. Data are mean ± SEM. ***p≤0.001, ns = not significant, one-way ANOVA followed by Šídák’s test for multiple comparisons.
-
Figure 3—figure supplement 3—source data 1
Quantification of PK08C7.4::gfp fluorescence in wild type and nhr-49(-) mutant animals fed E. coli or infected with S. aureus.
- https://cdn.elifesciences.org/articles/62775/elife-62775-fig3-figsupp3-data1-v3.xlsx
Figure 4 with 1 supplement

NHR-49/PPAR-α is required for host defense against infection.
(A) Survival of wild type, nhr-49/PPARA loss-of-function, and nhr-49(-); Pnhr-49::nhr-49 (complemented) animals infected with S. aureus SH1000. Data are representative of two independent trials. ****p≤0.0001 (Log-Rank test). (B) Lifespan on nonpathogenic E. coli OP50 of wild type, nhr-49/PPARA loss-of-function, and nhr-49(-); Pnhr-49::nhr-49 animals. Data are representative of two independent trials. ****p≤0.0001 (Log-Rank test). (C) Survival of wild type and two nhr-49/PPARA gain-of-function mutants (gf1 = et7 and gf2 = et8) infected with S. aureus SH1000. Data are representative of two independent trials. ****p≤0.0001 (Log-Rank test). (D) Lifespan of wild type and nhr-49/PPARA gain-of-function mutants on E. coli OP50. Data are representative of three independent trials. ****p≤0.0001 (Log-Rank test). (E) Relative expression of fmo-2/FMO5 transcript (RT-qPCR -ΔCt) in wild type and nhr-49/PPARA gain-of-function mutants fed nonpathogenic E. coli OP50 or infected with S. aureus SH1000 (4 hr). Data are normalized to wild type on E. coli, means ± SEM (two to five independent biological replicates). *p≤0.05, **p≤0.01, unpaired two-sample two-tailed t-test. (F–I) Epifluorescence micrographs of Pfmo-2::nls::gfp in wild type (F–G) and nhr-49(gf2) mutants (H–I) fed nonpathogenic E. coli OP50 or infected with S. aureus SH1000 (4 hr). Scale bar = 1000 μm. (J) Quantification of GFP fluorescence in wild type and nhr-49(gf2) animals expressing Pfmo-2::nls::gfp, after feeding on E. coli or infection with S. aureus (4 hr). Number of animals is indicated atop the bars. Error bars represent mean ± SEM. ***p≤0.001, unpaired two-sample two-tailed t-test.
-
Figure 4—source data 1
Survival of wild type, nhr-49(-) mutant, and nhr-49(-); Pnhr-49::nhr-49 (complemented) animals infected with S. aureus.
- https://cdn.elifesciences.org/articles/62775/elife-62775-fig4-data1-v3.xlsx
-
Figure 4—source data 2
Lifespan of wild type, nhr-49(-) mutant, and nhr-49(-); Pnhr-49::nhr-49 (complemented) animals on nonpathogenic E. coli.
- https://cdn.elifesciences.org/articles/62775/elife-62775-fig4-data2-v3.xlsx
-
Figure 4—source data 3
Survival of wild type and nhr-49 gain-of-function mutants (et7 and et8) infected with S. aureus.
- https://cdn.elifesciences.org/articles/62775/elife-62775-fig4-data3-v3.xlsx
-
Figure 4—source data 4
Lifespan of wild type and nhr-49 gain-of-function mutants (et7 and et8) on nonpathogenic E. coli.
- https://cdn.elifesciences.org/articles/62775/elife-62775-fig4-data4-v3.xlsx
-
Figure 4—source data 5
fmo-2 transcript levels in wild type and nhr-49 gain-of-function mutants (et7 and et8) fed nonpathogenic E. coli or infected with S. aureus.
- https://cdn.elifesciences.org/articles/62775/elife-62775-fig4-data5-v3.xlsx
-
Figure 4—source data 6
Quantification of Pfmo-2::nls::gfp fluorescence in wild type and nhr-49(et8) animals fed E. coli or infected with S. aureus.
- https://cdn.elifesciences.org/articles/62775/elife-62775-fig4-data6-v3.xlsx
Figure 4—figure supplement 1
NHR-49/PPAR-α gain-of-function causes constitutive induction of fmo-2.
(A–F) High-magnification images of wild type, hlh-30(-), or nhr-49(gf2) expressing Pfmo-2::nls::gfp, fed nonpathogenic E. coli OP50 or infected with S. aureus SH1000 (4 hr). Error bar = 300 μm.
Figure 5

NHR-49/PPAR-α functions in multiple tissues for host defense.
(A, D, G, J) Relative expression of fmo-2/FMO5 transcript (RT-qPCR -ΔCt) in wild type, nhr-49/PPARA loss-of-function mutants, and tissue-specific nhr-49/PPARA rescue lines: Pglp-19 for intestine, (Pglp-19::nhr-49::gfp), Prgef-1 for nervous system (Prgef-1::nhr-49::gfp), Pmyo-3 for body wall muscle (Pmyo-3::nhr-49::gfp), and Pcol-12 for epidermis (Pcol-12::nhr-49::gfp); fed nonpathogenic E. coli OP50 or infected with S. aureus SH1000 (4 hr). Data are normalized to wild type on E. coli, means ± SEM (three to six independent biological replicates,). ***p≤0.001, ns = not significant, one-way ANOVA followed by Šídák’s test for multiple comparisons. (B, E, H, K) Survival of wild type, nhr-49/PPARA loss of function, and tissue-specific nhr-49/PPARA rescue lines infected with S. aureus. Data are representative of two independent trials. ****p≤0.0001 (Log-Rank test). Comparisons are made between nhr-49(-) and the rescue lines. (C, F, I, L) Lifespan of wild type, nhr-49/PPARA loss of function, and tissue-specific nhr-49 rescue lines on nonpathogenic E. coli. Data are representative of three independent trials. ****p≤0.0001 (Log-Rank test). Comparisons are made between nhr-49(-) and the rescue lines.
-
Figure 5—source data 1
fmo-2 mRNA levels in wild type, nhr-49(-) mutant, and intestine-specific (using gly-19 promoter) nhr-49 rescue line animals.
- https://cdn.elifesciences.org/articles/62775/elife-62775-fig5-data1-v3.xlsx
-
Figure 5—source data 2
Survival of wild type, nhr-49(-) mutant, and intestine-specific (using gly-19 promoter) nhr-49 rescue line animals infected with S. aureus.
- https://cdn.elifesciences.org/articles/62775/elife-62775-fig5-data2-v3.xlsx
-
Figure 5—source data 3
Lifespan of wild type, nhr-49(-) mutant, and intestine-specific (using gly-19 promoter) nhr-49 rescue line animals on nonpathogenic E. coli.
- https://cdn.elifesciences.org/articles/62775/elife-62775-fig5-data3-v3.xlsx
-
Figure 5—source data 4
fmo-2 mRNA levels in wild type, nhr-49(-) mutant, and neuron-specific (using rgef-1 promoter) nhr-49 rescue line animals.
- https://cdn.elifesciences.org/articles/62775/elife-62775-fig5-data4-v3.xlsx
-
Figure 5—source data 5
Survival of wild type, nhr-49(-) mutant, and neuron-specific (using rgef-1 promoter) nhr-49 rescue line animals infected with S. aureus.
- https://cdn.elifesciences.org/articles/62775/elife-62775-fig5-data5-v3.xlsx
-
Figure 5—source data 6
Lifespan of wild type, nhr-49(-) mutant, and neuron-specific (using rgef-1 promoter) nhr-49 rescue line animals on nonpathogenic E. coli.
- https://cdn.elifesciences.org/articles/62775/elife-62775-fig5-data6-v3.xlsx
-
Figure 5—source data 7
fmo-2 mRNA levels in wild type, nhr-49(-) mutant, and muscle-specific (using myo-3 promoter) nhr-49 rescue line animals.
- https://cdn.elifesciences.org/articles/62775/elife-62775-fig5-data7-v3.xlsx
-
Figure 5—source data 8
Survival of wild type, nhr-49(-) mutant, and muscle-specific (using myo-3 promoter) nhr-49 rescue line animals infected with S. aureus.
- https://cdn.elifesciences.org/articles/62775/elife-62775-fig5-data8-v3.xlsx
-
Figure 5—source data 9
Lifespan of wild type, nhr-49(-) mutant, and muscle-specific (using myo-3 promoter) nhr-49 rescue line animals on nonpathogenic E. coli.
- https://cdn.elifesciences.org/articles/62775/elife-62775-fig5-data9-v3.xlsx
-
Figure 5—source data 10
fmo-2 mRNA levels in wild type, nhr-49(-) mutant, and epidermis-specific (using col-12 promoter) nhr-49 rescue line animals.
- https://cdn.elifesciences.org/articles/62775/elife-62775-fig5-data10-v3.xlsx
-
Figure 5—source data 11
Survival of wild type, nhr-49(-) mutant, and epidermis-specific (using col-12 promoter) nhr-49 rescue line animals infected with S. aureus.
- https://cdn.elifesciences.org/articles/62775/elife-62775-fig5-data11-v3.xlsx
-
Figure 5—source data 12
Lifespan of wild type, nhr-49(-) mutant, and epidermis-specific (using col-12 promoter) nhr-49 rescue line animals on nonpathogenic E. coli.
- https://cdn.elifesciences.org/articles/62775/elife-62775-fig5-data12-v3.xlsx
Figure 6
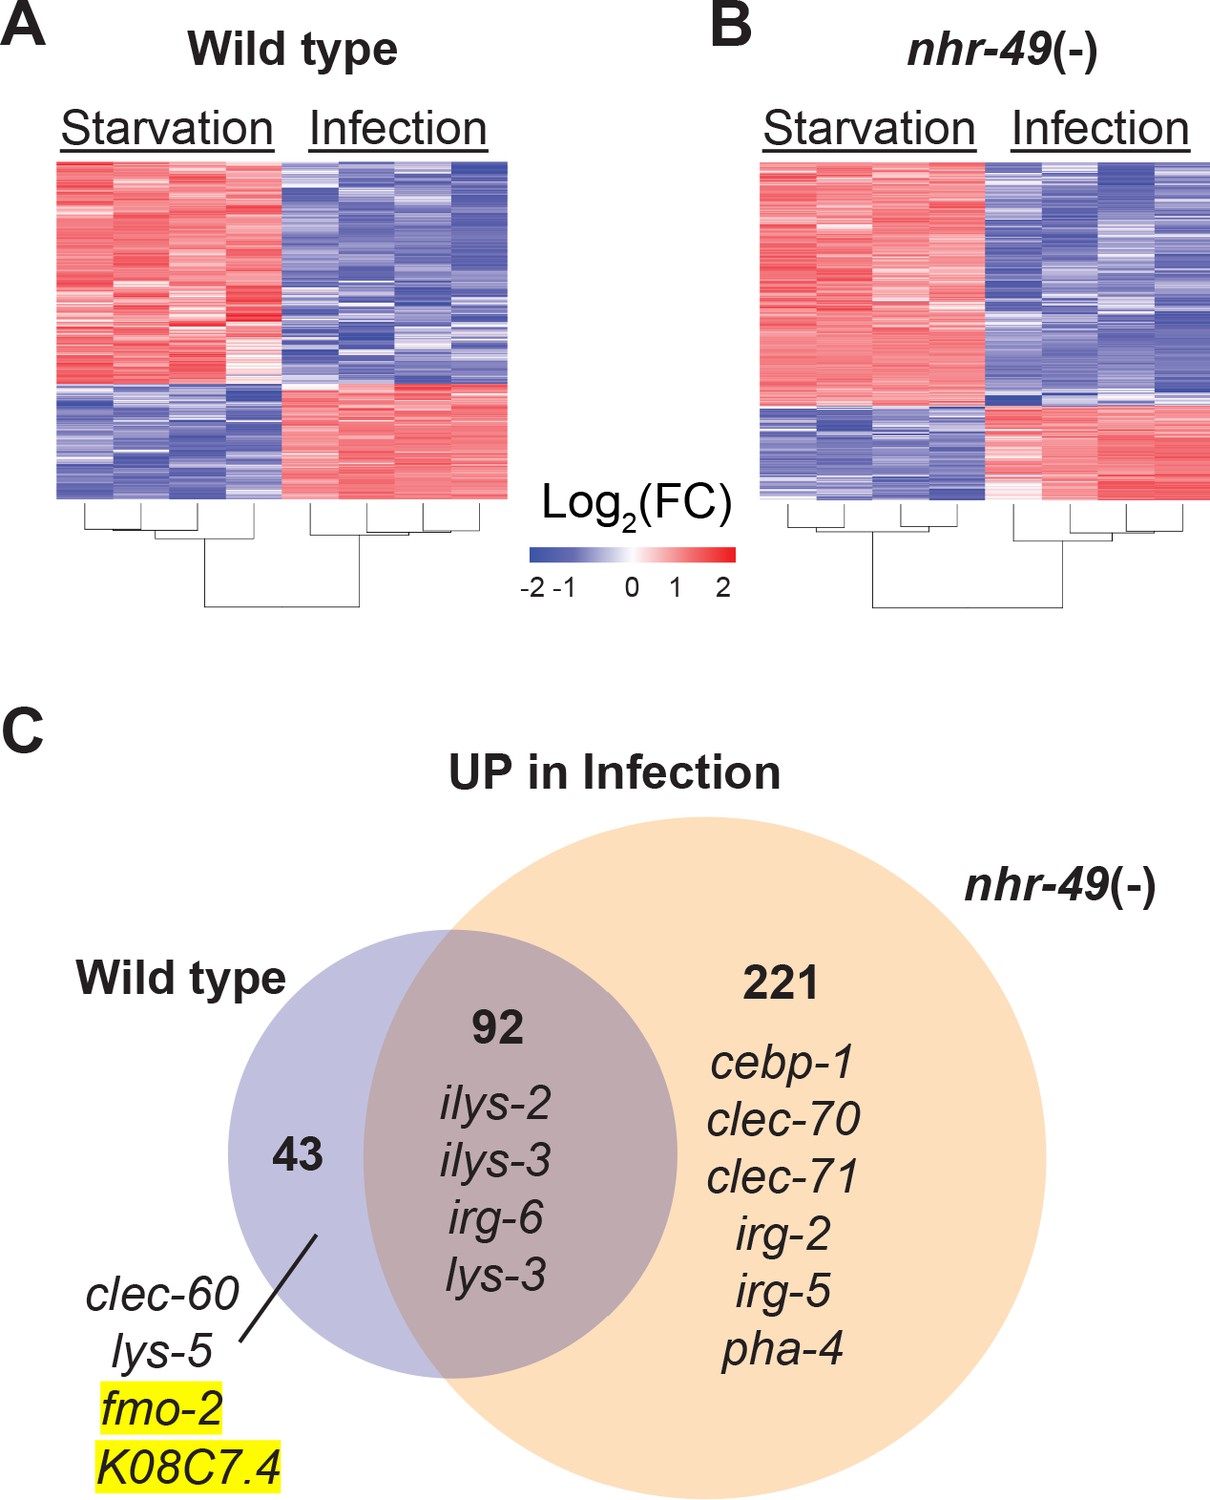
NHR-49/PPAR-α is required for one-third of the infection-specific transcriptional signature.
(A–B) Heat map of differentially expressed genes during starvation and infection in wild type (A) and nhr-49(-) (B) animals (RNA-seq, Log2(FC), PAdj ≤0.001). Columns represent a biological replicate each. (C) Venn diagram representing genes that are upregulated by 4 hr S. aureus infection compared with 4 hr starvation in wild type and nhr-49(-) animals. Shown are a few examples for reference.
Figure 7 with 1 supplement
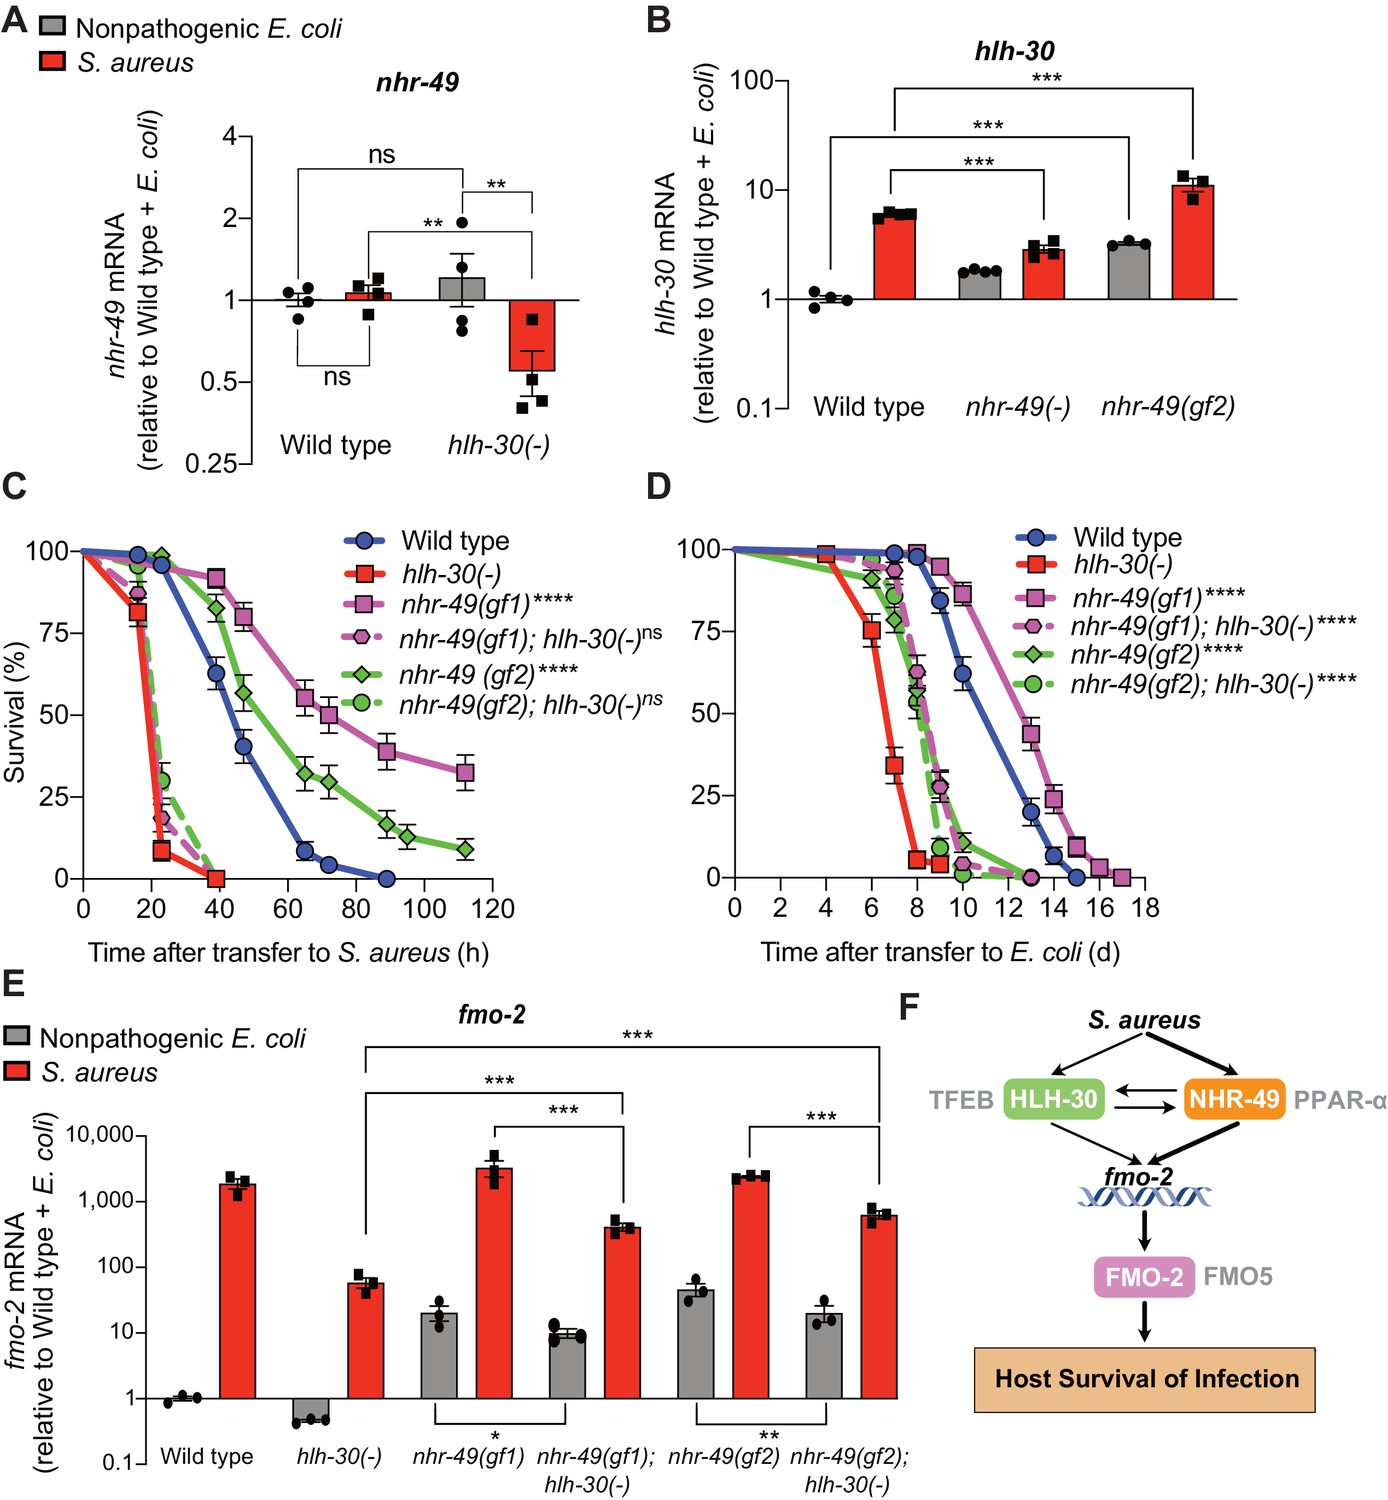
HLH-30/TFEB genetically functions downstream of NHR-49/PPAR-α for host defense.
(A) Relative expression of nhr-49/PPARA transcript (RT-qPCR -ΔCt) in wild type and hlh-30/TFEB loss-of-function mutants fed nonpathogenic E. coli OP50 or infected with S. aureus SH1000 (8 hr). Data are normalized to wild type on E. coli, means ± SEM (four independent biological replicates). **p≤0.01, ns = not significant, one-way ANOVA followed by Šídák’s test for multiple comparisons. (B) Relative expression of hlh-30/TFEB transcript (RT-qPCR -ΔCt) in wild type, nhr-49/PPARA loss of function, and nhr-49/PPARA gain-of-function (gf2) mutants fed nonpathogenic E. coli OP50 or infected with S. aureus SH1000 (8 hr). Data are normalized to wild type on E. coli, means ± SEM (three to four independent biological replicates ). ***p≤0.001, one-way ANOVA followed by Šídák’s test for multiple comparisons. (C) Survival of wild type, hlh-30/TFEB loss of function, nhr-49(gf1), nhr-49(gf2), nhr-49(gf1); hlh-30(-), and nhr-49(gf2); hlh-30(-) animals infected with S. aureus SH1000. Data are representative of two independent trials. ****p≤0.0001 (Log-Rank test, compared to hlh-30(-) mutants). (D) Lifespan of wild type, hlh-30/TFEB loss of function, nhr-49(gf1), nhr-49(gf2), nhr-49(gf1); hlh-30(-), and nhr-49(gf2); hlh-30(-) animals on nonpathogenic E. coli OP50. Data are representative of two independent trials. ****p≤0.0001 (Log-Rank test, compared to hlh-30(-) mutants). (E) Relative expression of fmo-2/FMO5 transcript (RT-qPCR -ΔCt) in wild type, hlh-30(-), nhr-49(gf1), nhr-49(gf1); hlh-30(-), nhr-49(gf2), and nhr-49(gf2); hlh-30(-) animals fed nonpathogenic E. coli OP50 or infected with S. aureus SH1000 (4 hr). Data are normalized to wild type on E. coli, means ± SEM (three to four independent biological replicates). *p≤0.05, **p≤0.01, ***p≤0.001, one-way ANOVA followed by Šídák’s test for multiple comparisons. (F) Schematic representation of fmo-2/FMO5 regulation during infection with S. aureus. Human homologs of the C. elegans proteins are indicated in grey lettering.
-
Figure 7—source data 1
nhr-49 mRNA levels in wild type and hlh-30(-) mutant animals fed nonpathogenic E. coli or infected with S. aureus.
- https://cdn.elifesciences.org/articles/62775/elife-62775-fig7-data1-v3.xlsx
-
Figure 7—source data 2
hlh-30 mRNA levels in wild type, nhr-49(-), and nhr-49 gain-of-function (gf2) mutants fed nonpathogenic E. coli or infected with S. aureus.
- https://cdn.elifesciences.org/articles/62775/elife-62775-fig7-data2-v3.xlsx
-
Figure 7—source data 3
Survival of wild type, hlh-30(-), nhr-49(gf1), nhr-49(gf2), nhr-49(gf1); hlh-30(-), and nhr-49(gf2); hlh-30(-) animals infected with S. aureus.
- https://cdn.elifesciences.org/articles/62775/elife-62775-fig7-data3-v3.xlsx
-
Figure 7—source data 4
Lifespan of wild type, hlh-30(-), nhr-49(gf1), nhr-49(gf2), nhr-49(gf1);hlh-30(-), and nhr-49(gf2);hlh-30(-) animals on nonpathogenic E. coli.
- https://cdn.elifesciences.org/articles/62775/elife-62775-fig7-data4-v3.xlsx
-
Figure 7—source data 5
fmo-2 mRNA levels in wild type, hlh-30(-), nhr-49(gf1), nhr-49(gf1);hlh-30(-), nhr-49(gf2), and nhr-49(gf2);hlh-30(-) animals fed nonpathogenic E. coli or infected with S. aureus.
- https://cdn.elifesciences.org/articles/62775/elife-62775-fig7-data5-v3.xlsx
Figure 7—figure supplement 1
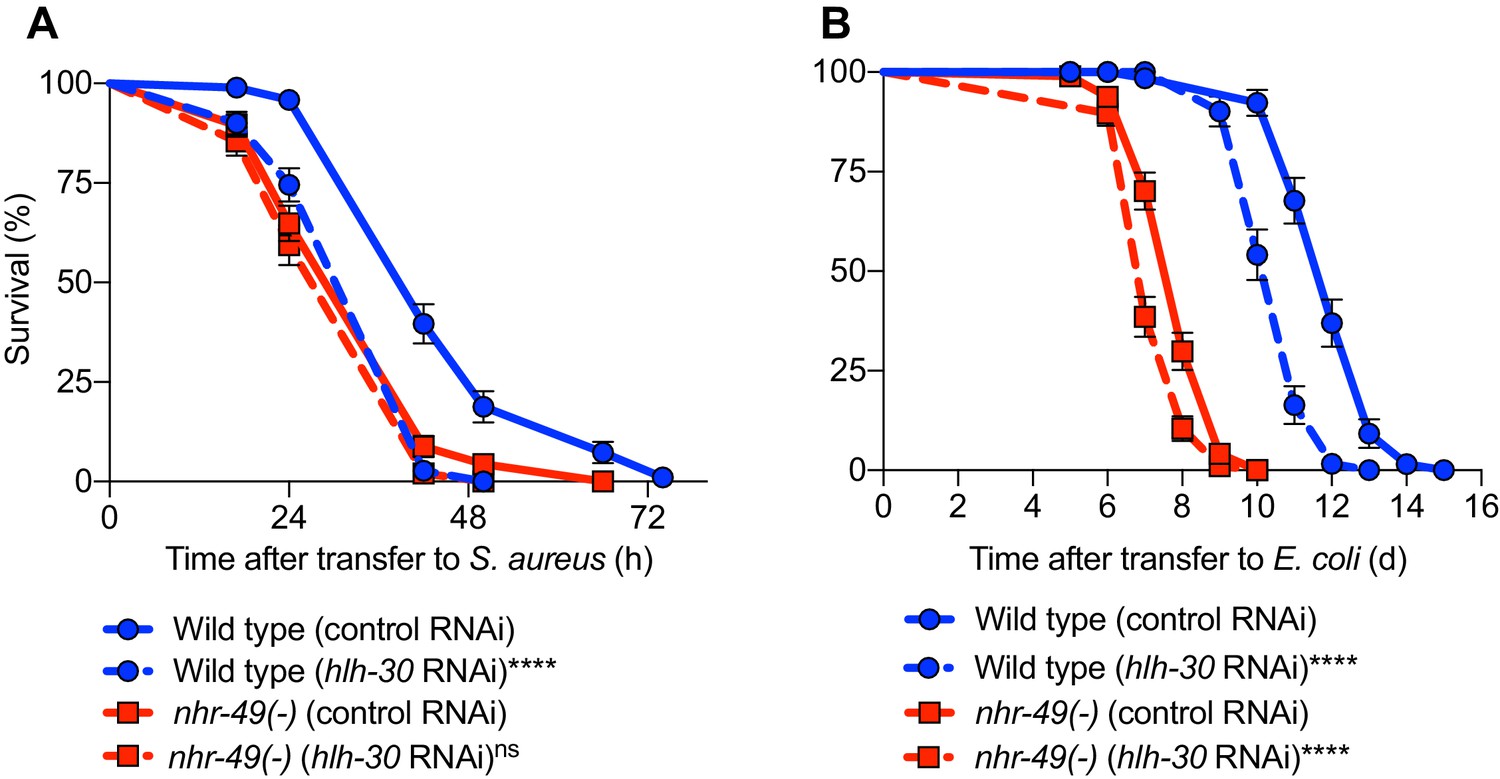
HLH-30/TFEB functions downstream or parallel to NHR-49/PPAR-α.
(A) Survival of wild type and nhr-49(-), infected with S. aureus SH1000, fed on either control (empty vector) RNAi, or RNAi against hlh-30. Data are representative of two independent trials. ****p≤0.0001, ns = not significant (Log-Rank test). Comparisons are drawn between control RNAi (represented by solid lines) and the gene-specific RNAi (represented by dotted lines) in the respective genetic backgrounds. (B) Lifespan of wild type and nhr-49(-), on non-pathogenic E. coli, fed on either control RNAi, or RNAi against hlh-30. Data are representative of two independent trials. ****p≤0.0001 (Log-Rank test). Comparisons shown are between control RNAi (represented by solid lines) and the gene-specific RNAi (represented by dotted lines) in the respective genetic backgrounds.
-
Figure 7—figure supplement 1—source data 1
Survival of wild type and nhr-49(-) mutant animals, infected with S. aureus, fed on either control RNAi, or RNAi against hlh-30.
- https://cdn.elifesciences.org/articles/62775/elife-62775-fig7-figsupp1-data1-v3.xlsx
-
Figure 7—figure supplement 1—source data 2
Lifespan of wild type and nhr-49(-) mutant animals, on non-pathogenic E. coli, fed on either control RNAi, or RNAi against hlh-30.
- https://cdn.elifesciences.org/articles/62775/elife-62775-fig7-figsupp1-data2-v3.xlsx
Figure 8 with 3 supplements

FMO-2/FMO5 is required for host survival of infection.
(A) Survival of wild type and fmo-2/FMO5 loss-of-function mutants infected with S. aureus SH1000. Data are representative of five independent trials. ****p≤0.0001 (Log-Rank test). (B) Survival of wild type and fmo-2/FMO5 loss-of-function mutants infected with P. aeruginosa PA14. Data are representative of two independent trials. ns = not significant (Log-Rank test). (C) Lifespan of wild type and fmo-2/FMO5 loss-of-function mutants fed nonpathogenic E. coli OP50. Data are representative of three independent trials. ns = not significant (Log-Rank test). (D) Survival of wild type, fmo-2/FMO5, fmo-2(FAD), fmo-2(NADPH), and fmo-2(FAD+NADPH) mutants infected with S. aureus SH1000. Data are representative of three independent trials. *p≤0.05, **p≤0.01, ns = not significant (Log-Rank test). Comparisons shown are between fmo-2(-) and the catalytic mutants. (E) Lifespan of wild type, fmo-2/FMO5, fmo-2(FAD), fmo-2(NADPH), and fmo-2(FAD +NADPH) mutants on E. coli OP50. Data are representative of 4 independent replicates. ns = not significant (Log-Rank test).
-
Figure 8—source data 1
Survival of wild type and fmo-2(-) mutant animals infected with S. aureus.
- https://cdn.elifesciences.org/articles/62775/elife-62775-fig8-data1-v3.xlsx
-
Figure 8—source data 2
Survival of wild type and fmo-2(-) mutant animals infected with P. aeruginosa.
- https://cdn.elifesciences.org/articles/62775/elife-62775-fig8-data2-v3.xlsx
-
Figure 8—source data 3
Lifespan of wild type and fmo-2(-) mutant animals fed nonpathogenic E. coli.
- https://cdn.elifesciences.org/articles/62775/elife-62775-fig8-data3-v3.xlsx
-
Figure 8—source data 4
Survival of wild type, fmo-2(-), fmo-2(FAD), fmo-2(NADPH), and fmo-2(FAD +NADPH) mutant animals infected with S. aureus.
- https://cdn.elifesciences.org/articles/62775/elife-62775-fig8-data4-v3.xlsx
-
Figure 8—source data 5
Lifespan of wild type, fmo-2(-), fmo-2(FAD), fmo-2(NADPH), and fmo-2(FAD +NADPH) mutant animals on nonpathogenic E. coli.
- https://cdn.elifesciences.org/articles/62775/elife-62775-fig8-data5-v3.xlsx
Figure 8—figure supplement 1
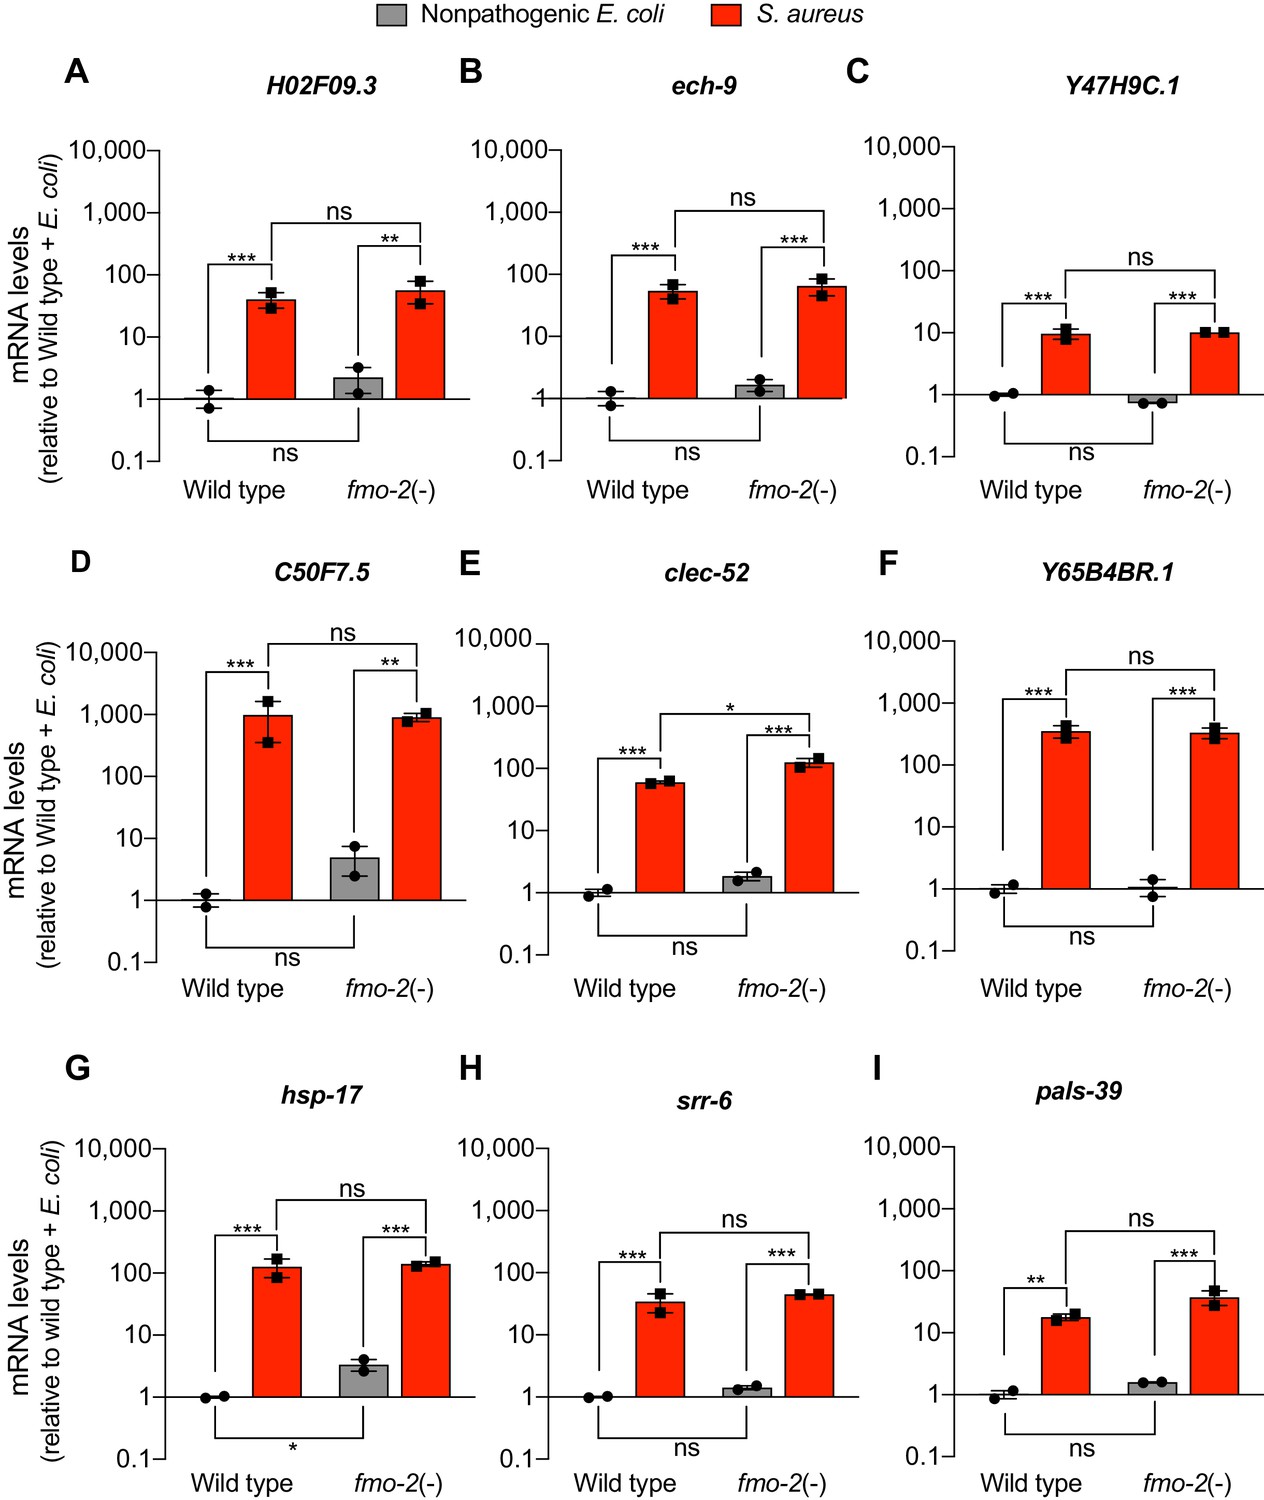
FMO-2/FMO5 is not required for the expression of a set of host defense genes.
(A–I) Relative transcript expression (RT-qPCR) of nine genes in wild type and fmo-2(-) animals fed nonpathogenic E. coli or infected with S. aureus (4 hr), normalized to wild type + E. coli. Data are mean ± SEM (two independent biological replicates). *p≤0.05, **p≤0.01, ***p≤0.001, ns = not significant, one-way ANOVA followed by Šídák’s test for multiple comparisons.
-
Figure 8—figure supplement 1—source data 1
H02F09.3 mRNA levels in wild type and fmo-2(-) animals fed nonpathogenic E. coli or infected with S. aureus.
- https://cdn.elifesciences.org/articles/62775/elife-62775-fig8-figsupp1-data1-v3.xlsx
-
Figure 8—figure supplement 1—source data 2
ech-9 mRNA levels in wild type and fmo-2(-) animals fed nonpathogenic E. coli or infected with S. aureus.
- https://cdn.elifesciences.org/articles/62775/elife-62775-fig8-figsupp1-data2-v3.xlsx
-
Figure 8—figure supplement 1—source data 3
Y47H9C.1 mRNA levels in wild type and fmo-2(-) animals fed nonpathogenic E. coli or infected with S. aureus.
- https://cdn.elifesciences.org/articles/62775/elife-62775-fig8-figsupp1-data3-v3.xlsx
-
Figure 8—figure supplement 1—source data 4
C50F7.5 mRNA levels in wild type and fmo-2(-) animals fed nonpathogenic E. coli or infected with S. aureus.
- https://cdn.elifesciences.org/articles/62775/elife-62775-fig8-figsupp1-data4-v3.xlsx
-
Figure 8—figure supplement 1—source data 5
clec-52 mRNA levels in wild type and fmo-2(-) animals fed nonpathogenic E. coli or infected with S. aureus.
- https://cdn.elifesciences.org/articles/62775/elife-62775-fig8-figsupp1-data5-v3.xlsx
-
Figure 8—figure supplement 1—source data 6
Y65B4BR.1 mRNA levels in wild type and fmo-2(-) animals fed nonpathogenic E. coli or infected with S. aureus.
- https://cdn.elifesciences.org/articles/62775/elife-62775-fig8-figsupp1-data6-v3.xlsx
-
Figure 8—figure supplement 1—source data 7
hsp-17 mRNA levels in wild type and fmo-2(-) animals fed nonpathogenic E. coli or infected with S. aureus.
- https://cdn.elifesciences.org/articles/62775/elife-62775-fig8-figsupp1-data7-v3.xlsx
-
Figure 8—figure supplement 1—source data 8
srr-6 mRNA levels in wild type and fmo-2(-) animals fed nonpathogenic E. coli or infected with S. aureus.
- https://cdn.elifesciences.org/articles/62775/elife-62775-fig8-figsupp1-data8-v3.xlsx
-
Figure 8—figure supplement 1—source data 9
pals-39 mRNA levels in wild type and fmo-2(-) animals fed nonpathogenic E. coli or infected with S. aureus.
- https://cdn.elifesciences.org/articles/62775/elife-62775-fig8-figsupp1-data9-v3.xlsx
Figure 8—figure supplement 2
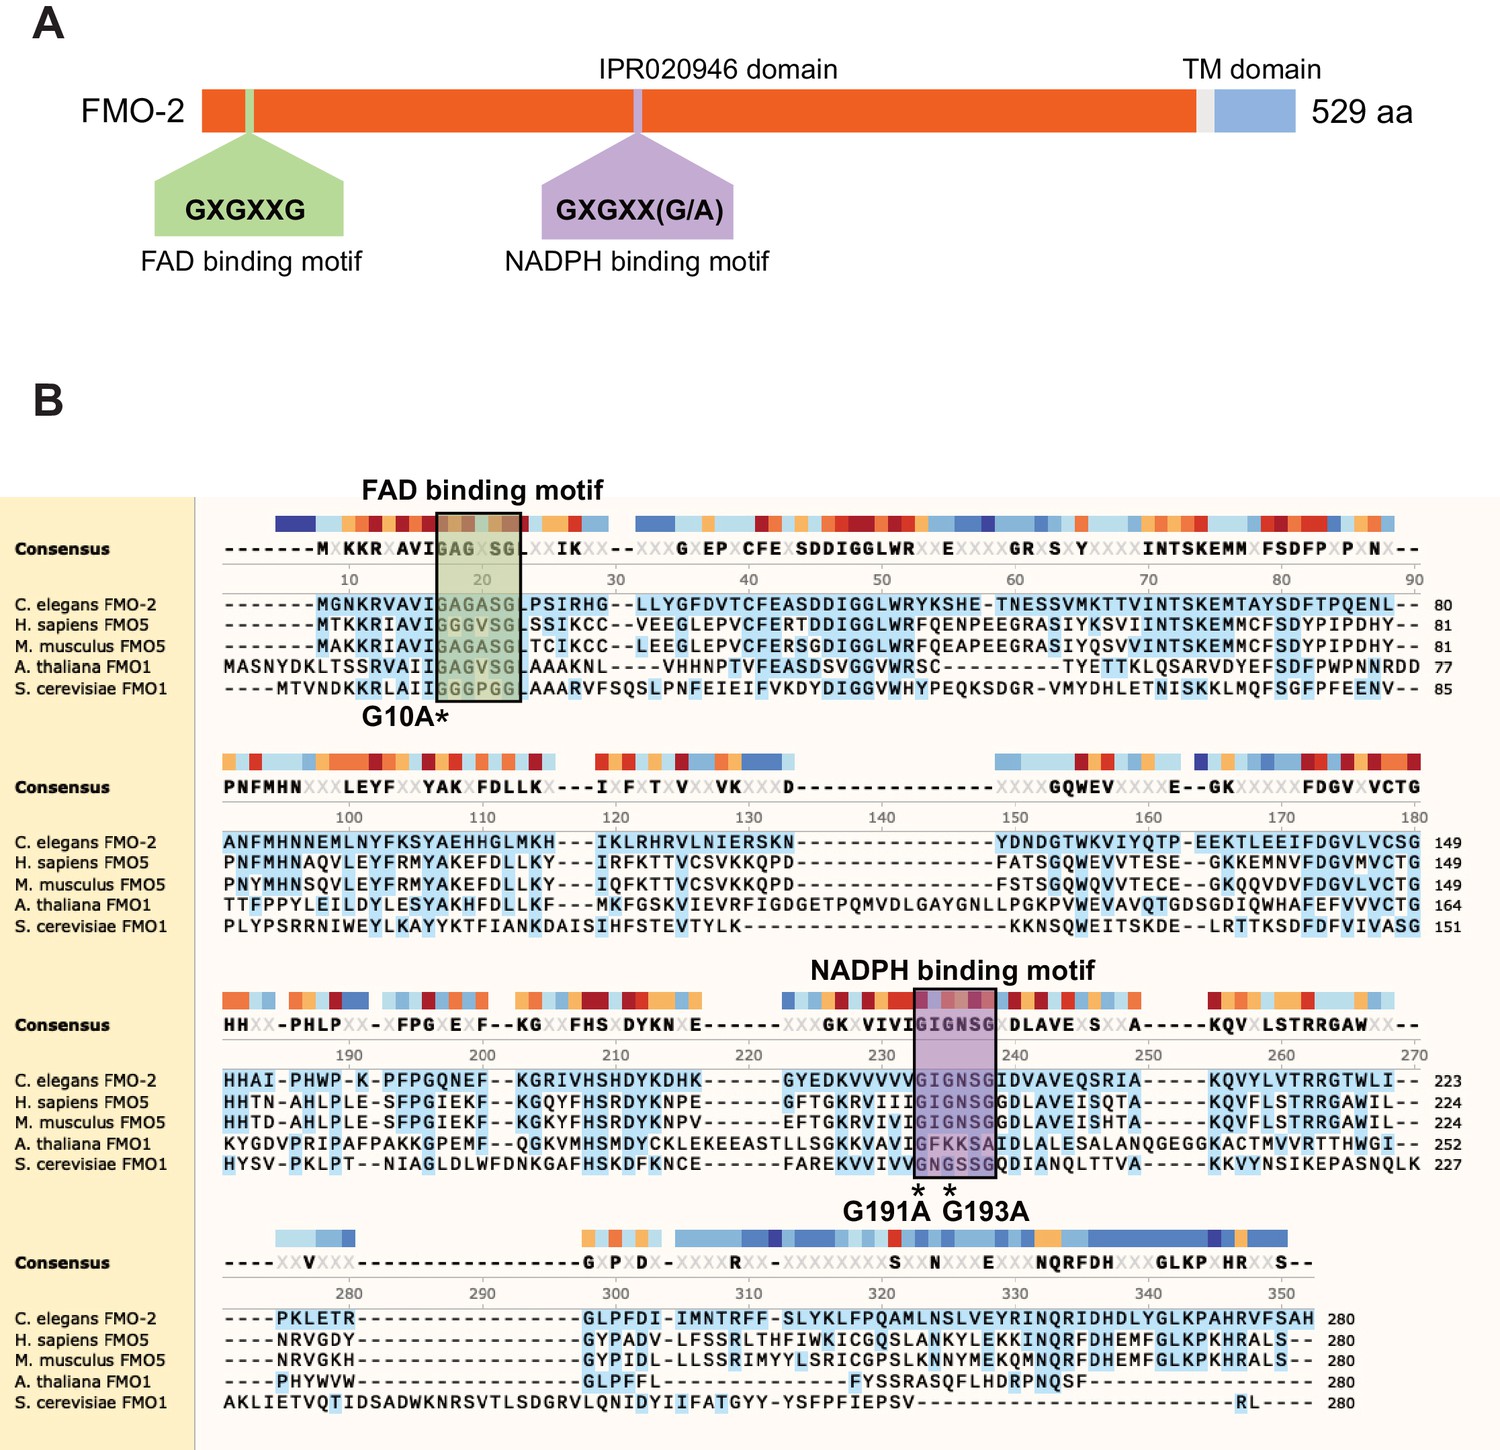
Highly conserved amino acid sequences in FMO-2/FMO5.
(A) Domain architecture of C. elegans FMO-2. Source: InterPro (https://www.ebi.ac.uk/interpro/protein/UniProt/G5EBJ9/). TM, transmembrane domain. (B) Amino acid sequence alignment of C. elegans FMO-2, Homo sapiens FMO5, Mus musculus FMO5, Arabidopsis thaliana FMO1, and Saccharomyces cerevisiae Fmo1p. C. elegans FMO-2 was used as reference. Protein sequence of up to 280 amino acids was used for alignment in each case. Regions of the proteins that include FAD and NADPH motifs (highlighted in boxes) were chosen to show conservation. Glycine (G) residues modified by CRISPR are indicated with asterisks (*) under the respective amino acid residues.
Figure 8—figure supplement 3
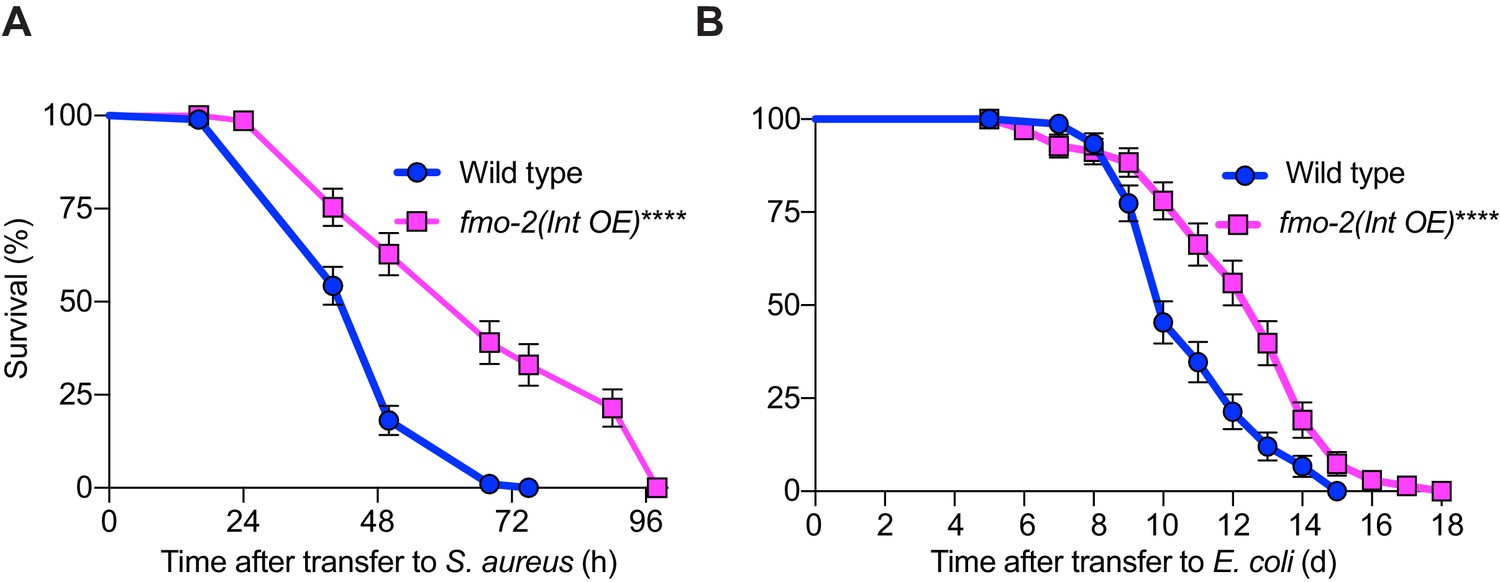
Intestinal overexpression of FMO-2/FMO5 boosts host survival of S. aureus infection.
(A) Survival of wild type and intestinal overexpression (OE) line of fmo-2/FMO5 infected with S. aureus. Data are representative of two independent trials. ****p≤0.0001 (Log-Rank test). Int., intestinal. (B) Lifespan of wild type and intestinal overexpression (OE) of fmo-2/FMO5 on E. coli OP50. Data are representative of two independent trials. ****p≤0.0001 (Log-Rank test).
-
Figure 8—figure supplement 3—source data 1
Survival of wild type and intestinal overexpression (OE) line of fmo-2 infected with S. aureus.
- https://cdn.elifesciences.org/articles/62775/elife-62775-fig8-figsupp3-data1-v3.xlsx
-
Figure 8—figure supplement 3—source data 2
Lifespan of wild type and intestinal overexpression (OE) line of fmo-2 on nonpathogenic E. coli.
- https://cdn.elifesciences.org/articles/62775/elife-62775-fig8-figsupp3-data2-v3.xlsx
Figure 9 with 1 supplement
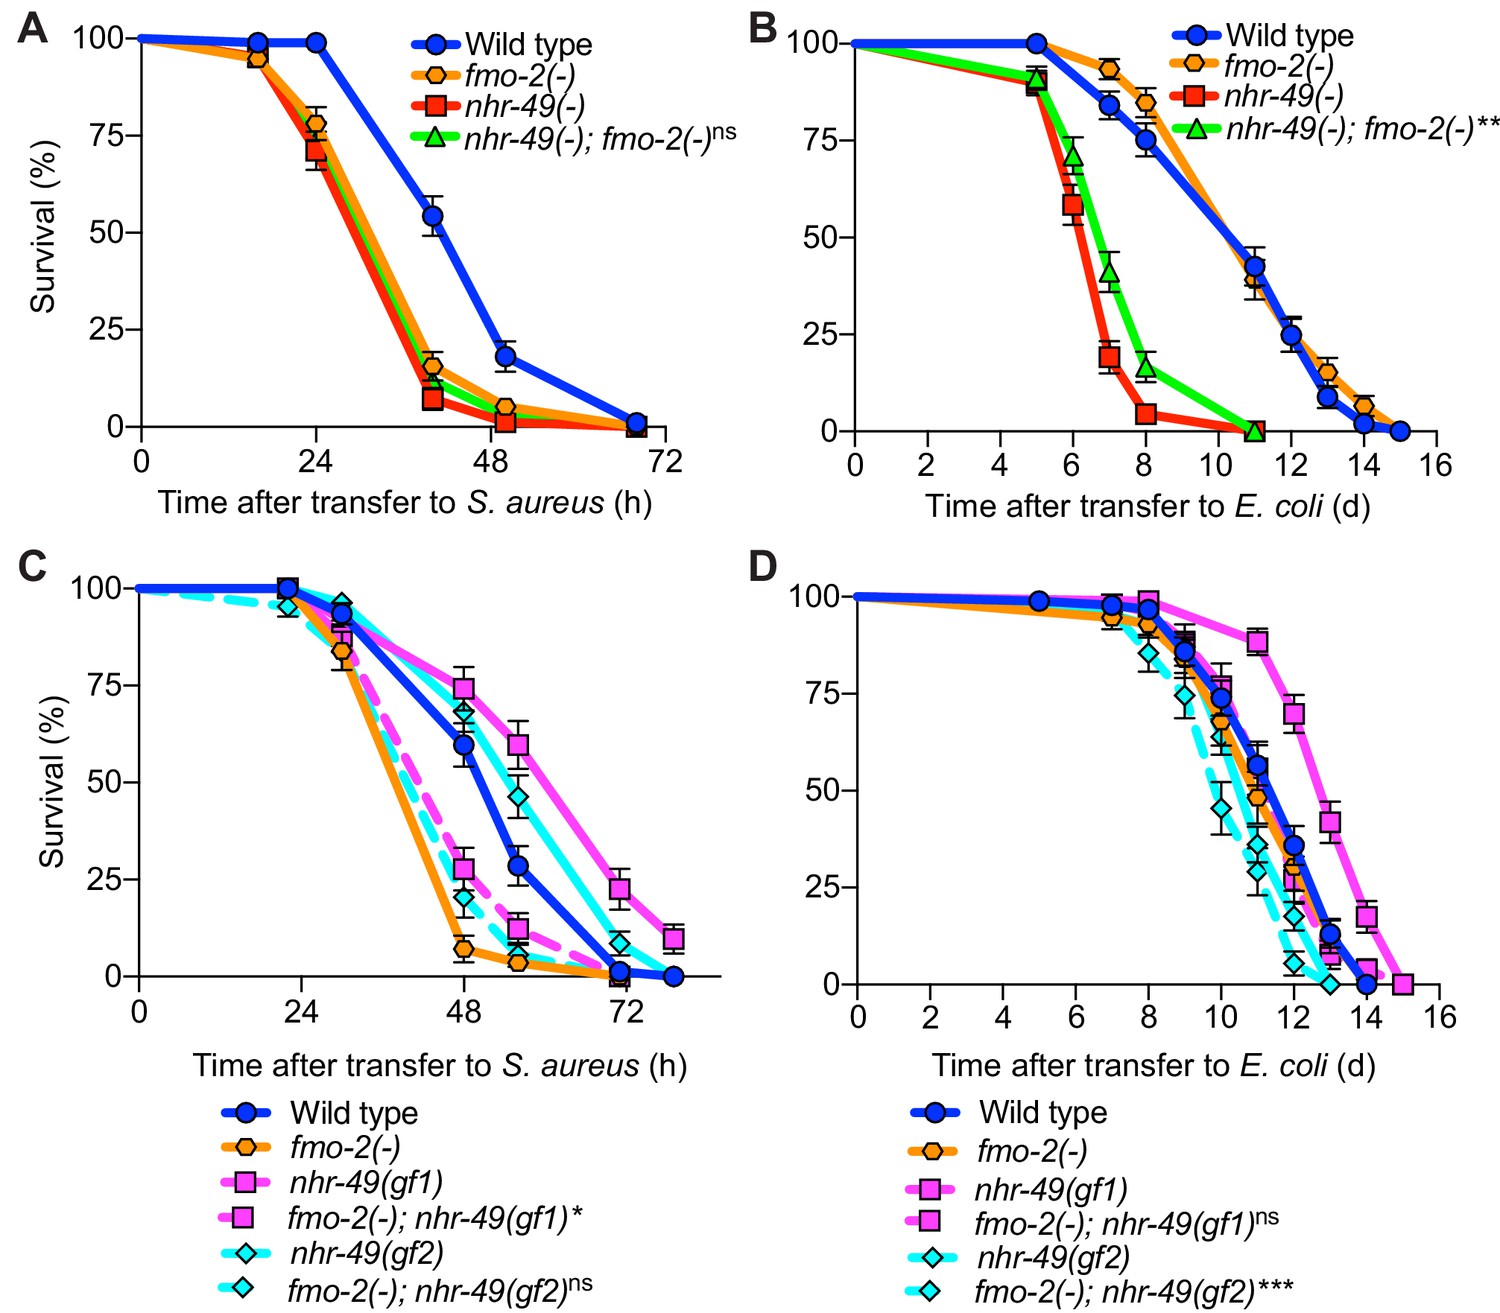
fmo-2/FMO5 and nhr-49/PPARA function in the same genetic pathway.
(A) Survival of wild type, nhr-49(-), and nhr-49(-);fmo-2(-) animals infected with S. aureus. Data are representative of two independent trials. ns = not significant (Log-Rank test). (B) Lifespan of wild type, nhr-49(-), and nhr-49(-);fmo-2(-) animals on nonpathogenic E. coli. Data are representative of two independent trials. **p≤0.01 (Log-Rank test, compared to nhr-49(-)). (C) Survival of wild type, fmo-2(-), nhr-49(gf1), fmo-2(-); nhr-49(gf1), nhr-49(gf2), and fmo-2(-); nhr-49(gf2) animals infected with S. aureus. Data are representative of two independent trials. *p≤0.05, ns = not significant (Log-Rank test, comparisons are between fmo-2(-) single and fmo-2(-); nhr-49(gf) double mutants). (D) Lifespan of wild type, fmo-2(-), nhr-49(gf1), fmo-2(-); nhr-49(gf1), nhr-49(gf2), and fmo-2(-); nhr-49(gf2) animals on nonpathogenic E. coli. Data are representative of two independent trials. ***p≤0.001, ns = not significant (Log-Rank test, comparisons are between fmo-2(-) single and fmo-2(-); nhr-49(gf) double mutants).
-
Figure 9—source data 1
Survival of wild type, nhr-49(-), and nhr-49(-);fmo-2(-) animals infected with S. aureus.
- https://cdn.elifesciences.org/articles/62775/elife-62775-fig9-data1-v3.xlsx
-
Figure 9—source data 2
Lifespan of wild type, nhr-49(-), and nhr-49(-);fmo-2(-) animals on nonpathogenic E. coli.
- https://cdn.elifesciences.org/articles/62775/elife-62775-fig9-data2-v3.xlsx
-
Figure 9—source data 3
Survival of wild type, fmo-2(-), nhr-49(gf1), fmo-2(-);nhr-49(gf1), nhr-49(gf2), and fmo-2(-); nhr-49(gf2) animals infected with S. aureus.
- https://cdn.elifesciences.org/articles/62775/elife-62775-fig9-data3-v3.xlsx
-
Figure 9—source data 4
Lifespan of wild type, fmo-2(-), nhr-49(gf1), fmo-2(-);nhr-49(gf1), nhr-49(gf2), and fmo-2(-);nhr-49(gf2) animals on nonpathogenic E. coli.
- https://cdn.elifesciences.org/articles/62775/elife-62775-fig9-data4-v3.xlsx
Figure 9—figure supplement 1
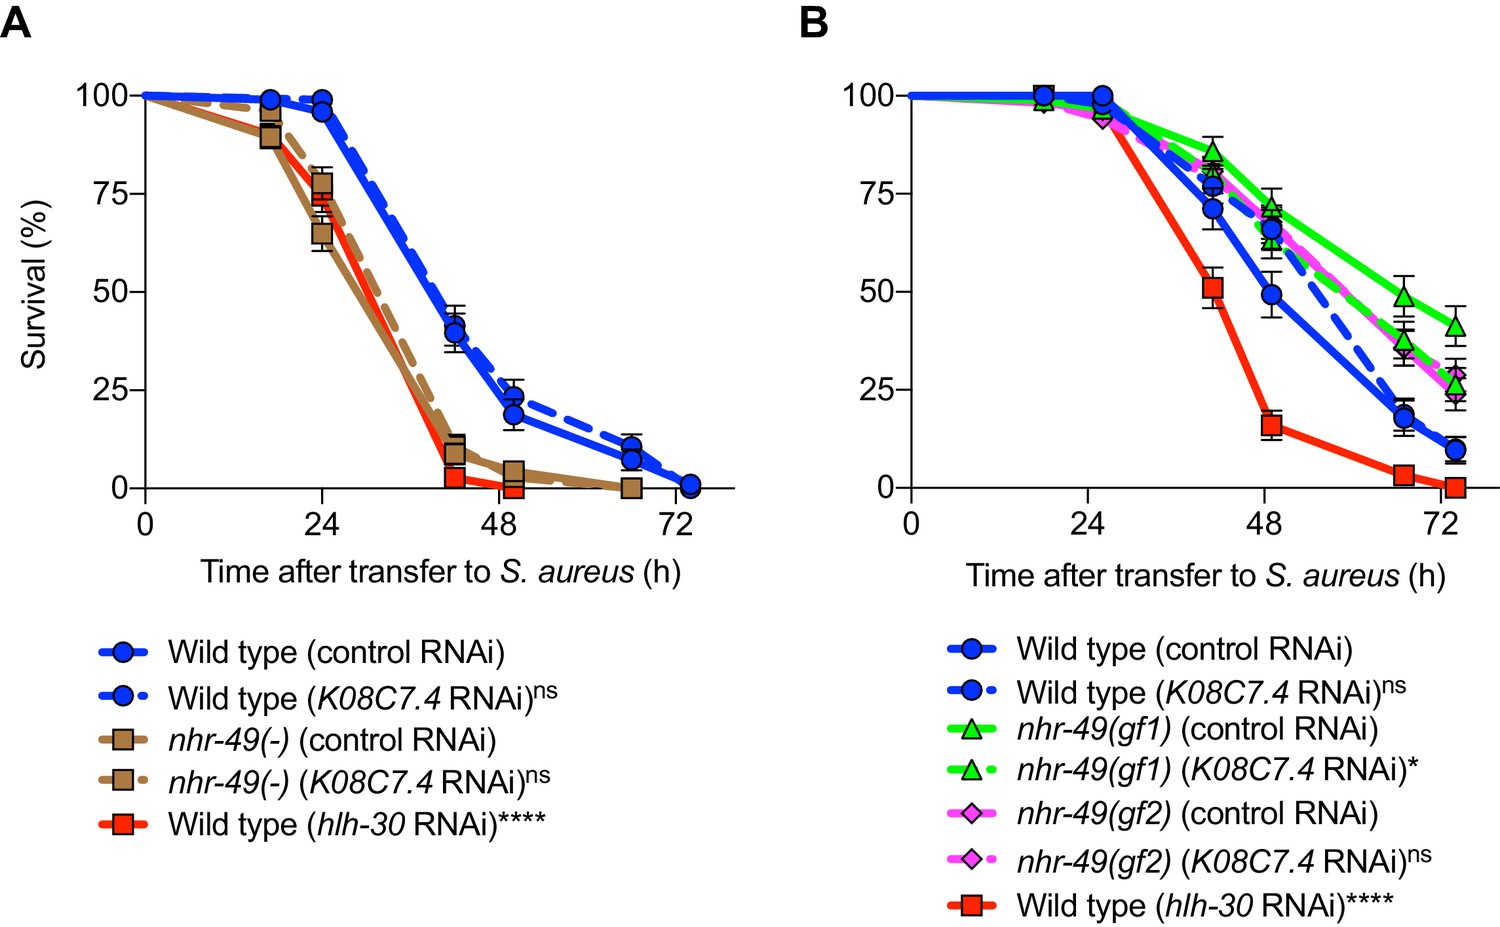
K08C7.4 is dispensable for host defense.
(A–B) Survival of wild type, nhr-49(-), nhr-49(gf1), and nhr-49(gf2) animals, infected with S. aureus SH1000, fed on either control (empty vector) RNAi, or RNAi against K08C7.4. hlh-30(RNAi) in wild type background was used as a control to test the effectiveness of RNAi knockdown. Data are representative of two independent replicates. *p≤0.05, ****p≤0.0001, ns = not significant (Log-Rank test). Comparisons shown are between control RNAi (represented by solid lines) and the gene-specific RNAi (represented by dotted lines) in the respective genetic backgrounds. Wild type (hlh-30 RNAi) is compared with Wild type (control RNAi).
-
Figure 9—figure supplement 1—source data 1
Survival of wild type and nhr-49(-) animals, infected with S. aureus, fed on either control (empty vector) RNAi, or RNAi against K08C7.4.
- https://cdn.elifesciences.org/articles/62775/elife-62775-fig9-figsupp1-data1-v3.xlsx
-
Figure 9—figure supplement 1—source data 2
Survival of wild type, nhr-49(gf1), and nhr-49(gf2) animals, infected with S. aureus, fed on either control (empty vector) RNAi, or RNAi against K08C7.4.
- https://cdn.elifesciences.org/articles/62775/elife-62775-fig9-figsupp1-data2-v3.xlsx
Author response image 1
Additional files
-
Supplementary file 1
Differential gene expression analysis by RNA-seq comparing starvation with infection in wild-type animals (related to Figure 1).
- https://cdn.elifesciences.org/articles/62775/elife-62775-supp1-v3.xlsx
-
Supplementary file 2
Biological pathway over-representation analysis comparing starvation with infection in wild-type animals (related to Figure 1).
- https://cdn.elifesciences.org/articles/62775/elife-62775-supp2-v3.xlsx
-
Supplementary file 3
Differential gene expression analysis by RNA-seq comparing starvation with infection in hlh-30(-) animals (related to Figure 2).
- https://cdn.elifesciences.org/articles/62775/elife-62775-supp3-v3.xlsx
-
Supplementary file 4
Differential gene expression analysis by RNA-seq comparing starvation with infection in nhr-49(-) animals (related to Figure 6).
- https://cdn.elifesciences.org/articles/62775/elife-62775-supp4-v3.xlsx
-
Supplementary file 5
List of oligos, crRNAs, and repair templates used in this work.
- https://cdn.elifesciences.org/articles/62775/elife-62775-supp5-v3.docx
-
Transparent reporting form
- https://cdn.elifesciences.org/articles/62775/elife-62775-transrepform-v3.docx
Download links
A two-part list of links to download the article, or parts of the article, in various formats.
Downloads (link to download the article as PDF)
Open citations (links to open the citations from this article in various online reference manager services)
Cite this article (links to download the citations from this article in formats compatible with various reference manager tools)
NHR-49/PPAR-α and HLH-30/TFEB cooperate for C. elegans host defense via a flavin-containing monooxygenase
eLife 10:e62775.
https://doi.org/10.7554/eLife.62775


