Kinesin-4 KIF21B limits microtubule growth to allow rapid centrosome polarization in T cells
- Cell Biology, Neurobiology and Biophysics, Department of Biology, Faculty of Science, Utrecht University, Netherlands
- Center for Translational Immunology, University Medical Center Utrecht, Utrecht University, Netherlands
Figures
Figure 1 with 2 supplements
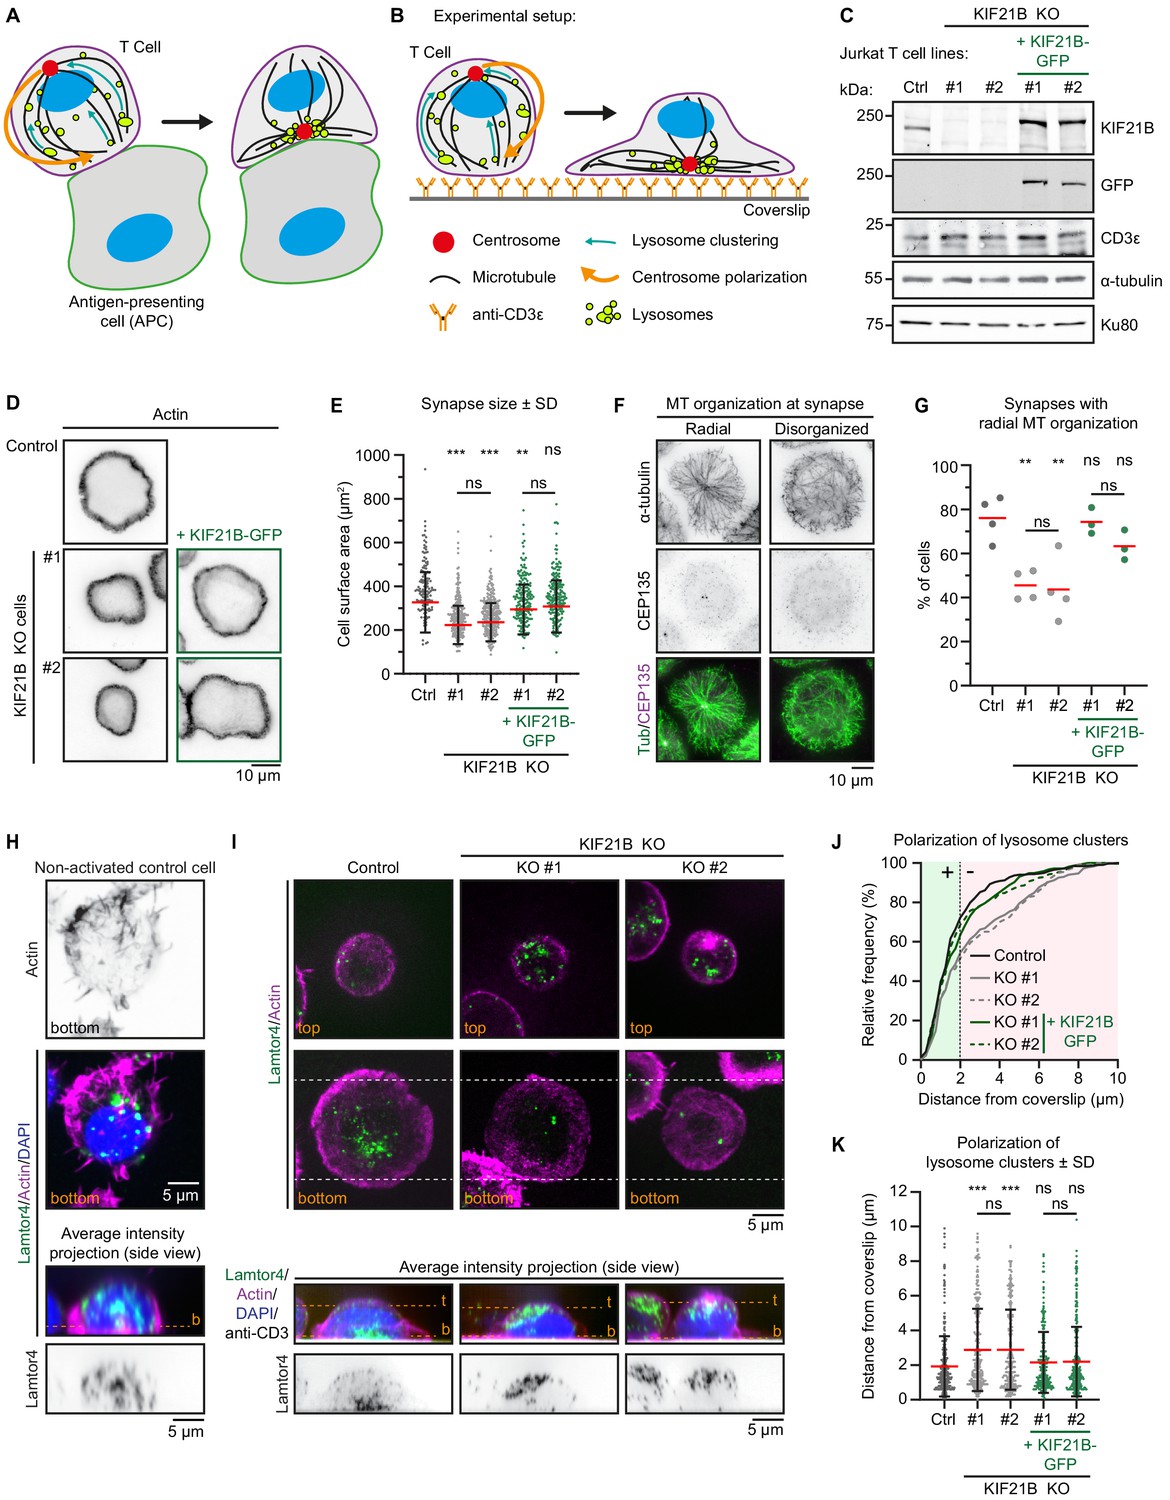
Immunological synapse formation is impaired in KIF21B-KO Jurkat T cells.
(A–B) Schematic representation of T cells forming an immunological synapse upon target recognition. In vivo, T cells recognize an antigen-presenting cell (APC) via the T cell receptor (CD3)-complex which triggers T cell activation. Upon activation, several organelles including lysosomes are transported to the centrosome by dynein. Simultaneously, the centrosome and its associated organelle cluster polarize to the synapse through MT pulling by membrane-anchored dynein at the synapse. (B) To achieve spatiotemporal control on T cell activation, we used anti-CD3-coated glass surfaces to mimic the APC and induce T cell activation and centrosome polarization. (C) Western blot analysis of the indicated Jurkat knockout (KO) cell lines with indicated antibodies. KIF21B-KO clone #1 and #2 were transduced with a KIF21B-GFP construct to generate two polyclonal cell lines re-expressing full-length KIF21B. (D) Phalloidin staining to show F-actin structures in indicated Jurkat T cell lines. Cells were added to poly-D-lysine-coated coverslips with immobilized anti-CD3, fixed after 10 min incubation and imaged on a widefield microscope. (E) Quantification of synapse size expressed as surface area based on a F-actin staining of indicated Jurkat T cells. n = 134, 218, 241, 185 and 194 cells from three independent experiments. **p=0.0098, ***p<0.001, ns = not significant (Mann-Whitney U test). (F) Immunostaining of Jurkat T cells showing two examples of MT organization at the immunological synapse. Cells were added to poly-D-lysine-coated coverslips with immobilized anti-CD3 and fixed 10 min after incubation. Cells were stained for α-tubulin and CEP135 and were imaged on a TIRF microscope. (G) Quantification of MT organization at immunological synapses. Cells were scored per condition either as ‘radial’ or ‘disorganized’ depending their MT organization as shown in E. n = 4, 4, 4, 3 and 3 experiments. In total, 373, 389, 306, 367, and 354 cells were quantified per condition. From left to right: **p=0.0023, **p=0.0099, ns = not significant (t test). (H) Confocal images of a non-activated Jurkat T cell on a poly-D-lysine-coated coverslip (without anti-CD3) stained for Lamtor4, F-actin and DAPI. Single Z-plane images (upper panels) show the bottom part of the cell. The position of the single Z-plane images is indicated in the average intensity z-projection (bottom panels) with a dashed line (orange) labeled with ‘b’ (bottom z-plane). (I) Confocal images of indicated Jurkat T cells. Cells were added to poly-D-lysine-coated coverslips with immobilized anti-CD3 and fixed 10 min after incubation. Cells were stained for Lamtor4, F-actin, and DAPI. In addition, the anti-CD3 antibody with which the coverslip was coated was also stained with a Alexa-dye-conjugated secondary antibody. Single Z-plane images (upper panels) show the top part of the cell and the bottom synapse part (indicated in orange). Dashed lines (white) indicated the area of the average intensity Z-projections shown in the bottom panels. The position of the single Z-plane images shown in the upper panels is indicated with dashed lines (orange) labeled with ‘t’ (top z-plane) and ‘b’ (bottom z-plane, synapse). (J–K) Quantification of lysosome positioning relative to the synapse-coverslip interface in indicated conditions. The z-positions of lysosome clusters were analyzed by identifying the peak Lamtor4 fluorescence intensity per cell analyzed from an average intensity side-projection of the cell. Cumulative frequency distribution (J) shows the percentage of cells with fully polarized Lamtor4 clusters. A 2 μm threshold was used to distinguish successful (green area) from failed (red area) Lamtor4 cluster polarization events. Dot plot (K) shows all individual cells quantified in (J). n = 318, 284, 244, 216, and 281 cells from four independent experiments. ***p<0.001, ns = not significant (Mann-Whitney U test).
-
Figure 1—source data 1
An Excel sheet with numerical data on the quantification of indicated Jurkat cell lines analyzed for cell surface area, MT organization at the immunological synapse, and polarization of lysosomes toward the immunological synapse represented as plots (or cumulative frequency distribution for Figure 1J) in Figure 1E,G,J and K.
- https://cdn.elifesciences.org/articles/62876/elife-62876-fig1-data1-v2.xlsx
Figure 1—figure supplement 1
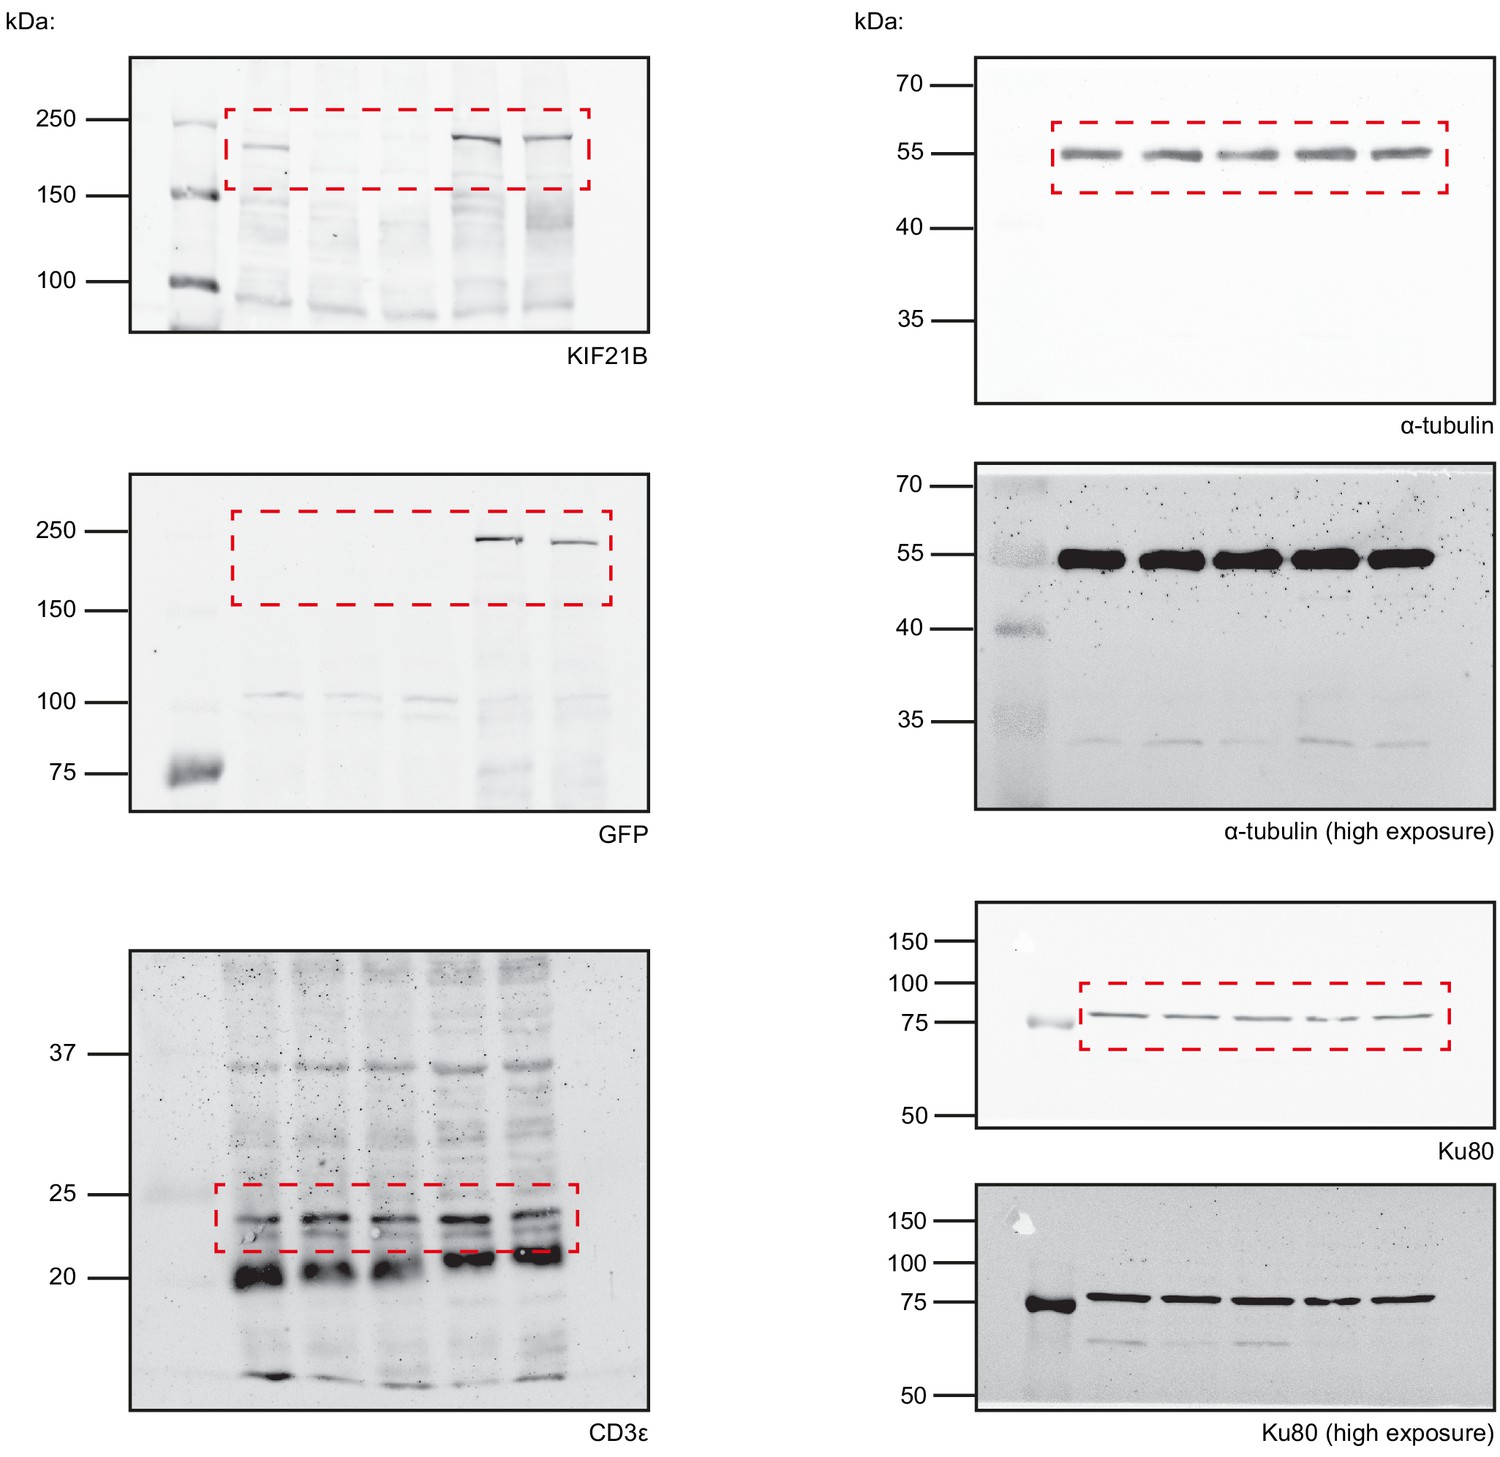
Scans of Western blot images corresponding to Figure 1C.
Areas used in Figure 1C are highlighted per blot (red). High exposure images for anti-tubulin and anti-Ku80 blots are included to make the blot background visible.
Figure 1—figure supplement 2
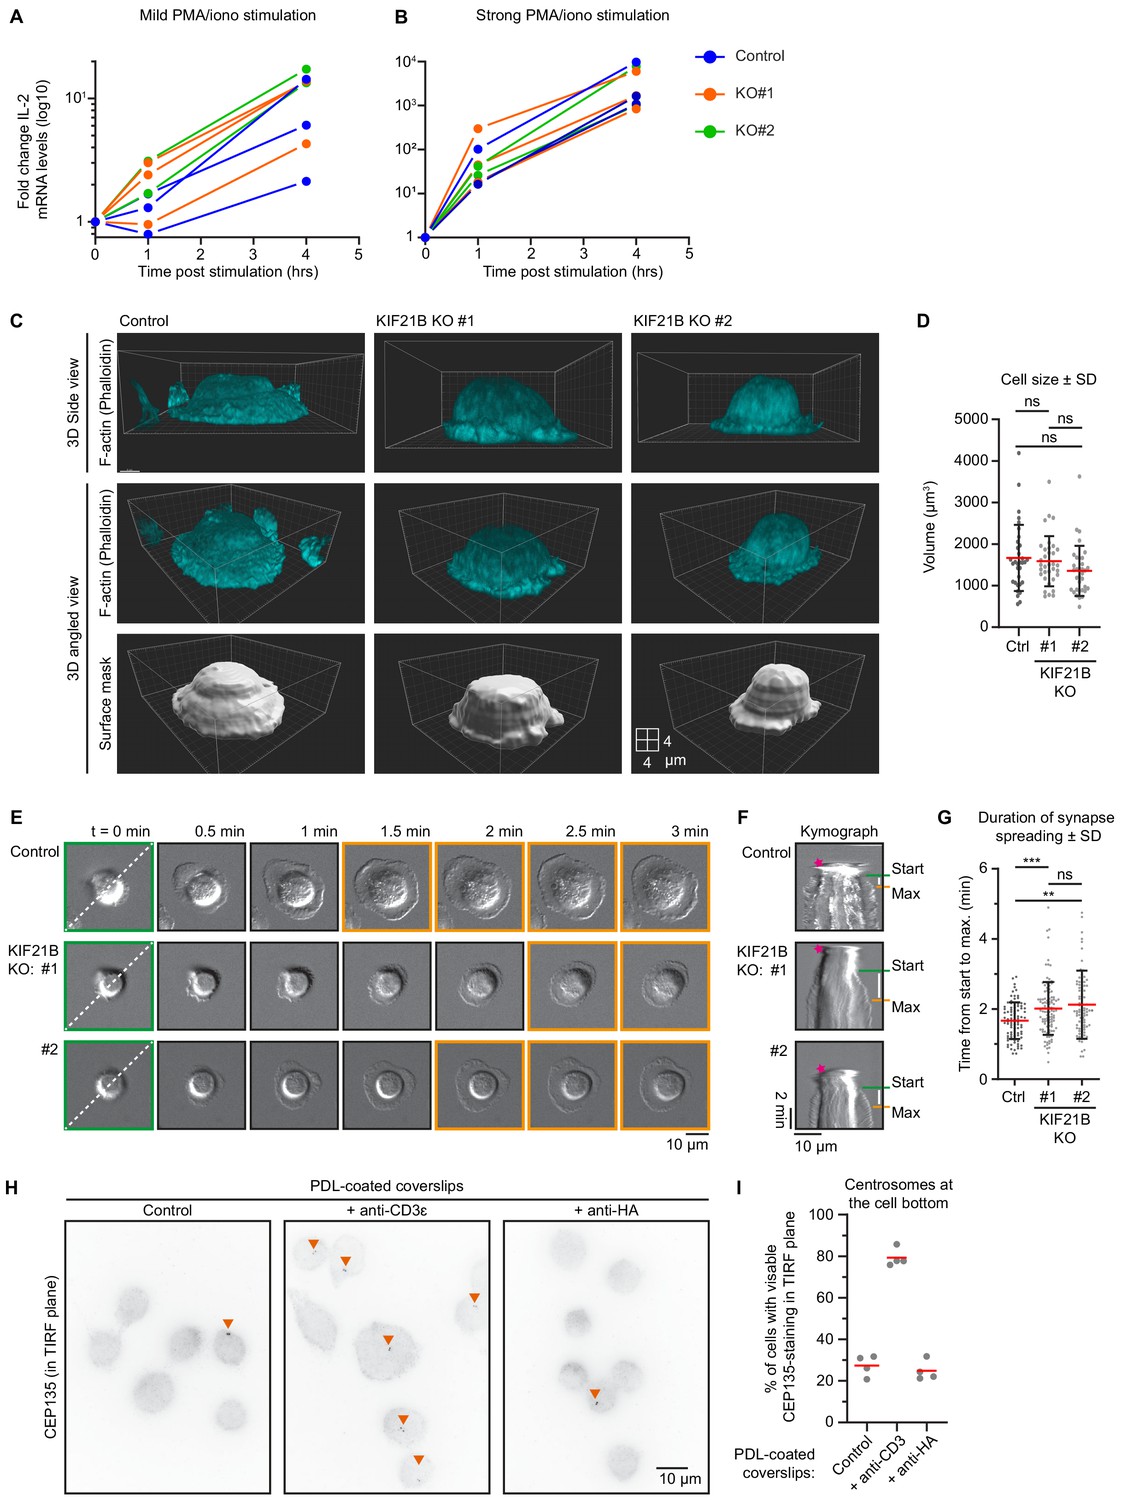
Characterization of KIF21B knockout cell lines.
(A–B) qRT-PCR measurements of IL-2 expression levels after stimulation at indicated timepoints. Indicated Jurkat T cell lines were treated with 2 ng/ml PMA and 100 ng/ml ionomycin (A, mild stimulation) or 20 ng/ml PMA and 1 µg/ml ionomycin (B, strong stimulation), after which RNA was isolated and cDNA was generated. IL-2 expression was measured by qRT-PCR, and values were normalized to GAPDH levels. IL-2 expression is shown in a log10 scale. (C) Volume rendering of indicated Jurkat T cells. Cells were added to poly-D-lysine-coated coverslips with immobilized anti-CD3 and fixed 10 min after incubation. Cells were stained for F-actin (using phalloidin). Side views (top panel row) and angled views (middle and bottom row) are indicated. Cell volume was measured by converting F-actin fluorescence signal to a surface mask using Imaris software (isoline tool). xyz dimensions correspond to 2 μm per block on the displayed grid. (D) Quantification of T cell volumes based on F-actin staining. n = 33, 34 and 34 cells from three independent experiments, ns = not significant (Mann-Whitney U test). (E) Live-cell imaging of indicated Jurkat T cells forming immunological synapses on Lab-Tek chambered coverglass with immobilized anti-CD3, imaged on a widefield microscope using DIC microscopy at 2.5 s per frame interval. Green boxed stills indicate start of synapse formation, orange boxed stills show fully formed synapses at their maximum size. Dotted line in the first movie still indicates the position of the kymograph in F. (F) Kymographs of immunological synapse formation corresponding to the movie stills shown in E. Landing of the Jurkat T cell on the anti-CD3-coated glass surface is marked by the pink asterisk. The start of synapse formation (Start) is indicated in green, the moment a synapse reaches its maximum size is indicated in orange (Max) and the white bar indicates time between Start and Max. (G) Quantification of spreading time. n = 87, 107, and 91 cells from two independent experiments. ***p=0.0009, **p=0.0018, ns = not significant (Mann-Whitney U test). (H) Immunostaining of Jurkat T cells incubated on poly-D-lysine-coated coverslips coated without or with indicated antibodies. Cells were stained for CEP135 and the bottom part of these cells were imaged on a TIRF microscope. (I) Quantification of centrosome localization in T cells after incubation on indicated coated surfaces. Cells were scored for the presence of CEP135-staining at the imaged TIRF plane indicating centrosome polarization. n = 4 experiments for all conditions. In total, 354, 310, and 311 cells were quantified per condition.
-
Figure 1—figure supplement 2—source data 1
An Excel sheet with numerical data on the quantification of indicated Jurkat cell lines analyzed for IL-2 expression levels after activation, total cell volume, and duration of immunological synapse formation represented as plots in Figure 1—figure supplement 2A, B, D and G.
- https://cdn.elifesciences.org/articles/62876/elife-62876-fig1-figsupp2-data1-v2.xlsx
Figure 2 with 4 supplements
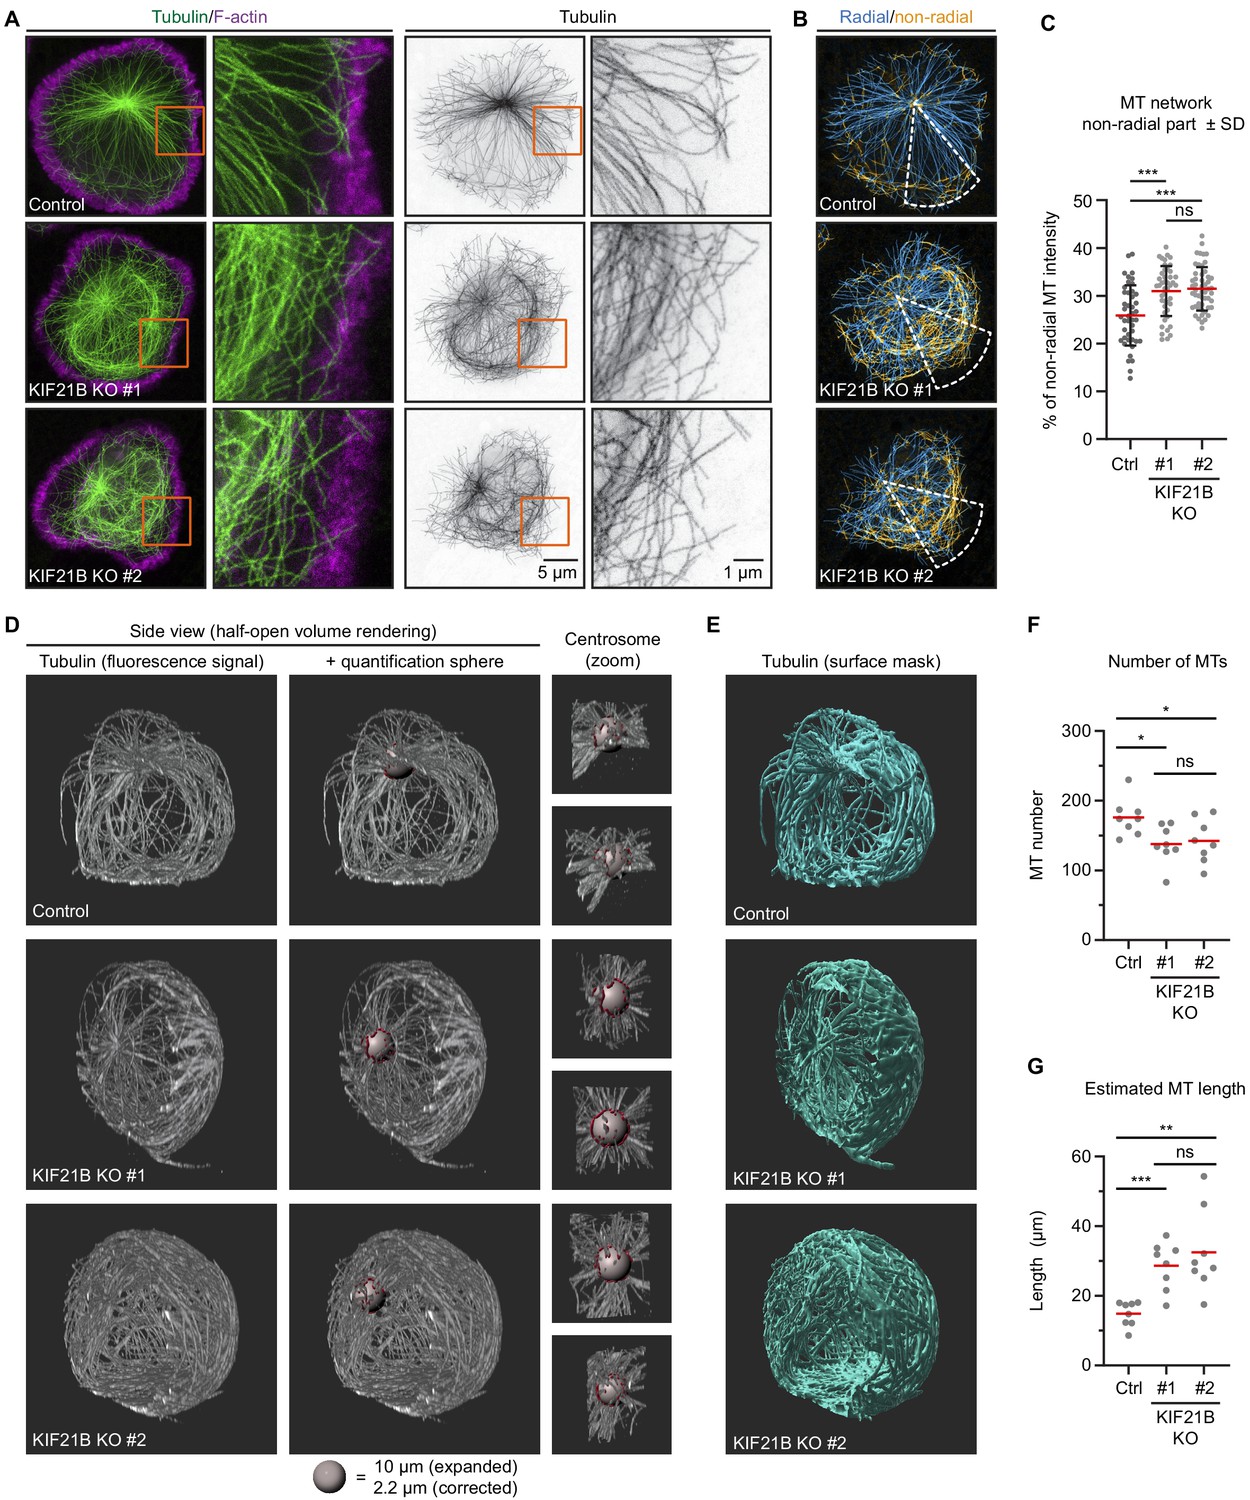
Knockout of KIF21B causes microtubule (MT) overgrowth in Jurkat cells.
(A–B) STED images of indicated Jurkat T cell lines. Cells were added to poly-D-lysine-coated coverslips with immobilized anti-CD3 and fixed 7 min after incubation. Cells were stained for α-tubulin and F-actin. Orange boxes indicate zoomed areas shown on the right. (B) Images were background subtracted and split into radial and non-radial components based on the MT orientation in relation to the centrosome. Radial intensity profiles were made from a 45° sector starting from the centrosome and directed toward the farthest removed portion of the cell periphery (white). The resulting heat maps were used to quantify the proportion of non-radially oriented MTs as described in Materials and methods. (C) Quantification of the proportion of non-radially oriented MTs analyzed per cell. n = 44, 45, and 52 cells from three independent experiments. ***p<0.001, ns = not significant (t test). (D–E) Volume renderings of indicated T cell lines stained for α-tubulin. T cells were fixed 2 min after activation on poly-D-lysine-coated coverslips with immobilized anti-CD3. Samples were expanded ~4.5 times following an Expansion Microscopy (ExM) protocol and MTs were imaged using on a confocal microscope. Imaris software was used to create volume renders and analysis. MTs emanating from the centrosome were analyzed using a spherical shell with a 10 μm inner diameter and a thickness of 1 μm (gray); filaments crossing the sphere are highlighted (red). Zooms of the centrosome are shown from two different angles. (E) Fluorescence signal was converted to a surface mask using Imaris software to analyze total tubulin intensity. Additional examples are shown in Figure 2—figure supplement 1B. (F) Quantification of the total number of MTs per cell emanating from the centrosome quantified at 5 μm distance from the centrosome of indicated Jurkat T cell lines. n = 8 cells for all conditions. From left to right: *p=0.0131, *p=0.0367, ns = not significant (t test). (G) Quantification of estimated MT length per cell in indicated Jurkat T cell lines. Fluorescence intensity of 1 μm filament length was measured for all MTs crossing a spherical shell of 1 um width with a 5 μm inner radius located around the centrosome, as shown in D. The average MT length per cell was calculated by correcting the total fluorescence intensity per cell by the number of MTs at the centrosome. n = 8 cells for all conditions. ***p=0.0002, **p=0.0013, ns = not significant (t test).
-
Figure 2—source data 1
An Excel sheet with numerical data on the quantification of indicated Jurkat cell lines analyzed for MT radiality at the immunological synapse and total 3D MT organization of Jurkat cells during polarization represented as plots in Figure 2C,F and G.
- https://cdn.elifesciences.org/articles/62876/elife-62876-fig2-data1-v2.xlsx
Figure 2—figure supplement 1
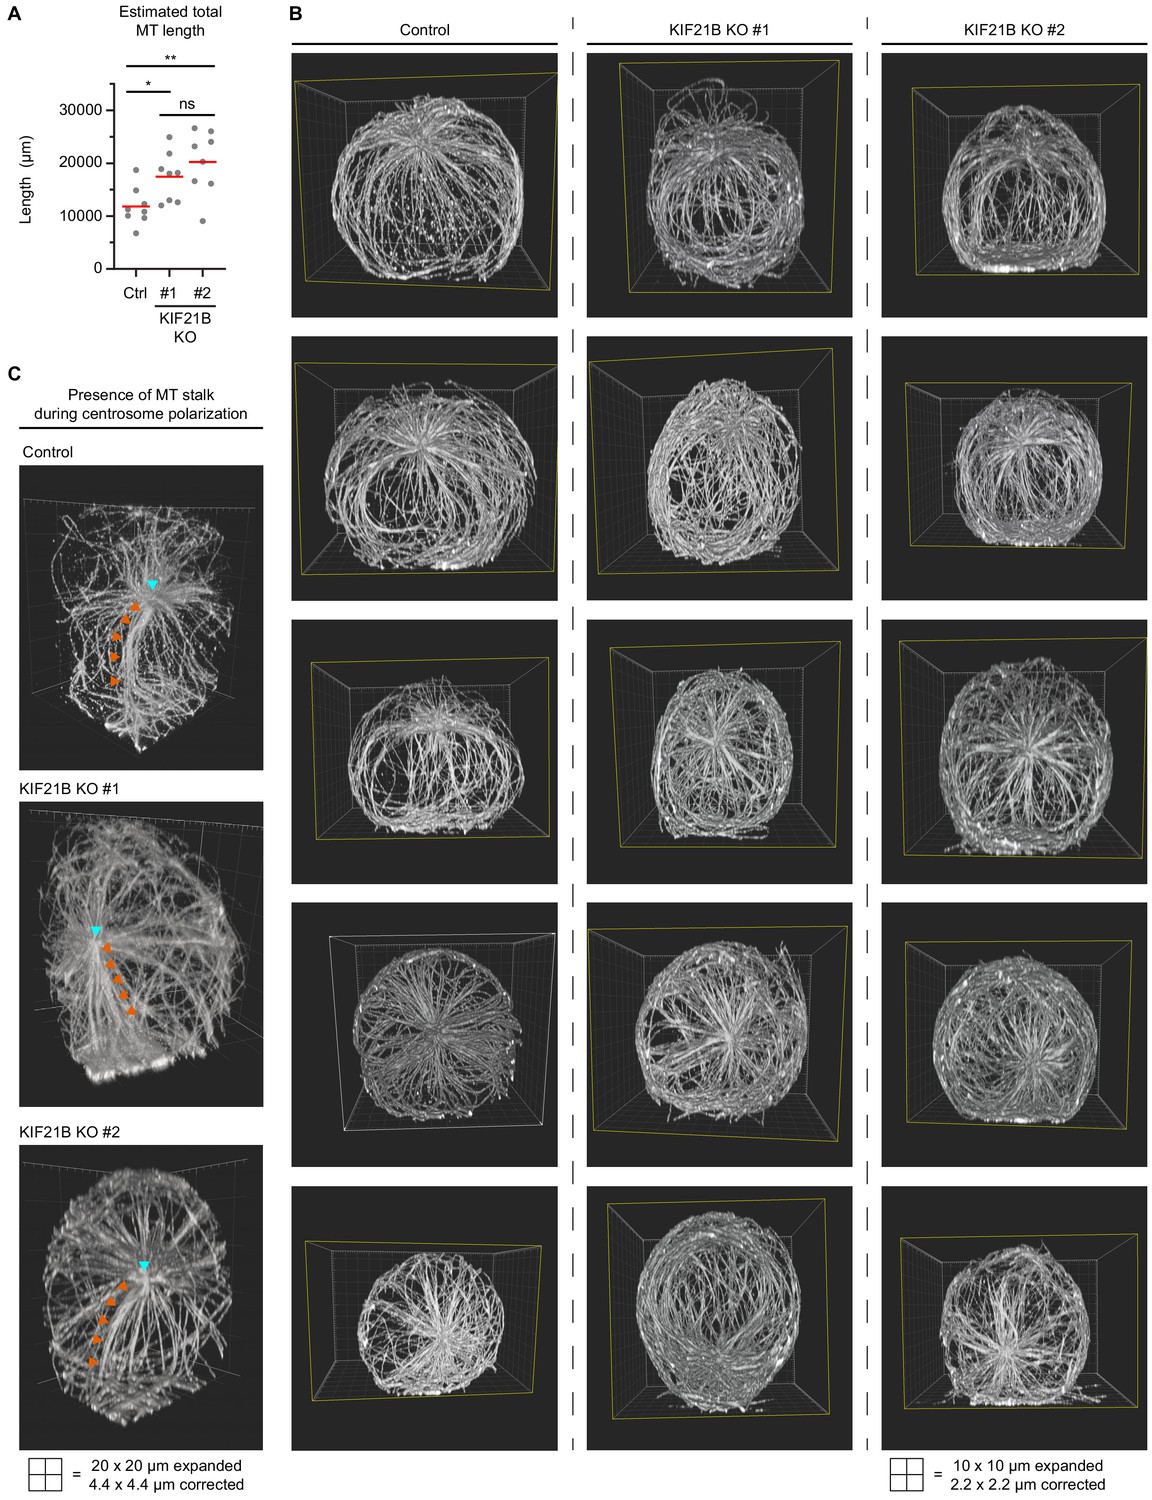
Characterization of microtubule (MT) network in polarizing T cells by Expansion Microscopy (ExM).
(A) Quantification of total estimated MT length per cell indicated in indicated Jurkat T cell lines. Values were obtained by multiplication of total MT numbers by the estimated average MT length per cell. n = 8 cells for all conditions. *p=0.0169, **p=0.0043, ns = not significant (t test). (B) Series of five exemplary volume renderings per indicated T cell lines stained for α-tubulin (related to Figure 2D, E). T cells were fixed 2 min after activation on poly-D-lysine-coated coverslips with immobilized anti-CD3. Samples were expanded ~4.5 times following an ExM protocol and MTs were imaged using on a confocal microscope. Imaris software was used to create volume renders. (C) Volume renderings of indicated T cell lines stained for α-tubulin to highlight examples suggesting that a MT stalk is formed during the process of centrosome polarization. Centrosome (cyan arrowheads) and MT stalks emanating from the centrosome toward the synapse are indicated (orange arrowheads).
-
Figure 2—figure supplement 1—source data 1
An Excel sheet with numerical data on the quantification of indicated Jurkat cell lines analyzed for total MT length in 3D of Jurkat cells during polarization represented as a plot in Figure 2—figure supplement 1A.
- https://cdn.elifesciences.org/articles/62876/elife-62876-fig2-figsupp1-data1-v2.xlsx
Figure 2—video 1
3D volume render of an Expansion Microscopy (ExM) imaged Jurkat control cell 2 min after activation.
Volume rendering of a control Jurkat cell fixed 2 min after activation on anti-CD3 coated coverslips stained for α-tubulin. Samples were isotropically expanded using an ExM protocol and imaged on a confocal microscope. Images were processed and analyzed using Imaris software. Microtubules emanating from the centrosome were analyzed using a spherical shell with a 5 μm inner radius, filaments crossing the sphere are highlighted (red). Every square in the grid corresponds to 5 × 5 μm post expansion. Example corresponds to Figure 2D–E.
Figure 2—video 2
3D volume render of an Expansion Microscopy (ExM) imaged Jurkat KIF21B-KO cell (KO #1) 2 min after activation.
Volume rendering of a KIF21B-KO Jurkat cell (KO #1) fixed 2 min after activation on anti-CD3-coated coverslips stained for α-tubulin. Samples were isotropically expanded using an ExM protocol and imaged on a confocal microscope. Images were processed and analyzed using Imaris software. Microtubules emanating from the centrosome were analyzed using a spherical shell with a 5 μm inner radius, filaments crossing the sphere are highlighted (red). Every square in the grid corresponds to 5 × 5 μm post-expansion. Example corresponds to Figure 2D–E.
Figure 2—video 3
3D volume render of an Expansion Microscopy (ExM) imaged Jurkat KIF21B-KO cell (KO #2) 2 min after activation.
Volume rendering of a control KIF21B-KO Jurkat cell (KO #2) fixed 2 min after activation on anti-CD3-coated coverslips stained for α-tubulin. Samples were isotropically expanded using an ExM protocol and imaged on a confocal microscope. Images were processed and analyzed using Imaris software. Microtubules emanating from the centrosome were analyzed using a spherical shell with a 5 μm inner radius, filaments crossing the sphere are highlighted (red). Every square in the grid corresponds to 5 × 5 μm post expansion. Example corresponds to Figure 2D–E.
Figure 3 with 2 supplements

KIF21B induces microtubule (MT) pausing and catastrophes in T cells.
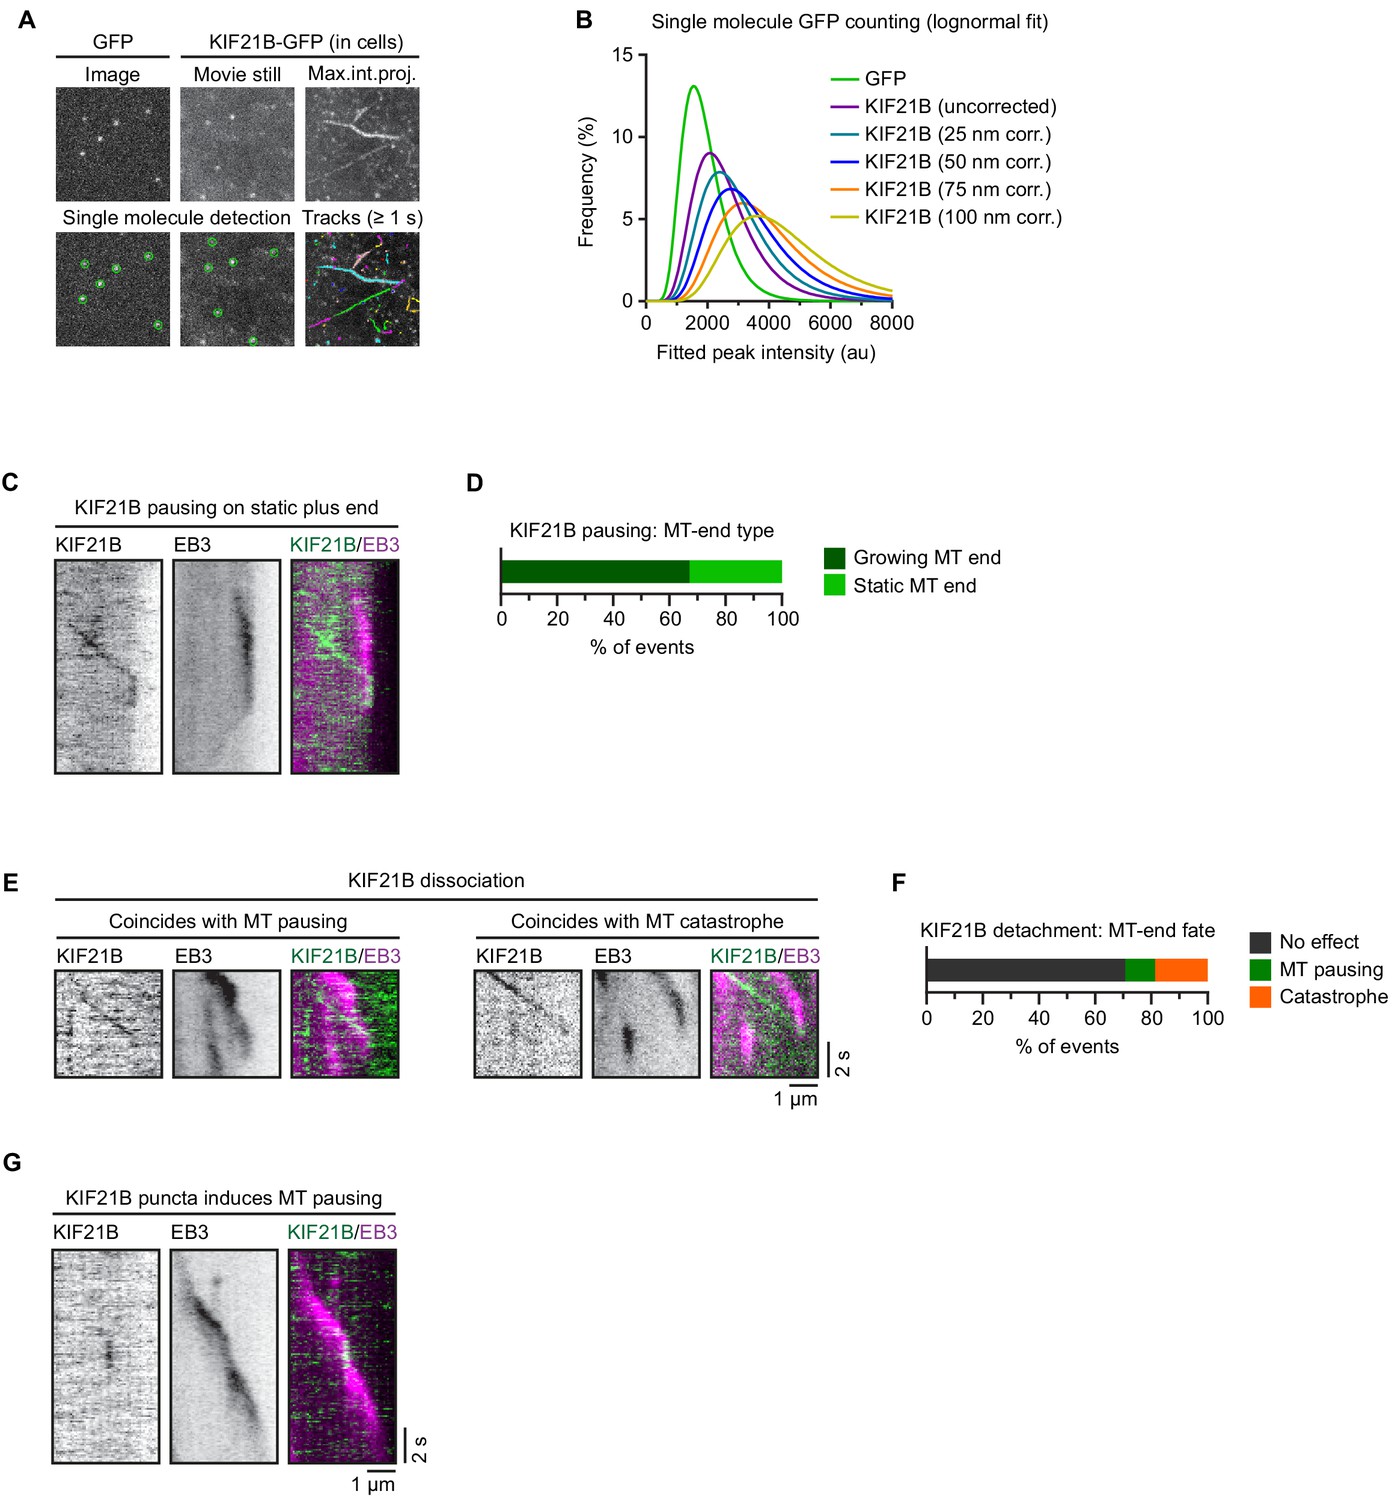
(A) Live imaging of indicated Jurkat KIF21B-KO T cells stably overexpressing KIF21B-GFP on Lab-Tek chambered coverglass with immobilized anti-CD3. Images show a single movie frame and a maximum intensity projection of a background-subtracted movie. Zoomed areas are indicated (orange), and the kinesin track corresponding to the kymograph shown is indicated with red arrowheads. (B) Frequency distribution of KIF21B-GFP velocity in cells measured from data obtained imaging of KIF21B-KO #2 Jurkat T cell line stably overexpressing KIF21B-GFP on a TIRF microscope at 10 fps. Velocities were measured by kymograph analysis and the numbers were fitted to a Gaussian (red curve). n = 464 events from 102 cells from four independent experiments. (C) Histograms (dots) of peak-fitted fluorescence intensities of monomeric GFP immobilized on glass (green dots) and KIF21B-GFP motors imaged in Jurkat T cells (blue/orange) in two separate chambers on the same coverslip and the corresponding lognormal fits (solid lines). Imaging conditions were identical for both samples. KIF21B-GFP intensity values were corrected for a 50 and 75 nm distance from the coverslip, as illustrated in Figure 3—figure supplement 1B. n = 2601 (GFP) and n = 16523 (6 cells) (KIF21B-GFP) molecules. Mean values relative to monomeric GFP are indicated in the plot. (D–I) Live-cell imaging of KIF21B-KO #2 Jurkat T cell line stably overexpressing KIF21B-GFP and transiently overexpressing EB3-mCherry to label growing MT plus ends. Cells were added on Lab-Tek chambered coverglass with immobilized anti-CD3 and imaged on a TIRF microscope at 10 fps. (D) Kymographs illustrating KIF21B-GFP motors switching from walking to a pausing state. Growing MTs are visualized by EB3-mCherry overexpression. Examples show a growing plus end that undergoes pausing after KIF21B-GFP arrival followed by a catastrophe event (left), or growth re-initiation when the pausing KIF21B-GFP dissociates (middle). Some plus ends are not affected by the KIF21B-GFP motor pause event (right). (E) Kymograph illustrating a KIF21B-GFP tip-tracking on a growing EB3-mCherry plus end followed by a pausing event of both KIF21B-GFP and the MT plus end. (F) Kymograph illustrating two KIF21B-GFP motors reaching a growing EB3-mCherry plus-end causing the motors to dissociate from the MT plus-end, which continues growing, though EB3-mCherry signal is reduced. (G) Quantification of KIF21B-GFP fates observed when a moving KIF21B motor reaches an EB3-mCherry-labeled MT plus end, as illustrated in D-F. n = 224 events from two independent experiments. (H) Quantification of MT plus-end fates when a KIF21B-GFP motor reaches a growing EB3-mCherry-labeled MT plus end and transitions to a paused state, as illustrated in D-F, Figure 3—figure supplement 1C. n = 149 events from two independent experiments. (I) Quantification of pause duration of KIF21B-GFP and EB3-mCherry-labeled MT plus ends, illustrated in G-H. n = 144 and 75 events from two independent experiments.
-
Figure 3—source data 1
An Excel sheet with numerical data on the quantification of KIF21B-GFP velocities, single-molecule analysis of KIF21B-GFP in Jurkat cells and the effects of single KIF21B-GFP molecules on growing microtubule ends in Jurkat cells represented as frequency distributions (Figure 3B), frequency distributions with lognormal fits (Figure 3C), and as plots (Figure 3G, H and I).
- https://cdn.elifesciences.org/articles/62876/elife-62876-fig3-data1-v2.xlsx
Figure 3—figure supplement 1
Characterization of KIF21B motility in cells.
(A) Workflow for GFP (monomer reference) and KIF21B-GFP single-molecule counting. Imaging was performed in a dual-chamber microscope slide in a single imaging session with identical microscope settings. Monomeric GFP was expressed in HEK293T cells and lysates were diluted in PBS to single-molecule densities in the first chamber. KIF21B-KO #2 Jurkat T cell line with stable overexpression of KIF21B-GFP were added to the second chamber, which was coated with anti-CD3 antibodies. Single molecules were detected using DoM ImageJ plugin and for KIF21B-GFP motors in cells, single molecules were only analyzed from kinesin tracks with a duration of >1 s. (B) Lognormal fits of peak-fitted fluorescence intensities of monomeric GFP immobilized on glass (green dots) and KIF21B-GFP motors imaged in Jurkat T cells corrected for a hypothetical range of distances between molecule and coverslip. The evanescent field decays exponentially and KIF21B-GFP fluorescence is corrected for that given the TIRF laser angle was fixed at a penetration depth d of 180 nm. (C) Kymograph illustrating KIF21B-GFP motors switching from walking to a pausing state. Growing microtubule (MT) end is visualized with EB3-mCherry. A static plus end undergoes a catastrophe after a KIF21B-GFP pausing event (right). (D) Quantification of MT plus-end state when a KIF21B-GFP motor reaches the EB3-mCherry-labeled MT plus end and transitions to a paused state, as illustrated in Figure 3D and C. Numbers relate to the ‘Pausing’ and ‘Tip-tracking + pausing’ category of Figure 3G. n = 149 events from two independent experiments. (E) Kymographs illustrating a KIF21B-GFP motor reaching a growing EB3-mCherry MT plus end where motor dissociation from the MT coincides with MT pausing (left) or a catastrophe event (right). (F) Quantification of MT plus-end fate when a KIF21B-GFP motor reaches a growing EB3-mCherry-labeled plus end and dissociates, as illustrated in Figure 3F, E. n = 75 events from two independent experiments. (G) Kymograph illustrating a KIF21B-GFP motor directly associating to an EB3-mCherry-labeled growing MT plus end and affecting MT growth until KIF21B-GFP dissociates.
-
Figure 3—figure supplement 1—source data 1
An Excel sheet with numerical data on the quantification of single-molecule analysis of KIF21B-GFP in Jurkat cells and the effects of single KIF21B-GFP molecules on growing microtubule ends in Jurkat cells represented as a lognormal data fit (Figure 3—figure supplement 1B) and as plots (Figure 3—figure supplement 1B and F).
- https://cdn.elifesciences.org/articles/62876/elife-62876-fig3-figsupp1-data1-v2.xlsx
Figure 3—video 1
KIF21B-GFP motors imaged at the immunological synapse of an activated Jurkat T cell.
Live imaging of a Jurkat KIF21B-KO T cell (KO #2) stably overexpressing KIF21B-GFP. Video corresponds to Figure 3A. Images were collected using a TIRF microscope at 10 frames per second. Video is sped up two times to 20 frames per sec. Time is shown in seconds.
Figure 4 with 1 supplement
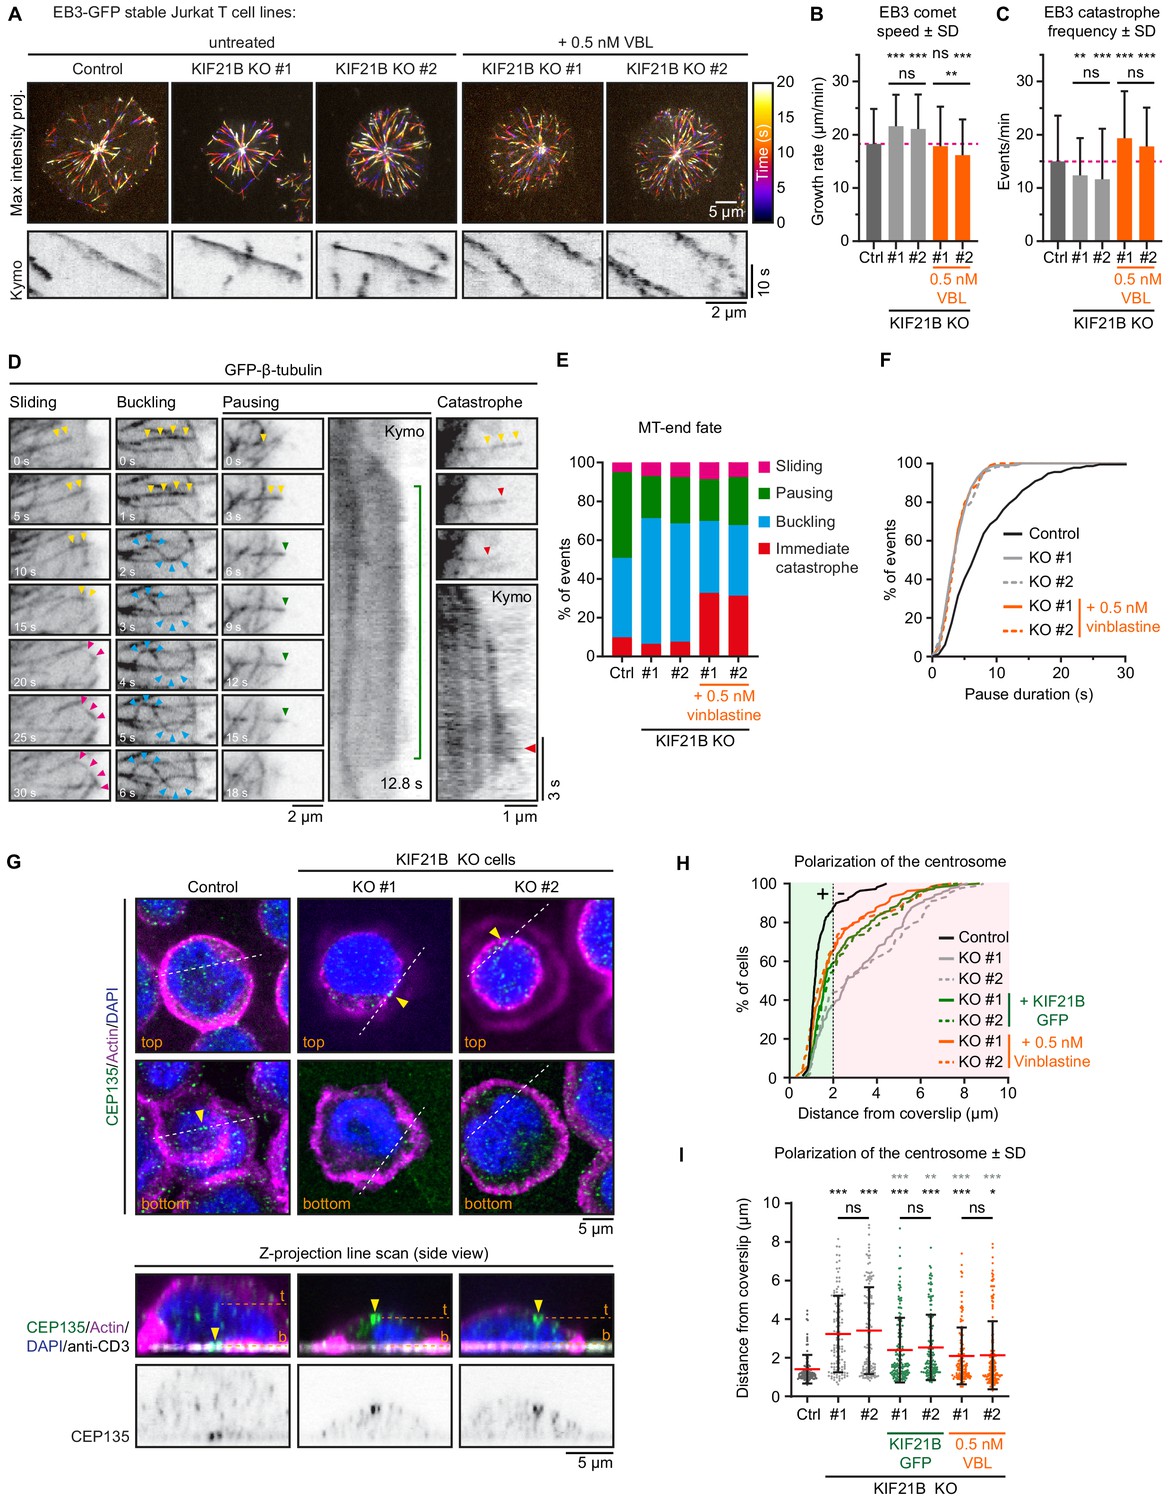
Mild inhibition of MT growth with vinblastine rescues centrosome repositioning in KIF21B-KO cells.
(A) Live-cell imaging of indicated EB3-GFP overexpressing Jurkat T cell lines. Cells were added to Lab-Tek chambered coverglass with immobilized anti-CD3 and imaged on a TIRF microscope at 2.5 fps. Color-coded maximum intensity projections and illustrative kymographs of growing EB3-GFP comets are shown per condition. KIF21B-KO cells were untreated or treated with 0.5 nM vinblastine 30 min prior to imaging as indicated. A scale for the time-dependent color-coding is indicated on the right. (B) Quantification of MT growth rates determined from imaging EB3-GFP in indicated Jurkat T cell lines. Dashed line (magenta) indicates the average growth rate for control cells. n = 470, 478, 250, 255, and 267 events from three independent experiments. **p=0.0024, ***p<0.001, ns = not significant (Mann-Whitney U test). (C) Quantification of MT catastrophe frequencies determined from imaging EB3-GFP in indicated Jurkat T cell lines. Dashed line (magenta) indicates the average catastrophe frequency for control cells. n = 178, 178, 170, 205, and 173 events from two independent experiments. **p=0.0029, ***p<0.001, ns = not significant (Mann-Whitney U test). (D) Live-cell imaging of β-tubulin-GFP overexpressing Jurkat T cell lines. Cells were added on Lab-Tek chambered coverglass with immobilized anti-CD3 and imaged on a TIRF microscope at 10 fps. Movie stills and kymographs show examples of MTs that undergo sliding (pink arrowheads), buckling (cyan arrowheads), pausing (green arrowheads), or catastrophe (red arrowheads) after reaching the cell periphery. Yellow arrowheads indicate growing MTs before the highlighted events take place. Kymographs show the corresponding MT pausing and catastrophe events; the catastrophe initiation (red arrowhead) and total pause time (green line) are indicated. (E) Quantification of MT plus-end fates after reaching the cell periphery based on live-cell imaging of indicated β-tubulin-GFP overexpressing Jurkat T cell lines. n = 518, 508, 477, 544, and 409 events from 46, 49, 38, 37, and 32 cells obtained from three independent experiments. (F) Cumulative frequency distribution shows pause duration of events quantified in E based on live-cell imaging of indicated β-tubulin-GFP overexpressing Jurkat T cell lines. A quantification of these data is shown in Figure 4—figure supplement 1A. n = 229, 110, 114, 117, and 101 events from 46, 49, 38, 37, and 32 cells obtained from three independent experiments. (G) Confocal images of indicated Jurkat T cells. Cells were added to poly-D-lysine-coated coverslips with immobilized anti-CD3 and fixed 10 min after incubation. Cells were stained for CEP135, F-actin and DAPI. In addition, the anti-CD3 antibody with which the coverslip was coated was also stained with a Alexa-dye-conjugated secondary antibody. Single Z-plane images (upper panels) show the top part of the cell and the bottom synapse part. White dashed lines indicate the position of the average intensity Z-projections shown in the bottom panels. Yellow arrowheads indicate the position of the CEP135-positive centriole staining. The positions of the single Z-plane images shown in the upper panels are indicated with dashed lines (orange) labeled with ‘t’ (top z-plane) and ‘b’ (bottom z-plane, synapse). (H–I) Quantification of CEP135 distance from the synapse-coverslip interface for indicated conditions. Cumulative frequency distribution (H) shows the percentage of cells with fully polarized centrosomes. A 2 μm threshold was used to distinguish successful (green area) from failed (red area) centrosome polarization events. Dot plot (I) shows the distance values for individual cells quantified in (H). n = 109, 119, 132, 150, 150, 133, and 175 cells from three independent experiments. Comparison with control (black stars): *p=0.0187, ***p<0.001, ns = not significant (Mann-Whitney U test). Comparison with related KIF21B KO condition (gray stars): **p=0.0042, ***p<0.001, ns = not significant (Mann-Whitney U test).
-
Figure 4—source data 1
An Excel sheet with numerical data on the quantification of indicated Jurkat cell lines for MT dynamics parameters and centrosome polarization toward the immunological synapse represented as plots (Figure 4B, C, E and I) and cumulative frequency distributions (Figure 4F and H).
- https://cdn.elifesciences.org/articles/62876/elife-62876-fig4-data1-v2.xlsx
Figure 4—figure supplement 1
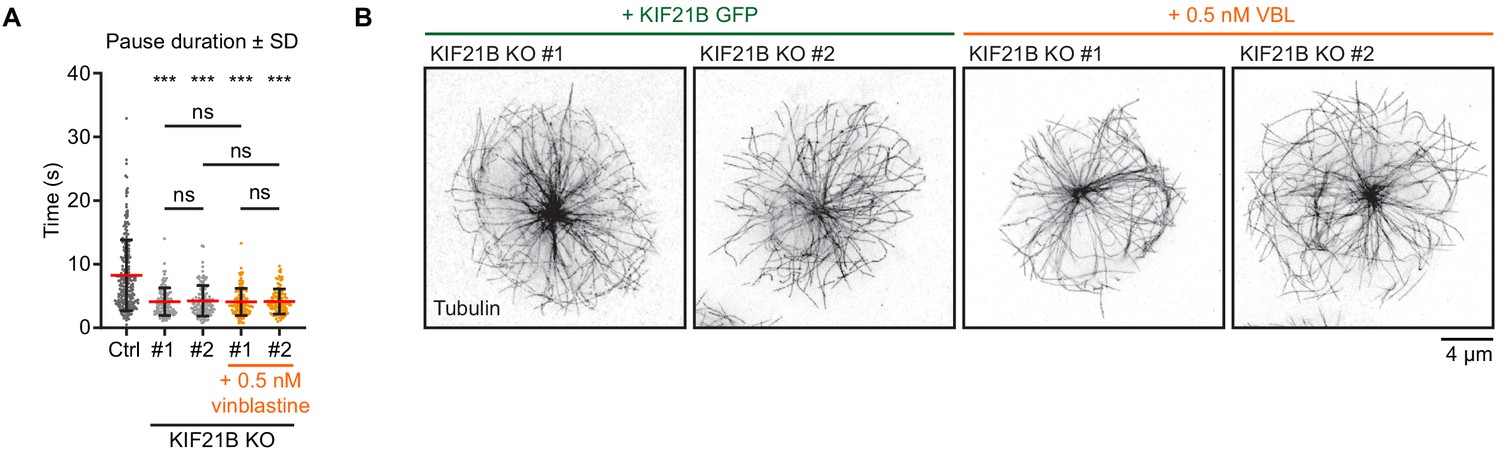
KIF21B-depleted cells lack long MT pause events.
(A) Quantification of MT pause duration as shown in Figure 4F based on live-cell imaging of indicated β-tubulin-GFP overexpressing Jurkat T cell lines. Pause durations are derived from MT pausing events described in Figure 4D and E. n = 229, 110, 114, 117, and 101 events from 46, 49, 38, 37, and 32 cells obtained from three independent experiments. ***p<0.001, ns = not significant (Mann-Whitney U test). (B) STED images of indicated Jurkat T cell lines. Cells were added to poly-D-lysine-coated coverslips with immobilized anti-CD3 and fixed 7 min after incubation. Cells were stained for tubulin.
-
Figure 4—figure supplement 1—source data 1
An Excel sheet with numerical data on the quantification of indicated Jurkat cell lines for MT pause durations represented as a plot in Figure 4—figure supplement 1A.
- https://cdn.elifesciences.org/articles/62876/elife-62876-fig4-figsupp1-data1-v2.xlsx
Figure 5 with 1 supplement
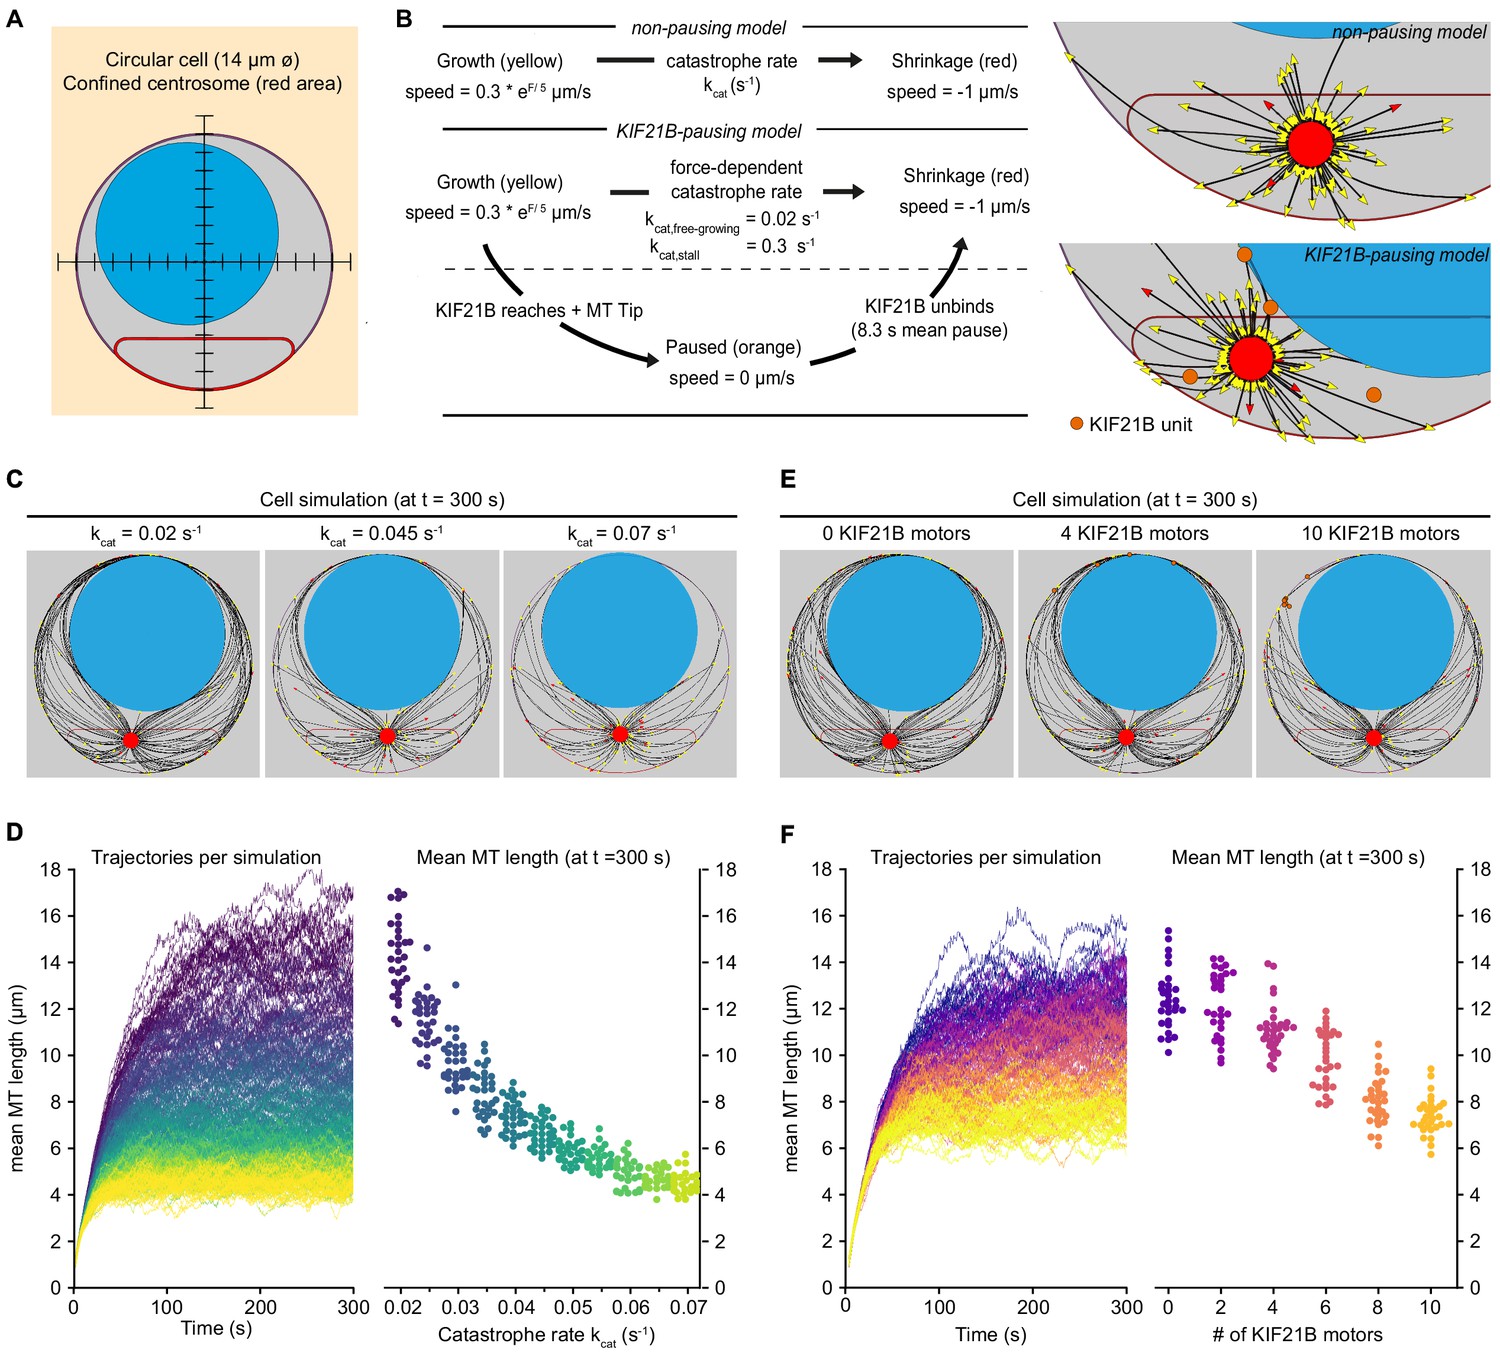
Biophysical simulation shows how KIF21B affects MT network length.
(A) A T cell is modeled as a circular cell with a nucleus (light blue) and centrosome confinement space (red). The cell is 14 µm in diameter, the nucleus is 10 µm in diameter. (B) Description of modeled microtubule dynamics using two models: a non-pausing model with MTs undergoing force-dependent growth and transitioning to depolymerization stochastically with a constant catastrophe rate, and a KIF21B-pausing model, in which MT growth and catastrophe are dependent on the antagonistic force exerted on the fiber’s tip. Cropped snapshots of the initial state of the non-pausing model (left, catastrophe rate = 0.045 s−1) and KIF21B-pausing model (right, 10 KIF21B motors) are shown. Growing MT plus ends are indicated by yellow arrowheads, depolymerizing MT plus ends are indicated by red arrowheads, and KIF21B units by orange circles. (C) Snapshots of the non-pausing model after 300 s for different values of catastrophe rate: 0.02 s−1 (left), 0.045 s−1 (middle), and 0.07 s−1 (right). (D) Trajectories (left) showing mean MT length per simulated cell over a 300 s time period. Traces are colored according to the catastrophe rate (from kcat = 0.02 to 0.07 s−1). Quantification (right) displaying mean MT length per simulated cell at steady state (t = 300 s) for indicated values of the catastrophe rate (kcat). n = 30 simulated cells per condition. (E) Snapshots of the KIF21B-pausing model after 300 s for different numbers of KIF21B motors: 0 (left), 4 (middle), and 10 (right). (F) Trajectories (left) showing mean MT length per simulated cell over a 300 s time period. Traces are colored according to the number of KIF21B motors present (ranging from 0 to 10 motors). Quantification (right) displaying mean MT length per simulated cell at steady state (t = 300 s) for indicated number of KIF21B motors. n = 30 simulated cells per condition.
-
Figure 5—source data 1
A CSV file with numerical data of represented trajectories as plotted in Figure 5D, left panel.
The mean MT length of the represented plot is obtained from each trajectory for every 0.4 s of simulation.
- https://cdn.elifesciences.org/articles/62876/elife-62876-fig5-data1-v2.zip
-
Figure 5—source data 2
A CSV file with numerical data of mean MT length at time t = 300 s as plotted in Figure 5D, right panel.
Values were obtained from the trajectories represented in the left panel of Figure 5D.
- https://cdn.elifesciences.org/articles/62876/elife-62876-fig5-data2-v2.zip
-
Figure 5—source data 3
A CSV file with numerical data of represented trajectories as plotted in Figure 5F, left panel.
The mean MT length of the represented plot is obtained from each trajectory for every 0.4 s of simulation.
- https://cdn.elifesciences.org/articles/62876/elife-62876-fig5-data3-v2.zip
-
Figure 5—source data 4
A CSV file with numerical data of mean MT length at time t = 300 s as plotted in Figure 5F, right panel.
Values were obtained from the trajectories represented in the left panel of Figure 5F.
- https://cdn.elifesciences.org/articles/62876/elife-62876-fig5-data4-v2.zip
Figure 5—figure supplement 1
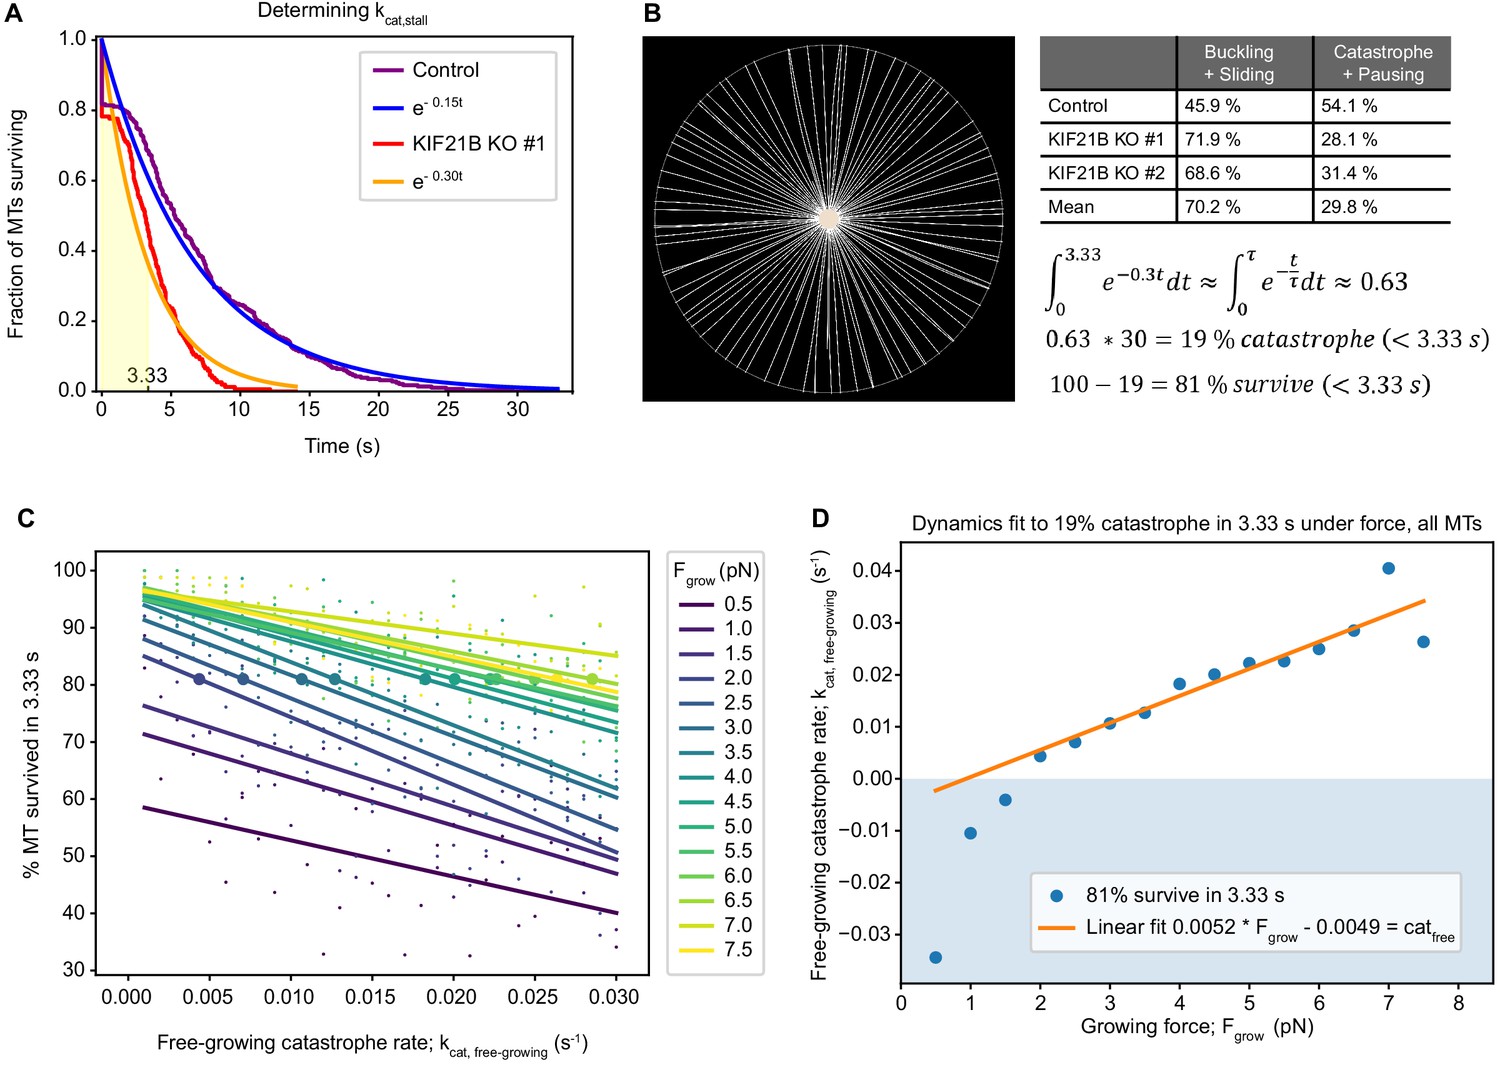
Characterization of T cell force-dependent catastrophe.
(A) Reverse cumulative distribution plot showing MT pause times for KIF21B-KO and control with the immediate catastrophes at t = 0 s. The exponential fit (rate = mean pause time−1) corresponds to a catastrophe rate of 0.3 s−1 in the KIF21B-KO and 0.15 s−1 in the control. From the assumption that all pausing in the KIF21B-KO cells is from antagonistic force, the stalled catastrophe rate kcat,stall can be set to 0.3 s−1. From this rate follows a characteristic time of 3.33 s (shaded area). (B) To match the parametrization of the MT dynamics to the experimental data, a Cytosim model is introduced that describes the fully spread synapse for the KO condition. The space is meant to model the TIRF data of KIF21B-KO synapses after they have spread, thus the cell has a radius of 9.57 µm and no nucleus. For ease of measurement, the centrosome is fixed in the center of the cell. From the stalled catastrophe rate of 0.3 s−1 follows that 63% of all catastrophe events happen in the first 3.33 s. From the experimental data, it is known that only approximately 30% of the counted paused KIF21B-KO MTs (under force) do not buckle or slide, but they are counted into the fraction of catastrophe events. Taking 30% of the 63% gives us 19%: the percentage of catastrophe in 3.33 s. Therefore, we can use the constraint that 81% of MTs survive under force for 3.33 s in our synapse model to match the two-state model to our KIF21B-KO pause times. (C) Graph showing the number of surviving MTs in 3.33 s under force at indicated free-growing catastrophe rates (kcat,free-growing) and characteristic force exerted by the MT polymerization growth (Fgrow). Measurements (small dots) and linear fits (lines) are color coded for the value of Fgrow (see legend). The large dots on the lines indicate the level at which 81% of the MTs survive, taken from the linear fit. (D) Graph showing points (blue) from C at which 81% MT survive in the synapse plotted as a function of the free catastrophe rate (kcat,free-growing) and of the growing force (Fgrow). A catastrophe rate is obtained from a linear fit (orange line) to the realistic, non-negative points, which gives a linear relationship between Fgrow and kcat,free-growing, where MT dynamics match that the KIF21B-KO cells.
-
Figure 5—figure supplement 1—source data 1
A CSV file with numerical data of the fraction of MT surviving as a function of time.
The analytical functions are indicated, and the experimental data is represented as a reverse cumulative distribution as plotted in Figure 5—figure supplement 1A.
- https://cdn.elifesciences.org/articles/62876/elife-62876-fig5-figsupp1-data1-v2.zip
-
Figure 5—figure supplement 1—source data 2
A CSV file with numerical data of MT surviving under force as a function of catastrophe rates for different MT forces exerted by polymerization.
This data is represented in Figure 5—figure supplement 1C.
- https://cdn.elifesciences.org/articles/62876/elife-62876-fig5-figsupp1-data2-v2.zip
-
Figure 5—figure supplement 1—source data 3
A CSV file with numerical data of the free catastrophe rate as a function of the growing force, used to obtain a linear fit and represented in Figure 5—figure supplement 1D.
- https://cdn.elifesciences.org/articles/62876/elife-62876-fig5-figsupp1-data3-v2.zip
Figure 6 with 3 supplements
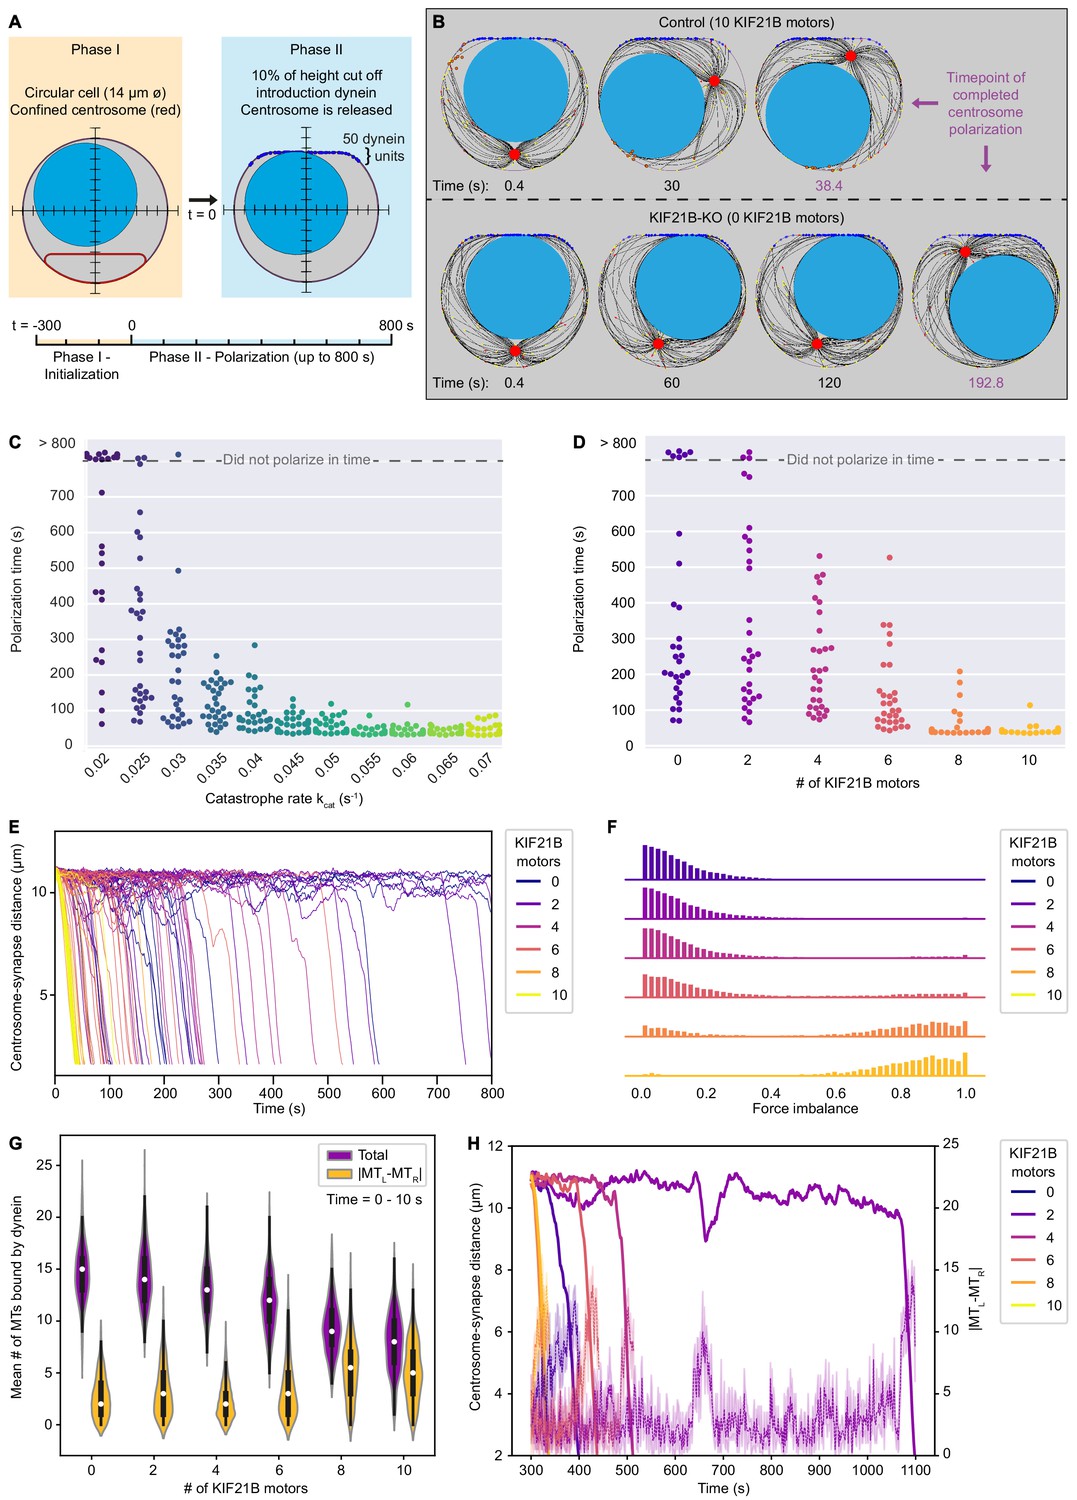
KIF21B prevents centrosome stalling induced by force balance during polarization by limiting MT length.
(A) The T cell model is initialized to a steady state MT network in 300 s (Phase I) and is then extended to a polarizing model (Phase II). In this transition, the cell shape is changed to include a flat side with curved corners with 50 dynein units attached, and the centrosome confinement (red) is released to allow centrosome movement and translocation. (B) Snapshots of modeled T cells during centrosome polarization in the KIF21B-pausing model with the presence of 10 (top row) or 0 (bottom row) KIF21B motors. The simulations were stopped after the centrosomes reached a polarized position <2.5 µm away from the synapse. The final snapshot in each row indicates the frame of the simulation when the centrosome was fully polarized. Timepoints are indicated below each snapshot. (C) Quantification of polarization time (the time the centrosome needs in Phase II to reach a polarization position) per simulated cell for the non-pausing model at indicated catastrophe rates. Some cells did not polarize within the maximum simulation time (800 s) as indicated in the upper part of the graph. n = 30 simulated cells per condition. (D) Quantification of polarization time (the time the centrosome needs in Phase II to reach a polarization position) per simulated cell for the KIF21B-pausing model with indicated numbers of KIF21B motors present. Some cells did not polarize within the maximum simulation time (800 s) as indicated in the upper part of the graph. n = 30 simulated cells per condition. (E) Trajectories showing the centrosome-synapse distance during Phase II over time along the vertical axis of the simulated T cell. Trajectories are color coded for the number of KIF21B motors present (see legend). Shown are 15 runs per condition. (F) Quantification of force imbalance within the KIF21B-pausing model. Force imbalance is calculated from the forces experienced by dynein at a given time point, projected on the horizontal axis. Force imbalance was characterized as the absolute difference of projected forces pointing to the left and forces pointing to the right, normalized by the sum of all forces. This quantity is determined for each timestep between 0 and the polarization time for every repeat and binned to create the according histogram. Histograms are color coded for the number of KIF21B motors present in the simulation (see legend). n = 30 simulated cells per condition. (G) Quantification of the mean number of MTs that are bound by dynein to the synapse within the KIF21B-pausing model. Violin plot distributions show the total number of MTs bound (purple), and the absolute difference (|MTL-MTR|, yellow) between the number of MTs bound on the right versus left side of the cell’s vertical axis. Within each violin, a boxplot indicates the quartiles (black) with the inner quartile range (25–75%) indicated with the thickened region. Median values are indicated for each violin (white dot). Values were obtained in the first 10 s of Phase II of each simulation. n = 30 simulated cells per condition. (H) Trajectories of centrosome-synapse distance over time (solid lines) plotted together with trajectories of the absolute difference |MTL-MTR| between the number of MT bound to dynein and passing the nucleus on the left or on the right (dashed lines) in the same color for the corresponding runs. To make the |MTL-MTR| more legible, the mean and 95% confidence interval is plotted averaged over three frames (1.2 s). Trajectories are color coded for the number of KIF21B motors present in the simulation (see legend).
-
Figure 6—source data 1
A CSV file with numerical data of polarization time as a function of catastrophe rates represented in Figure 6C.
- https://cdn.elifesciences.org/articles/62876/elife-62876-fig6-data1-v2.zip
-
Figure 6—source data 2
A CSV file with numerical data of polarization time as a function of the numbers of KIF21B motors represented in Figure 6D.
- https://cdn.elifesciences.org/articles/62876/elife-62876-fig6-data2-v2.zip
-
Figure 6—source data 3
A CSV file with numerical data of the distance from the centrosome to the synapse as a function of time for different numbers of KIF21B motors, shown in Figure 6E.
- https://cdn.elifesciences.org/articles/62876/elife-62876-fig6-data3-v2.zip
-
Figure 6—source data 4
A CSV file with numerical data of force imbalance per time trace and per time point for different numbers of KIF21B motors, as plotted in Figure 6F.
- https://cdn.elifesciences.org/articles/62876/elife-62876-fig6-data4-v2.zip
-
Figure 6—source data 5
A CSV file with numerical data of the mean numbers of MT bound to dynein for different numbers of KIF21B motors, as shown in Figure 6G.
- https://cdn.elifesciences.org/articles/62876/elife-62876-fig6-data5-v2.zip
-
Figure 6—source data 6
A CSV file with numerical data of time traces of the centrosome-synapse distance and time traces of the difference between the number of MTs bound by dynein passing along the right and the left side of the nucleus.
The data is given for different numbers of KIF21B motors and shown in Figure 6H.
- https://cdn.elifesciences.org/articles/62876/elife-62876-fig6-data6-v2.zip
Figure 6—figure supplement 1
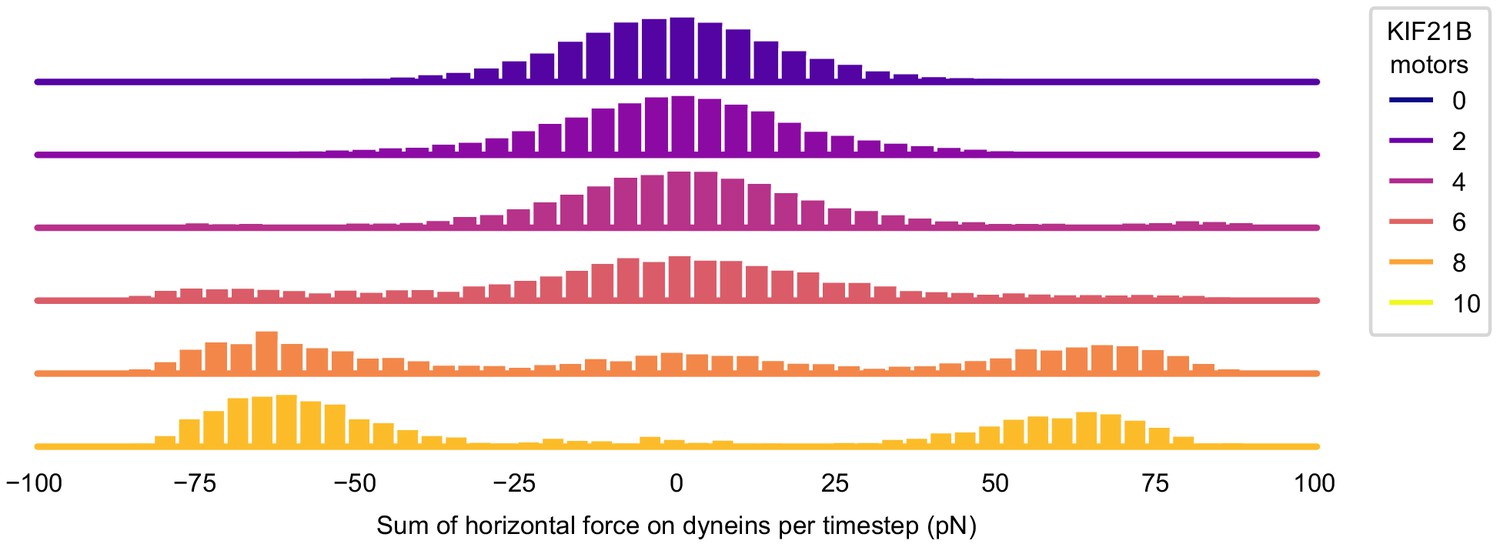
KIF21B affects the balance of force in T cell polarization.
Histogram showing the force on dynein at every timestep. The forces on dynein along the x-axis are summed, where left-pointing forces are taken as negative. This sum is taken for every recorded time between 0 and the polarization time of the simulation and binned to create histograms. Histograms are color coded for the number of KIF21B motors present in the simulation (see legend).
-
Figure 6—figure supplement 1—source data 1
A CSV file with numerical data of summed horizontal forces on dynein per time trace and per time point for different numbers of KIF21B motors, as shown in Figure 6—figure supplement 1.
Appendix 1—table 1. Parameters used for simulations.
- https://cdn.elifesciences.org/articles/62876/elife-62876-fig6-figsupp1-data1-v2.zip
Figure 6—video 1
Recording of a simulated T cell in the ‘non-pausing’ model with 10 KIF21B motors added.
The T cell simulation consists of two phases. At first, the model is initialized to a steady state MT network in the first 300 s, during which the centrosome is confined to the red box at one side of the T cell. Next, the cell shape is changed to include 50 membrane-anchored dynein motors (blue) at a flat immunological synapse surface, and centrosome confinement is released to allow centrosome translocation. KIF21B motors are included throughout the entire simulation (orange). Snapshots of this run are shown in Figure 6B (upper row). Growing MT plus ends are indicated by yellow arrowheads, depolymerizing MT plus ends are indicated by red arrowheads, and KIF21B units by orange circles.
Figure 6—video 2
Recording of a simulated T cell in the ‘non-pausing’ model with 0 KIF21B motors added.
The T cell simulation consists of two phases. At first, the model is initialized to a steady state MT network in the first 300 s, during which the centrosome is confined to the red box at one side of the T cell. Next, the cell shape is changed to include 50 membrane-anchored dynein motors (blue) at a flat immunological synapse surface, and centrosome confinement is released to allow centrosome translocation. Snapshots of this run are shown in Figure 6B (bottom row). Growing MT plus ends are indicated by yellow arrowheads and depolymerizing MT plus ends are indicated by red arrowheads.
Figure 7

Overview of the experimental results and a model of centrosome polarization in T cells.
Centrosome polarization in T cells is driven by dynein attached to the immunological synapse. KIF21B is a pausing and catastrophe-promoting factor that limits MT growth in T cells; its depletion results in MT overgrowth. Cells with overly long MTs experience difficulties in centrosome polarization. Reexpression of KIF21B-GFP or the application of a low-dose of MT-targeting agent vinblastine restores the centrosome polarization. Computational modeling suggests that an imbalance in MT pulling forces drives the centrosome movement along the nucleus. Overly long MTs create additional connections to the synapse, resulting in a balance of pulling forces on the two sides of the nucleus, thereby hindering centrosome translocation. Overly long MTs may also directly inhibit force generation by dynein at the synapse.
Tables
Appendix 1—key resources table
| Reagent type (species) or resource | Designation | Source or reference | Identifiers | Additional information |
|---|---|---|---|---|
| Cell line (Homo sapiens) | HEK293T | ATCC | CRL-11268 | |
| Cell line (Homo sapiens) | Jurkat, Clone E6-1 | ATCC | TIB-152 | |
| Cell line (Homo sapiens) | Jurkat, KIF21B KO#1 | This paper | CRISPR/Cas9 generated monoclonal Jurkat cell line | |
| Cell line (Homo sapiens) | Jurkat, KIF21B KO#2 | This paper | CRISPR/Cas9 generated monoclonal Jurkat cell line | |
| Cell line (Homo sapiens) | Jurkat, KIF21B KO#1, re-expressing KIF21B-GFP | This paper | Polyclonal line re-expressing KIF21B-GFP; generated from monoclonal KIF21B KO#1 Jurkat cells | |
| Cell line (Homo sapiens) | Jurkat, KIF21B KO#2, re-expressing KIF21B-GFP | This paper | Polyclonal line re-expressing KIF21B-GFP; generated from monoclonal KIF21B KO#2 Jurkat cells | |
| Cell line (Homo sapiens) | Jurkat cells (control), expressing EB3-GFP | This paper | Polyclonal Jurkat (control) line expressing EB3-GFP | |
| Cell line (Homo sapiens) | Jurkat, KIF21B KO#1, expressing EB3-GFP | This paper | Polyclonal line expressing EB3-GFP; generated from monoclonal KIF21B KO#1 Jurkat cells | |
| Cell line (Homo sapiens) | Jurkat, KIF21B KO#2, expressing EB3-GFP | This paper | Polyclonal line expressing EB3-GFP; generated from monoclonal KIF21B KO#2 Jurkat cells | |
| Cell line (Homo sapiens) | Jurkat cells (control), expressing β-tubulin-GFP | This paper | Polyclonal Jurkat (control) line expressing β-tubulin-GFP | |
| Cell line (Homo sapiens) | Jurkat, KIF21B KO#1, expressing β-tubulin-GFP | This paper | Polyclonal line expressing β-tubulin-GFP; generated from monoclonal KIF21B KO#1 Jurkat cells | |
| Cell line (Homo sapiens) | Jurkat, KIF21B KO#2, expressing β-tubulin-GFP | This paper | Polyclonal line expressing β-tubulin-GFP; generated from monoclonal KIF21B KO#2 Jurkat cells | |
| Transfected construct (Homo sapiens) | KIF21B-GFP | This paper | Lentiviral construct to transfect and express KIF21B-GFP in Jurkat cells | |
| Transfected construct (Homo sapiens) | EB3-GFP | Bouchet et al., 2016; PMID:27939686 | Lentiviral construct to transfect and express EB3-GFP in Jurkat cells | |
| Transfected construct (Homo sapiens) | β-tubulin-GFP | Bouchet et al., 2016; PMID:27939686 | Lentiviral construct to transfect and express β-tubulin-GFP in Jurkat cells | |
| Transfected construct (Homo sapiens) | EB3-mCherry | Stepanova et al., 2003; PMID:12684451 | Expression construct transfected in Jurkat cells | |
| Sequence-based reagent | gRNA targeting sequence against KIF21B | This paper | gRNA sequence | caccgTGTGTGAGCAAGCTCATCGA |
| Sequence-based reagent | GAPDH_fw | This paper | qPCR primer | CAACGGATTTGGTCGTATT |
| Sequence-based reagent | GAPDH_rev | This paper | qPCR primer | GATGGCAACAATATCCACTT |
| Sequence-based reagent | IL-2_fw | This paper | qPCR primer | AACTCACCAGGATGCTCACATTTA |
| Sequence-based reagent | IL-2_rev | This paper | qPCR primer | TCCCTGGGTCTTAAGTGAAAGTTT |
| Antibody | Anti-CD3, clone UCHT1 (mouse monoclonal) | StemCell Technologies | Cat# #60011 | Coverslip coating (10 μg/mL) WB (1:400) |
| Antibody | Anti-HA, clone 16B12 (mouse monoclonal) | Biolegend (Covance) | Cat# MMS-101P, RRID:AB_10064068 | Coverslip coating (10 μg/mL) |
| Antibody | anti-KIF21B (rabbit polyclonal) | Sigma-Aldrich | Cat# HPA027249, RRID:AB_10602241 | WB (1:1000) |
| Antibody | Anti-GFP (rabbit polyclonal) | Abcam | Cat# Ab290, RRID:AB_303395 | WB (1:5000) |
| Antibody | Anti-Ku80 (mouse monoclonal) | BD Bioscience | Cat# 611360, RRID:AB_398882 | WB (1:2000) |
| Antibody | Anti- Lamtor4, clone D6A4V (rabbit monoclonal) | Cell Signalling Technology | Cat# 12284, RRID:AB_2797870 | IF (1:200) |
| Antibody | anti-CEP135 (rabbit polyclonal) | Sigma-Aldrich | Cat# SAB4503685; RRID:AB_10746232 | IF (1:200) |
| Antibody | Anti- α-tubulin, clone EP1332Y (rabbit monoclonal) | Abcam | Cat# ab52866, RRID:AB_869989 | IF (1:250) for ExM samples |
| Antibody | Anti-α-tubulin (mouse monoclonal) | Sigma-Aldrich | Cat# T6199, RRID:AB_477583 | IF (1:250) for STED samples WB (1:10000) |
| Antibody | Anti- α-tubulin, clone γL1/2 (rat monoclonal) | Abcam | Cat# Ab6160, RRID:AB_305328 | IF (1:300) |
| Antibody | Alexa Fluor 488-, 594- and 647- secondaries | Molecular Probes | IF (1:200 – 1:400) | |
| Antibody | IRDye 680LT and 800CW secondaries | Li-Cor Biosciences | WB (1:10000) | |
| Commercial assay or kit | Amaxa Cell Line Nucleofector kit V | Lonza | Cat# VPB-1002 | program X-001 or X-005 |
| Commercial assay or kit | iScript cDNA synthesis kit | Bio-Rad | Cat# 1708891 | |
| Commercial assay or kit | SYBR Select mastermix | Life Technologies | Cat# 44-729-19 | |
| Peptide, recombinant protein | Proteinase-K | Thermo Fisher | Cat# EO0491 | |
| peptide, recombinant protein | Monomeric GFP | This paper | Obtained from HEK293T lysates containing overexpressed eGFP. (Clontech pEGFP-C1 vector) | |
| Chemical compound, drug | acryloyl X-SE (AcX) | Thermo Fisher | Cat# A20770 | |
| Chemical compound, drug | sodium acrylate | Sigma-Aldrich | Cat# 408220 | |
| Chemical compound, drug | AA/BIS solution | Sigma-Aldrich | Cat# A3699 | |
| Chemical compound, drug | BIS | Sigma-Aldrich | Cat# M1533 | |
| Chemical compound, drug | cOmplete protease inhibitor cocktail | Roche | Cat# 4693132001 | |
| Chemical compound, drug | Puromycin | InvivoGen | Cat# ant-pr5b | (2 μg/mL) |
| Chemical compound, drug | Hygromycin | Invivogen | Cat# ant-hm | (100 μg/mL) |
| Chemical compound, drug | Polybrene | Merck-Millipore | Cat# TR-1003-G | (8 μg/mL) |
| Chemical compound, drug | Poly-D-Lysine | Thermo Fisher | Cat# A3890401 | |
| Chemical compound, drug | Vinblastine | Sigma-Aldrich | Cat# V1377 | |
| Chemical compound, drug | Phorbol 12-myristate 13-acetate (PMA) | Sigma-Aldrich | Cat# P8139 | |
| Chemical compound, drug | ionomycin | Sigma-Aldrich | Cat# I0634 | |
| Chemical compound, drug | TRIzol | Thermo Fisher Scientific | Cat# 15596026 | |
| Software, algorithm | GraphPad Prism | GraphPad Prism (https://graphpad.com) | RRID:SCR_015807 | |
| Software, algorithm | FIJI/ImageJ | FIJI/ImageJ (https://imagej.net/Fiji) | RRID:SCR_002285 | |
| Software, algorithm | ImageJ detection of molecules plugin (DoM) | Chazeau et al., 2016; PMID:26794511 | ||
| Software, algorithm | ImageJ KymoResliceWide plugin | https://github.com/ekatrukha/KymoResliceWide | ||
| Software, algorithm | ImageJ radiality plugin | Martin et al., 2018; PMID:29547120 | https://github.com/ekatrukha/radialitymap | |
| Software, algorithm | MetaMorph | Molecular Devices | RRID:SCR_002368 | |
| Software, algorithm | Leica Application Suite X | Leica Microsystems | RRID:SCR_013673 | |
| Software, algorithm | Micro-Manager | https://micro-manager.org/ | RRID:SCR_016865 | |
| Software, algorithm | Huygens Software | Scientific Volume Imaging https://svi.nl/HuygensSoftware | RRID:SCR_014237 | Drift correction of ExM sample acquisitions |
| Software, algorithm | Imaris, version 9.5.1 | Bitplane/Oxford instruments | RRID:SCR_007370 | |
| Software, algorithm | Cytosim | Nedelec and Foethke, 2007, PMID:19293826 | ||
| Software, algorithm | Python | https://www.python.org/ | RRID:SCR_008394 | |
| Software, algorithm | Seaborn | https://seaborn.pydata.org/ | RRID:SCR_018132 | |
| Software, algorithm | NumPy | https://numpy.org/ | RRID:SCR_008633 | |
| Software, algorithm | Pandas | https://pandas.pydata.org/ | RRID:SCR_018214 | |
| Software, algorithm | Adobe Illustrator | Adobe | RRID:SCR_010279 | Generation of cartoons and figures |
| Other | 8-well Chambered Coverglass w/ non-removable wells | Thermo | Cat# 155409 | |
| Other | Precision cover glasses thickness No. 1.5H | Marienfeld | Cat# 0107032 | Specific for ExM and STED samples |
| Other | silicone mold, 13mm inner diameter | Sigma-Aldrich | Cat# GBL664107 | |
| Other | Phalloidin-Alexa488 | Life Technologies | Cat# 12379 | IF (1:400) |
| Other | Phalloidin-Alexa594 | Life Technologies | Cat# 12381 | IF (1:400) |
| Other | DAPI-containing Vectashield mounting medium | Vector Laboratories | Cat# H-1200-10 | |
| Other | Vectashield mounting medium | Vector Laboratories | Cat# H-1000-10 | |
| Other | Prolong Gold | Thermo Fisher | Cat# P10144 |
Appendix 1—table 1
Parameters used for simulations.
| Parameter | Value | Description/Reference |
|---|---|---|
| MTs | ||
| Polymerization speed | 0.3 µm/s | This study |
| Depolymerization speed | 1 µm/s | This study |
| Rigidity | 20 pN/µm | Gittes et al., 1993 |
| Stall force | 5 pN | Describes the modulation of growth speed and catastrophe rate by antagonistic force (Dogterom and Yurke, 1997) |
| Catastrophe rate | 0.02 s-1, 0.3 s-1 | Matched to TIRF GFP-β-tubulin data (Figure 4D-E) |
| Cell | ||
| Viscosity | 0.1 pN.s/µm^2 | Internal viscosity of T cells, like most blood cells, is usually estimated to be lower than that of somatic cells. Jurkat cell internal viscosity has been reported at different values (Daza et al., 2019; Khakshour et al., 2015). Because there is no consensus on the value, we used a viscosity such that the KIF21B-mediated polarization happens within the timescale measured for polarization. |
| Elasticity | 100 pN/µm | The spring stiffness of the cell for all objects with inertia. This same stiffness is used for interaction of MTs with the nucleus |
| Radius | 7 µm | This study, calculated from Figure 1—figure supplement 2C-D. |
| Synapse fraction | 0.9 | This corresponds to a synapse cutting off 10% of the height of the cell (1.4 µm). |
| Interpolation distance | 1 µm | The curvature starts 1 µm under the synapse (at 2.4 µm from the top of the unpolarized cell). |
| centrosome | ||
| First anchoring stiffness | 500 pN/µm | Rotational stiffness on the MTs at the center of the centrosome, as proposed previously (Letort et al., 2016). |
| Second anchoring stiffness | 500 pN/µm | Rotational stiffness on the MTs exerted at the periphery of the centrosome, as proposed previously (Letort et al., 2016). |
| Number of MTs | 90 | |
| Dynein | ||
| Walking speed | 1 µm/s | Average value from MT gliding over dynein (Laan et al., 2012) |
| Number | 50 | |
| Stall force | 4 pN | Belyy et al., 2016 |
| Unbinding rate | 1 s-1 | Ohashi et al., 2019 |
| Initialization | uniform on synapse | Dynein is initialized on the synapse and part of the interpolated curve connecting the synapse to the rest of the cell. The region is defined as being within 1.6 µm of the synapse along the vertical axis. |
| Link stiffness | 100 pN/µm | Describes the elastic stiffness of the link between MT-binding site and anchoring point (Letort et al., 2016). |
| KIF21B | ||
| Walking speed | 0.71 µm/s | This study |
| MT state after a KIF21B-induced pause | Shrinkage | We inflate the effect of KIF21B to always cause catastrophe in order to more clearly display the effect of KIF21B as a delayed catastrophe inducer. |
| Capable of pausing a shrinking MT | No | This means that the KIF21B motors do not cooperatively pause: if one of them unbinds, the fiber is set to shrinkage and another bound KIF21B cannot pause this shrinking fiber. |
| System | ||
| Dimensionality | 2D | The overgrown KIF21B-KO MT system requires much computation per timestep, and thus we were not able to expand to 3D and keep our fit of the system. |
| Number of repeats | 30 per condition | In some figures, fewer repeats are shown for readability. If so, the ones were chosen that were run first chronologically, to avoid bias in run selection. |
Additional files
Download links
A two-part list of links to download the article, or parts of the article, in various formats.
Downloads (link to download the article as PDF)
Open citations (links to open the citations from this article in various online reference manager services)
Cite this article (links to download the citations from this article in formats compatible with various reference manager tools)
Kinesin-4 KIF21B limits microtubule growth to allow rapid centrosome polarization in T cells
eLife 9:e62876.
https://doi.org/10.7554/eLife.62876


