Ribosomal profiling during prion disease uncovers progressive translational derangement in glia but not in neurons
- Institute of Neuropathology, University of Zurich, Switzerland
Figures
Figure 1 with 1 supplement

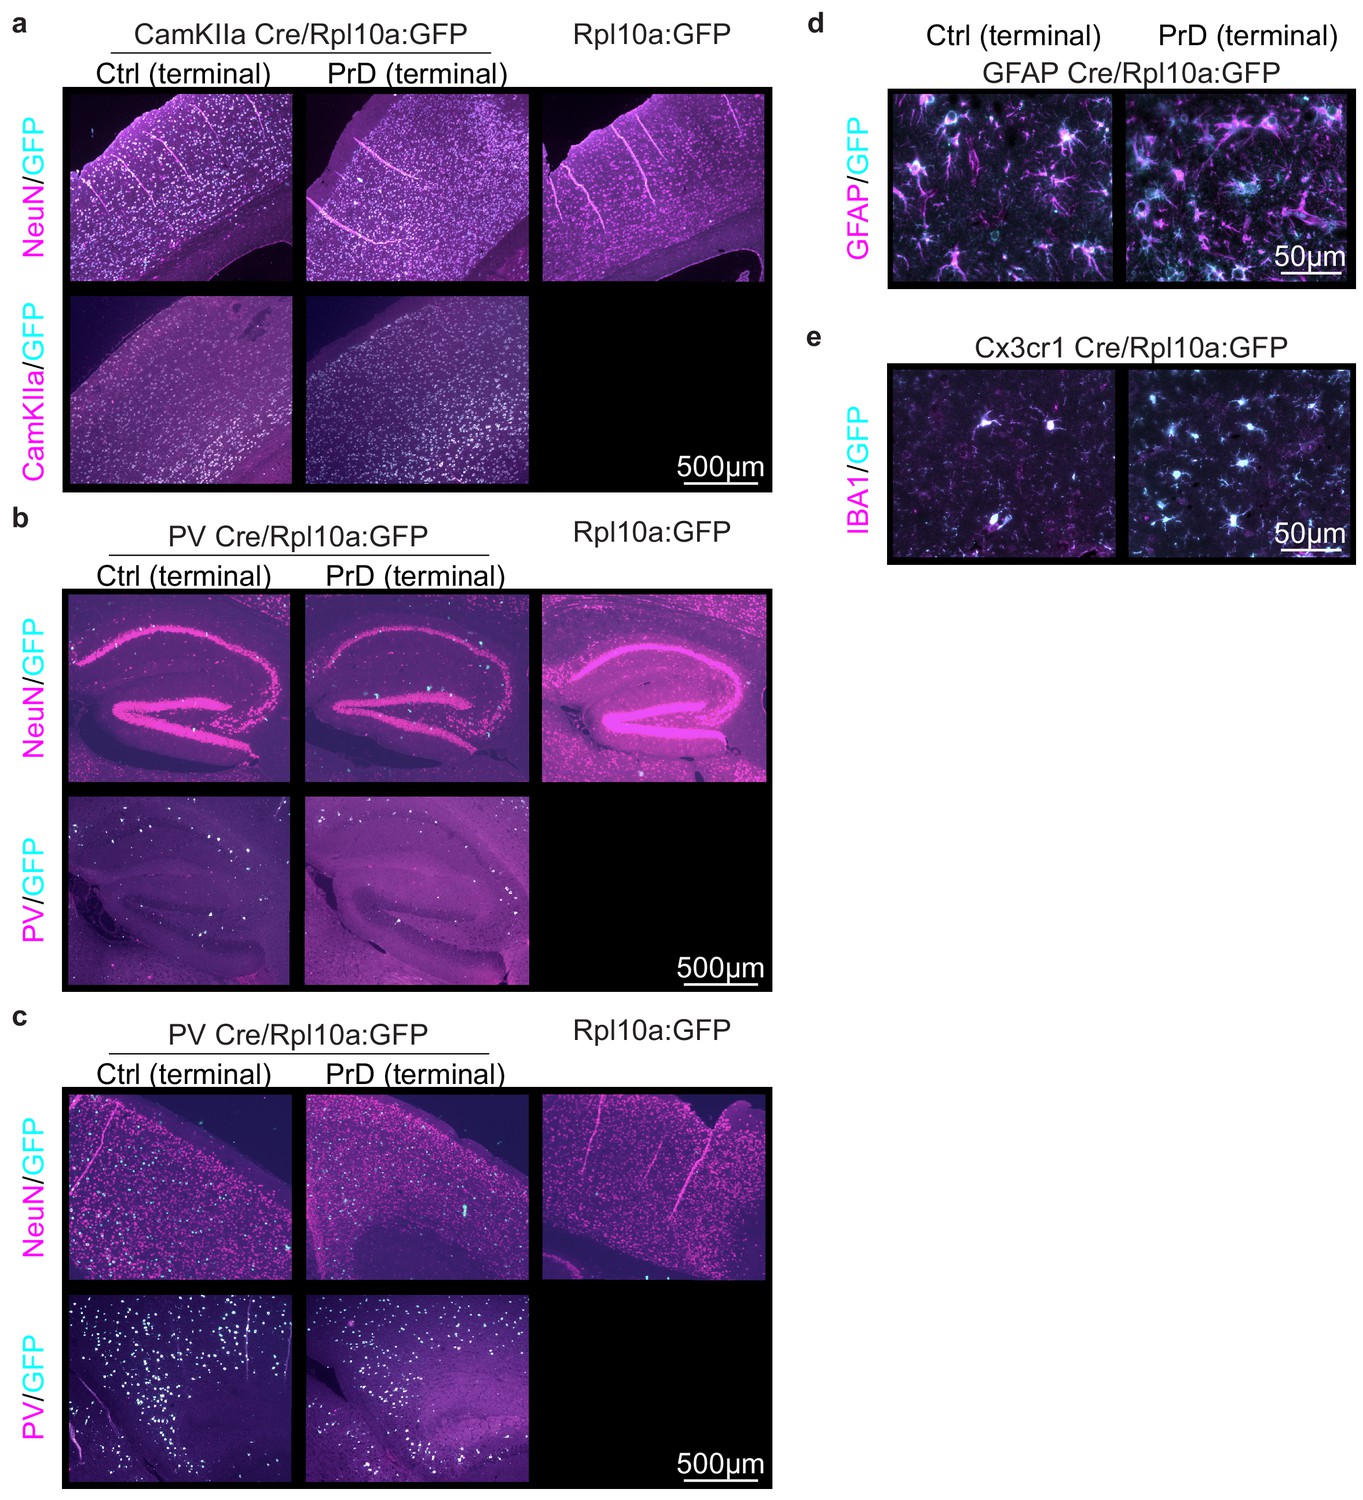
Generation of mice that express GFP-tagged ribosomes in prion disease relevant cells.
(a) Schematic displaying which cell types were analyzed at which time point during prion disease (PrD) progression. (b) Brain sections of control (ctrl) and terminally PrD CamKIIa/Rpl10a:GFP mice were stained for GFP and CamKIIa or NeuN. A subset of NeuN+ cells and all CamKIIa+ cells showed Rpl10a:GFP expression in the hippocampus. No GFP signal was detectable in Rpl10a:GFP mice (not bred with a Cre expressing strain). (c) Brain sections of ctrl and PrD PV/Rpl10a:GFP mice were stained for GFP and PV or NeuN. Cells that were NeuN-negative and PV+ showed Rpl10a:GFP expression in the cerebellum. No GFP signal was detectable in Rpl10a:GFP mice (not bred with a Cre expressing strain). (d) Brain sections of ctrl and PrD mice expressing Rpl10a:GFP in GFAP+ cells were stained for GFP and GFAP. (e) Brain sections of terminally diseased and control mice expressing Rpl10a:GFP in Cx3cr1+ cells were stained for GFP and IBA1.
Figure 1—figure supplement 1
Generation of mice that express GFP-tagged ribosomes in prion disease relevant cells.
(a) Brain sections of control (ctrl) and terminally prion-diseased (PrD) CamKIIa/Rpl10a:GFP mice were stained for GFP and CamKIIa or NeuN. A subset of NeuN+ cells and all CamKIIa+ cells showed Rpl10a:GFP expression in the cortex. No GFP signal was detectable in Rpl10a:GFP mice (not bred with a Cre expressing strain). (b–c) Brain sections of ctrl and PrD PV/Rpl10a:GFP mice were stained for GFP and PV or NeuN. Cells that were NeuN-negative and PV+ showed Rpl10a:GFP expression in the hippocampus (b) and cortex (c). No GFP signal was detectable in Rpl10a:GFP mice not bred with a Cre expressing strain (PV expression in these mice was not assessed). (d) Brain sections of ctrl and PrD mice expressing Rpl10a:GFP in GFAP+ cells were stained for GFP and GFAP. (e) Brain sections of terminally diseased and control mice expressing Rpl10a:GFP in Cx3cr1+ cells were stained for GFP and IBA1.
Figure 2 with 1 supplement
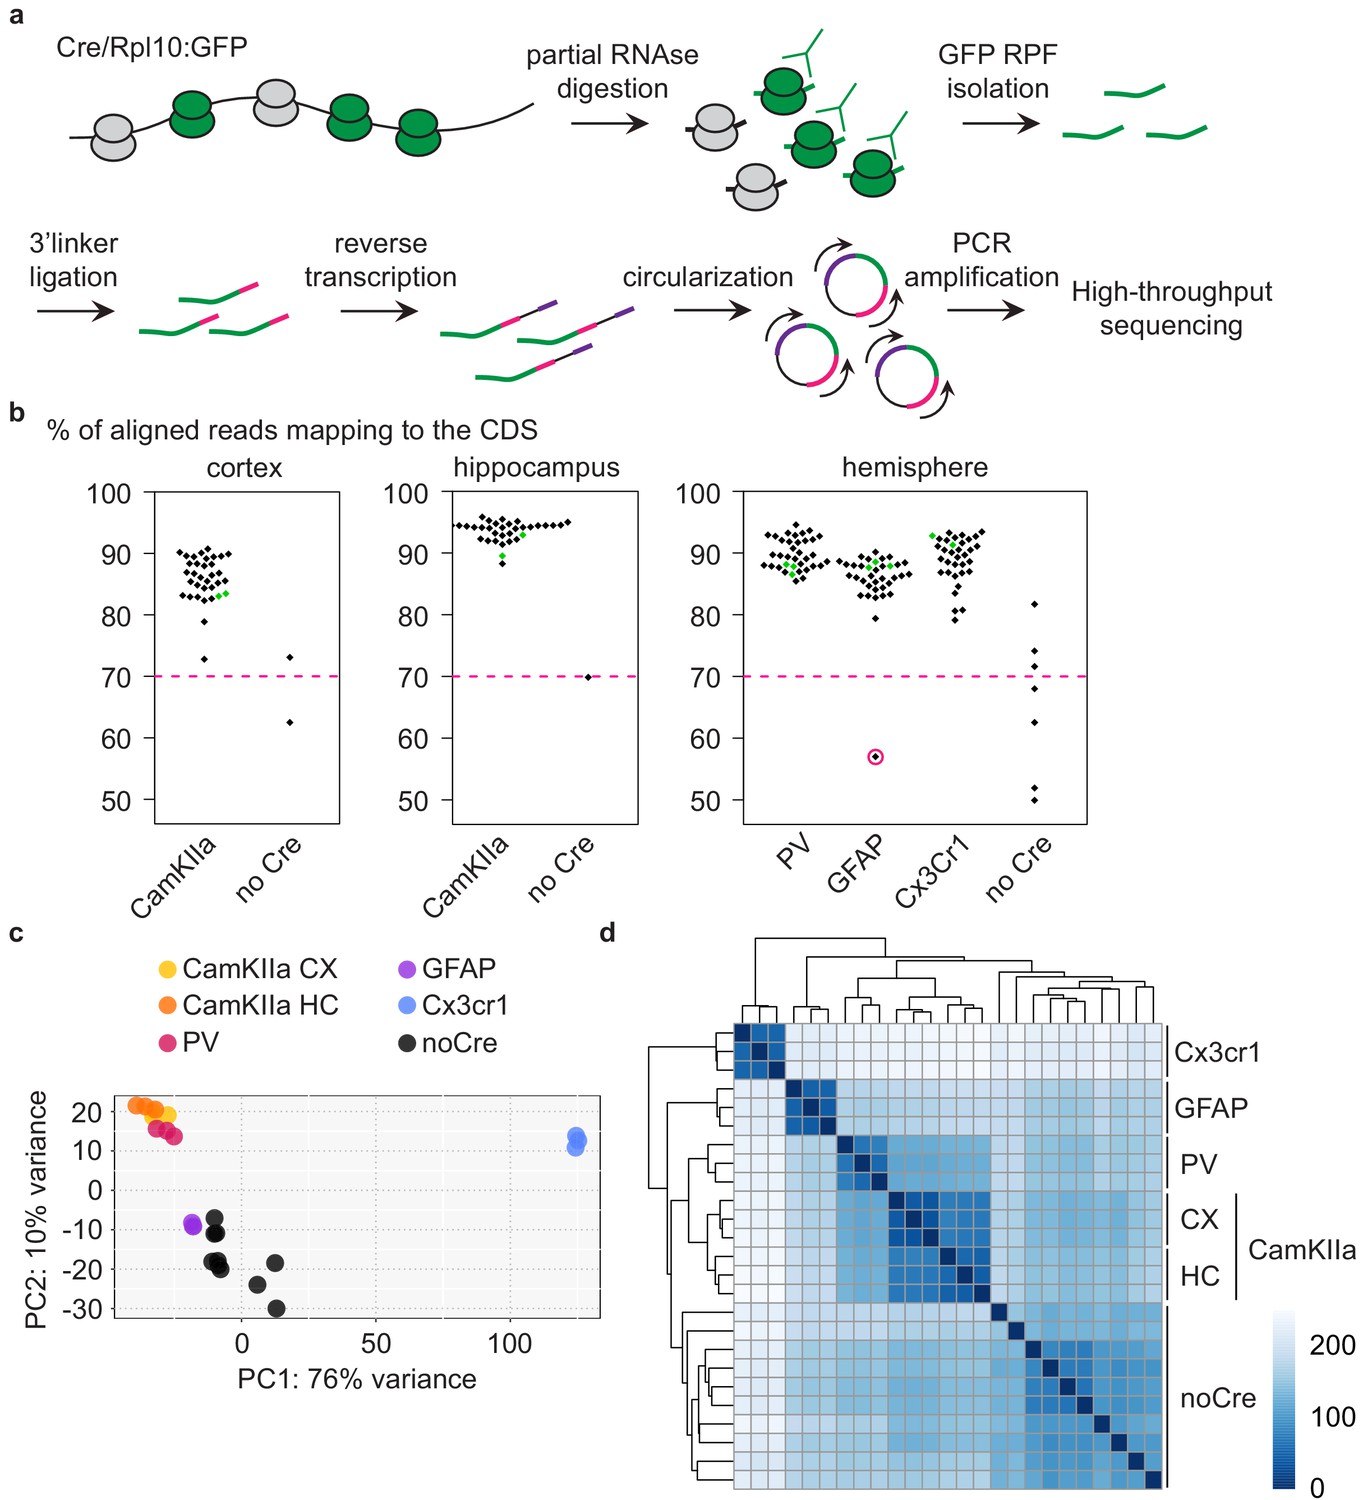
Analysis of different CNS cells via cell-type-specific ribosome profiling.
(a) Schematic depicting the workflow of cell-type-specific ribosome profiling. After partial RNase digestion, GFP ribosome protected fragments (RPF) were isolated via GFP immunoprecipitation and ultracentrifugation, and subjected to 3’ linker ligation, reverse transcription, circularization and PCR amplification before being submitted for high-throughput sequencing. (b) Beeswarm plots displaying the % of reads mapping to the coding sequence (CDS). Samples are grouped according to analyzed regions and Cre drivers. Only Cre+ samples with a minimum of 70% CDS reads (indicated by a dashed pink line) were analyzed. One Cre+ sample did not pass quality control and was therefore excluded (encircled in pink). Terminal PrD samples are colored in green. (c) Principal component analysis of noCre samples and control samples at 2 weeks post-inoculation (wpi) based on rlog transformed RPF counts per gene revealing a separation according to Cre driver (~cell type), a resemblance of GFAP samples and noCre samples and similarities between neuronal cell types. (d) Hierarchical clustering of noCre samples and control samples at two wpi based on Euclidean distances. Heatmaps depicting the sample distance at each time point based on rlog transformed RPF counts per gene. Samples cluster according to Cre driver (~cell type) and noCre samples are clearly distinguishable.
Figure 2—figure supplement 1

Analysis of different CNS cells via cell-type-specific ribosome profiling.
(a) Beeswarm plots displaying million unique reads. Samples are grouped according to analyzed regions and Cre driver. Only Cre+ samples with at least one million unique reads (indicated by a dashed pink line) were analyzed. One Cre+ samples did not pass quality control and was therefore excluded (encircled in pink). Terminal PrD samples are colored in green. (b) Beeswarm plots displaying the % of reads mapping to ribosomal RNA (rRNA). Samples are grouped according to analyzed regions and Cre drivers. One Cre+ samples did not pass quality control (>one million unique reads and >70% of reads mapping to the coding sequence) and was therefore excluded (encircled in pink). Terminal PrD samples are colored in green. (c) Density plots displaying the ribosome protected fragments (RPF) coverage relative to the translational start (left) and stop (right). RPF counts were normalized for transcript abundance and the number of transcripts represented at each position. Shown are representative samples of the different cell types and a Cre-negative sample as well the excluded Cre+ sample.
Figure 3 with 3 supplements

Identification of preferentially translated transcripts in different cell types.
(a) Boxplots displaying the translation (log2 transformed fpkm values) of the top 100 genes in neurons (N), endothelial cells (EC), oligodendrocytes (OL), astrocytes (AS) and microglia (MG) in the indicated cell type. Boxes containing genes expected to be highly translated are shaded in a darker tone. (b) Identification of genes that were differentially translated (|log2FC| > 2 and FDR < 0.05) between two different cell types (numbers on lines) and of preferentially translated genes (PTGs) that were differentially translated in one versus all other cell types (numbers in colored hexagons). (c) Heatmap displaying the translation (log2 transformed fpkm values) of 2692 PTGs, revealing a clustering of samples according to cell type. (d) Scatterplots comparing the translation (log2 transformed fpkm values) and the expression (assessed via ribosome immunoprecipitation followed by sequencing; log2 transformed fpkm values) in the indicated cell type. Translation and expression of CamKIIa- and Cx3cr1-positive cells were assessed in corresponding brain regions. In contrast, PV and GFAP translation was examined in the whole brain, whereas PV expression was analyzed in neocortex and GFAP expression corresponds to the averaged expression across multiple regions (motor/somatosensory/visual cortex, cerebellum and hypothalamus). Linear regression lines are indicated and PTGs in the respective cell types are colored.
Figure 3—figure supplement 1
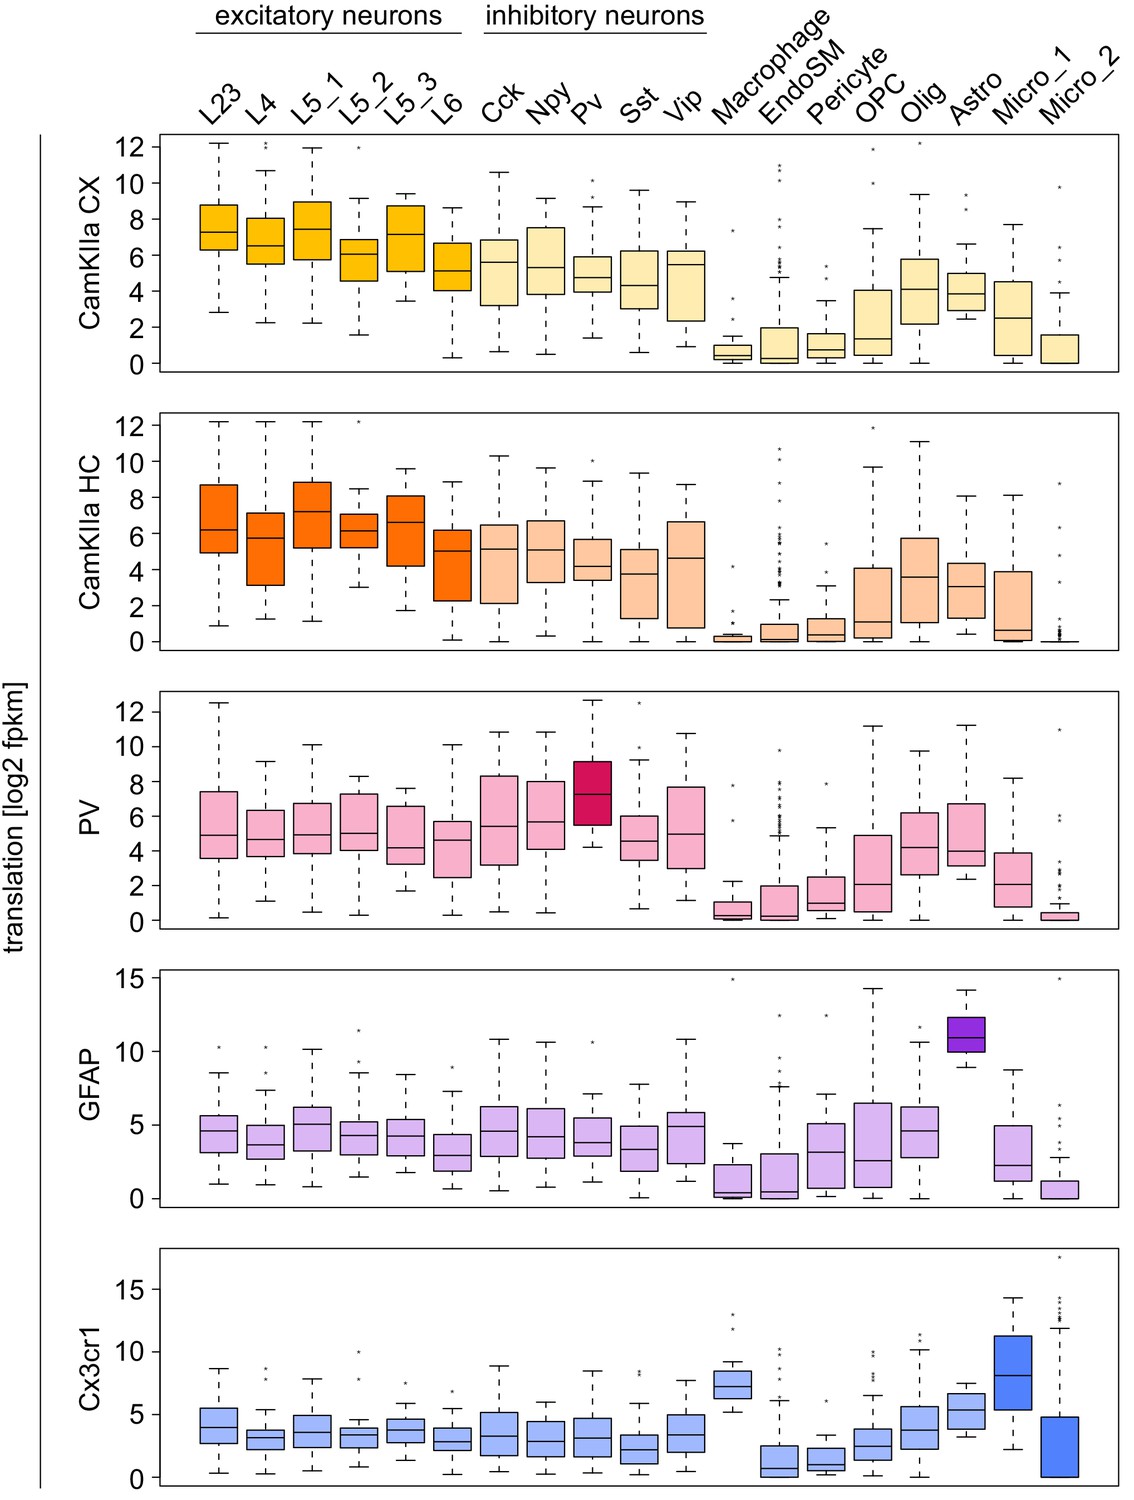
Marker genes are highly translated in the corresponding cell type.
Boxplots displaying the translation of marker genes for excitatory neurons (L23/4/5_1/5_2/5_3/6), inhibitory neurons (Cck/Npy/Pv/Sst/Vip) and other cell types (Ref) in the indicated cell type. Boxes containing genes expected to be highly translated are shaded in a darker tone.
Figure 3—figure supplement 2
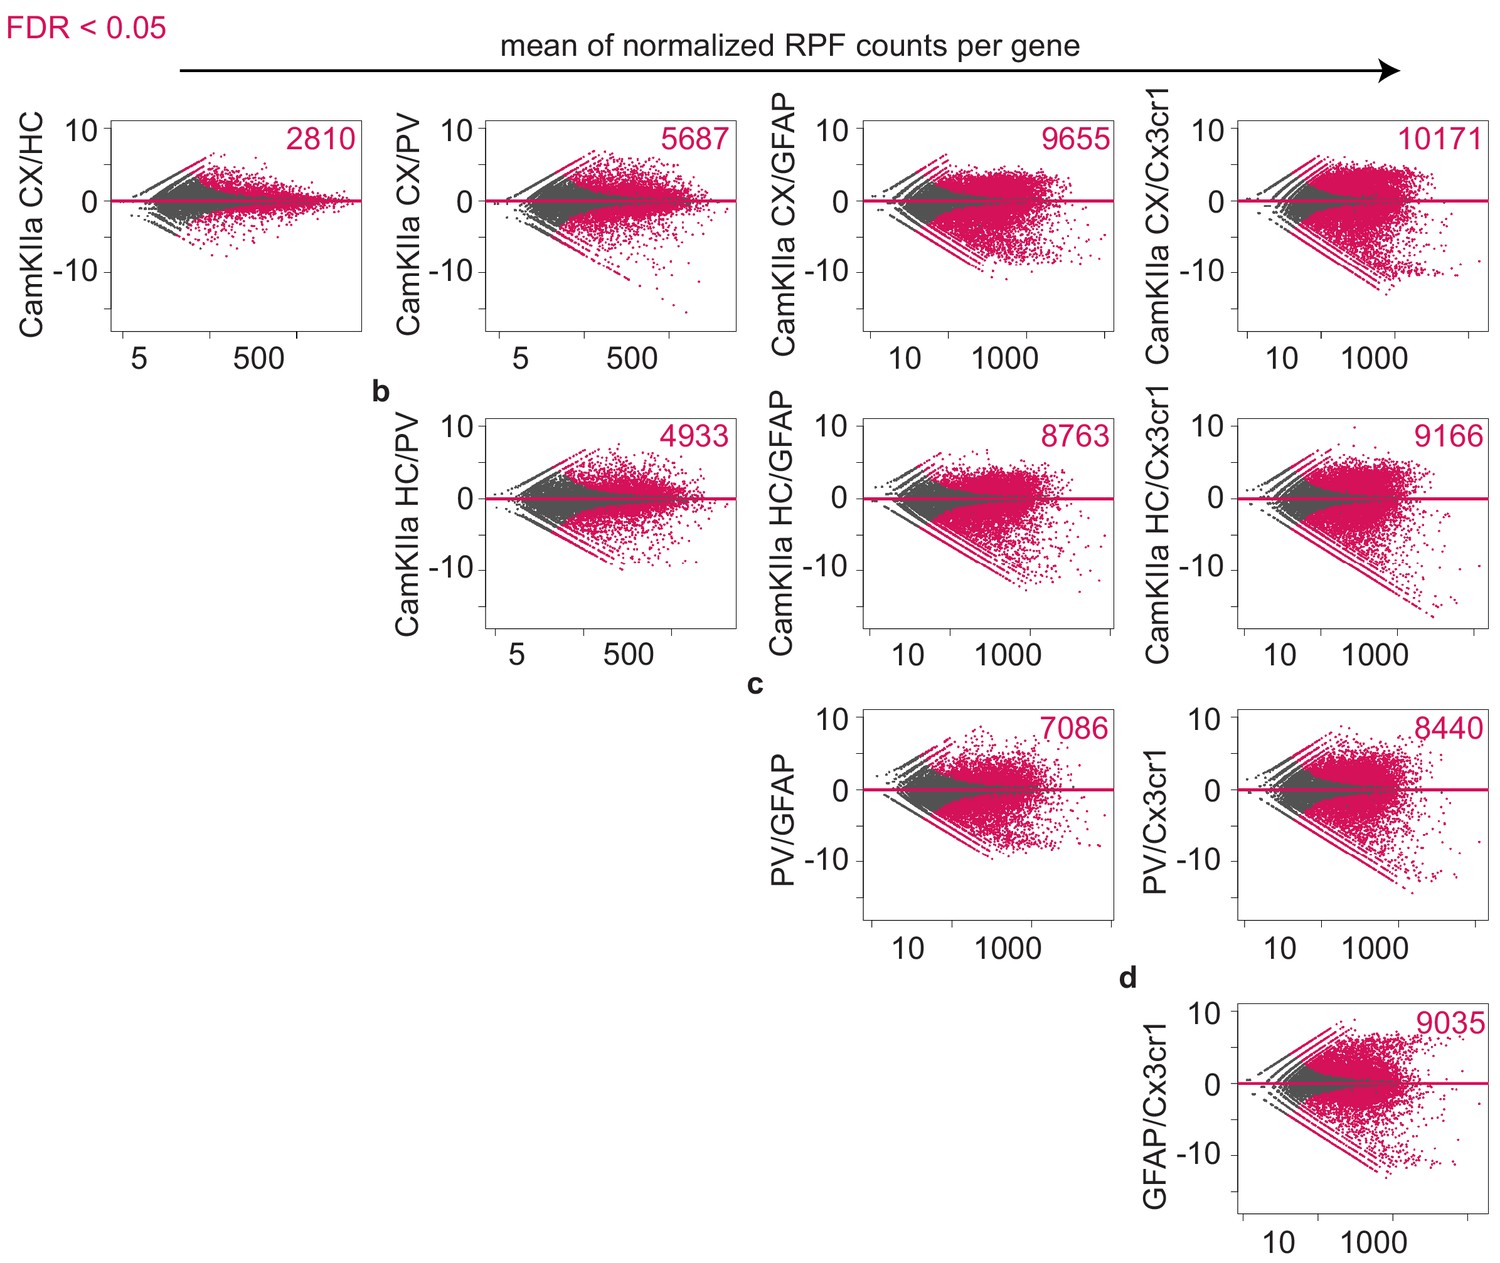
Identification of differentially translated transcripts in different cell types.
MA plots showing the log2FC in translation between indicated cell types over the mean of normalized RPFs per gene. Genes that are differentially translated (FDR < 0.05) are colored in pink and the corresponding numbers are indicated.
Figure 3—figure supplement 3
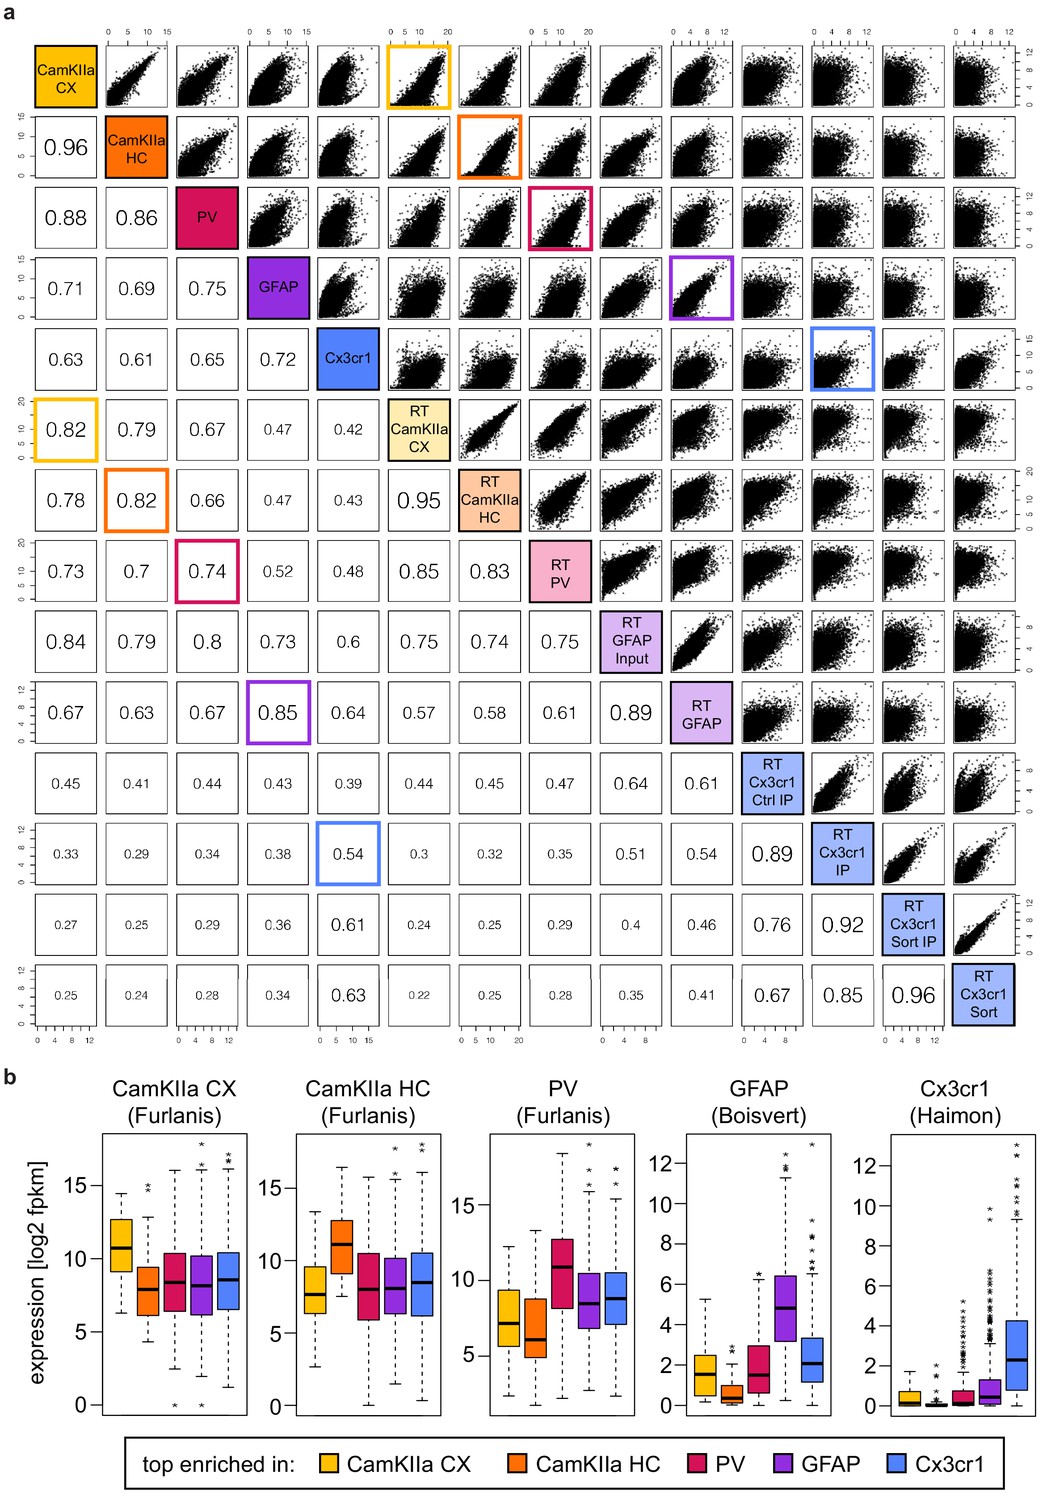
Comparison of cell-type-specific expression and translation.
(a) Cross-correlation plot comparing ribosome profiling (RP; samples #1–5) and ribotag (RT; samples #6–14) data. Pearson correlation coefficients are indicated. RP and RT samples generated from the same cell type showed the highest correlation and the comparisons are highlighted in the corresponding color. (b) Boxplots displaying the expression (according to RT data) of preferentially translated genes (PTGs). PTGs showed the highest expression in the corresponding RT datasets.
Figure 4 with 3 supplements

Cell-type-specific changes become only evident at late prion disease stages.
(a) Schematic depicting numbers of differentially translated genes (DTGs: |log2FC| > 1 and FDR < 0.05) in the indicated cell types at different stages during disease progression (in the corresponding Figure 4—figure supplement 2 all genes with an FDR < 0.05 are colored, independent of their log2FC). (b) Scatterplot comparing prion-induced changes in GFAP+ cells at the pre-terminal (24 weeks post-inoculation (wpi)) and terminal time points. Genes changing at one or both time points are indicated. (c) Scatterplot comparing prion-induced changes in Cx3cr1+ cells at the pre-terminal (24 wpi) and terminal time points. Genes changing at one or both time points are indicated. (d) Boxplots displaying translational changes of neurotoxic (A1 signature) and neuroprotective (A2 signature) genes in GFAP+ cells during prion disease (PrD) progression. (e) Boxplots displaying translational changes of disease-associated microglia (DAM) and homeostatic microglia genes in Cx3cr1+ cells during PrD progression.
Figure 4—figure supplement 1
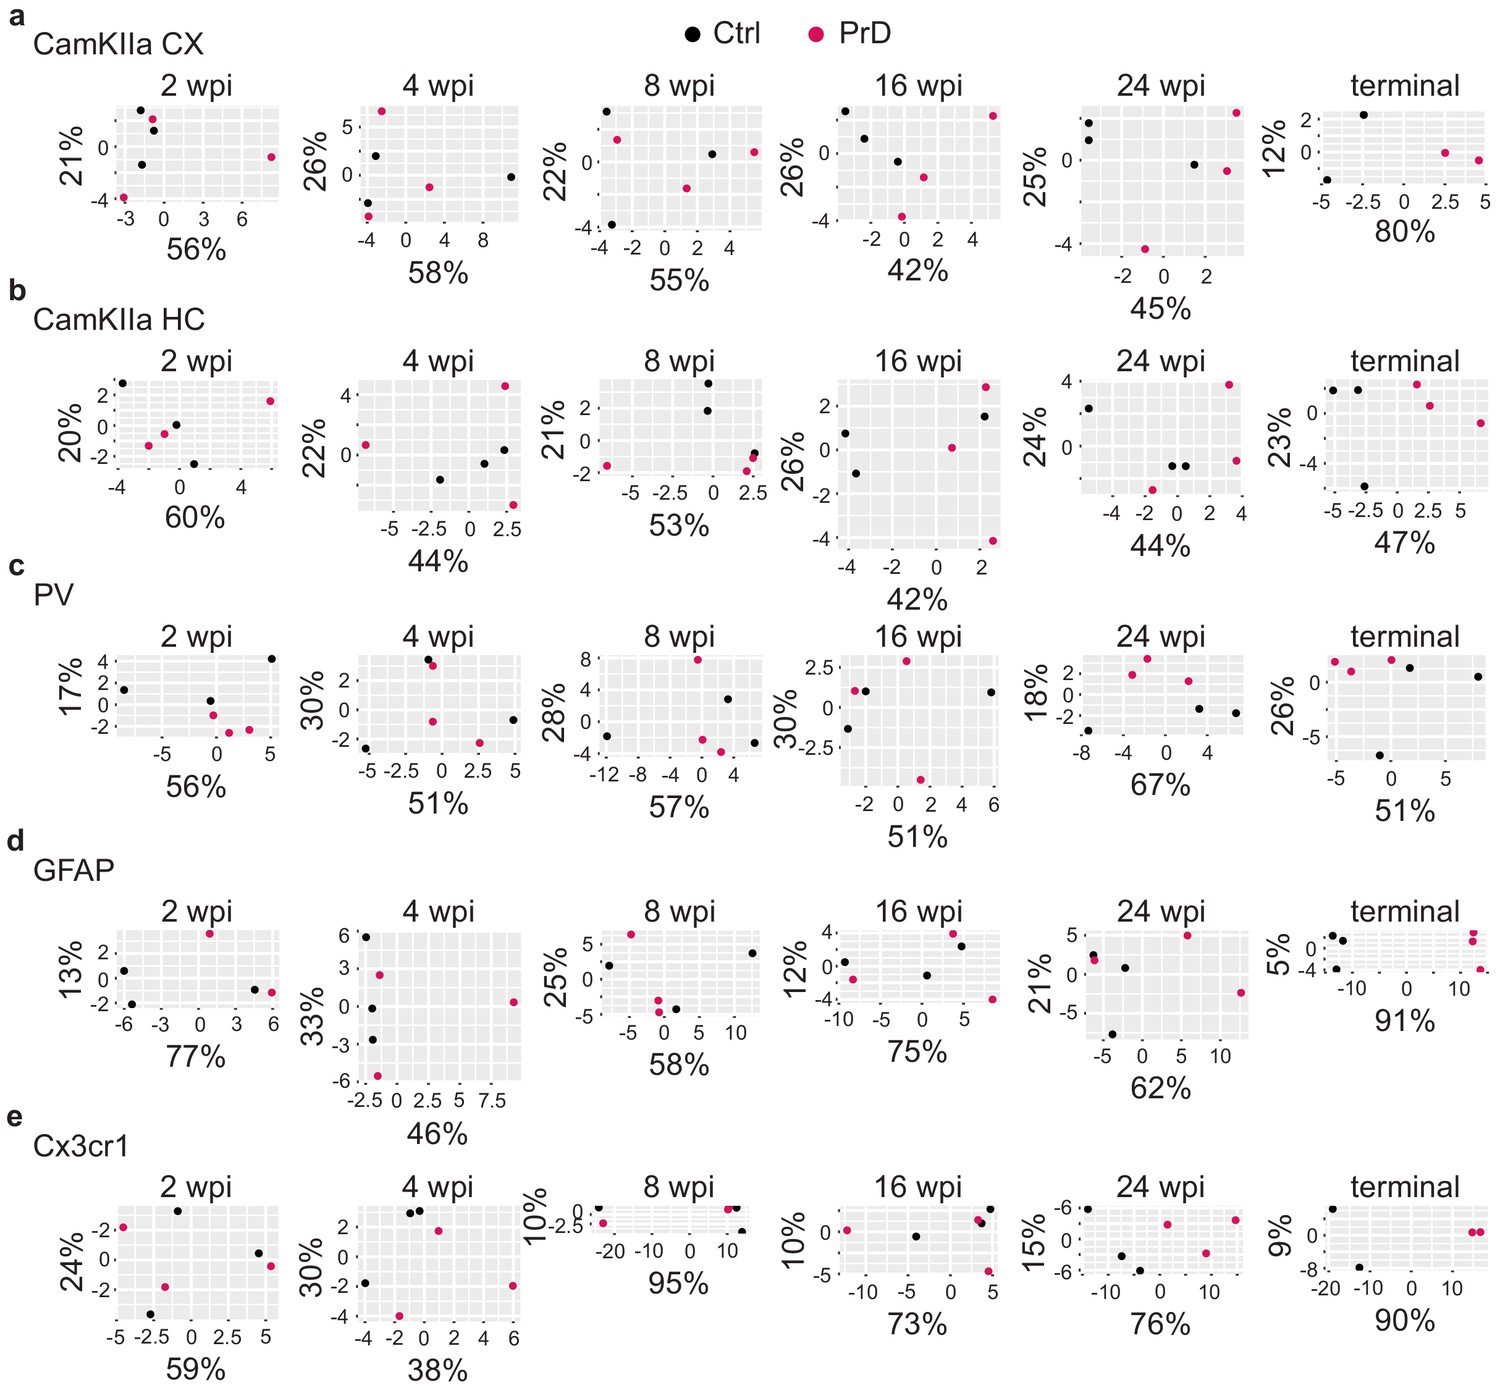
Principal component analysis of control and prion disease samples.
Principal component analysis of control (ctrl) and prion disease (PrD) samples at different time points during disease progression. The principal components 1 and 2 are plotted on the x and y axes, respectively. The % of variance explained by these principal components is indicated. Ctrl and PrD samples showed a clear separation only at the terminal stage, most prominently in GFAP and Cx3cr1+ cells.
Figure 4—figure supplement 2
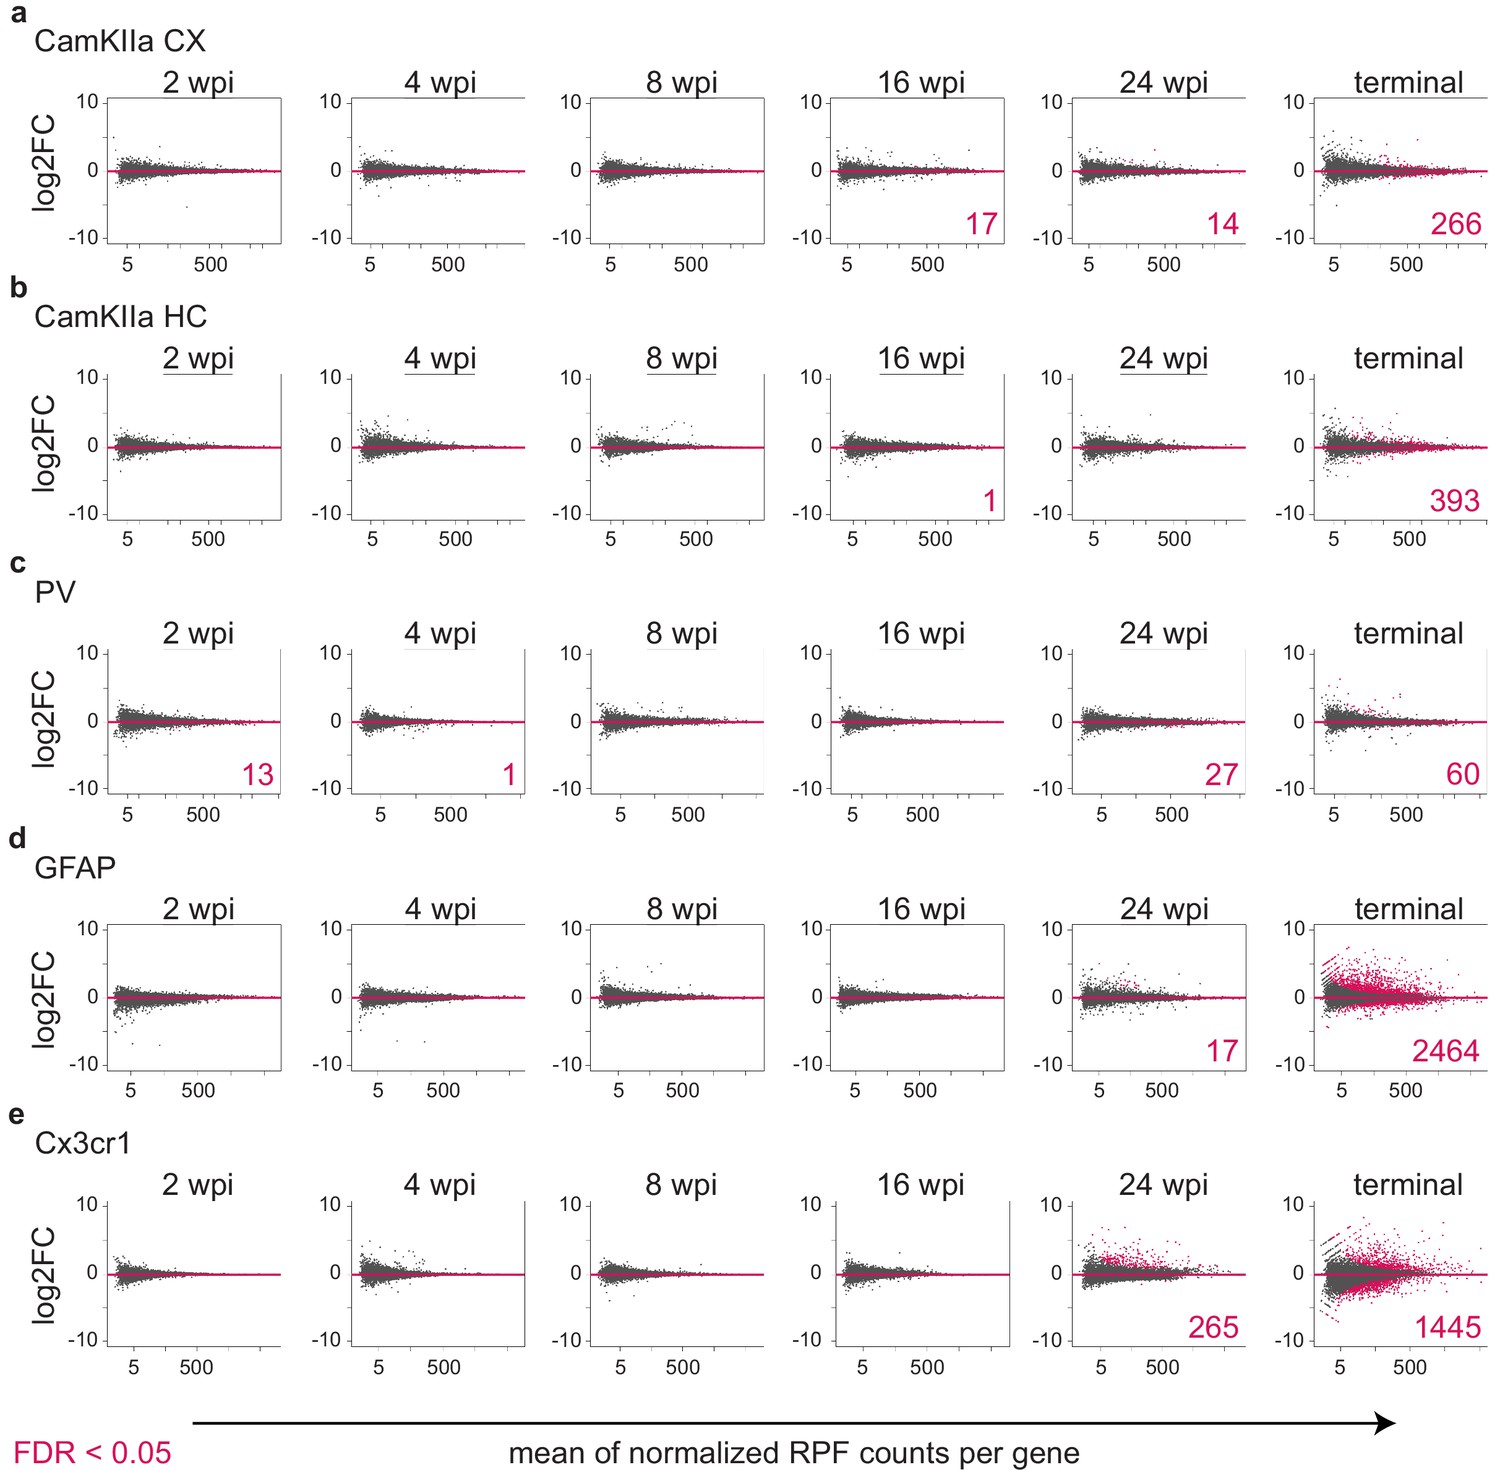
Identification of differentially translated transcripts in different cell types.
MA plots showing the log2FC in translation between prion disease (PrD) vs control (ctrl) samples over the mean of normalized RPFs per gene. Genes that are differentially translated (FDR < 0.05) are colored in pink and the corresponding numbers are indicated.
Figure 4—figure supplement 3

Comparison of prion-induced changes during disease progression.
(a-c) Scatterplots comparing prion-induced changes at the pre-terminal (24 weeks post inoculation (wpi)) and terminal time points in CamKIIa cortical (a), and hippocampal (b) neurons and in PV neurons (c). Genes changing at one or both time points are indicated.
Figure 5 with 1 supplement

Different cell types display distinct prion disease related changes.
(a) Hierarchical clustering of control and PrD samples at the terminal stage based on Euclidean distances. Heatmaps depicting the sample distance at each time point based on rlog transformed RPF counts per gene show a clustering of samples according to treatment and Cre driver (~cell type). (b) Principal component analysis of control (ctrl) and prion disease (PrD) samples at the terminal stage based on rlog transformed RPF counts per gene revealing a separation according to Cre driver (~cell type). (c) Table showing the number of total and cell-type-specific (unique) changes in the different cell types at the terminal stage. (d) Scatterplot comparing prion-induced changes between cortical and hippocampal CamKIIa+ cells at the terminal time point. Genes changing in one or both cell types are indicated. Genes that change in all cell types are shown in green. (e) Scatterplot comparing prion-induced changes in GFAP- and Cx3cr1+ cells at the terminal time point. Genes changing in one or both cell types are indicated. Genes that change in all cell types are shown in green. (f) Table displaying top enriched GO terms among genes changing only in GFAP+ cells, only in Cx3cr1+ cells or in both glia cell types.
Figure 5—figure supplement 1

Identification of common and cell-type-specific translational changes.
(a) Cross-correlation plot comparing prion-induced translational changes in different cell types. Pearson correlation coefficients are indicated. Genes that change in all five datasets are colored in grey. (b) Bars represent the translational change and the translation in the different cell types. Shown are genes that change in all five datasets. (c) Comparison of prion-induced translational changes in Cx3cr1+ cells vs the enrichment in the indicated cell type over Cx3cr1+ cells. Genes changing specifically in Cx3cr1+ cells or in both analyzed glia cell types are indicated. Genes that specifically decreased in Cx3cr1+ cells show an enrichment in neuronal cell types over Cx3cr1+ cells. (d) Comparison of prion-induced translational changes in GFAP+ cells vs the enrichment in the indicated cell type over GFAP+ cells. Genes changing specifically in GFAP+ cells or in both analyzed glia cell types are indicated. GFAP-specific changes are not enriched in any of the analyzed cell types.
Figure 6 with 2 supplements

Cell-type-specific ribosome profiling identifies novel prion disease induced changes.
(a) Table displaying the number of changes in the different cell types at the terminal stage and how many of them are preferentially translated genes (PTGs). Shown are numbers of genes that change either in the ribosome profiling (RP) or the RNAseq or in both datasets. (d) Boxplots displaying terminal RNA expression changes in the hippocampus of all expressed genes and PTGs. (c) Scatterplot comparing prion-induced RNA expression changes in the hippocampus and translational changes in GFAP+ cells. GFAP PTGs and genes that change only in the RP but not the RNAseq dataset are indicated. (d) Scatterplot comparing prion-induced RNA expression changes in the hippocampus and translational changes in Cx3cr1+ cells. Cx3cr1 PTGs and genes that change only in the RP but not the RNAseq dataset are indicated. (e) Bars represent the translation (log2 average of normalized counts per gene; DESeq2 output) and translational change (log2FC; DESeq2 output) in the different cell types. Shown are genes that are enriched in astrocytes (Glul and Gfap) and microglia (Aif1 encoding for IBA1, and Mmp9). Significant changes (Benjamini Hochberg adjusted p value < 0.05; derived from DESeq2 analyses) are marked with an asterisk. (f) Western blot and its quantification showing protein levels of astrocyte (GLUL and GFAP) and microglia (IBA1 and MMP9) enriched genes in control (ctrl) and terminal prion disease (PrD) samples (*p<0.05; **p<0.01; ***p<0.001; two-tailed t test comparing terminal PrD vs ctrl samples; error bars: standard deviation). (g) Western blot and its quantification showing neuronal protein levels (NeuN in cortex and hippocampus, PV in whole brain) in ctrl and terminal PrD samples (ns = not significant; two-tailed t test comparing terminal PrD vs ctrl samples; error bars: standard deviation).
Figure 6—figure supplement 1
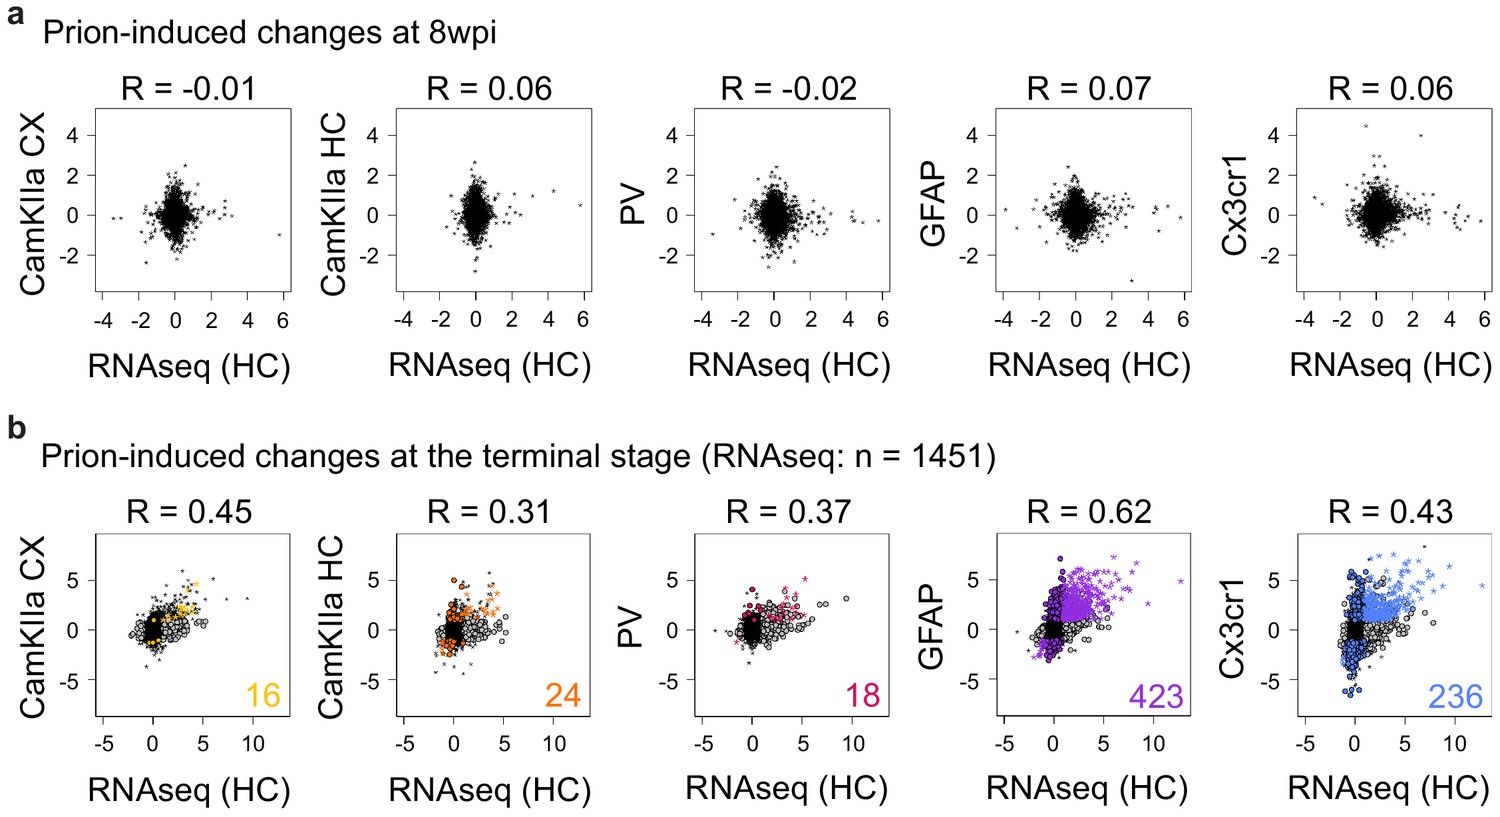
Comparison of prion-induced changes in RNA expression and translation.
(a) Comparison between prion-induced cell-type-specific translational changes and RNA expression changes in the hippocampus at 8 weeks post-inoculation (wpi). Pearson correlation coefficients are indicated. (b) Comparison between prion-induced cell-type-specific translational changes and RNA expression changes in the hippocampus at the terminal stage. Pearson correlation coefficients are indicated. Genes that change in either expression (n = 1451; grey circles) or in translation (colored circles) or in both datasets (colored stars, the corresponding numbers are displayed) are indicated.
Figure 6—figure supplement 2
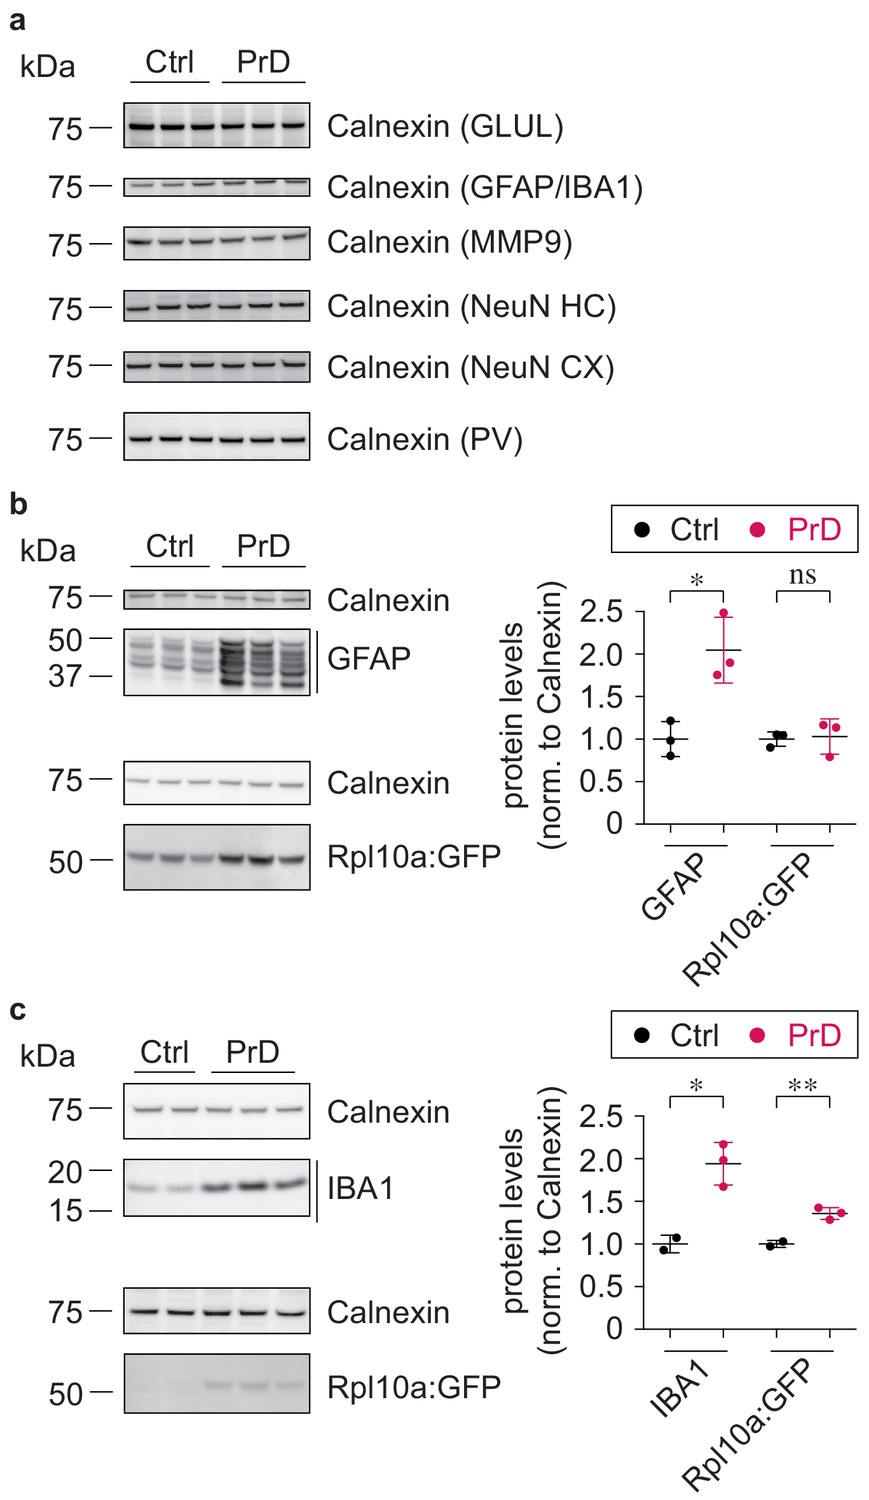
Comparison of GFP expression.
(a) Western blot showing protein levels of Calnexin, used for the quantification in Figure 6. (b) Western blot and its quantification showing protein levels in control (ctrl) and terminal prion disease (PrD) GFAP Cre/Rpl10a mice (*p<0.05; ns = not significant; two-tailed t test comparing terminal PrD vs ctrl samples; error bars: standard deviation). (c) Western blot and its quantification showing protein levels in ctrl and terminal PrD Cx3cr1 Cre/Rpl10a mice (*p<0.05; **p<0.01; two-tailed t test comparing terminal PrD vs ctrl samples; error bars: standard deviation).
Author response image 1

Scatterplots of samples with just two replicates per group.
Both ctrl (left panel) and the PrD (right panel) terminal CamKlla cortex samples showed a high correlation of rlog transformed RPF counts between replicates.
Additional files
-
Supplementary file 1
Sample summary.
Shown are sample information (sample name, analyzed region, gender, treatment, time point, Cre driver, and multiplex index), number of unique reads, and number and percentage of rRNA reads, aligned reads and aligned reads mapping to the coding sequence (CDS).
- https://cdn.elifesciences.org/articles/62911/elife-62911-supp1-v2.xlsx
-
Supplementary file 2
Identification of preferentially translated genes.
Table displaying Ensemble GeneID, MGI Symbol, the individual and average translation (rlog transformed RPF counts per gene) and difference analysis between all cell types including mean of normalized RPFs per gene (baseMean), log2FC, pvalue and Benjamini-Hochberg adjusted p values (padj). The last column specifies preferentially translated genes (PTG), which are differentially translated (|log2FC| > 2 and padj <0.05) between one cell type versus all others.
- https://cdn.elifesciences.org/articles/62911/elife-62911-supp2-v2.xlsx
-
Supplementary file 3
Comparison of cell-type-specific translation and expression.
Table including Ensemble GeneID, MGI Symbol, coding sequence (CDS) length, the individual and average translation (log2 transformed fpkm values) assessed by ribosome profiling (RP) and the average expression (log2 transformed fpkm values) assessed by ribotag (RT) in the indicated cell types. Counts per gene were normalized for sequencing depth and either CDS length (RP) or transcript length (RT). Additional columns specify if a gene is preferentially translated according to our dataset (column PTG), if it is one of the top 100 enriched genes according to Zhang et al., 2014 (column Zhang) or if it was identified to be a marker gene according to Hrvatin et al., 2018 (column Hrvatin).
- https://cdn.elifesciences.org/articles/62911/elife-62911-supp3-v2.xlsx
-
Supplementary file 4
Translational changes in CamKIIa cortical neurons during prion disease progression.
Table displaying Ensemble GeneID, MGI Symbol, the individual and average translation (rlog transformed RPF counts per gene) and difference analysis between prion disease (PrD) vs control (ctrl) samples through disease progression in CamKIIa cortical neurons, including mean of normalized RPFs per gene (baseMean), log2FC, pvalue and Benjamini-Hochberg adjusted p values (padj).
- https://cdn.elifesciences.org/articles/62911/elife-62911-supp4-v2.xlsx
-
Supplementary file 5
Translational changes in CamKIIa hippocampal neurons during prion disease progression.
Table displaying Ensemble GeneID, MGI Symbol, the individual and average translation (rlog transformed RPF counts per gene) and difference analysis between prion disease (PrD) vs control (ctrl) samples through disease progression in CamKIIa hippocampal neurons, including mean of normalized RPFs per gene (baseMean), log2FC, pvalue and Benjamini-Hochberg adjusted p values (padj).
- https://cdn.elifesciences.org/articles/62911/elife-62911-supp5-v2.xlsx
-
Supplementary file 6
Translational changes in PV neurons during prion disease progression.
Table displaying Ensemble GeneID, MGI Symbol, the individual and average translation (rlog transformed RPF counts per gene) and difference analysis between prion disease (PrD) vs control (ctrl) samples through disease progression in PV neurons, including mean of normalized RPFs per gene (baseMean), log2FC, pvalue and Benjamini-Hochberg adjusted p values (padj).
- https://cdn.elifesciences.org/articles/62911/elife-62911-supp6-v2.xlsx
-
Supplementary file 7
Translational changes in GFAP+ cells during prion disease progression.
Table displaying Ensemble GeneID, MGI Symbol, the individual and average translation (rlog transformed RPF counts per gene) and difference analysis between prion disease (PrD) vs control (ctrl) samples through disease progression in GFAP+ cells, including mean of normalized RPFs per gene (baseMean), log2FC, pvalue and Benjamini-Hochberg adjusted p values (padj). Genes associated with an A1 or an A2 signature are indicated in the last column.
- https://cdn.elifesciences.org/articles/62911/elife-62911-supp7-v2.xlsx
-
Supplementary file 8
Translational changes in Cx3cr1+ cells during prion disease progression.
Table displaying Ensemble GeneID, MGI Symbol, the individual and average translation (rlog transformed RPF counts per gene) and difference analysis between prion disease (PrD) vs control (ctrl) samples through disease progression in Cx3cr1+ cells, including mean of normalized RPFs per gene (baseMean), log2FC, pvalue and Benjamini-Hochberg adjusted p values (padj). Genes associated with a homeostatic or disease-associated microglia (DAM) signature are indicated in the last column.
- https://cdn.elifesciences.org/articles/62911/elife-62911-supp8-v2.xlsx
-
Supplementary file 9
Summary table of all terminal changes.
Table showing Ensemble GeneID, MGI Symbol, information of genes being preferentially translated (column PTG), and difference analysis between prion disease (PrD) vs control (ctrl) samples of cell-type-specific translation, and hippocampal RNA expression changes at the terminal stage intraperitoneally (ip) inoculated mice, including mean of normalized RPFs per gene (baseMean) for translation, and log2FC and Benjamini-Hochberg adjusted p values (padj) of translational and RNA expression changes. Additional columns specify if a gene is significantly (|log2FC| > 1 and FDR < 0.05) increasing or decreasing in a dataset and if decreasing Cx3Cr1-genes are neuronal enriched.
- https://cdn.elifesciences.org/articles/62911/elife-62911-supp9-v2.xlsx
-
Supplementary file 10
Gene Ontology analysis of terms related to biological processes.
Genes decreasing and increasing in astrocytes, microglia and in both cell types were compared to respectively expressed genes.
- https://cdn.elifesciences.org/articles/62911/elife-62911-supp10-v2.xlsx
-
Supplementary file 11
Comparison of prion induced expression and cell-type-specific translational changes at the terminal stage.
Table showing Ensemble GeneID, MGI Symbol, information of genes being preferentially translated (column PTG), and difference analysis between prion disease (PrD) vs control (ctrl) samples of cell-type-specific translation at the terminal stage, and hippocampal RNA expression changes at 8 weeks post-inoculation (wpi), and the terminal stage of intraperitoneally (ip) inoculated mice, including mean of normalized RPFs per gene (baseMean), log2FC, pvalue and Benjamini-Hochberg adjusted p values (padj).
- https://cdn.elifesciences.org/articles/62911/elife-62911-supp11-v2.xlsx
-
Transparent reporting form
- https://cdn.elifesciences.org/articles/62911/elife-62911-transrepform-v2.docx
Download links
A two-part list of links to download the article, or parts of the article, in various formats.
Downloads (link to download the article as PDF)
Open citations (links to open the citations from this article in various online reference manager services)
Cite this article (links to download the citations from this article in formats compatible with various reference manager tools)
Ribosomal profiling during prion disease uncovers progressive translational derangement in glia but not in neurons
eLife 9:e62911.
https://doi.org/10.7554/eLife.62911


