Restored TDCA and valine levels imitate the effects of bariatric surgery
- Division of Transplant Surgery & Transplant Surgery Research Laboratory, Brigham and Women's Hospital, Harvard Medical School, United States
- Department of General, Visceral and Transplant Surgery, University Hospital Tübingen, Germany
- Institute of Transplant Immunology, Hannover Medical School, Germany
- Department of Pathology, Charité Universitätsmedizin Berlin, Germany
- Division of Endocrinology, Diabetes and Metabolism, Beth Israel Deaconess Medical Center, United States
- Department of Cardiovascular Surgery, Charité Universitätsmedizin Berlin, Germany
- Department of Urology, The Second Xiangya Hospital, Central South University, China
- Department of Visceral, Abdominal and Transplantation Surgery, Charité Universitätsmedizin Berlin, Germany
- Department of Urology, Faculty of Medicine, Osaka Medical and Pharmaceutical University, Japan
- Division of Gastrointestinal and General Surgery, Department of Surgery, Brigham and Women’s Hospital, Harvard Medical School, United States
- Renal Division, Brigham and Women’s Hospital, Harvard Medical School, United States
- Division of Nephrology, Department of Medicine, University of Illinois at Chicago, United States
- Department of Medicine, Section of Rheumatology, The University of Chicago, United States
Figures
Figure 1

Sleeve gastrectomy (SGx) induces significant weight loss independent of the surgical procedure.
C57BL/6 DIO mice (n = 5) underwent SGx or sham surgery, were fasted on the day of surgery, switched to a liquid diet for 2 days and returned to a high-fat diet by day 3. An additional set of C57BL/6 DIO and C57BL/6 lean mice receiving a similar diet served as controls. (A) Body weight was monitored for a course of 2 weeks every 24 hr. (B) Proportional weight loss of C57BL/6 DIO mice undergoing SGx and sham surgery was calculated comparing mean weight loss after 7 and 14 days, respectively. Results are representative of at least three independent experiments. Column plots display mean with standard deviation. Statistical significance was determined using two-way analysis of variance (ANOVA) followed by Turkey’s multiple comparison test with single pooled variance. Asterisks indicate p-values: *p < 0.05, **p < 0.01, and ***p < 0.001. Only significant values are shown (n = 7 animals/group).
-
Figure 1—source data 1
The numerical data for the graphs in Figure 1.
- https://cdn.elifesciences.org/articles/62928/elife-62928-fig1-data1-v2.xlsx
Figure 2
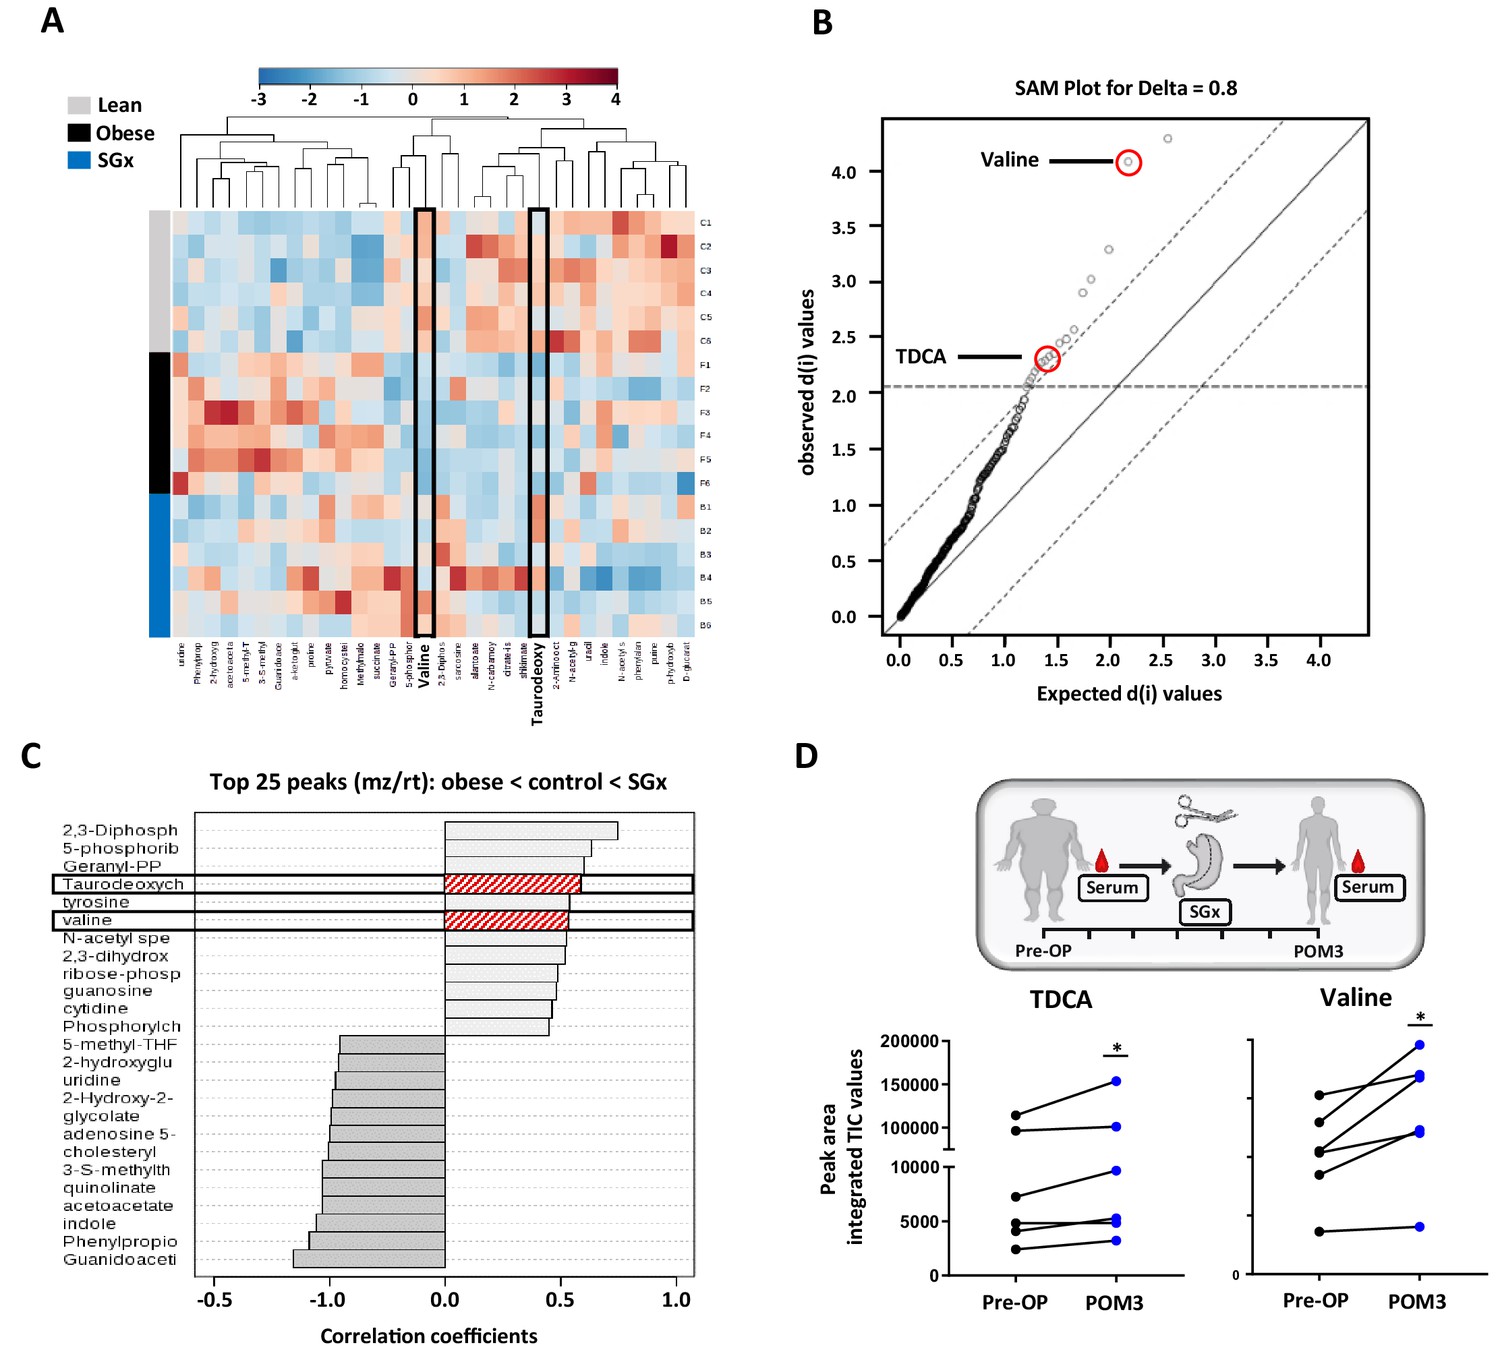
Sleeve gastrectomy (SGx) restores systemic taurodeoxycholic acid (TDCA)/valine levels in both diet-induced obese (DIO) mice and obese humans.
Whole blood samples from C57BL/6 DIO mice after SGx and DIO and lean controls were analyzed with a 5500 QTRAP mass spectrometer. Quantitative analysis was performed utilizing MetaboAnalyst 3.0. (A) Heat map of 32 metabolites displayed after hierarchical clustering, p<0.05. (B) Significance analysis of microarrays (SAM) revealed 17 metabolites with significance. (C) Pattern hunter stratified the 25 metabolites with top peaks (mz/rt) according to the order obese-control-SGx. (D) Serum was isolated from patients undergoing SGx pre-operative (Pre-OP) and 3 months after surgery (POM3). TDCA and valine levels were quantified using mass spectrometry and peak are integrated TIC values compared (n = 6). Results are representative of at least three independent experiments. Statistical significance was determined using one-way analysis of variance (ANOVA) and SAM. TDCA/valine TIC values from human samples were compared using paired Student’s t-test. Asterisks indicate p-values: *p < 0.05, **p < 0.01, and ***p < 0.001. Only significant values are shown (n = 6 animals/group, n = 6 patients). All data supporting figures are provided as source data files.
-
Figure 2—source data 1
The numerical data for the graphs in Figure 2.
- https://cdn.elifesciences.org/articles/62928/elife-62928-fig2-data1-v2.xlsx
Figure 3 with 1 supplement
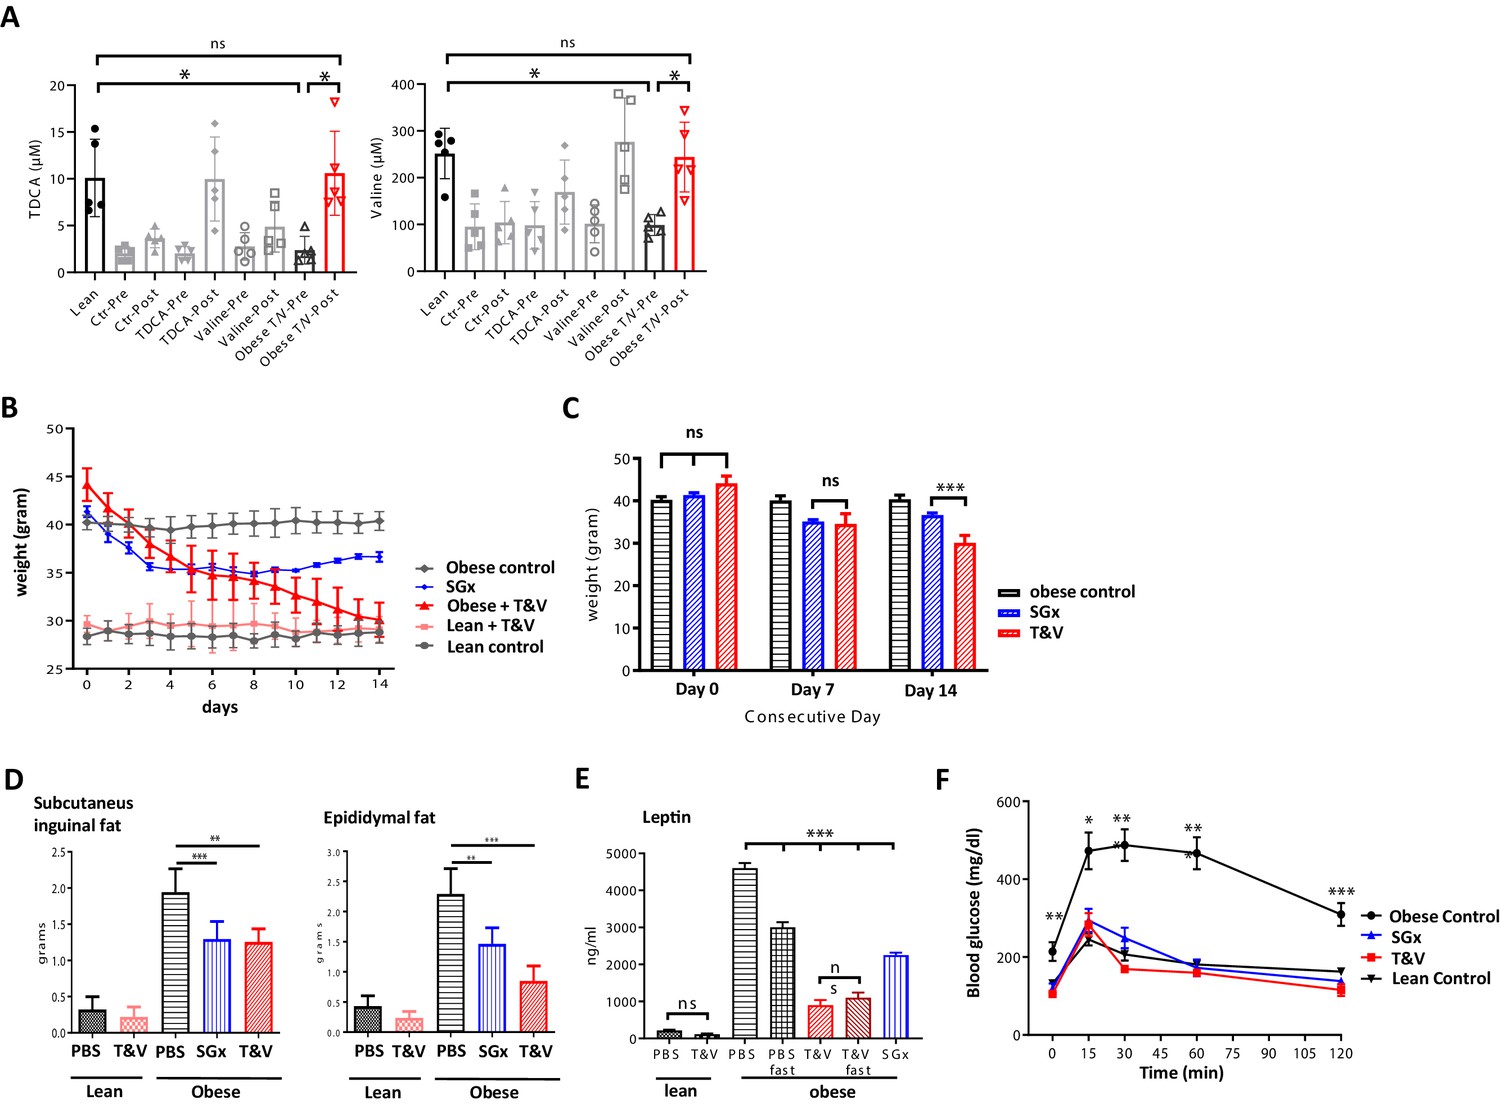
Taurodeoxycholic acid (TDCA)/valine treatment induces robust weight loss and ameliorates obesity-related insulin resistance.
C57BL/6 diet-induced obese (DIO) mice received intraperitoneal injections of TDCA (50 mg/kg) and L-valine (200 mg/kg) daily over the course of 2 weeks. (A) Plasma TDCA and valine levels were quantified before and after 14 days of treatment by mass spectrometry (n = 5). (B) Body weight was evaluated for 2 weeks every 24 hr. (B) Column plot of mean body weight comparing sleeve gastrectomies (SGx) and TDCA/valine (T/V)-treated animals at days 0, 7, and 14. (C) Subcutaneous and epididymal fat tissue was removed after 14 days of treatment or SGx and weight was determined. (D) Systemic leptin levels were quantified by ELISA after fasting in control and T/V-treated DIO and lean mice. (E) 2 g/kg glucose was injected following 8 hr of daytime fasting. Blood glucose levels were assessed in blood samples utilizing a blood glucose meter. Results are representative of at least three independent experiments. Column plots display mean with standard deviation. Statistical significance was determined by using one-way analysis of variance (ANOVA). Asterisks indicate p-values: *p < 0.05, **p < 0.01, and ***p < 0.001. Only significant values are shown (n = 5–7 animals/group).
-
Figure 3—source data 1
The numerical data for the graphs in Figure 3.
- https://cdn.elifesciences.org/articles/62928/elife-62928-fig3-data1-v2.xlsx
Figure 3—figure supplement 1
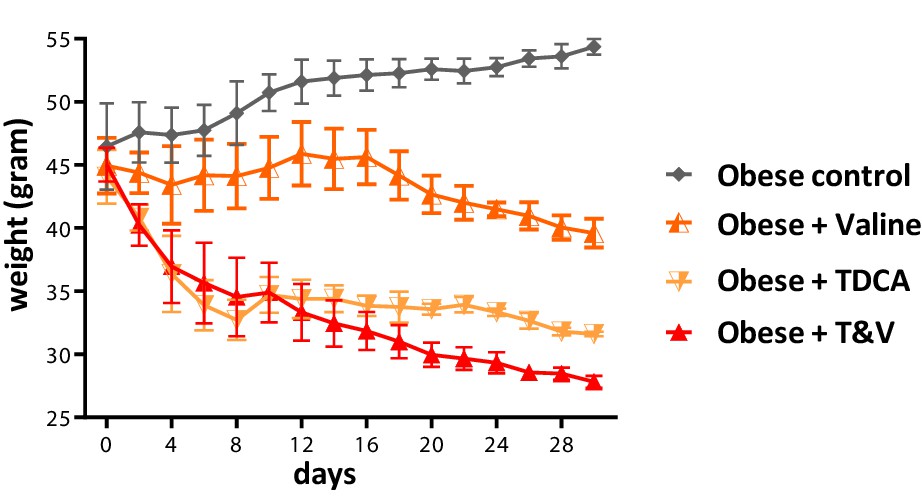
Effect of taurodeoxycholic acid (TDCA), valine, and the combinatorial treatment with TDCA and valine are shown.
C57BL/6 diet-induced obese (DIO) mice received daily, intraperitoneal injections of TDCA (50 mg/kg), L-valine (200 mg/kg), or both over the course of 30 days and weight loss was monitored. Results are representative of at least three independent experiments (mean ± standard deviation [n = 5 animals/group]).
Figure 4

Taurodeoxycholic acid (TDCA)/valine treatment induces weight loss through altered feeding behavior in the absence of reduced energy expenditure.
Twelve DIO mice (control = 6, treatment = 6) were placed into the Columbus Instruments’ Comprehensive Lab Animal Monitoring System (CLAMS) for 6 days. Time graphs represent hourly averages throughout the experiment. Shaded regions represent the 12 hr dark photoperiod. After 1 day of acclimation (not shown), injections of TDCA/valine were performed at 2 p.m. for 5 days. This experiment monitored (A) cumulative energy intake (B) hourly food intake, (C) energy expenditure, (D) locomotor activity, (E) respiratory exchange ratio, and (F) energy balance (energy intake minus energy expenditure). Results are representative of at least three independent experiments. Statistical significance was determined by analysis of variance (ANOVA) using total mass as the covariate. Error bars represent SEM. Asterisks indicate p-values: *p < 0.05, **p < 0.01. Only significant values are shown (n = 6 animals/group).
-
Figure 4—source data 1
The numerical data for the graphs in Figure 4.
- https://cdn.elifesciences.org/articles/62928/elife-62928-fig4-data1-v2.xlsx
Figure 5

Taurodeoxycholic acid (TDCA)/valine treatment acts through suppression of hypothalamic melanin-concentrating hormone (MCH) levels.
(A) Lean and diet-induced obese (DIO) mice were treated daily with either PBS or T and V. Two groups of T and V-treated DIO mice were subjected to 12 hr fasting before tissue procurement. After 2 weeks, all mice were sacrificed, hypothalamus tissue dissected, and RNA levels of POMC, CART, NPY, AgRP, and MCH measured by real-time PCR (RT-PCR). (B) DIO mice were subjected to daily intraperitoneal (i.p.) injection of T and V, oral administration of MCH receptor one inhibitor (MCHR1-I), or a combined treatment of both, T and V + MCHR1-I for a course of 2 weeks. Body weight and food consumption was measured and expressed as a contingency plot displaying total weight, percentage of starting weight, and food consumption per mouse. (C) DIO rats were subjected to combined i.p. TDCA/valine injection and intracerebral administration of recombinant MCH and weight loss was monitored for 2 weeks. Results are representative of at least three independent experiments. Column plots display mean with standard deviation. Statistical significance was determined using one-way analysis of variance (ANOVA). Asterisks indicate p-values: *p < 0.05, **p < 0.01, and ***p < 0.001. Only significant values are shown (n = 5–7 animals/group).
-
Figure 5—source data 1
The numerical data for the graphs in Figure 5.
- https://cdn.elifesciences.org/articles/62928/elife-62928-fig5-data1-v2.xlsx
Figure 6
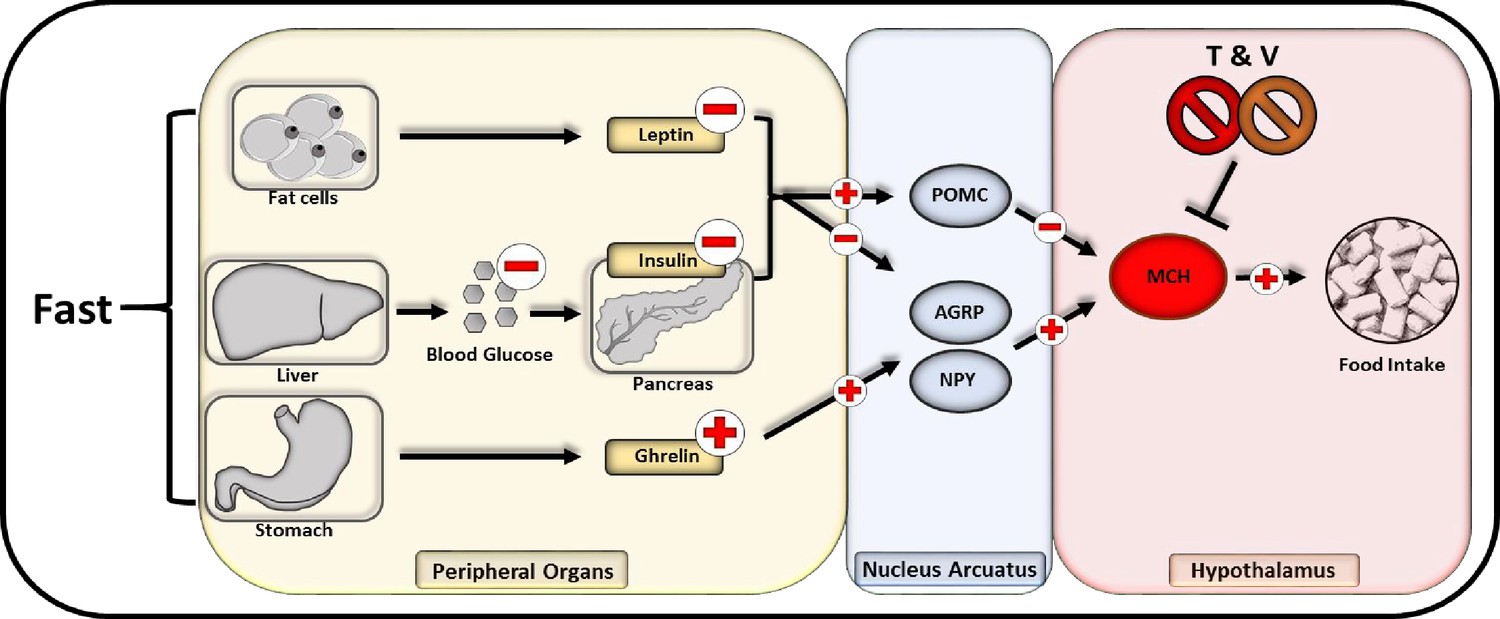
Flowchart of neuropeptide-mediated appetite regulation and taurodeoxycholic acid (TDCA)/valine interaction.
Fasting promotes the release of melanin-concentrating hormone (MCH) communicated through various endocrinological pathways. During fasting, fat cells decrease the secretion of leptin while a compromised hepatic gluconeogenesis dampens the pancreatic insulin secretion. Within the stomach in turn, an augmented amount of ghrelin is released. All three pathways lead to an activation of AGRP and NPY releasing neurons within the nucleus arcuatus while inhibitory pro-opiomelanocortin (POMC) neurons are impeded. Subsequently AGRP and NPY neurons promote the activation of MCH releasing neurons located in the hypothalamus that are directly stimulating appetite and food intake.
Tables
Key resources table
| Reagent type (species) or resource | Designation | Source or reference | Identifiers | Additional information |
|---|---|---|---|---|
| Strain, strain background (Mus musculus) | Diet-induced obese (DIO) C57BL/6 mice | Taconic | B6-M | |
| Strain, strain background (Mus musculus) | Lean C57BL/6 mice | Taconic | DIO-B6-M | |
| Strain, strain background (Rattus norvegicus) | Wistar rats | Charles River | 003 | |
| Peptide, recombinant protein | Recombinant MCH | Cayman Chemical | ID: 24462 | |
| Commercial assay or kit | Direct-zol RNA MiniPrep kit | Zymo Research | ID: 205311 | |
| Commercial assay or kit | Reverse transcriptase QuantiTech RT Kit | Qiagen | ID: R2061 | |
| Commercial assay or kit | SYBR Green master mix | Applied Biosystems | ID: 4309155 | |
| Chemical compound, drug | MCHR1-I | Takeda | ||
| Chemical compound, drug | TDCA | Sigma-Aldrich | ID: T0875-25G | |
| Chemical compound, drug | Valine | Sigma-Aldrich | ID: V0513-25G | |
| Software, algorithm | GraphPad Prism software | San Diego, CA | SCR_002798 | |
| Software, algorithm | MetaboAnalyst 3.0 | Genome Canada | SCR 015539 | |
| Other | Glucose | Sigma-Aldrich | ID: 50-99-7 | |
| Other | HFD D12492 | Research Diets Inc | ID: 50-99-712492 |
Additional files
Download links
A two-part list of links to download the article, or parts of the article, in various formats.
Downloads (link to download the article as PDF)
Open citations (links to open the citations from this article in various online reference manager services)
Cite this article (links to download the citations from this article in formats compatible with various reference manager tools)
Restored TDCA and valine levels imitate the effects of bariatric surgery
eLife 10:e62928.
https://doi.org/10.7554/eLife.62928


