A cross-sectional study of functional and metabolic changes during aging through the lifespan in male mice
- Center for Healthy Aging, ICMM, University of Copenhagen, Denmark
- Translational Gerontology Branch, National Institute on Aging, NIH, United States
- Laboratory of Cardiovascular Science, National Institute on Aging, NIH, United States
- Department of Physical Therapy, University of Sciences, United States
- Division of Geriatric Medicine, Department of Medicine, University of Pittsburgh, United States
- Integrative Cell Signaling and Neurobiology of Metabolism Program, Yale University School of Medicine, United States
- Vascular Biology and Therapeutics Program, Yale University School of Medicine, United States
- Department of Comparative Medicine, Yale University School of Medicine, United States
- Department of Pathology, Yale University School of Medicine, United States
- Laboratory of Clinical Investigation, National Institute on Aging, NIH, United States
Figures
Figure 1 with 1 supplement
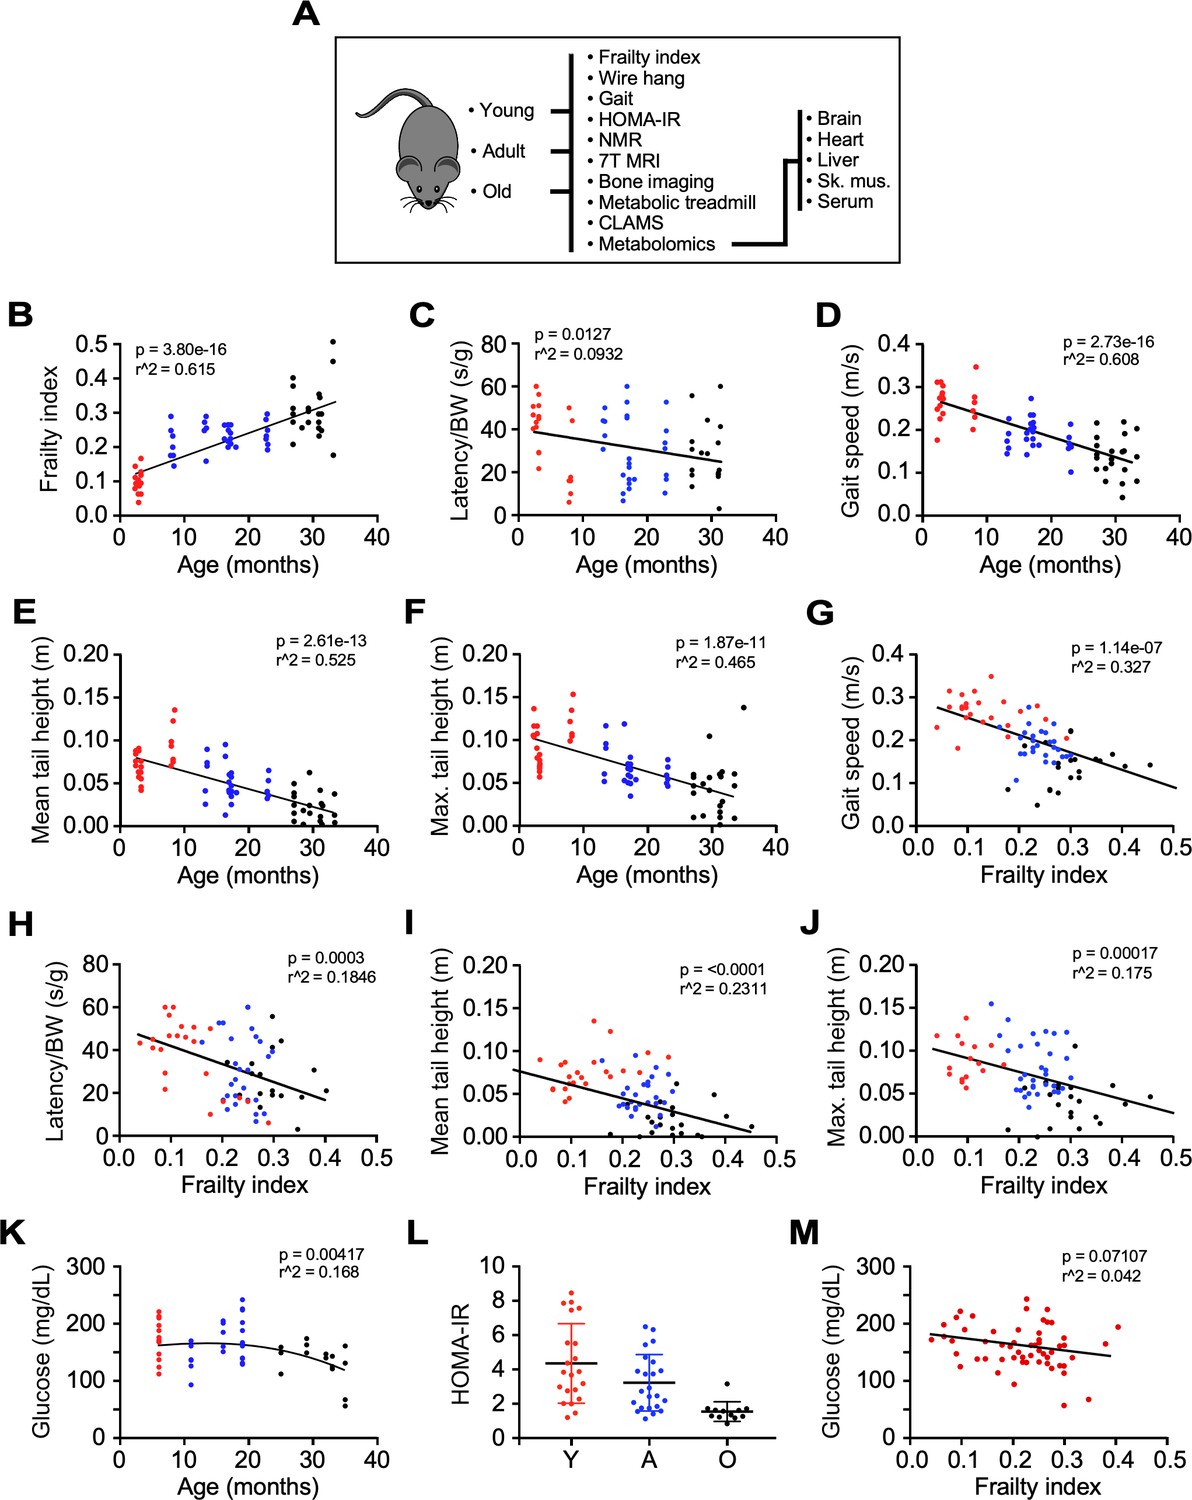
Impact of age and frailty on motor function, gait, and glucose homeostasis in male C57BL/6N mice.
(A) Flowchart depicting analyses performed in the study. (B–D) Effects of age on frailty index, motor function, and gait speed in mice. (E–F) Mean and maximum tail height as a function of age. (G–J) Negative correlation between gait speed, motor function, and tail height with frailty. (K) Dependence of fasting blood glucose with age. (L) Scatter plot depicting insulin sensitivity as measured by the HOMA-IR index. (M) Relationship between fasting blood glucose and frailty index. Glucose measurement was performed 3 months after frailty assessment. (B–M): Mice ranged in age from 3 to 33 months. Y: young (3–8 mo, n = 23); A, adult (13–23 mo, n = 26); O: old (27–33 mo, n = 22). The actual number of data points shown on the graphs varies as not all mice were tested for any given intervention.
Figure 1—figure supplement 1
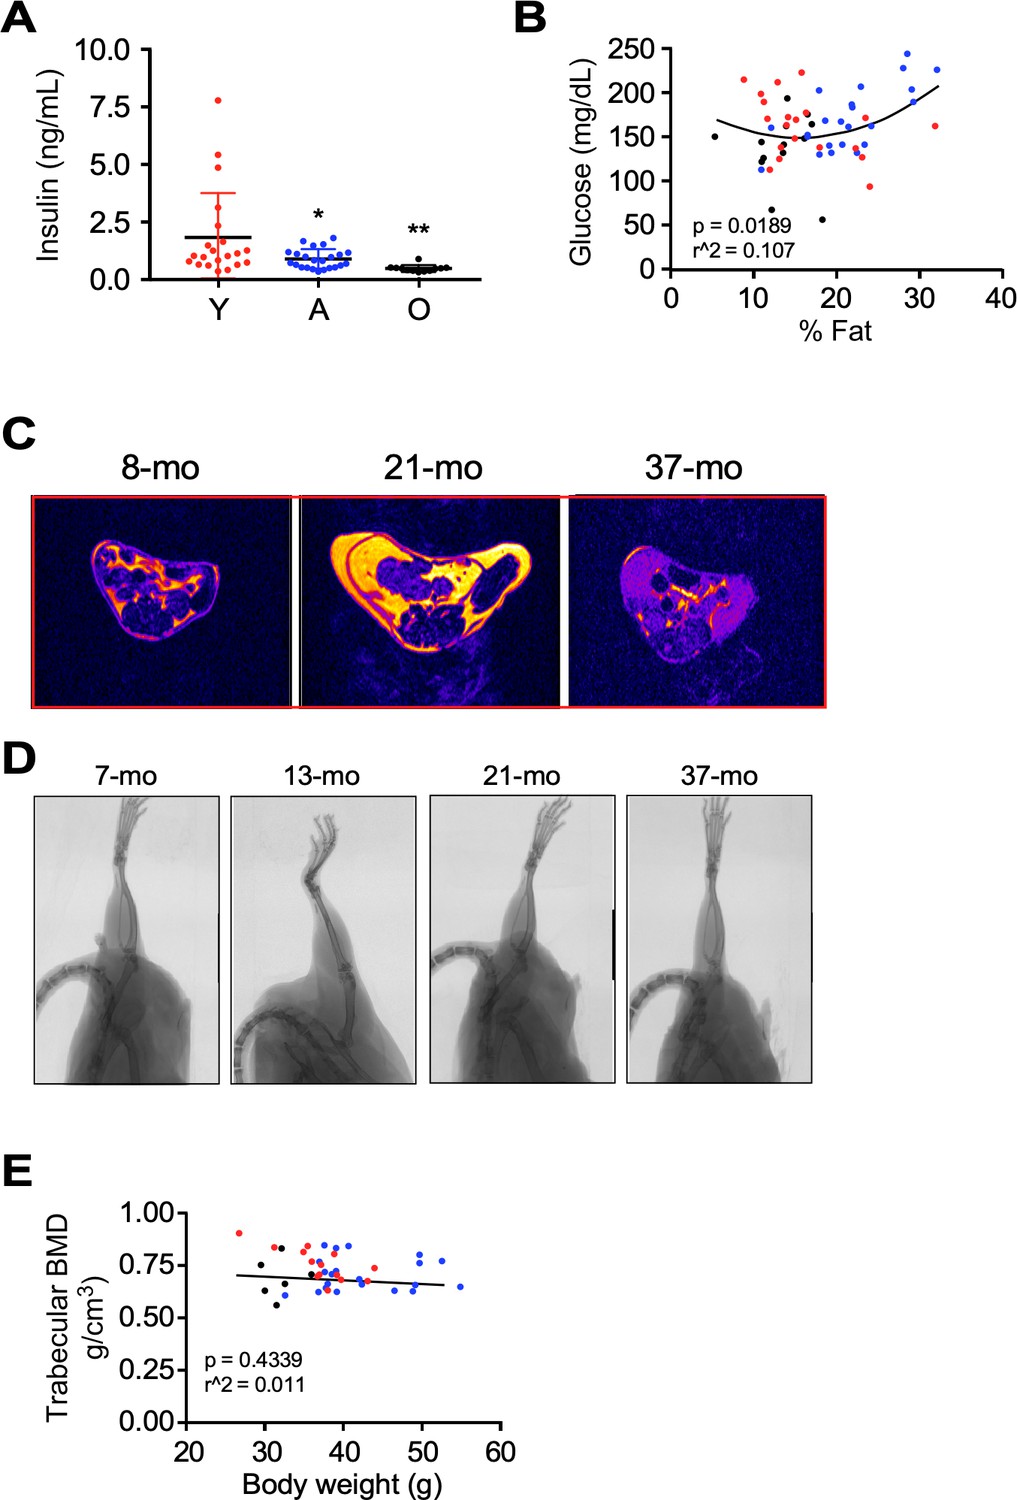
Phenotypic characteristics of male mice in function of age.
(A) Trajectory of fasting insulin levels. (B) Correlation between fasting blood glucose and % fat content from the whole cohort of mice. (C) Representative MRI images spanning the abdominal region from a young, adult, and old male mouse. (D) Representative micro-CT scans from a young, adult, and old male mouse. (E) Correlation between BMD (bone mineral density) and body weight from the whole cohort of mice.
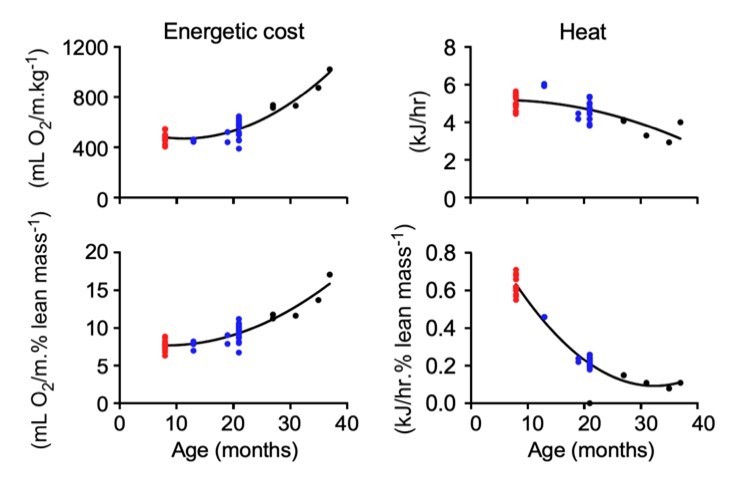
Figure 2 with 1 supplement
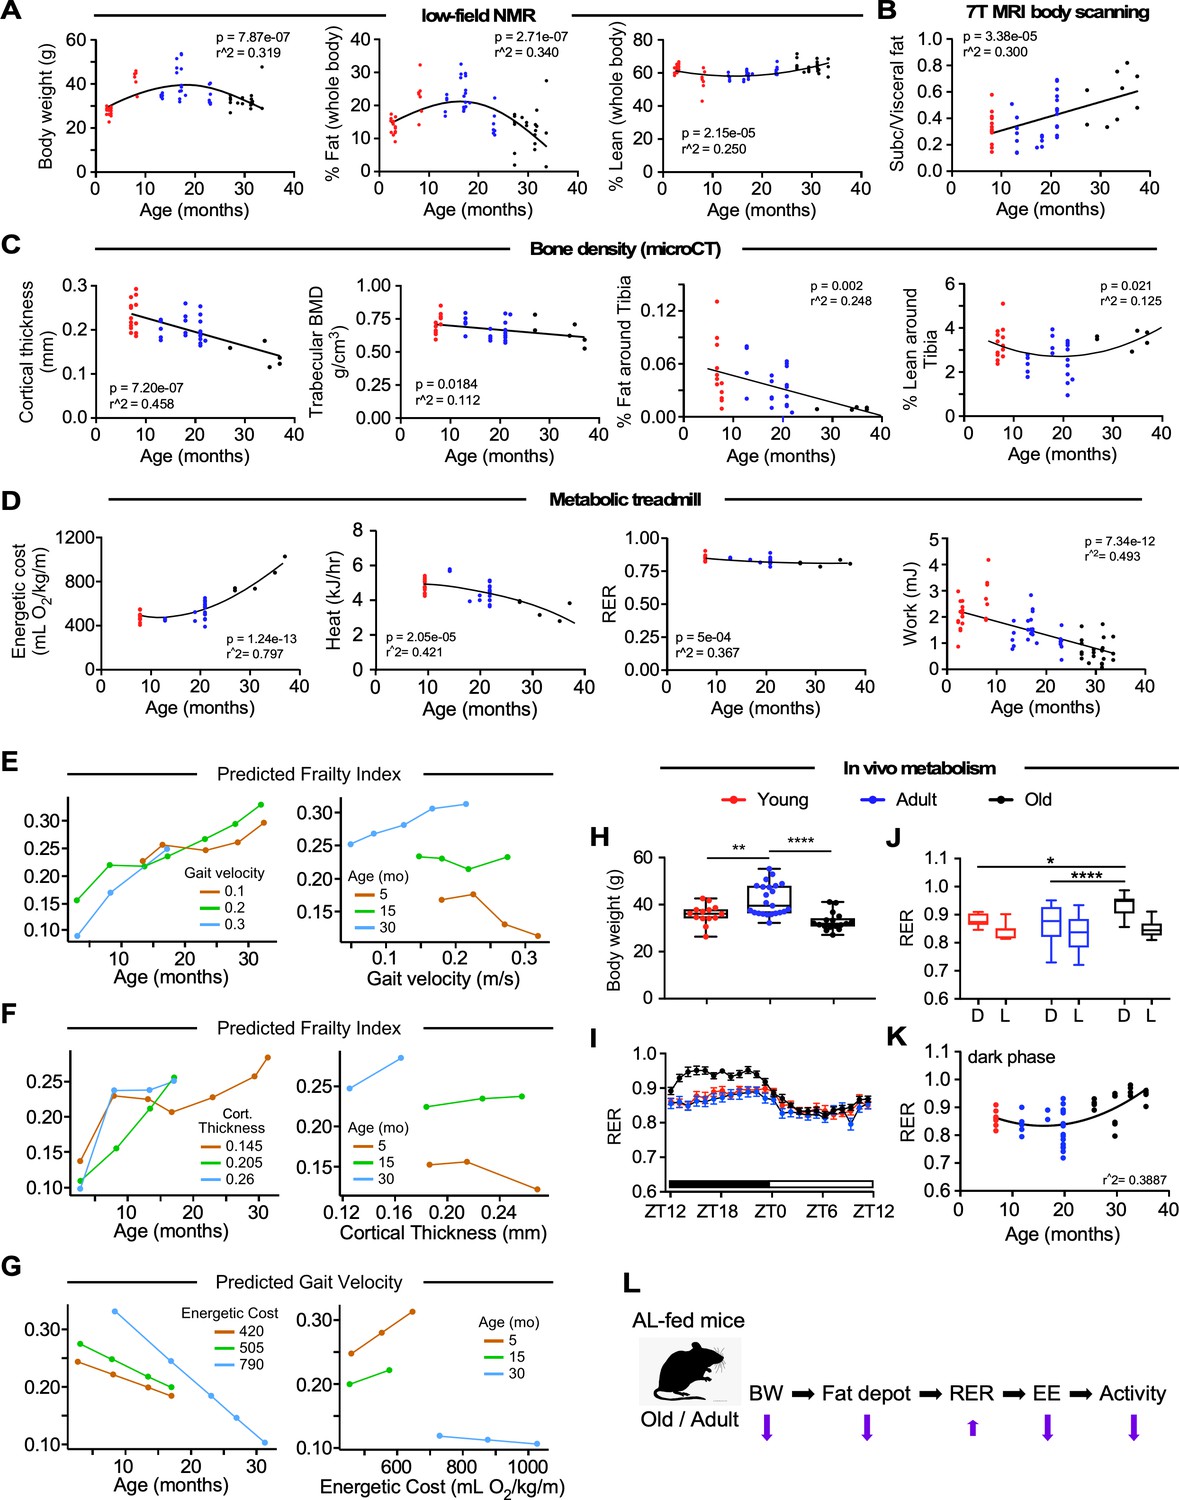
Impact of age on body composition measurements, bone density, and in vivo metabolic function in male C57BL/6N mice.
(A) Body weight (left panel), percentages of whole-body fat mass (middle panel) and lean tissue mass (right panel) as assessed by low-field nuclear magnetic resonance imaging. (B) Ratio of subcutaneous to visceral fat calculated from abdominal 7-Tesla MRI scanning. (C) In vivo microCT analysis of the tibia was carried out to measure cortical thickness, trabecular bone mineral density (BMD), as well as fat and lean mass around the tibia expressed as percentage of the total body weight. (D) Metabolic parameters derived from the metabolic treadmill as a function of age. Energetic cost (left panel); heat generation (second panel); RER, respiratory exchange ratio (third panel); and Work (right panel). Energetic cost was determined from VO2 per unit of body weight and gait speed while work was expressed as mJoules. (E–G) Multiple regression analyses with frailty index (E, F) and gait velocity (G) as response variables. The modeling approach consisted of fitting a series of four regressions for each of the response variables. The explanatory variables included in the multiple regression modeling are depicted in Figure 2—source data 1. (E) left panel, Effect of gait velocity on the relationship between frailty and age; right panel, Impact of age on the interaction between frailty and gait velocity. (F) left panel, Effect of bone cortical thickness on the relationship between frailty and age; right panel, Impact of age on the interaction between frailty and bone cortical thickness. (G) left panel, Effect of energetic costs on the relationship between gait velocity and age; right panel, Impact of age on the interaction between gait velocity and energetic costs. Although this is a cross-sectional study, the points were joined to help the reader see the various associations without suggesting that there is causal association; for example, that animals with higher age tend to have higher frailty within the same gait velocity (E, left panel). (H–K) Mice at different ages were placed into metabolic cages for 72 hr to measure VO2, VCO2, RER, heat production, and ambulatory activity counts. The values associated with the first 12 hr acclimatization phase (L1) were discarded. (H) Body weight as mice entered the metabolic cage. (I) Averaged hourly RER trajectories were captured during two dark/light cycles in young (n = 8), adult (n = 22) and old (n = 18) mice. ZT, zeitgeber time is defined as the 12:12 hr light/dark cycle that synchronizes organismal biological rhythms. Each point represents mean ± SEM. (J) Scatter plot depicting RER values averaged over 48 hr for individual mice in the three age groups. (K) Relationship between RER and age. Data in (H) and (J) were analyzed using one-way ANOVA with Dunnett’s post-hoc analysis. *, p<0.05; **, p<0.01; ****, p<0.0001. (L) Diagram depicting the impact of age on body composition and energetic parameters in AL-fed male mice.
-
Figure 2—source data 1
Multiple regression analyses results for frailty index and gait velocity.
- https://cdn.elifesciences.org/articles/62952/elife-62952-fig2-data1-v2.docx
-
Figure 2—source data 2
Area under the curves (AUCs) from the averaged, hourly trajectories of various energetic parameters that were captured during two dark/light cycles in young, adult, and old mice.
- https://cdn.elifesciences.org/articles/62952/elife-62952-fig2-data2-v2.docx
-
Figure 2—source data 3
Distribution of various energetic parameters in male mice in various age groups.
- https://cdn.elifesciences.org/articles/62952/elife-62952-fig2-data3-v2.docx
-
Figure 2—source data 4
Linear regression of the metabolic cage data obtained from the whole cohort of male mice and after segregation by age groups.
- https://cdn.elifesciences.org/articles/62952/elife-62952-fig2-data4-v2.docx
-
Figure 2—source data 5
Generalized linear model (GLM) to assess potential significant interaction effect in energetic parameters between mice of various age groups.
- https://cdn.elifesciences.org/articles/62952/elife-62952-fig2-data5-v2.docx
Figure 2—figure supplement 1
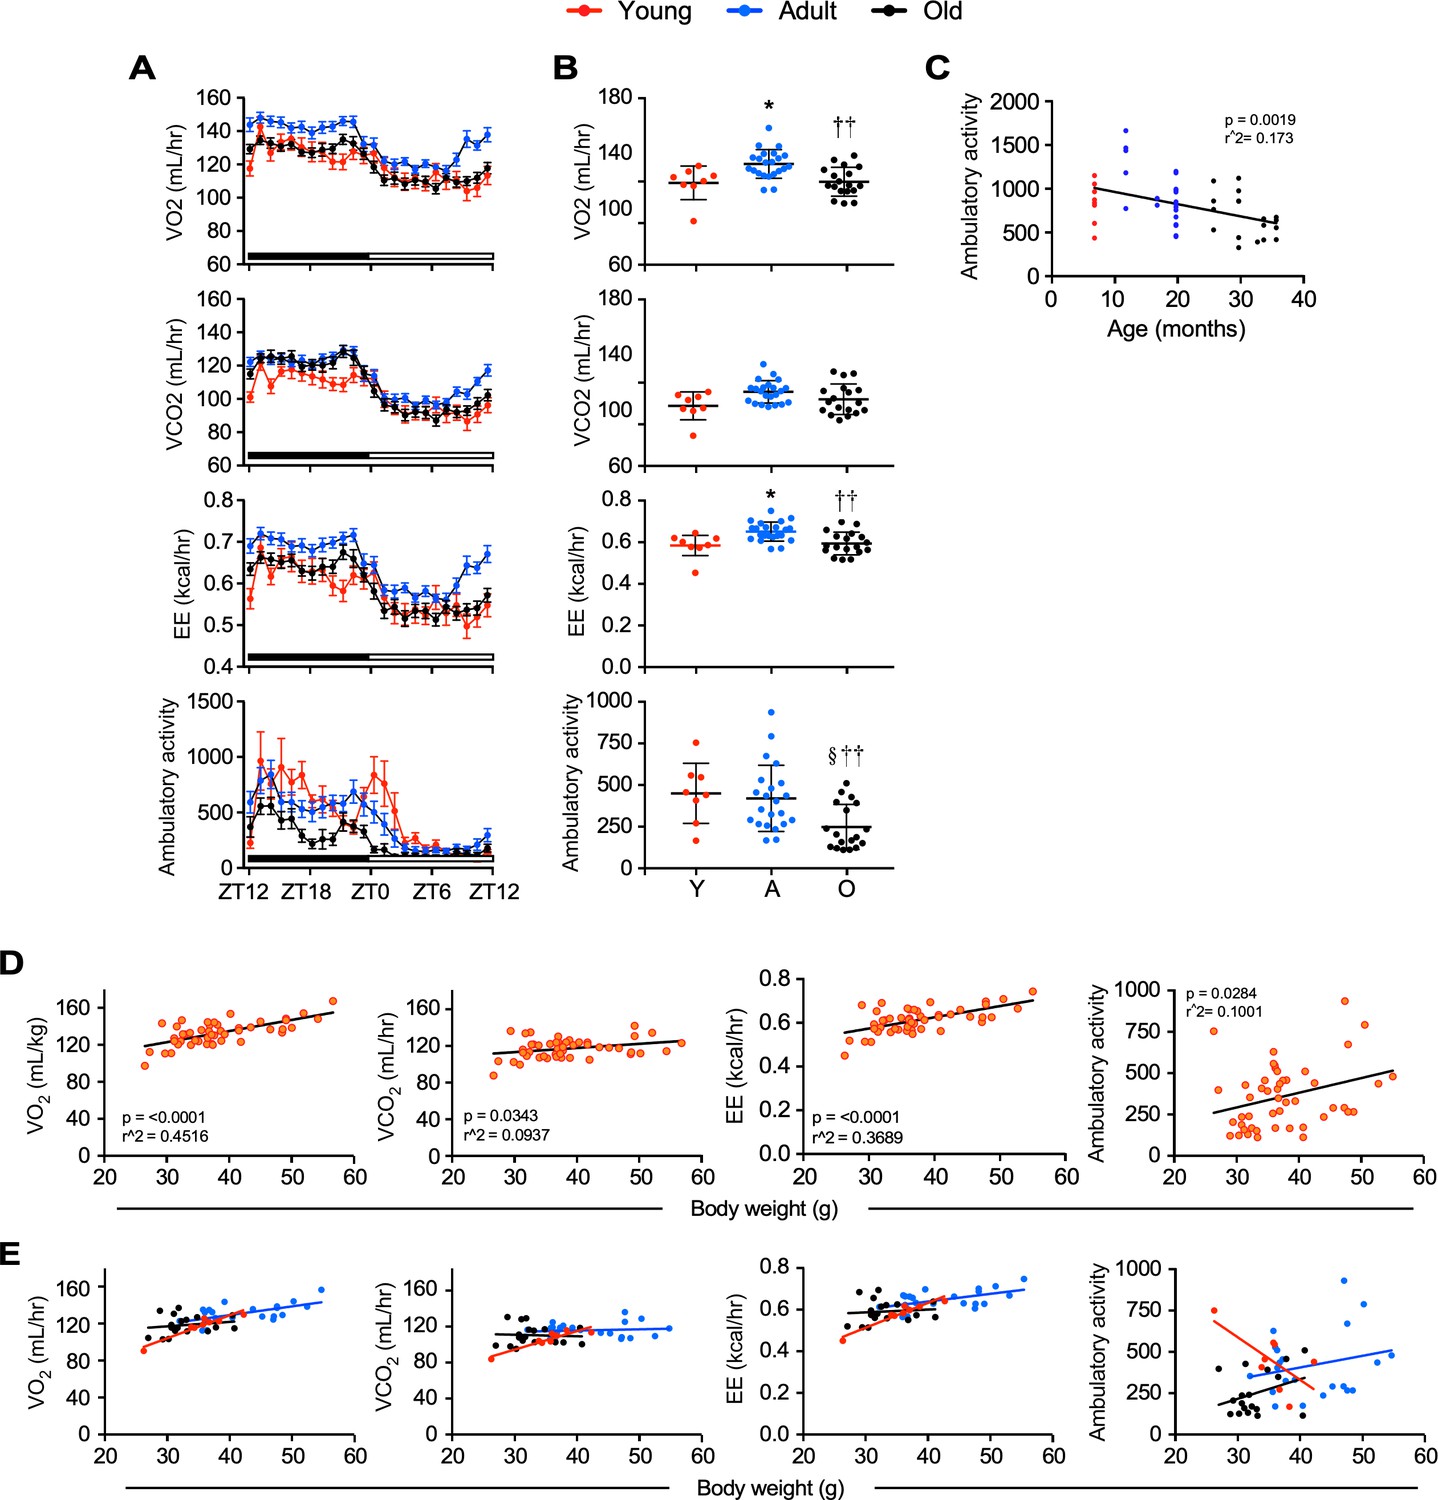
In vivo metabolic data by indirect calorimetry.
Mice of various ages were placed into metabolic cages for 72 hr to measure VO2, VCO2, energy expenditure (EE), and ambulatory activity counts. The values associated with the first 12 hr acclimatization phase (L1) were discarded. Averaged hourly trajectories were captured during two dark/light cycles. (A) Illustration of one dark/light cycle. ZT, zeitgeber time is defined as the 12:12 hr light/dark cycle that synchronizes organismal biological rhythms. Each point represents mean ± SEM in young (n = 8), adult (n = 22), and old (n = 18) mice. (B) Scatter plot depicting the averaged 48 hr values for VO2, VCO2, EE, and ambulatory activity counts from individual mice among the three age groups. Data were analyzed using one-way ANOVA with Dunnett’s post-hoc analysis. *, p<0.05 vs. young (Y); ††, p<0.01 vs. adult (A); §, p<0.05 vs. Y. (C) Relationship between ambulatory activity and age. No significant changes were observed for VO2, VCO2 and EE vs. age (data not shown). (D–E) Correlation between the indicated energetic parameters and body weight from the whole cohort of mice (n = 48) (I) or segregated by age groups (J) (red, young: 3–8 mo (n = 8); blue, adult: 13–24 mo (n = 22); black, old: 28–33 mo (n = 18)). See Table S4 for r2 values of each correlation depicted in (J).
Figure 3 with 1 supplement
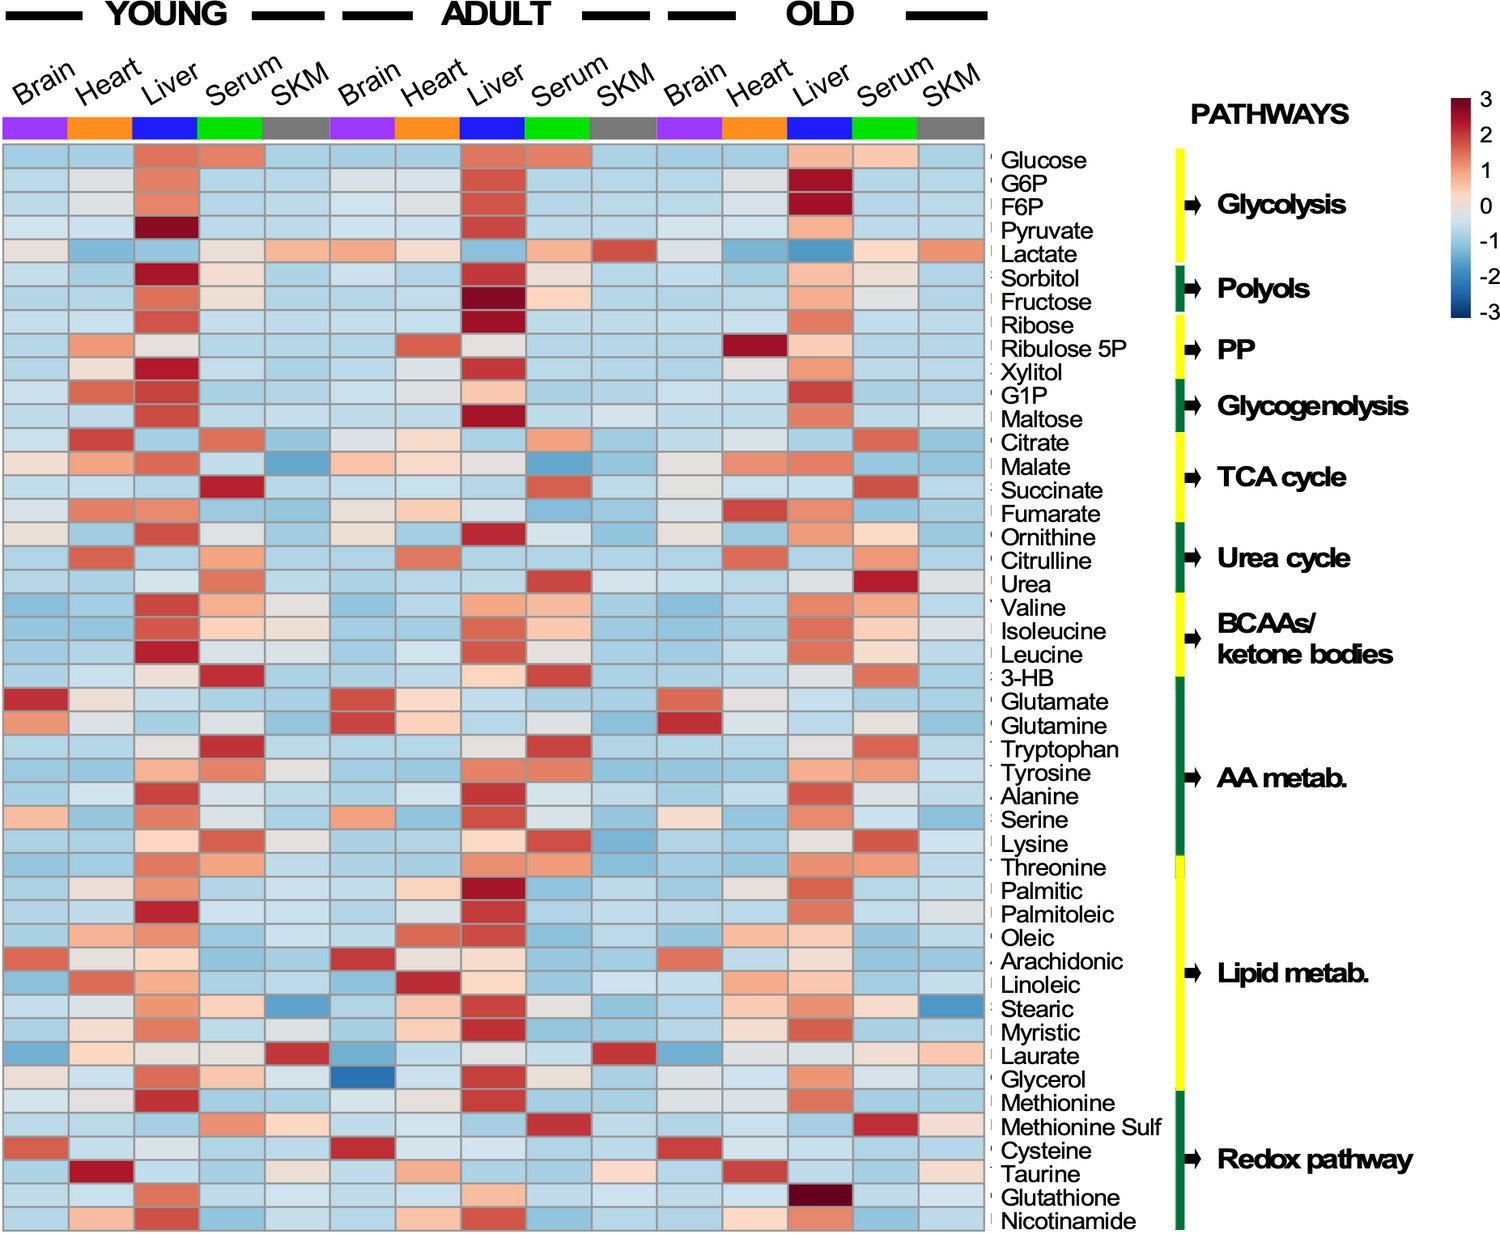
Heatmap depicting levels of modulated metabolites and associated pathways in brain, heart, liver, serum, and skeletal muscle from young, middle-age, and old mice.
There were 46 metabolites involved in more than 10 defined pathways that were shared between serum and various organs across the three age groups. Each row represents a single metabolite, and each column depicts averaged values for each tissue and age group (In each tissue, n = 11–12 animals for young; n = 7 for adult; and n = 11–12 for old). For each metabolite, standardized abundance was calculated. The pseudocolor scaling of the standardized expression is from low (blue) to high (red).
Figure 3—figure supplement 1
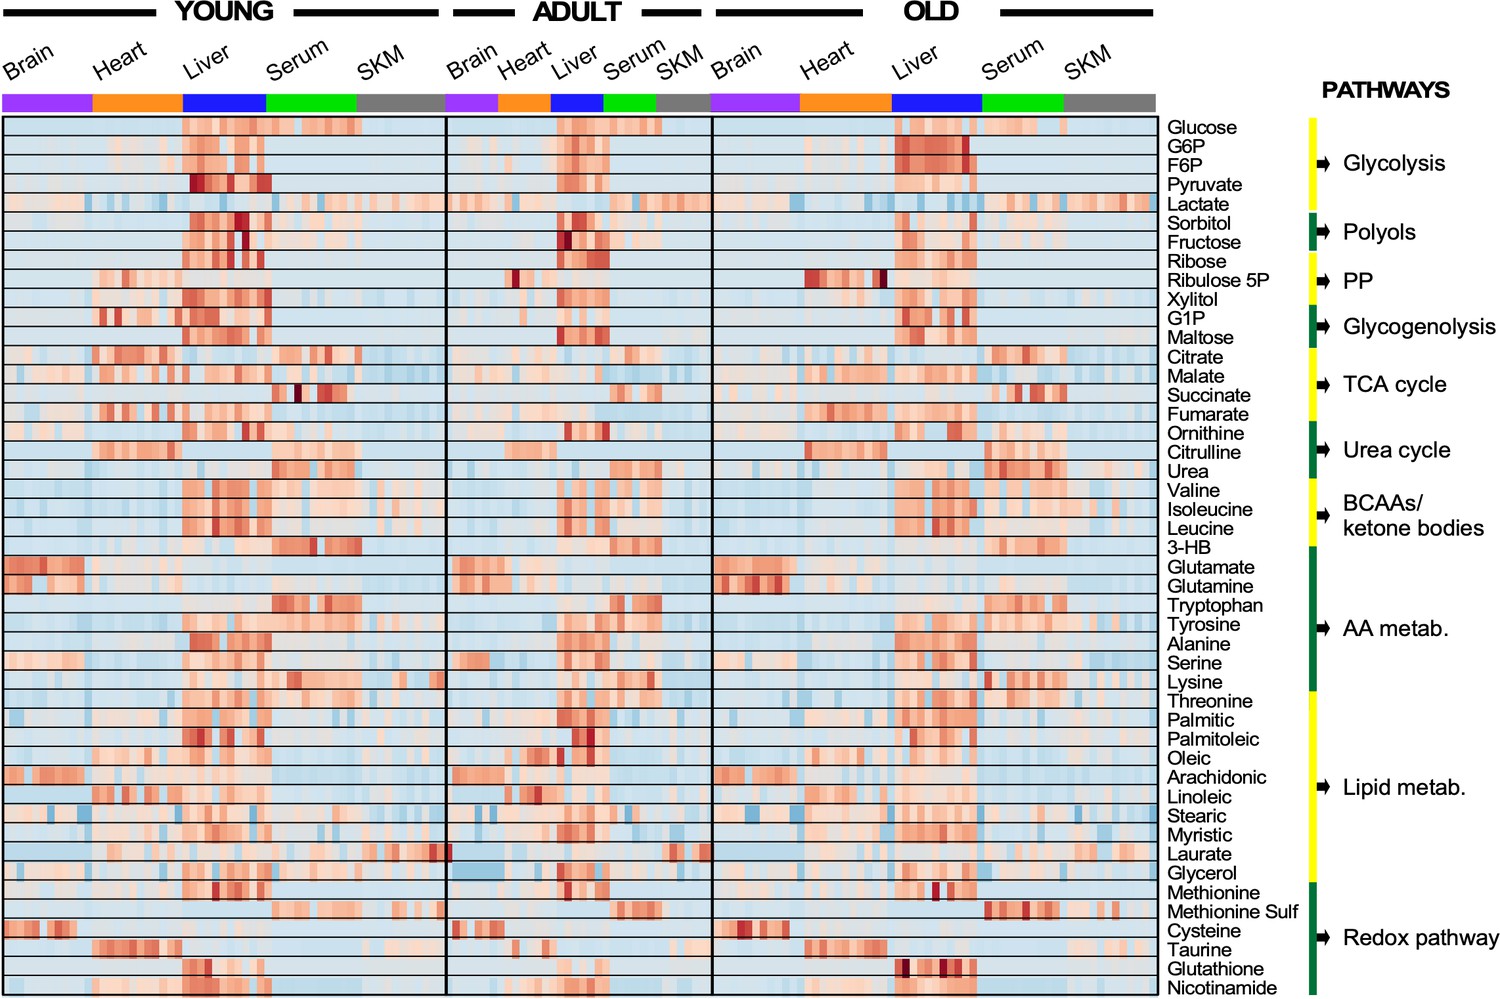
Heatmap depicting levels of regulated metabolites and associated pathways in brain, heart, liver, serum, and skeletal muscle from young, adult, and old mice.
There were 46 metabolites involved in more than 10 defined pathways that were shared between serum and the four organs across the three age groups. Each row represents a single metabolite, and each column depicts a single mouse (In each tissue, n = 11–12 animals for young; n = 7 for adult; and n = 11–12 mice for old). For each metabolite, standardized abundance was calculated. The pseudocolor scaling of the standardized expression is from low (blue) to high (red).
Figure 4 with 1 supplement
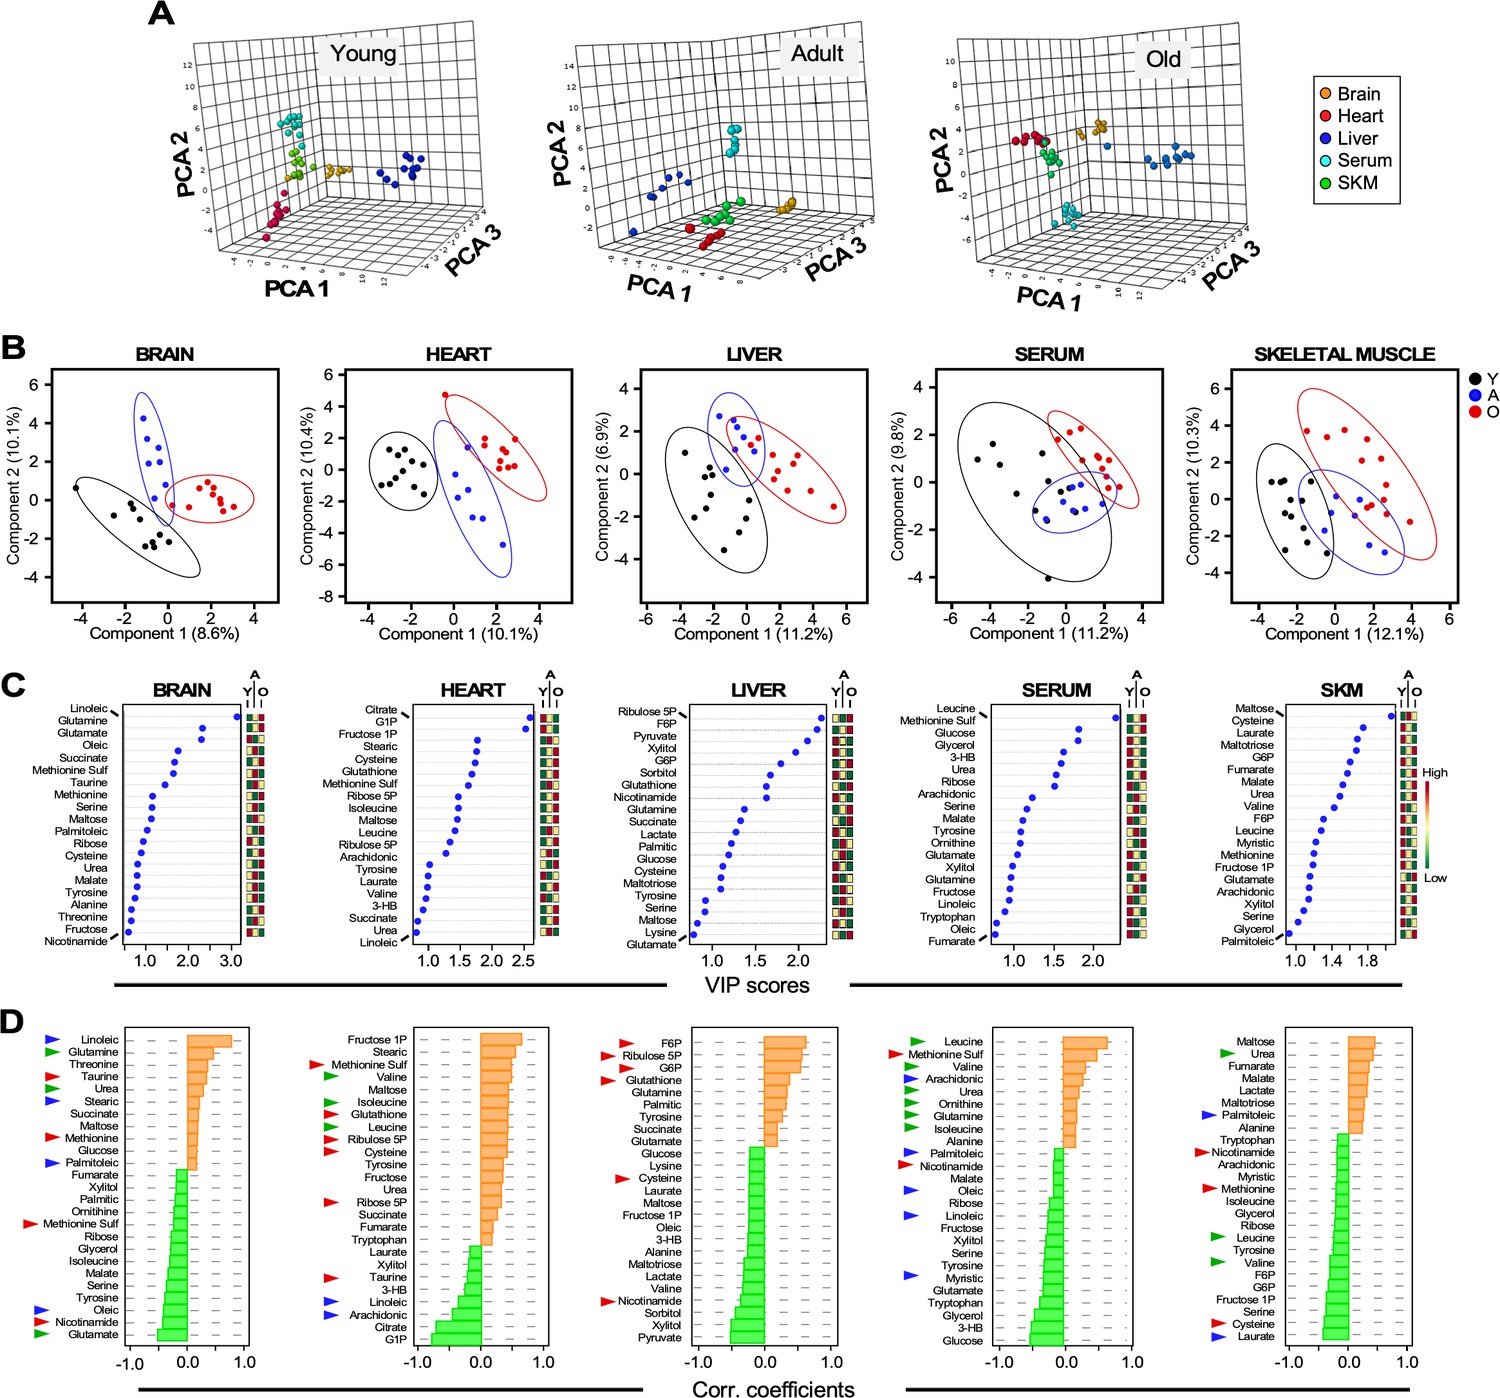
Untargeted metabolomics performed in multiple organs and serum from young, adult, and old male C57BL/6N mice.
(A) Three-dimensional principal component analysis (PCA) depicting the effect of age across various organs and serum. (B) Brain, heart, liver, serum, and skeletal muscle metabolite profiles from young (Y, black symbols), adult (A, blue symbols) or old (O, red symbols) mice were analyzed by Partial Least Square Determinant Analysis (PLS-DA). A statistically significant degree of separation was observed between age groups. The ellipses correspond to 95% confidence intervals for a normal distribution. Each principal component is labeled with the corresponding percent values. (C) Variable in projection (VIP) scores of positively (red boxes) and negatively (green boxes) correlating metabolites in each tissue or serum as a function of age. (D) Correlation coefficients of the top 25 metabolites that correlated positively (orange bars) and negatively (green bars) as a function of age for the indicated tissues and serum. Blue arrowhead, fatty acids; green arrowhead, amino acids and related; red arrowhead, redox and related.
Figure 4—figure supplement 1
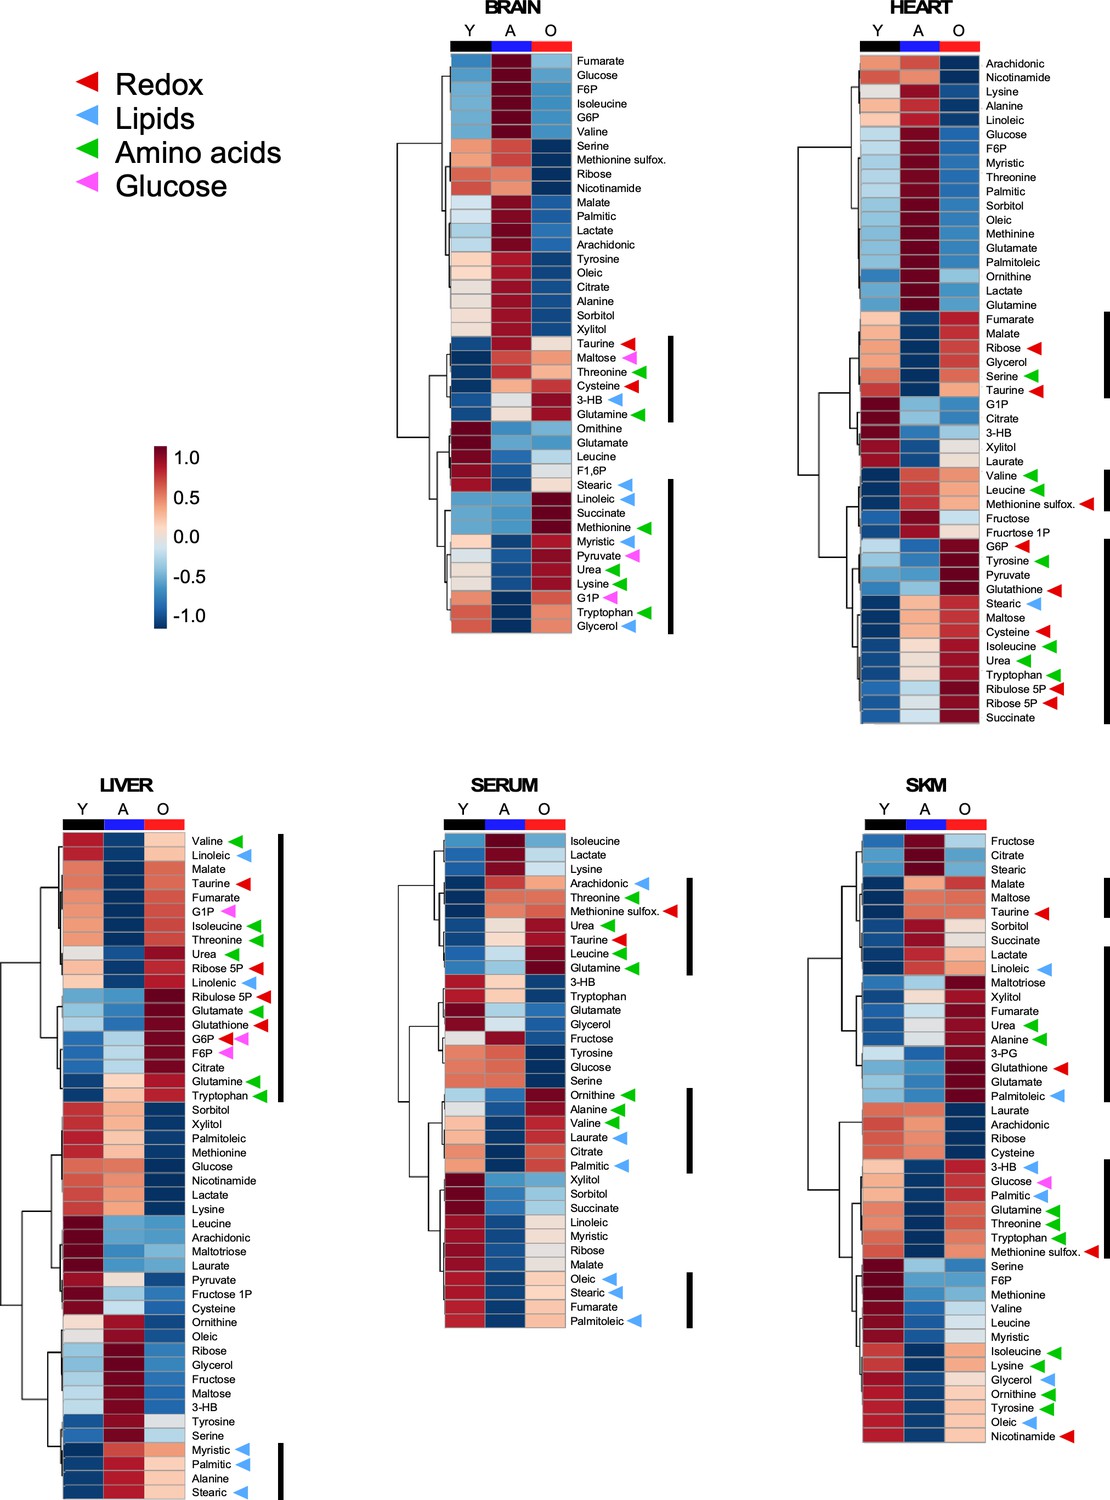
Heatmaps depicting average values of the metabolites enriched in brain, heart, liver, serum and skeletal muscle, respectively, as a function of age.
Arrowheads depict cluster of metabolites.
Figure 5
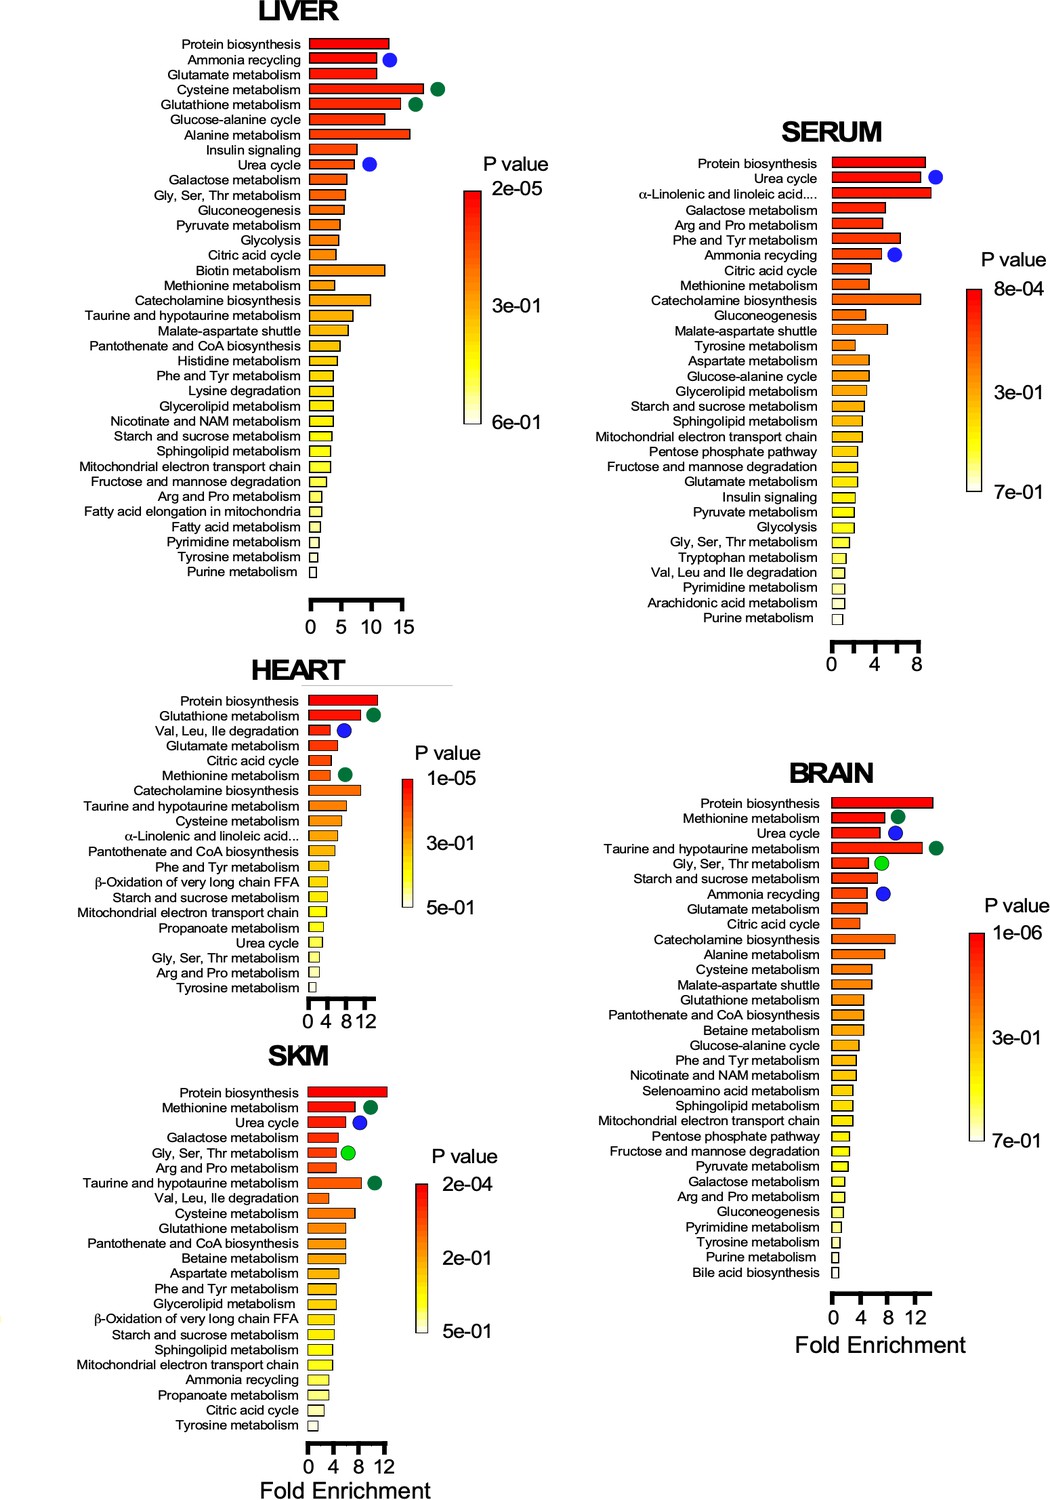
Pathway enrichment in brain, heart, liver, serum, and skeletal muscle Metabolite set enrichment analysis (MSEA) showing the statistical significance of the metabolic pathways involved for each organ.
Note the metabolic remodeling occurring with age, as it pertains to redox-related pathways (green symbols), urea cycle and ammonia cycling through amino acid degradation (dark blue symbols), and one-carbon metabolism (light green symbols).
Figure 6 with 1 supplement
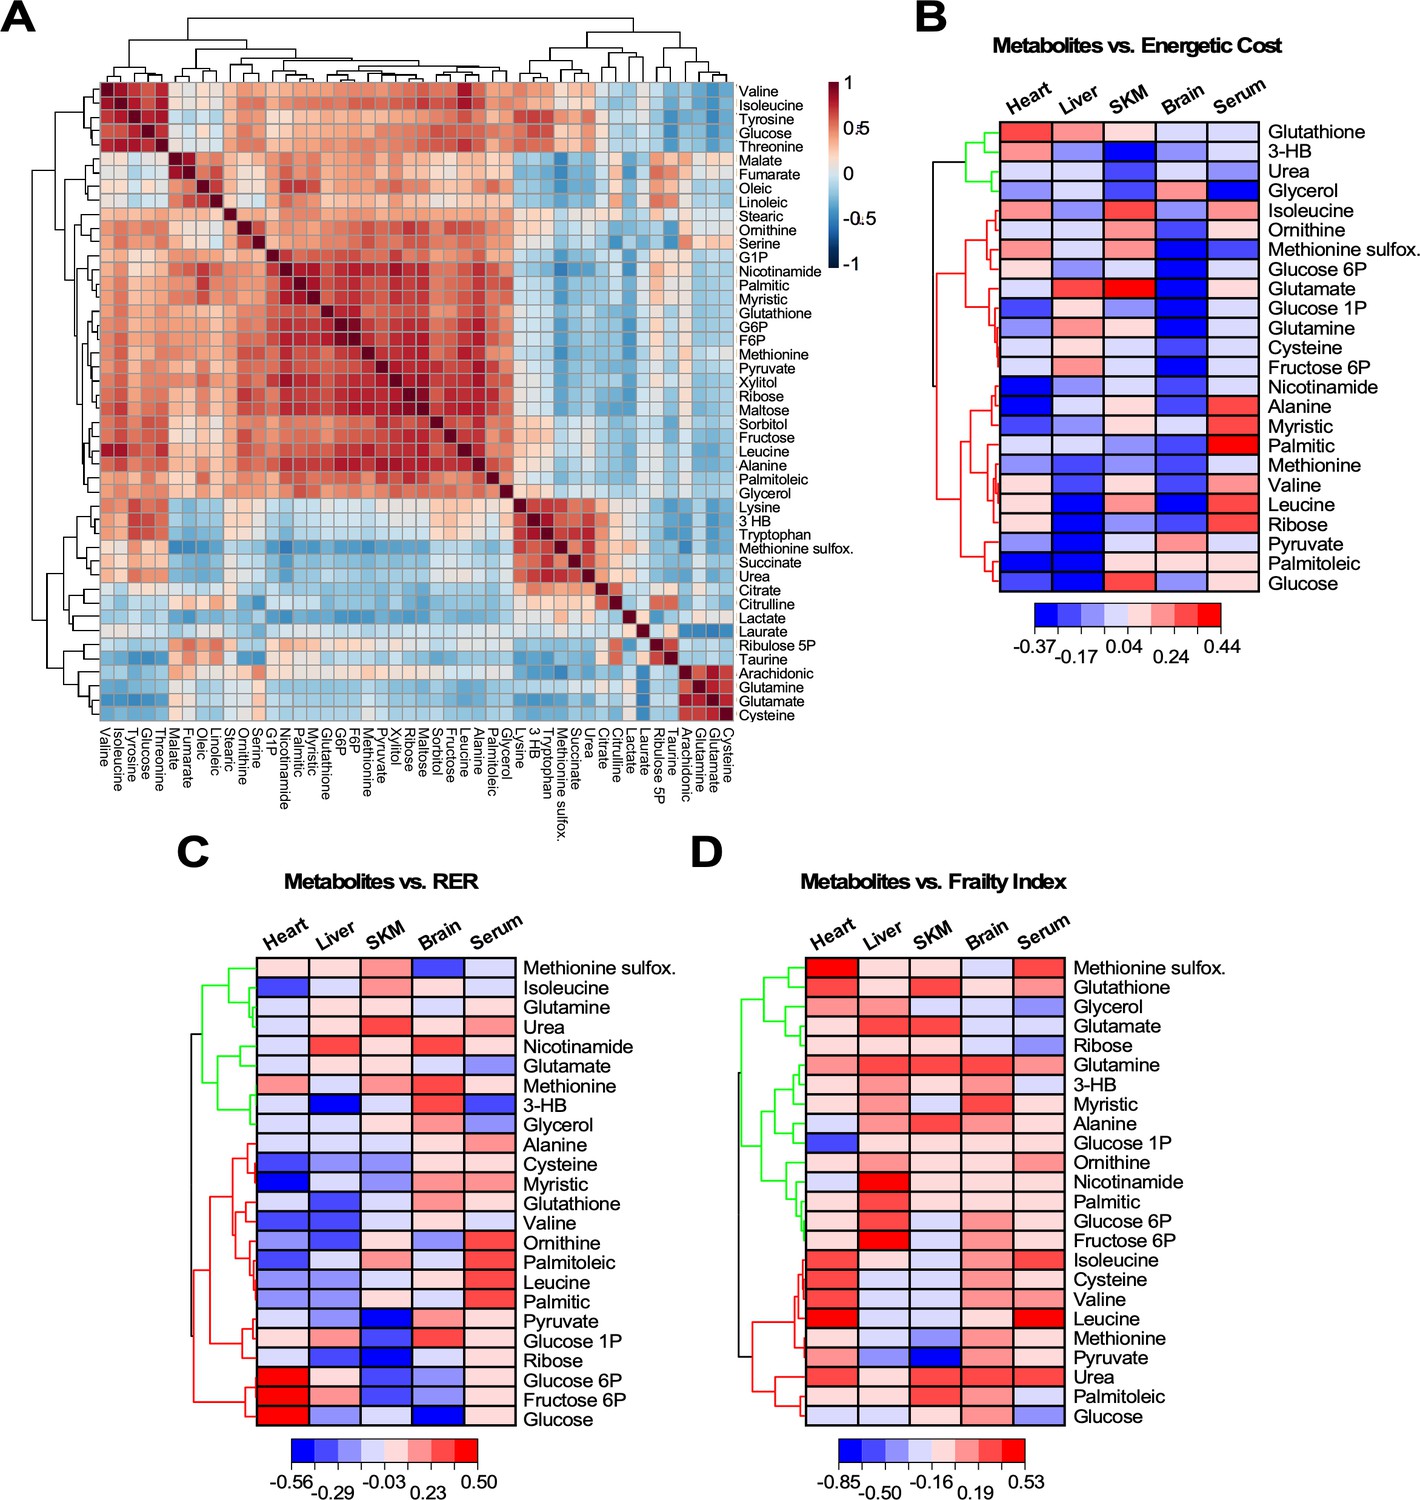
Heatmaps of hierarchically clustered correlation coefficients of representative metabolites from organs and serum vs. different physiological metrics.
(A) Correlation matrix of the 46 metabolites significantly changed across age, organs and serum. Using the statistical module of MetaboAnalyst, we determined the clusters of normalized metabolites covarying positively or negatively, independently of organ or serum and age. The type (positive or negative) and strength (color intensity) of correlation are coded brown and blue, respectively, normalized between 1 and −1 according to the bar on the right. (B–D) Twenty-four significantly changed metabolites representative from all pathways that covary independently from organs or serum and age (see panel A) were correlated with energetic cost (B), RER (C) or frailty index (FI) (D). Using the software Origin v. 2021, we performed scatter plot correlation matrices (see Figure 6—figure supplement 1) to determine the Pearson correlation coefficient, r (p<0.05), for each of the 24 metabolites in each organ and serum vs. each of the physiological metrics analyzed. Displayed are in the form of hierarchically clustered heatmaps (dendogram on the left) corresponding to the ensemble of correlation coefficients, positive (red) and negative (blue), exhibited by each metabolite vs. the specified physiological metric.
-
Figure 6—source data 1
The Pearson correlation coefficient, r, value for each metabolite vs. energetic cost, RER, and Frailty index.
- https://cdn.elifesciences.org/articles/62952/elife-62952-fig6-data1-v2.xlsx
Figure 6—figure supplement 1
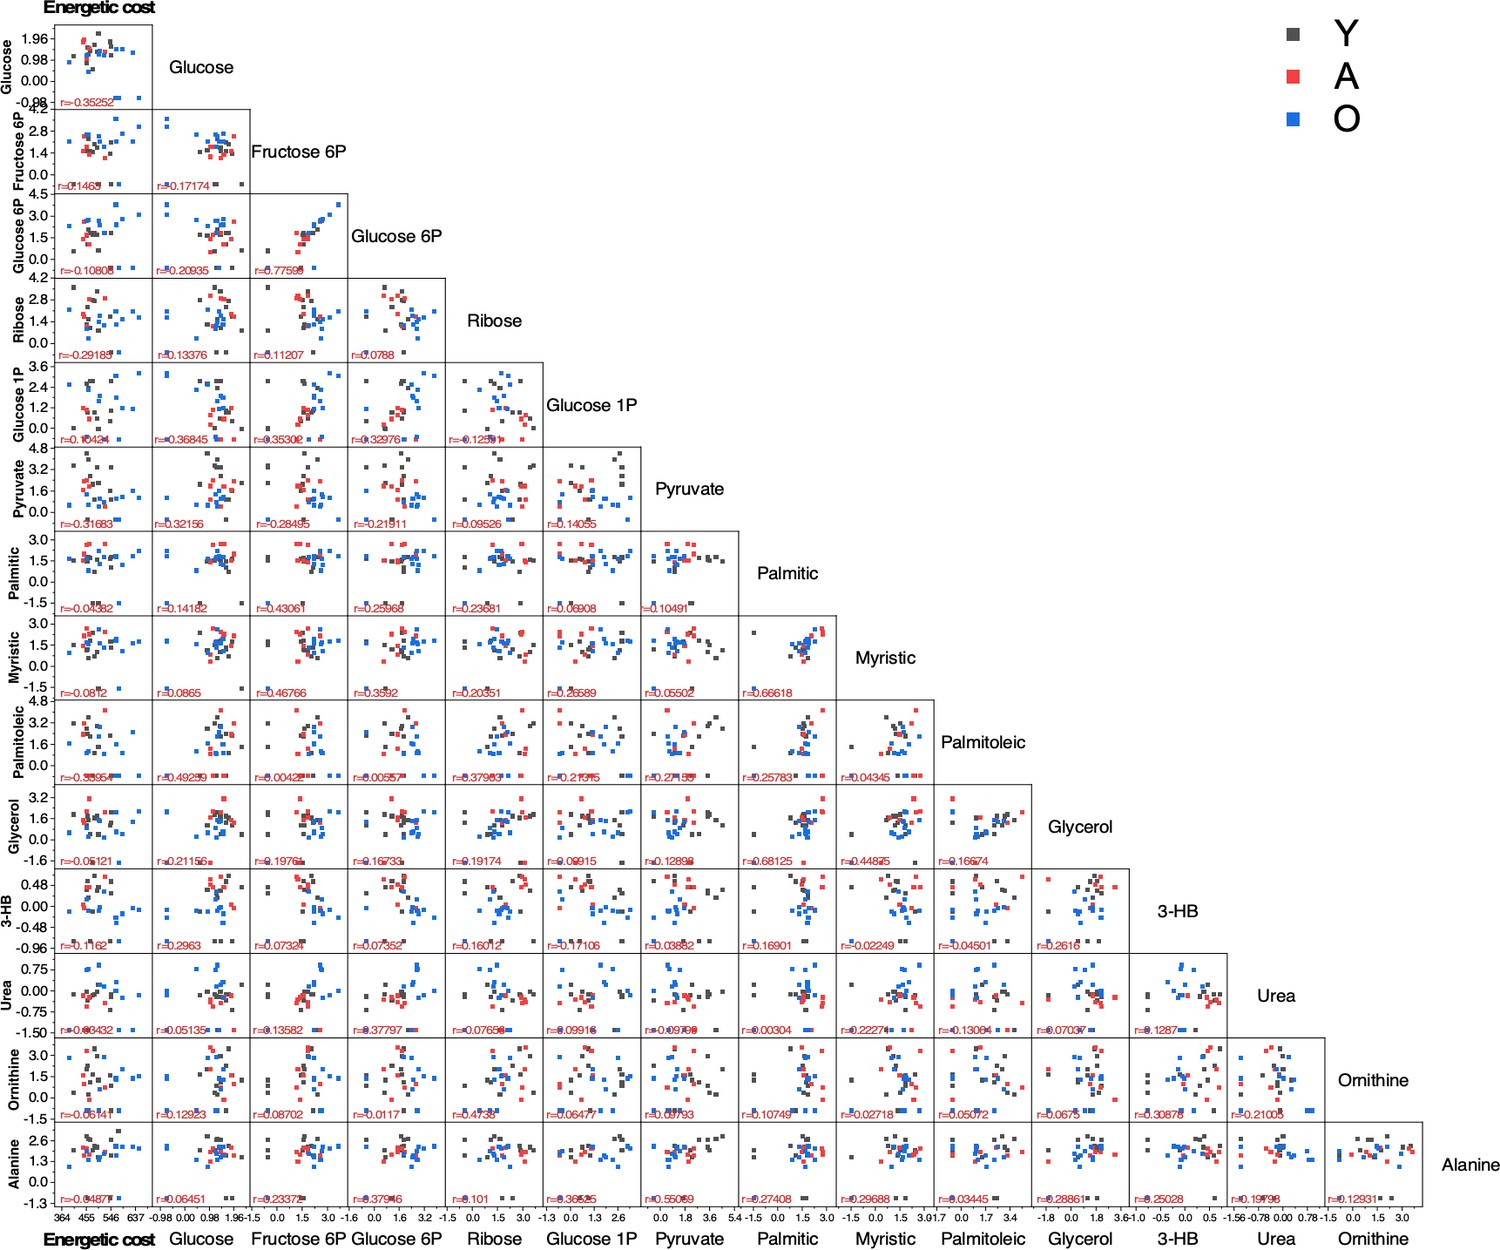
Scatter plot matrix of 14 metabolites vs. energetic cost (1st column) and of each metabolite with respect to each one of the other metabolites.
The lower triangle scatter plot matrix is shown. The Pearson correlation coefficient, r, is displayed at the bottom of each plot. Displayed in the first column of the matrix is the data showing the scatter plot and r value for each metabolite vs. energetic cost. The legend indicates with different colors the age of mice (black, Y; red, A; blue, O) from which the metabolites were determined in each organ. The liver is depicted here.
Author response image 1
Author response image 2

Tables
Key resources table
| Reagent type (species) or resource | Designation | Source or reference | Identifiers | Additional information |
|---|---|---|---|---|
| Strain, strain background (M. musculus, males) | C57BL/6NCrl | Charles River Laboratories | Strain Code 701 | a.k.a. NIA Aging Mouse Colony |
| Biological sample (M. musculus) | Brain from C57BL/6NCrl | B6MAL | Metabolomics analysis, see lines 249–352 | |
| Biological sample (M. musculus) | Heart from C57BL/6NCrl | B6MAL | Metabolomics analysis, see lines 249–352 | |
| Biological sample (M. musculus) | Liver from C57BL/6NCrl | B6MAL | Metabolomics analysis, see lines 249–352 | |
| Biological sample (M. musculus) | Serum from C57BL/6NCrl | B6MAL | Metabolomics analysis, see lines 249–352 | |
| Biological sample (M. musculus) | Skeletal muscle from C57BL/6NCrl | B6MAL | Metabolomics analysis, see lines 249–352 | |
| Commercial assay or kit | Mouse insulin ELISA kit | Crystal Chem, Inc | Cat# 90080 | |
| Software, algorithm | MetaboAnalyst (versions 3.0, 4.0) | Web-based resource (McGill University, Canada) | https://www.metaboanalyst.ca/MetaboAnalyst/faces/home.xhtml | |
| Software, algorithm | OriginLab 2018 | OriginLab corporation | https://www.originlab.com | |
| Software, algorithm | Prism 7.0 | GraphPad | RRID:SCR_015807 | |
| Software, algorithm | Canvas Draw six for macOS | Canvas GFX | RRID:SCR_014288 | |
| Software, algorithm | Microsoft Excel (version 16.19) | Microsoft Corp. | https://www.microsoft.com/en-gb/; RRID:SCR_016137 | |
| Other | TSE MotoRater system | TSE Systems | ||
| Other | 7T preclinical MRI scanner | Bruker Biospec 70/30 | ||
| Other | Oxymax Open Circuit Indirect Calorimeters | Columbus Instruments | http://www.colinst.com/docs/OxymaxBrochure.pdf | |
| Other | Modular Metabolic Treadmill | Columbus Instruments | ||
| Other | Minispec Whole Body Composition Analyzer LF90 | Bruker Optics | https://www.bruker.com/products/mr/td-nmr/minispec-lf-series.html | |
| Other | Skyscan 1076 micro-CT scanner | Bruker |
Author response table 1
| Age group | |||||||
|---|---|---|---|---|---|---|---|
| Gait group | [0,5] | [5,10] | [10,15] | [15,20] | [20,25] | [25,30] | [30,35] |
| [0.05, 0.15] | 0 | 0 | 1 | 1 | 1 | 7 | 5 |
| [0.15, 0.25] | 3 | 4 | 4 | 13 | 6 | 4 | 6 |
| [0.25, 0.35] | 13 | 3 | 0 | 1 | 0 | 0 | 0 |
Additional files
Download links
A two-part list of links to download the article, or parts of the article, in various formats.
Downloads (link to download the article as PDF)
Open citations (links to open the citations from this article in various online reference manager services)
Cite this article (links to download the citations from this article in formats compatible with various reference manager tools)
A cross-sectional study of functional and metabolic changes during aging through the lifespan in male mice
eLife 10:e62952.
https://doi.org/10.7554/eLife.62952


