Conditional protein tagging methods reveal highly specific subcellular distribution of ion channels in motion-sensing neurons
- Max Planck Institute of Neurobiology, Germany
- Graduate School of Systemic Neurosciences, LMU Munich, Germany
Figures
Figure 1
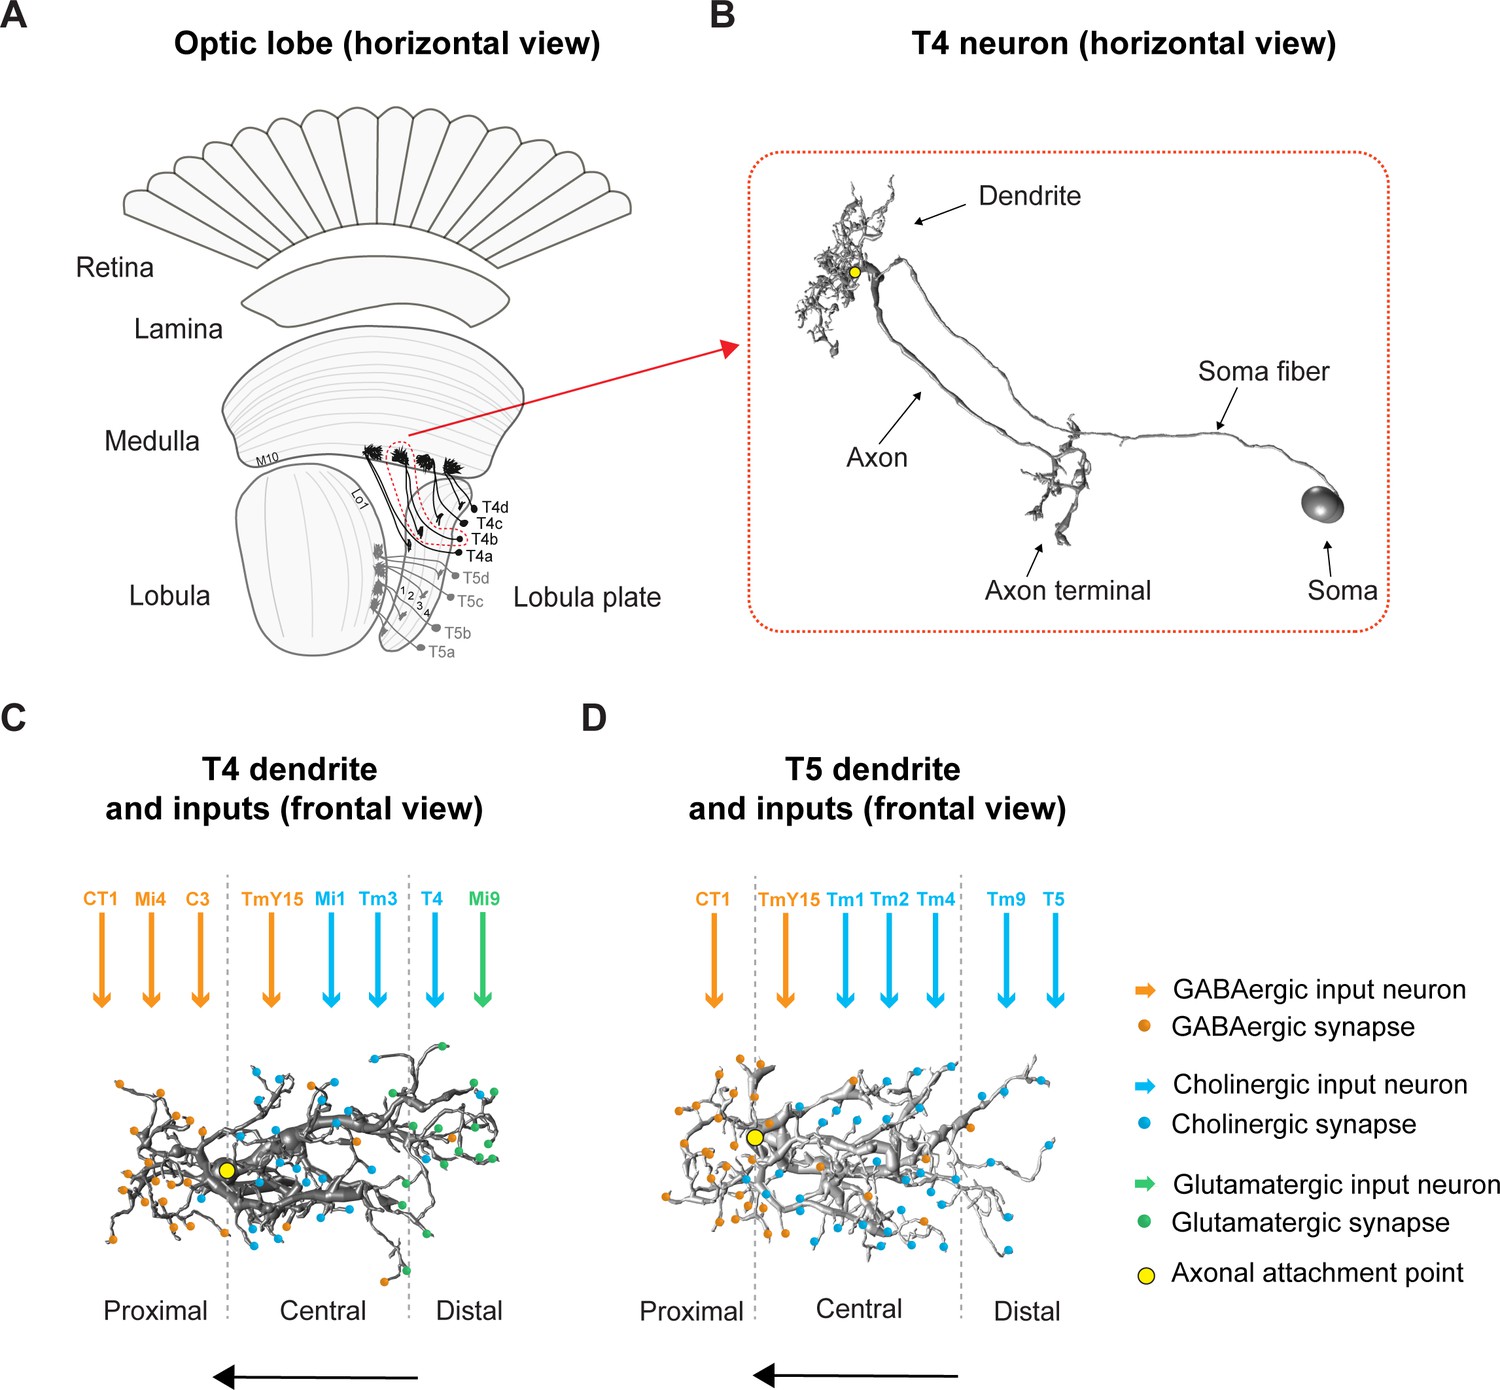
Overview of the fly optic lobe and anatomy of T4/T5 neurons with their presynaptic partners and distribution of input synapses.
(A) Horizontal view of optic lobe with retina, lamina, medulla, lobula, and lobula plate. T4 dendrites (darker gray) reside in layer 10 of the medulla, T5 dendrites (lighter gray) in layer 1 of the lobula. T4/T5 axon terminals of all subtypes (a, b, c, d) project to the lobula plate in four layers. (B) Close-up, horizontal view of EM-reconstructed single T4 neuron with dendrite, axon, axon terminal, soma fiber and soma (image extracted from Seven medulla column connectome dataset, https://emdata.janelia.org/#/repo/medulla7column, #3b548, Janelia Research Campus). (C) Scheme of individual T4 dendrite and distribution of input synapses (frontal view). The dendrite depicted here is oriented pointing to the right side against its preferred direction from right to left (indicated by arrow). Input on proximal base of T4 dendrite: GABAergic CT1, Mi4 and C3. In the central area: GABAergic TmY15 and cholinergic Mi1 and Tm3. On the distal tips T4 receive input from cholinergic T4 from the same subtype and glutamatergic Mi9. Yellow circle labels first branching point of the dendritic arbor. Reproduced from Figure 4, Shinomiya et al., 2019, eLife, published under the Creative Commons Attribution 4.0 International Public License (CC BY 4.0; https://creativecommons.org/licenses/by/4.0/). (D) Scheme of individual T5 dendrite and distribution of input synapses (frontal view). The dendrite depicted here is oriented pointing to the right side against its preferred direction from right to left (indicated by arrow). The T5 dendrite receives GABAergic input from CT1 on the proximal base and from TmY15 in the central area. Cholinergic synapses are formed with Tm1, Tm2, and Tm4 in the central area and with Tm9 and T5 from the same subtype on the distal dendritic tips. Yellow circle labels first branching point of the dendritic arbor. Reproduced from Figure 4, Shinomiya et al., 2019, eLife, published under the Creative Commons Attribution 4.0 International Public License (CC BY 4.0; https://creativecommons.org/licenses/by/4.0/).
Figure 2 with 1 supplement
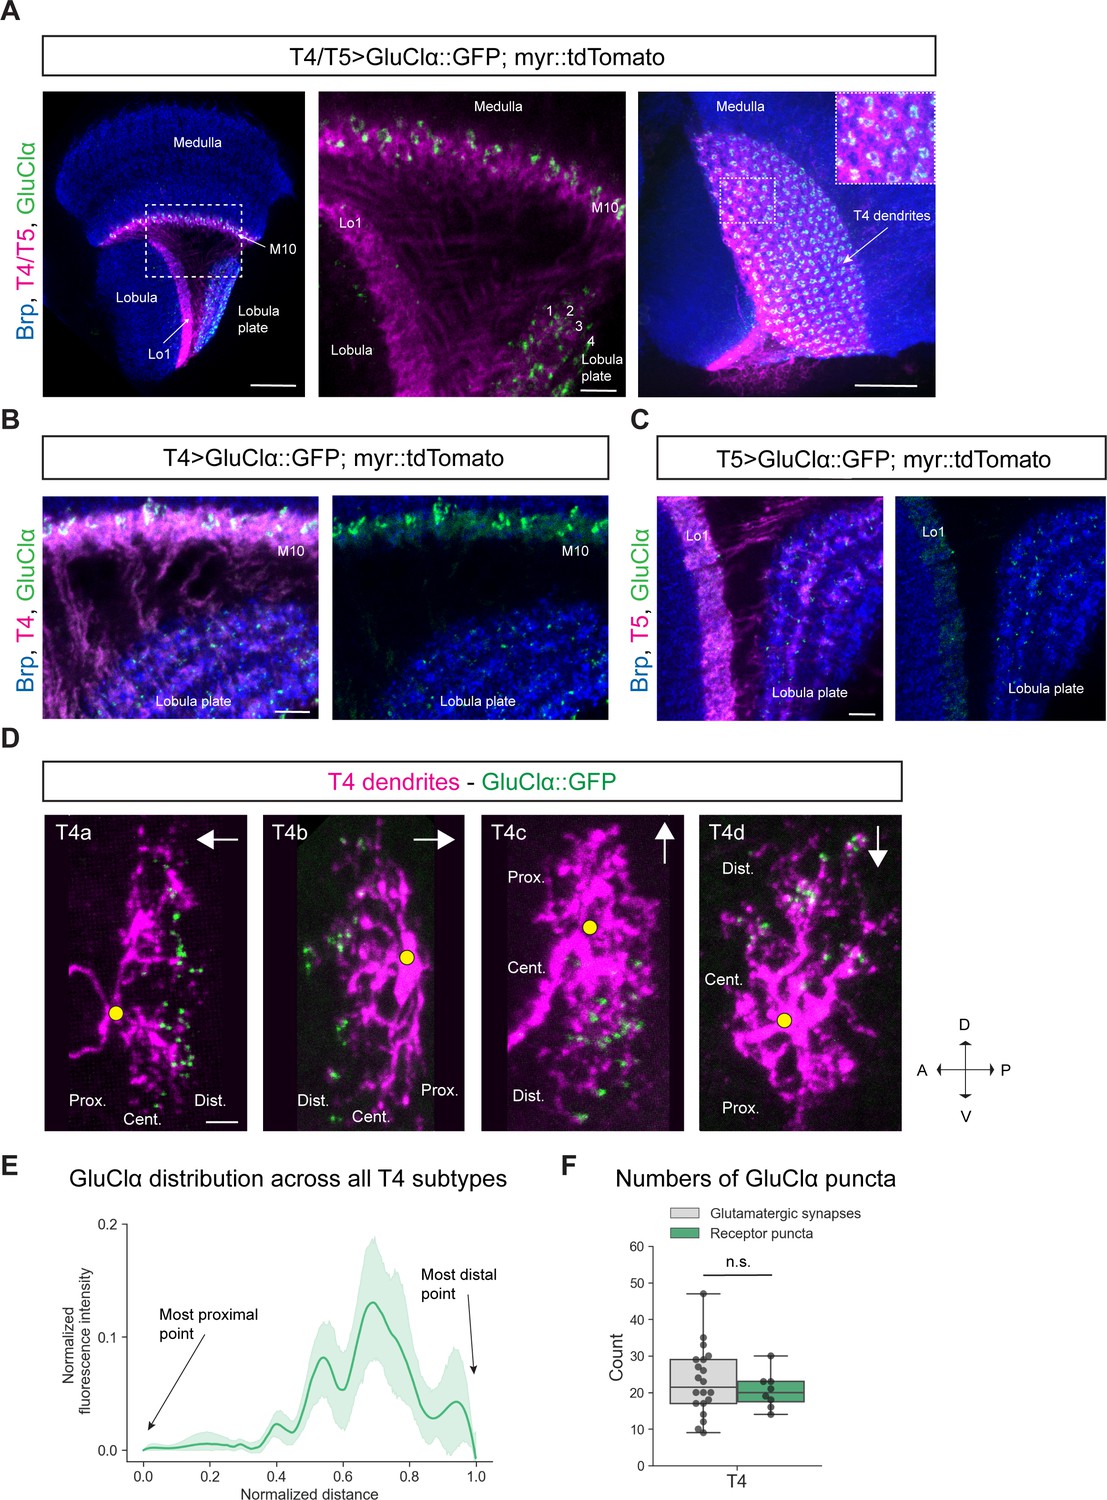
Subcellular localization of the inhibitory glutamate receptor GluClα in T4/T5 neurons.
(A) Optic lobe with T4/T5 neurons labeled with myr::tdTomato and GluClα::GFP. Left panel: horizontal view on the optic lobe overview (scale bar: 20 μm). Central panel: close-up of medulla layer M10, lobula layer Lo1 and lobula plate layers 1–4 (scale bar: 5 μm). Right panel: Frontal view on medulla layer M10 with T4 dendrites (scale bar: 20 μm); inset: close-up of columnar GluClα::GFP structure in layer 10 of the medulla. (B) Close-up of T4 dendrites in layer 10 of the medulla and axon terminals in lobula plate labeled with myr::tdTomato and GluClα::GFP (scale bar: 5 μm). (C) Close-up of T5 dendrites in layer 1 of the lobula and axon terminals in lobula plate labeled with myr::tdTomato and GluClα::GFP (scale bar: 5 μm). (D) Individual T4 dendrites labeled with tdTomtato and GluClα::GFP; subtypes a-d pointing in their natural orientation in visual space coordinates (A = anterior, p=posterior, D = dorsal, V = ventral). White arrows indicate preferred directions for every subtype and the dendrites’ proximal (Prox.), central (Cent.) and distal (Dist.) areas are labeled (scale bar: 2 μm). Yellow circle labels first branching point of the dendrite. (E) Quantification of GluClα distribution over the whole dendritic length (normalized distance) averaged across several T4 dendrites from all subtypes (n = 8). All dendrites were aligned pointing to the right with the most proximal point at 0.0 and the most distal point at 1.0. (F) Quantification of GluClα puncta averaged across several T4 dendrites from all subtypes (mean ± SD = 20.5, 4.98 [n = 8]) (same cells used in E) compared to number of glutamatergic input synapses from Mi9 (mean ± SD = 23.0, 9.34 [n = 20]) (EM numbers: personal communication, K. Shinomiya, May 2020). n.s., not significant p>0.05 (p=0.37, t-test).
-
Figure 2—source data 1
Table with numbers of GluClα puncta quantified for T4 dendrites.
- https://cdn.elifesciences.org/articles/62953/elife-62953-fig2-data1-v3.xlsx
Figure 2—figure supplement 1

Pan-neuronal GluClα levels and distribution in the optic lobe are comparable for MiMIC GFSTF, FlpTag and UAS-line.
Optic lobe with MiMIC GFSTF GluClα (A), pan-neuronal expression of UAS-GluClα::GFP (B) and pan-neuronal expression of FlpTag GluClα (C) (scale bar: 20 μm). (D) Quantification of mean fluorescence intensity of GluClα::GFP in manually drawn ROIs of the medulla for MiMIC GFSTF (n = 8), pan-neuronal UAS-GluClα::GFP (n = 8), and pan-neuronal FlpTag GluClα (n = 8) (p=0.73, ANOVA). (E) Optic lobe with T1 labeled with UAS-myr::tdTomato and UAS-GluClα::GFP.
Figure 3 with 1 supplement
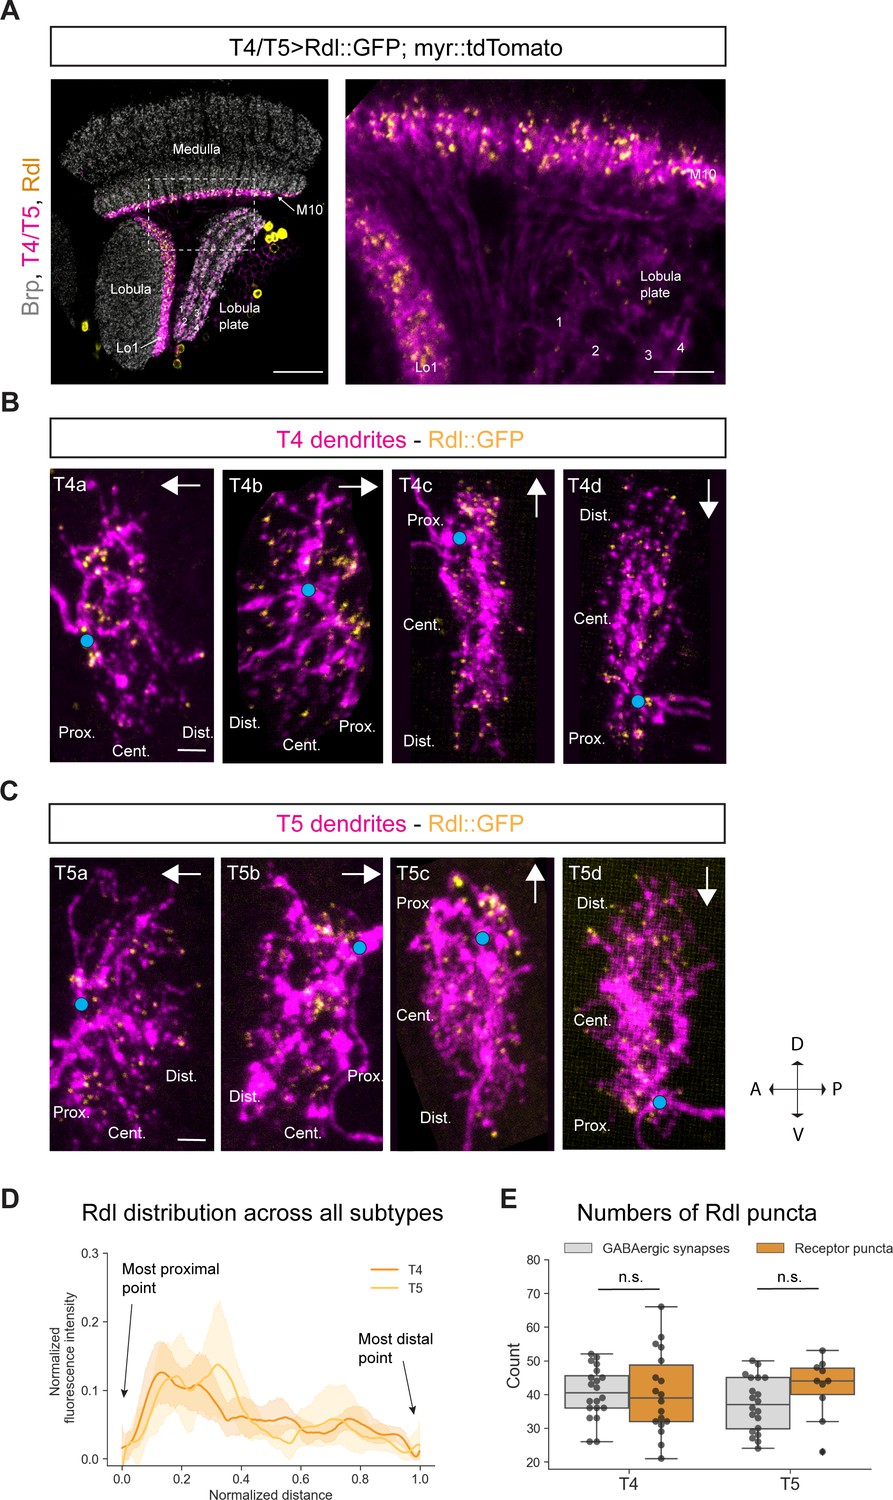
Subcellular localization of the GABA receptor Rdl in T4/T5 neurons.
(A) Optic lobe with T4/T5 neurons labeled with myr::tdTomato and Rdl::GFP. Left panel: horizontal view on the optic lobe overview (scale bar: 20 μm). Right panel: close-up of medulla layer M10, lobula layer Lo1 and lobula plate layers 1–4 (scale bar: 5 μm). (B) Individual T4 dendrites labeled with tdTomtato and Rdl::GFP; subtypes a-d pointing in their natural orientation in visual space coordinates (A = anterior, p=posterior, D = dorsal, V = ventral). White arrows indicate preferred directions for every subtype and the dendrites’ proximal (Prox.), central (Cent.) and distal (Dist.) areas are labeled (scale bar: 2 μm). Blue circle labels first branching point of the dendrite. (C) Individual T5 dendrites labeled with tdTomtato and Rdl::GFP; subtypes a-d pointing in their natural orientation in visual space coordinates (A = anterior, p=posterior, D = dorsal, V = ventral). White arrows indicate preferred directions for every subtype and the dendrites’ proximal (Prox.), central (Cent.) and distal (Dist.) areas are labeled (scale bar: 2 μm). Blue circle labels first branching point of the dendrite. (D) Quantification of Rdl distribution over the whole dendritic length (normalized distance) averaged across several T4 (n = 18) and T5 dendrites (n = 10) from all subtypes. All dendrites were aligned pointing to the right with the most proximal point at 0.0 and the most distal point at 1.0. (E) Quantification of Rdl puncta averaged across several T4 (mean ± SD = 40.4, 12.17 [n = 18]) and T5 dendrites (mean ± SD = 42.2, 8.88 [n = 10]) (same cells used in D) from all subtypes compared to number of GABAergic input synapses from T4 (mean ± SD = 40.5, 7.67 [n = 20]) and T5 (mean ± SD = 37.0, 8.05 [n = 20]) (EM numbers: personal communication, K. Shinomiya, May 2020). n.s., not significant p>0.05 (p=0.99 and p=0.13 respectively, t-test).
-
Figure 3—source data 1
Table with numbers of Rdl puncta quantified for T4/T5 dendrites.
- https://cdn.elifesciences.org/articles/62953/elife-62953-fig3-data1-v3.xlsx
Figure 3—figure supplement 1
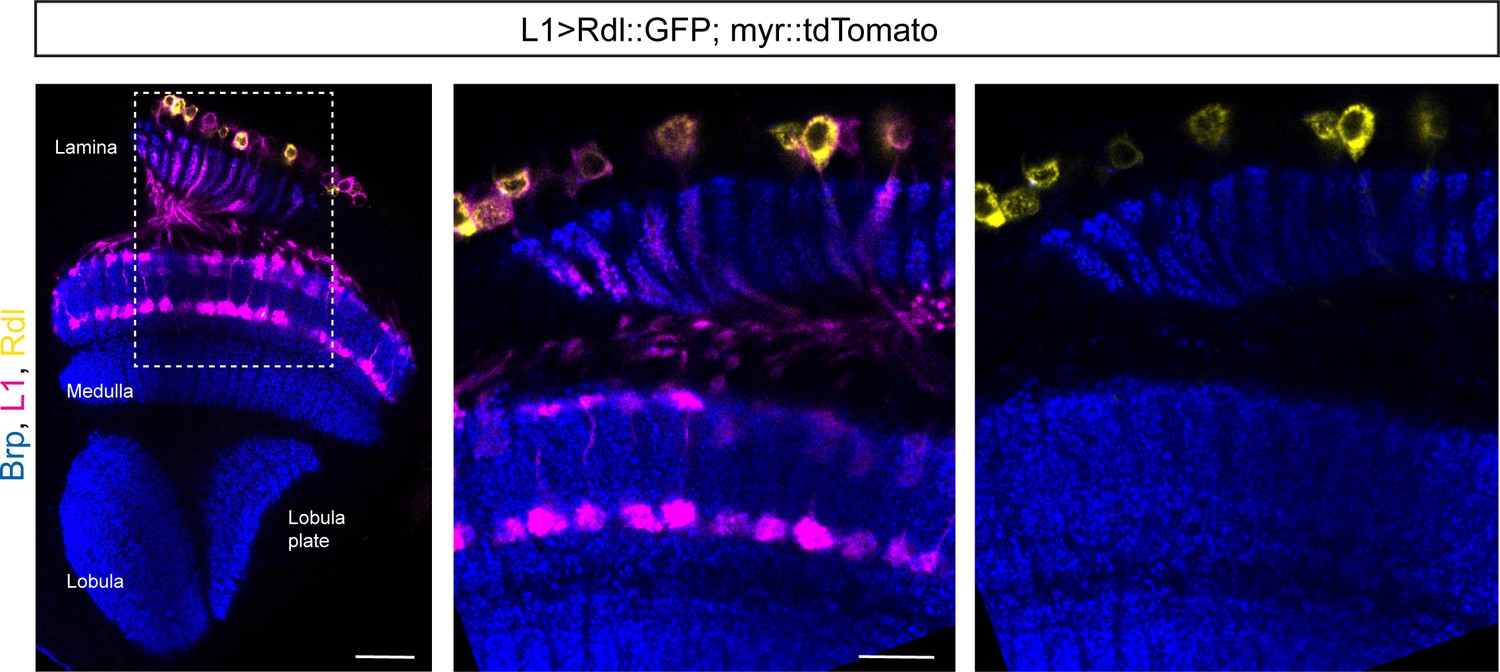
Rdl is not detectable in the lamina neuron L1.
Optic lobe with L1-splitGal4 combined with UAS-myr::tdTomato and UAS-Rdl::GFP. Overview in left panel, close-up of lamina and part of the medulla in the middle and right panel (scale bar: 20 μm in overview, 10 μm in close-up).
Figure 4 with 1 supplement
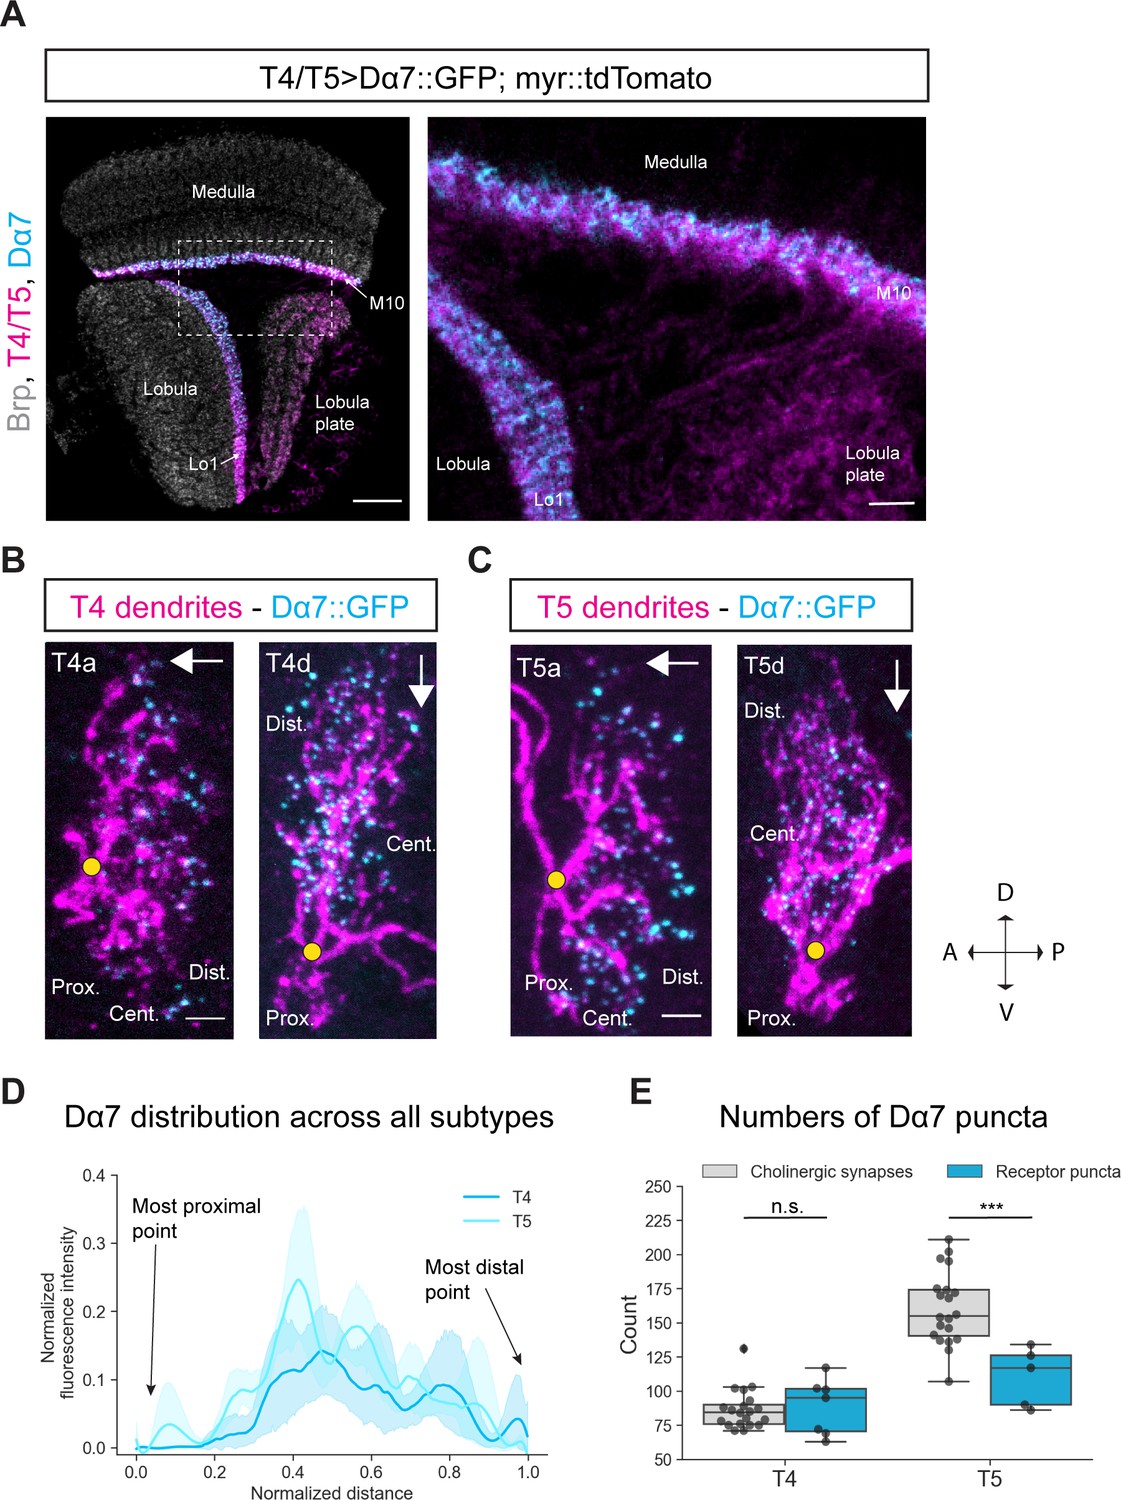
Subcellular localization of the ACh receptor subunit Dα7 in T4/T5 neurons.
(A) Optic lobe with T4/T5 neurons labeled with myr::tdTomato and Dα7::GFP. Left panel: horizontal view on the optic lobe overview (scale bar: 20 μm). Right panel: close-up of medulla layer M10, lobula layer Lo1 and lobula plate layers 1–4 (scale bar: 5 μm). (B) Individual T4 dendrites labeled with tdTomtato and Dα7::GFP; subtypes a and d pointing in their natural orientation in visual space coordinates (A = anterior, p=posterior, D = dorsal, V = ventral). White arrows indicate preferred directions for every subtype and the dendrites’ proximal (Prox.), central (Cent.) and distal (Dist.) areas are labeled (scale bar: 2 μm). Yellow circle labels first branching point of the dendrite. (C) Individual T5 dendrites labeled with tdTomtato and Dα7::GFP; subtypes a and d pointing in their natural orientation in visual space coordinates (A = anterior, p=posterior, D = dorsal, V = ventral). White arrows indicate preferred directions for every subtype and the dendrites’ proximal (Prox.), central (Cent.) and distal (Dist.) areas are labeled (scale bar: 2 μm). Yellow circle labels first branching point of the dendrite. (D) Quantification of Dα7 distribution over the whole dendritic length (normalized distance) averaged across several T4 (n = 6) and T5 dendrites (n = 5) from all subtypes. All dendrites were aligned pointing to the right with the most proximal point at 0.0 and the most distal point at 1.0. (E) Quantification of Dα7 puncta averaged across several T4 (mean ± SD = 92.67, 18.67 [n = 6]) and T5 dendrites (mean ± SD = 110.6, 21.53 [n = 5]) (same cells like in D) from all subtypes compared to number of cholinergic input synapses for T4 (mean ± SD = 86.45, 14.37 [n = 20]) and T5 (mean ± SD = 160.50, 26.93 [n = 20]) (EM numbers: personal communication, K. Shinomiya, May 2020). n.s., not significant, p>0.05; ***p<0.001 (p=0.46 and p=2.1e-4 respectively, t-test).
-
Figure 4—source data 1
Table with numbers of Dα7 puncta quantified for T4/T5 dendrites.
- https://cdn.elifesciences.org/articles/62953/elife-62953-fig4-data1-v3.xlsx
Figure 4—figure supplement 1
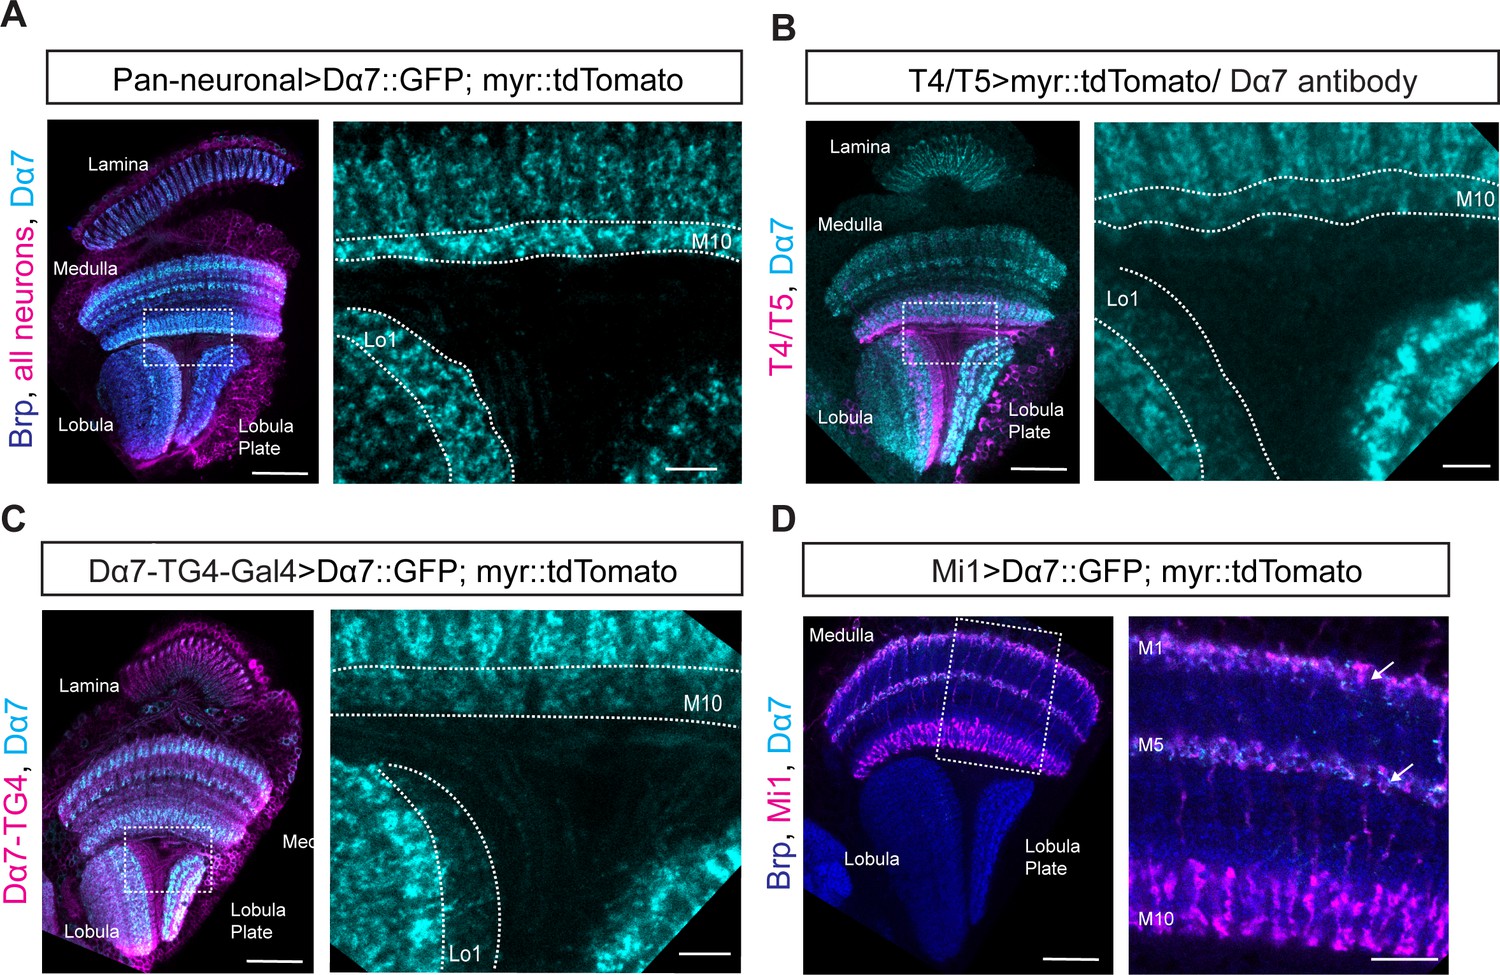
Pan-neuronal Dα7 levels and distribution in the optic lobe as seen with UAS-Dα7::GFP line, Dα7 antibody staining and Dα7-Trojan-Gal4 line.
(A) Optic lobe with pan-neuronal UAS-myr::tdTomato and UAS-Dα7::GFP expression. Overview in left panel, close-up of M10 of the medulla and Lo1 of the lobula in right panel (scale bar: 20 μm in overview, 10 μm in close-up). (B) Optic lobe with UAS-myr::tdTomato labeled T4/T5 and antibody staining against Dα7. Overview in left panel, close-up of M10 of the medulla and Lo1 of the lobula in the right panel (scale bar: 20 μm in overview, 10 μm in close-up). (C) Optic lobe with Dα7-Trojan-Gal4 (TG4) driven UAS-myr::tdTomato and UAS-Dα7::GFP expression. Overview in left panel, close-up of M10 of the medulla and Lo1 of the lobula in the right panel (scale bar: 20 μm in overview, 10 μm in close-up). (D) Optic lobe with Mi1-Gal4 combined with UAS-myr::tdTomato and UAS-Dα7::GFP. Overview in left panel, close-up of M10 of the medulla and Lo1 of the lobula in right panel (scale bar: 20 μm in overview, 10 μm in close-up). In the right panel, Dα7::GFP signal in layer M1 and M5 of the medulla is marked with arrows.
Figure 5
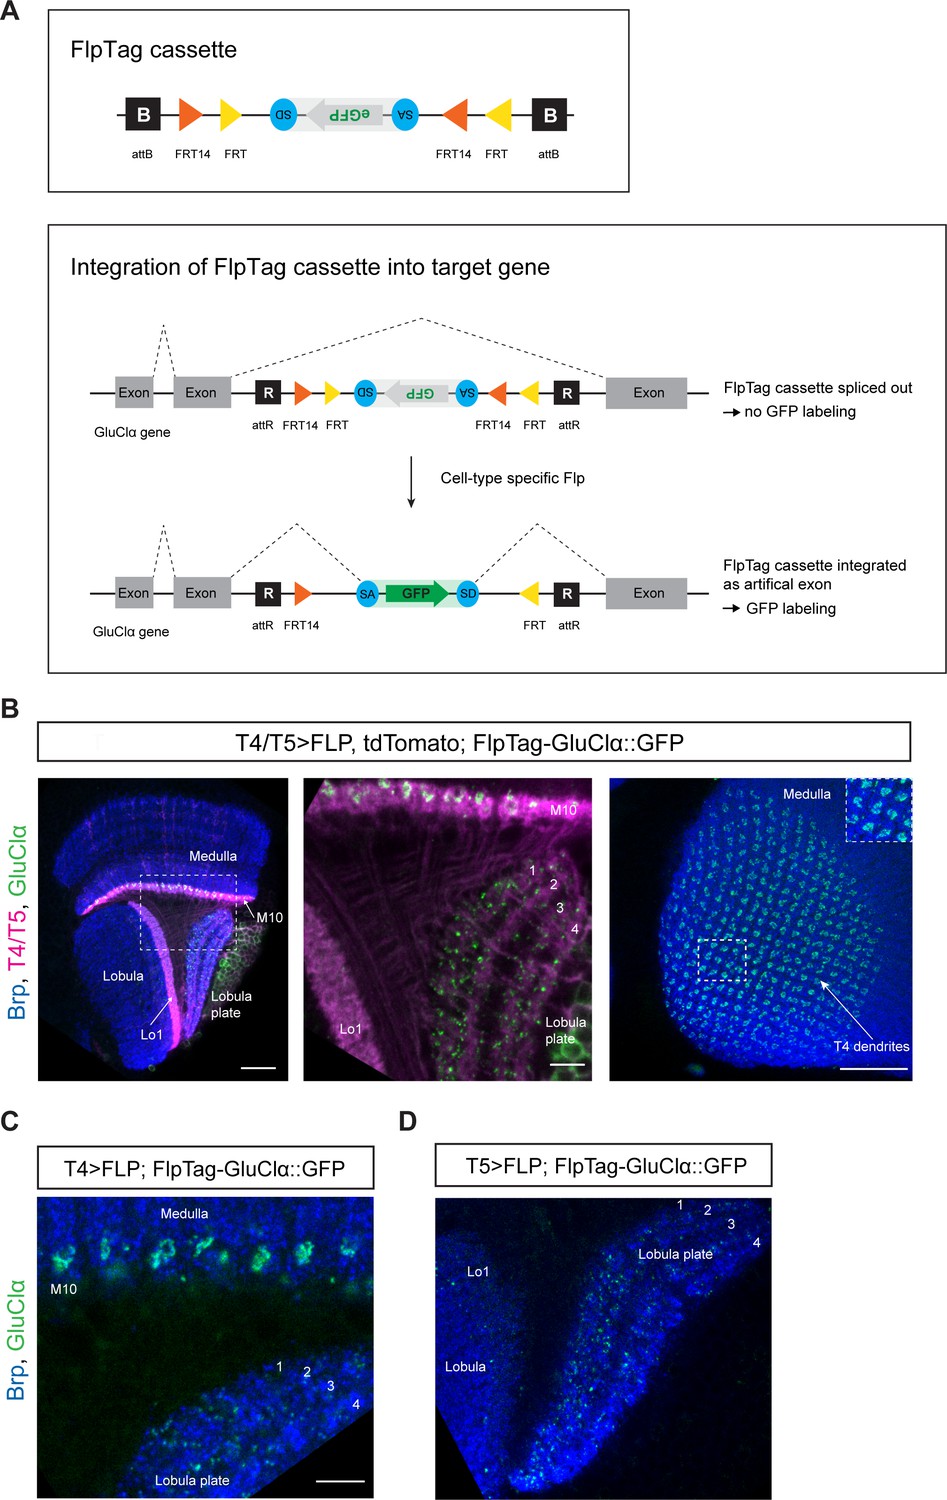
FlpTag, a new tool for cell-type-specific, endogenous labeling as shown with GluClα.
(A) Scheme of FlpTag cassette (first panel) and integration of FlpTag cassette into target gene (second panel). The FlpTag cassette consists of attB-sites, specific FRT sites which form a FLEx-switch, a splice acceptor, GFP and a splice donor. After ΦC31-dependent integration of the FlpTag cassette into a coding intron of the GluClα target gene, two lines with opposite orientations of the cassette can be obtained. In the initial line with the cassette and GFP in opposite orientation with respect to the gene (shown here), the cassette is spliced out together with the intron and no GFP-labeling occurs. After cell-type-specific Flp expression, the FlpTag cassette is flipped, stably integrated as an artificial exon and GluClα is labeled with GFP. (B) Optic lobe with T4/T5 neurons labeled with myr::tdTomato and FlpTag-GluClα::GFP. Left panel: horizontal view on the optic lobe overview (scale bar: 20 μm). Central panel: close-up of medulla layer M10, lobula layer Lo1 and Lobula plate layers 1–4 (scale bar: 5 μm). Right panel: Frontal view on medulla layer M10 with T4 dendrites (scale bar: 20 μm); inset: close-up of columnar GluClα::GFP structure in layer 10 of the medulla. (C) Close-up of FlpTag-GluClα::GFP driven with a T4-Gal4-line; shown are layer 10 of the medulla where T4 dendrites reside and lobula plate layers 1–4 where T4 project their axon terminals to (scale bar: 5 μm). (D) Close-up of FlpTag-GluClα::GFP driven with a T5-Gal4-line; shown are layer 10 of the medulla where T4 dendrites reside and lobula plate layers 1–4 where T4 project their axon terminals to (scale bar: 5 μm).
Figure 6

FlpTag lines for Gaba-b-r1, para and Ih.
Optic lobes with pan-neuronal expression of FlpTag Gaba-b-r1 (A), FlpTag para (C), and FlpTag Ih (E). (B) Expression of FlpTag Gaba-b-r1 in T4/T5 neurons labeled with myr::tdTomato. Left panel: horizontal view on the optic lobe overview (scale bar: 20 μm). Right panel: close-up of medulla layer M10, lobula layer Lo1 and Lobula plate layers 1–4 (scale bar: 10 μm). (D) Expression of FlpTag para in T4/T5 neurons labeled with myr::tdTomato. Left panel: horizontal view on the optic lobe overview (scale bar: 20 μm). Right panel: close-up of medulla layer M10, lobula layer Lo1 and Lobula plate layers 1–4 (scale bar: 10 μm). (F) Expression of FlpTag Ih in T4/T5 neurons. Horizontal view on the optic lobe with medulla layer M10, lobula layer Lo1 and Lobula plate layers 1–4 (scale bar: 12 μm). Left panel: Background staining anti-brp in blue and. Right panel: Ih::GFP signal only.
Figure 7
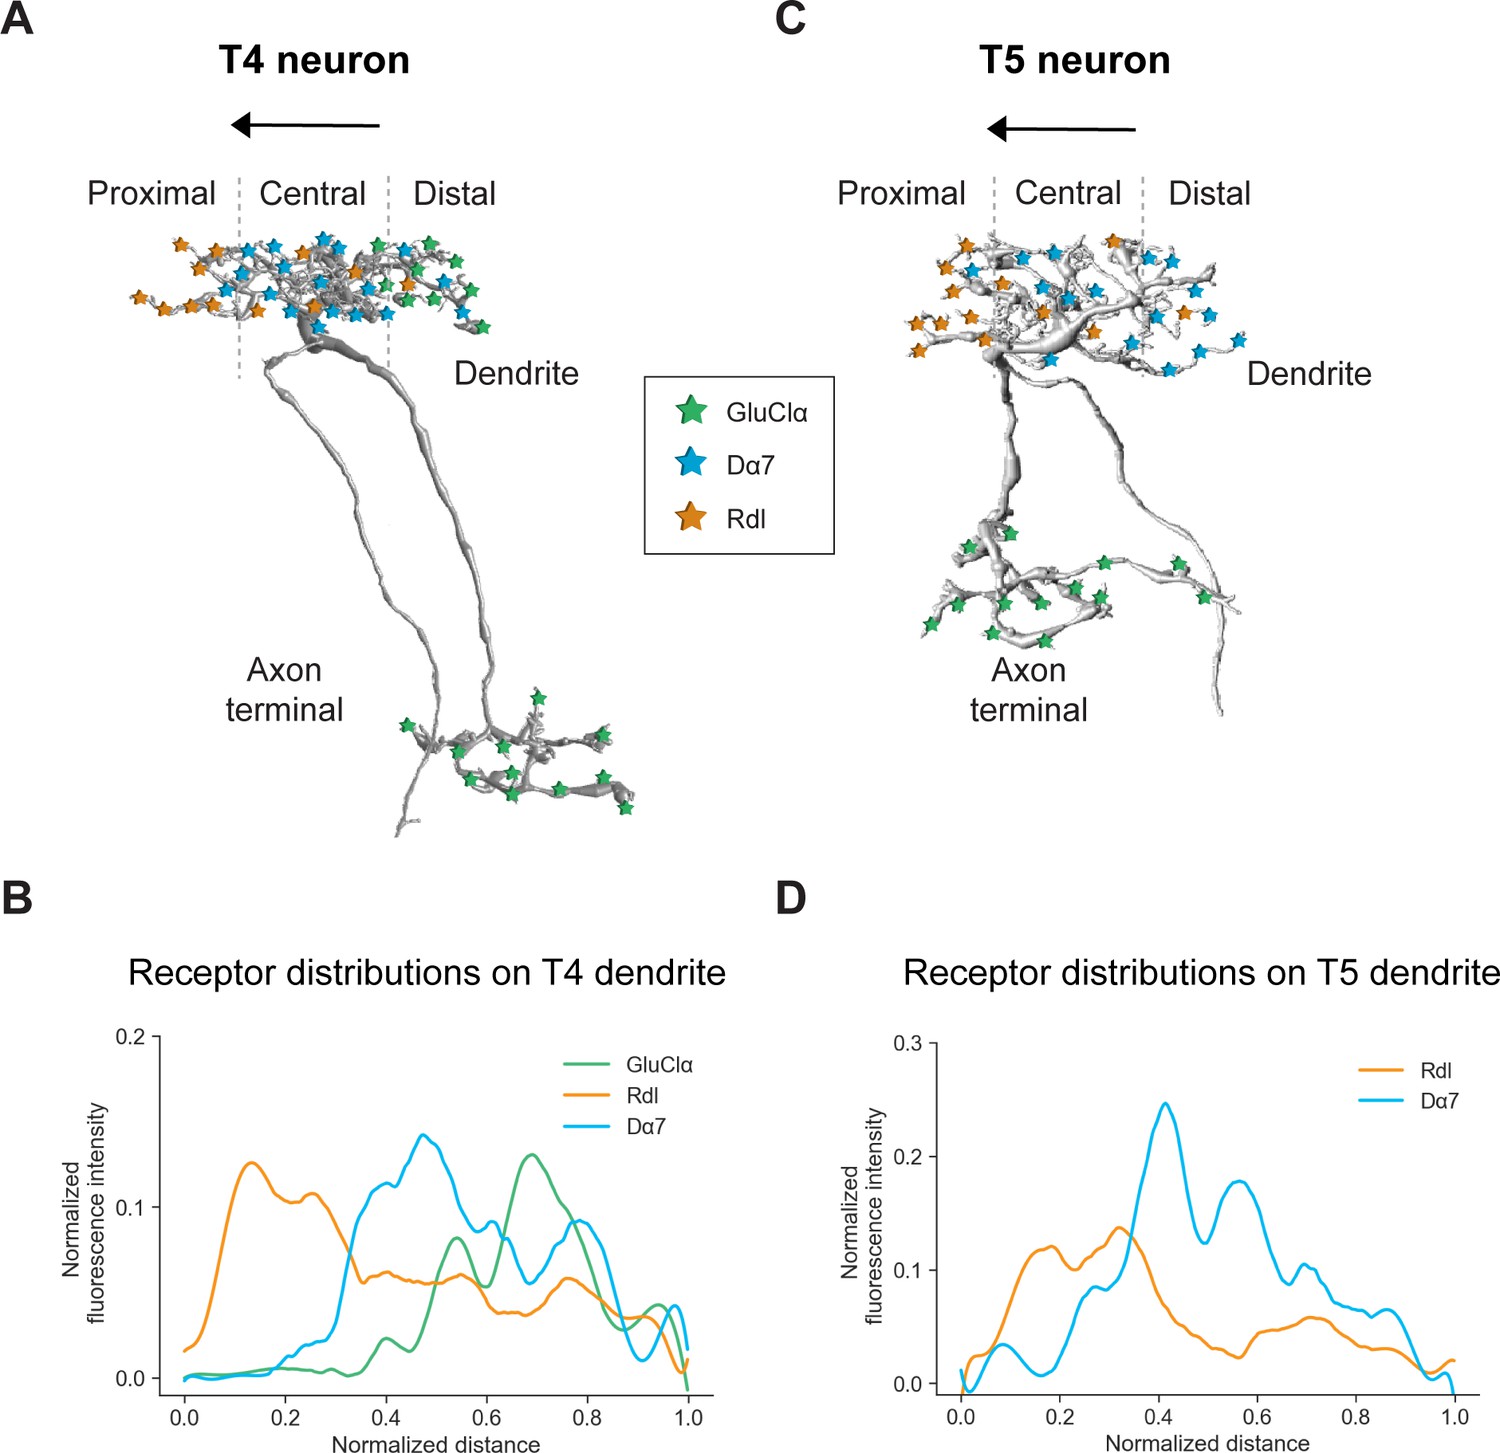
Summary of the receptor distributions of GluClα, Rdl and Dα7 in T4 and T5 neurons.
(A) Scheme of EM-reconstructed T4 neuron with distribution of receptors on dendrite and axon terminal (image extracted from Seven medulla column connectome dataset, https://emdata.janelia.org/#/repo/medulla7column, #3b548, Janelia Research Campus). (B) Quantification of GluClα (green), Rdl (orange) and Dα7 (blue) distribution over the whole dendritic length (distance) averaged across several T4 from all subtypes (combined data from Figures 4D and 5D). All dendrites were aligned pointing to the right with the most proximal point at 0.0 and the most distal point at 1.0. (C) Scheme of EM-reconstructed T5 neuron with distribution of receptors on dendrite and axon terminal (image extracted from Seven medulla column connectome dataset, https://emdata.janelia.org/#/repo/medulla7column, #3b548, Janelia Research Campus). (D) Rdl (orange) and Dα7 (blue) distribution over the whole dendritic length (normalized distance) averaged across several T5 from all subtypes (combined data from Figures 3D and 4D). All dendrites were aligned pointing to the right with the most proximal point at 0.0 and the most distal point at 1.0.
Tables
Table 1
Overview of available MiMIC GFSTF and FlpTag lines for investigated genes.
| Gene | MiMIC insertion (coding intron) | MiMIC GFSTF existing | MiMIC GFSTF working | Chromosome | Phase | FlpTag working | Localization in T4/T5 neurons | |
|---|---|---|---|---|---|---|---|---|
| 1 | GluClα | MI02890, MI14426 | MI02890 | Yes | III | 2 | Yes, MI02890 | T4: dendrites + terminals; T5: terminals |
| 2 | Rdl | MI02620, MI02957 | MI02620 | No | III | 0 | No, MI02620 | From UAS line: dendrites |
| 3 | Dα7 | MI12545 | This study (MI12545) | No | X | 1 | No | From UAS line: dendrites |
| 4 | Gaba-b-r1 | MI01930, MI05755 | MI01930 | Yes | II | 0 | Yes, MI01930 | No |
| 5 | para | MI08578 | This study (MI08578) | Yes | X | 0 | Yes, MI08578 | T4/T5 axonal fibers |
| 6 | Ih | MI03196, MI12136 | This study (MI12136) | Yes | II | 2 | Yes, MI12136 | T4/T5 dendrites |
Additional files
-
Supplementary file 1
Plasmid map of the full sequence of pJFRC7-20xUAS-GluClα-GFP.
- https://cdn.elifesciences.org/articles/62953/elife-62953-supp1-v3.gbk
-
Supplementary file 2
Plasmid map of the full sequence of pJFRC7-20xUAS-Rdl-GFP.
- https://cdn.elifesciences.org/articles/62953/elife-62953-supp2-v3.gbk
-
Supplementary file 3
Plasmid map of the full sequence of pUC57-FlpTag-GFP-ph0.
- https://cdn.elifesciences.org/articles/62953/elife-62953-supp3-v3.gbk
-
Supplementary file 4
Plasmid map of the full sequence of pUC57-FlpTag-GFP-ph1.
- https://cdn.elifesciences.org/articles/62953/elife-62953-supp4-v3.gbk
-
Supplementary file 5
Plasmid map of the full sequence of pUC57-FlpTag-GFP-ph2.
- https://cdn.elifesciences.org/articles/62953/elife-62953-supp5-v3.gbk
-
Supplementary file 6
Plasmid map of the full sequence of pHD-FlpTag-DsRed-HDR-ph0.
- https://cdn.elifesciences.org/articles/62953/elife-62953-supp6-v3.gbk
-
Supplementary file 7
Plasmid map of the full sequence of pHD-FlpTag-DsRed-HDR--ph1.
- https://cdn.elifesciences.org/articles/62953/elife-62953-supp7-v3.gbk
-
Supplementary file 8
Plasmid map of the full sequence of pHD-FlpTag-DsRed-HDR-ph2.
- https://cdn.elifesciences.org/articles/62953/elife-62953-supp8-v3.gbk
-
Supplementary file 9
3D-image of a T4 dendrite (subtype d) (magenta) with GluClα::GFP (green).
- https://cdn.elifesciences.org/articles/62953/elife-62953-supp9-v3.avi.zip
-
Supplementary file 10
3D-image of a T4 dendrite (subtype d) (magenta) with Rdl::GFP (yellow).
- https://cdn.elifesciences.org/articles/62953/elife-62953-supp10-v3.avi.zip
-
Supplementary file 11
3D-image of a T4 dendrite (subtype d) (magenta) with Dα7::GFP (cyan).
- https://cdn.elifesciences.org/articles/62953/elife-62953-supp11-v3.avi.zip
-
Transparent reporting form
- https://cdn.elifesciences.org/articles/62953/elife-62953-transrepform-v3.docx
Download links
A two-part list of links to download the article, or parts of the article, in various formats.
Downloads (link to download the article as PDF)
Open citations (links to open the citations from this article in various online reference manager services)
Cite this article (links to download the citations from this article in formats compatible with various reference manager tools)
Conditional protein tagging methods reveal highly specific subcellular distribution of ion channels in motion-sensing neurons
eLife 9:e62953.
https://doi.org/10.7554/eLife.62953


