Metabolic biomarker profiling for identification of susceptibility to severe pneumonia and COVID-19 in the general population
- Nightingale Health Plc, Finland
- Molecular Epidemiology, Department of Biomedical Data Sciences, Leiden University Medical Center, Netherlands
- Max Planck Institute for Biology of Ageing, Germany
Figures
Figure 1 with 1 supplement
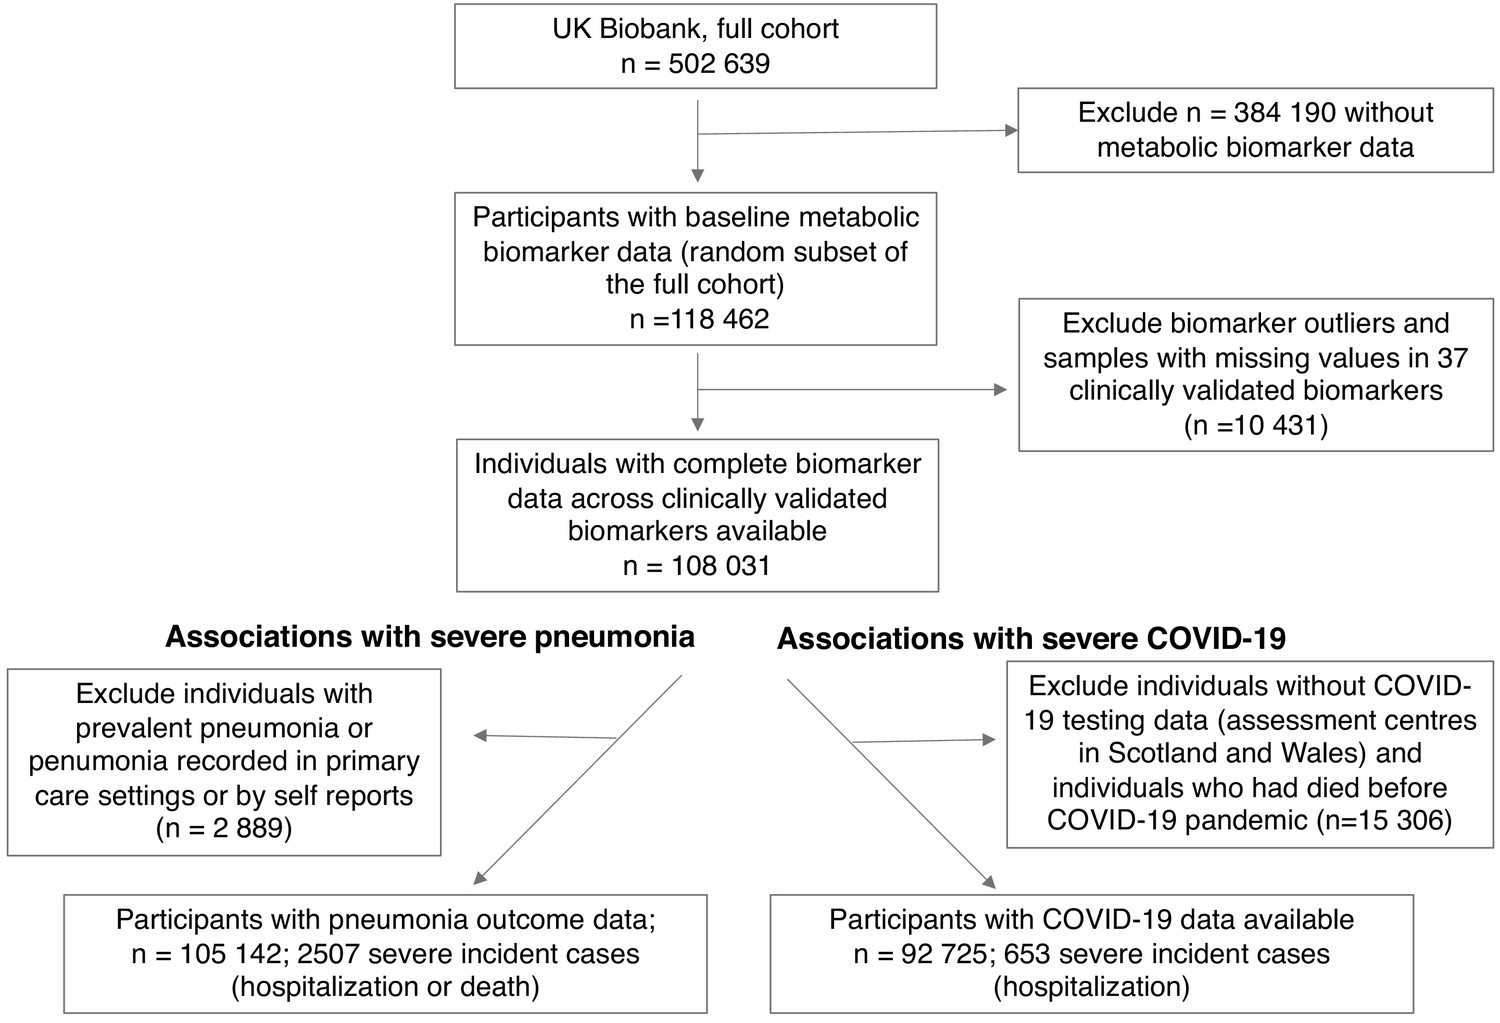
Flow diagram of study participants and case numbers.
Overview of eligible study participants for the analysis of metabolic biomarkers for the susceptibility to severe pneumonia and COVID-19 in the UK Biobank. Case and control definitions are described in Materials and methods.
Figure 1—figure supplement 1
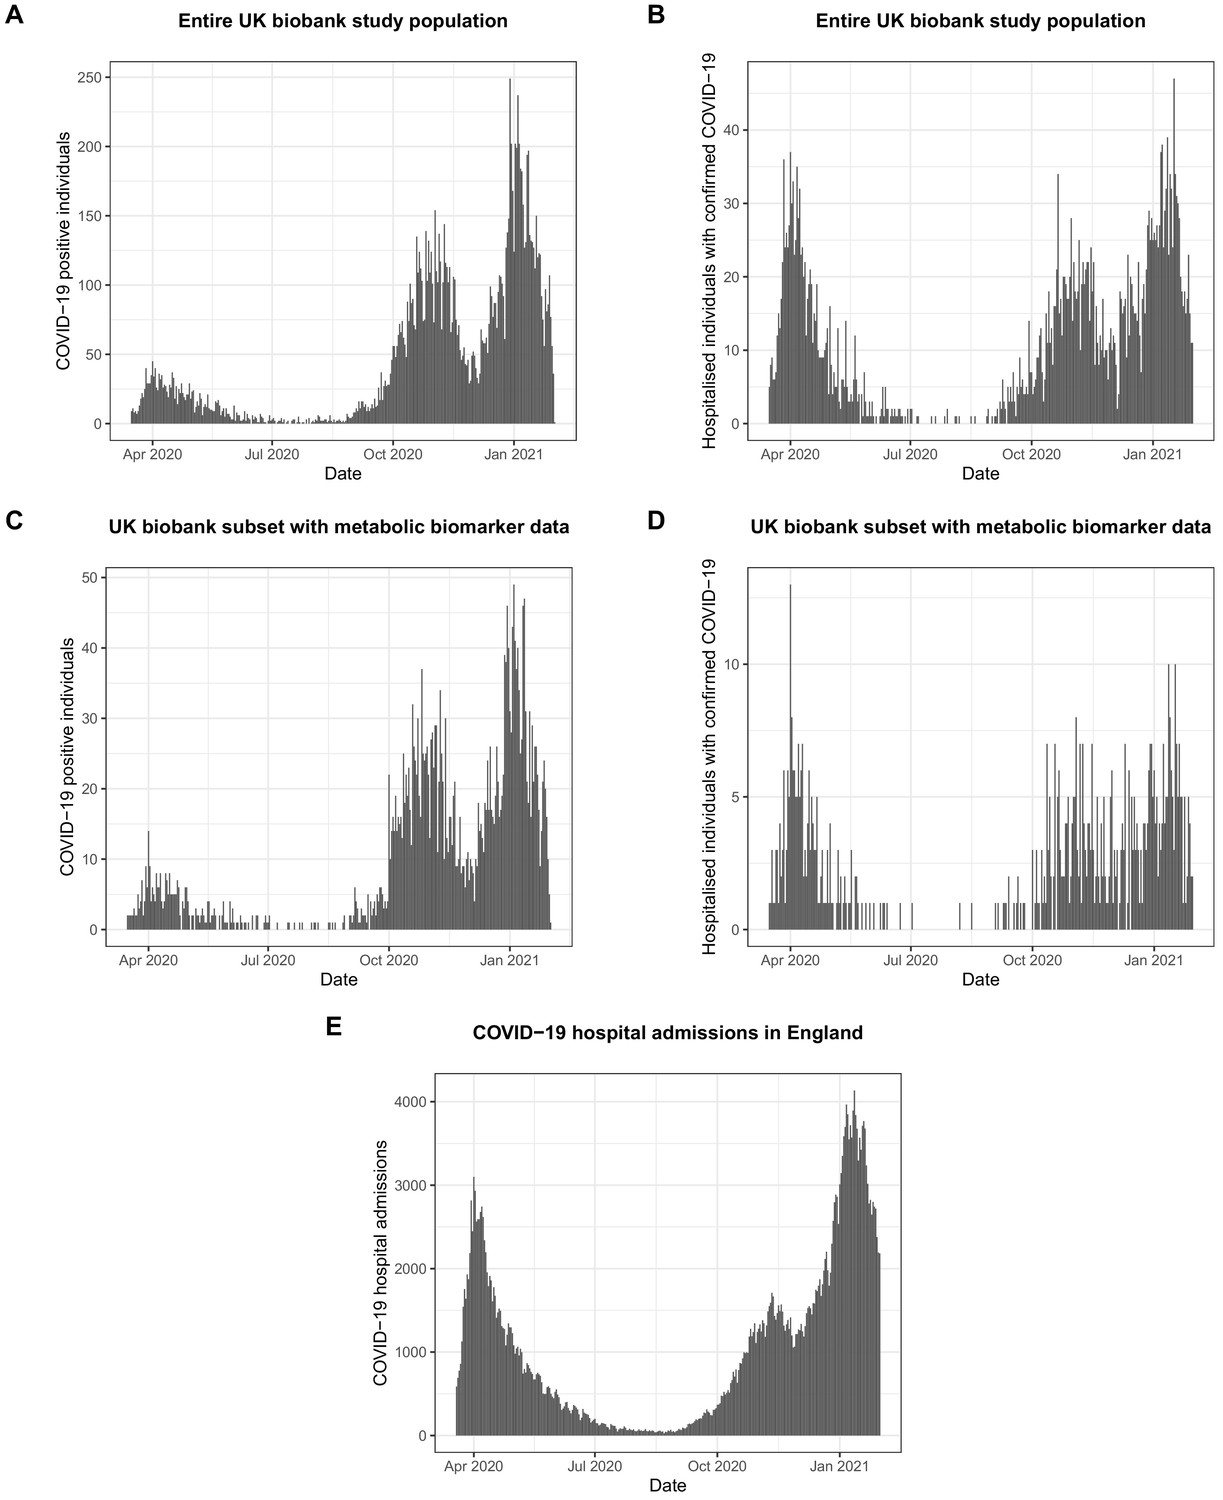
Numbers of COVID-19 positive and hospitalised individuals in the UK Biobank and the whole of England during the course of the COVID-19 pandemic.
(A) Number of individuals with PCR-confirmed COVID-19 in the UK Biobank as a function of time. (B) Number of hospitalised individuals with PCR-confirmed COVID-19 in the UK Biobank as a function of time. (C) Number of individuals with PCR-confirmed COVID-19 in the subset of the UK biobank with metabolic biomarker data available analysed in the present paper as a function of time. (D) Number of hospitalised individuals with PCR-confirmed COVID-19 in the subset of the UK Biobank with metabolic biomarker data available analysed in the present paper as a function of time. COVID-19 data were only available from assessment centres in England, but not from assessment centres in Scotland and Wales. (E) Hospitalised individuals with COVID-19 in the whole of England during the pandemic (https://coronavirus.data.gov.uk/; accessed March 17 2021). The prevalence of hospitalised individuals for COVID-19 in the present study was 703 per 100,000 individuals, whereas it was 625 in the whole of England as per 1st of February 2021.
Figure 2 with 3 supplements
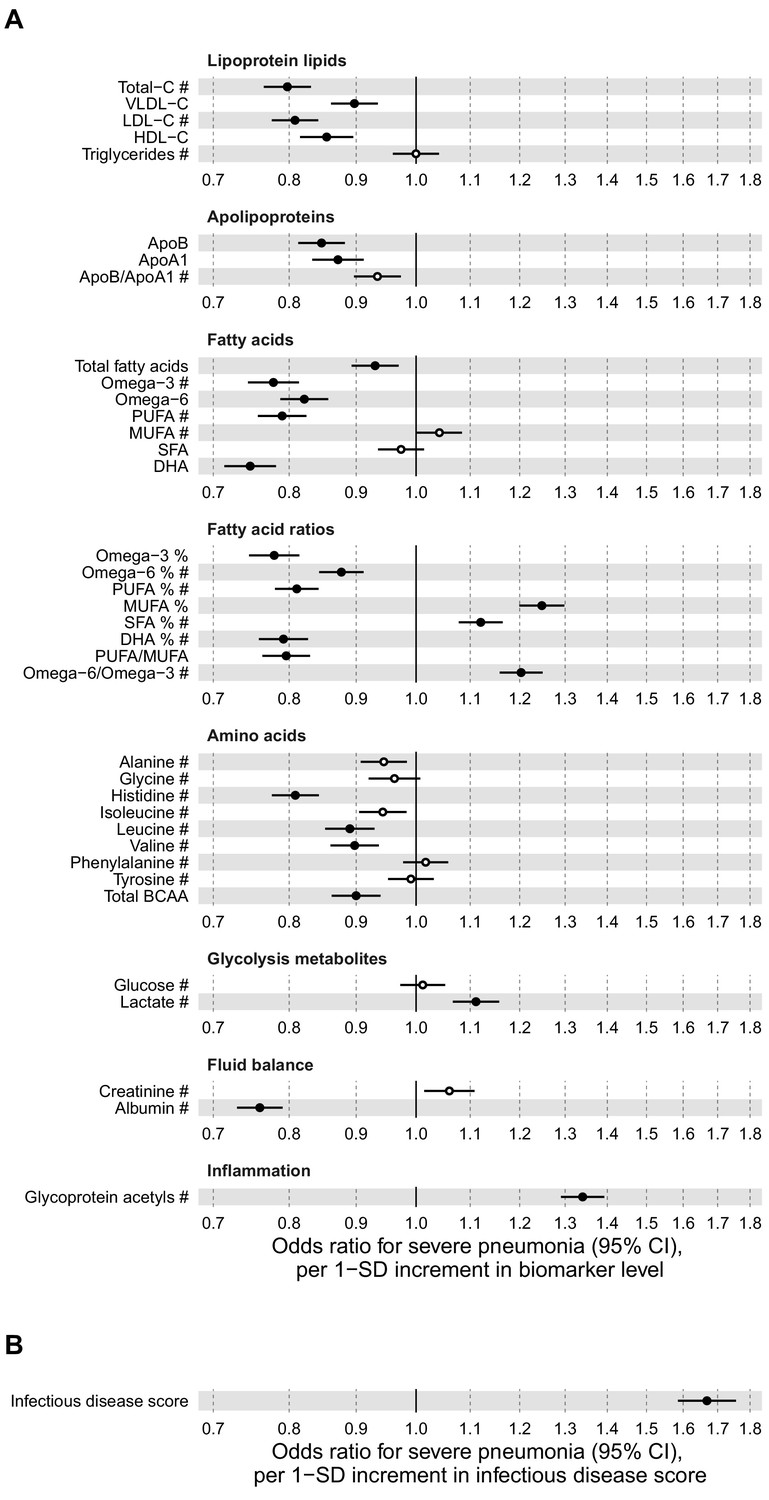
Relation of baseline biomarker concentrations to future risk of severe pneumonia in the UK Biobank (n = 105 146; 2507 incident events).
(A) Odds ratios with severe pneumonia (2507 hospitalisations or deaths during a median of 8 years of follow-up) for 37 clinically validated biomarkers measured simultaneously in a single assay by Nightingale Health NMR platform. (B) Odds ratio with severe pneumonia for the multi-biomarker infectious disease score. The infectious disease score comprises of the weighted sum of 25 out of 37 clinically validated biomarkers, optimised for association with severe pneumonia based on one half of the study population using LASSO regression. Biomarkers included in the infectious disease score are marked by #. The odds ratio for infectious disease score is evaluated in the other half of the study population (n = 52 573; 1250 events). All models are adjusted for age, sex, and assessment centre. Odds ratios are per 1-SD increment in the biomarker levels. Horizontal bars denote 95% confidence intervals. Closed circles denote p-value<0.001 and open circles p-value≥0.001. BCAA indicates branched-chain amino acids; DHA: docosahexaenoic acid; MUFA: monounsaturated fatty acids; PUFA: polyunsaturated fatty acids; SFA: saturated fatty acids.
-
Figure 2—source data 1
Numerical tabulation of odds ratios, betas, standard errors, and p-values for results shown in Figure 2.
- https://cdn.elifesciences.org/articles/63033/elife-63033-fig2-data1-v2.csv
Figure 2—figure supplement 1
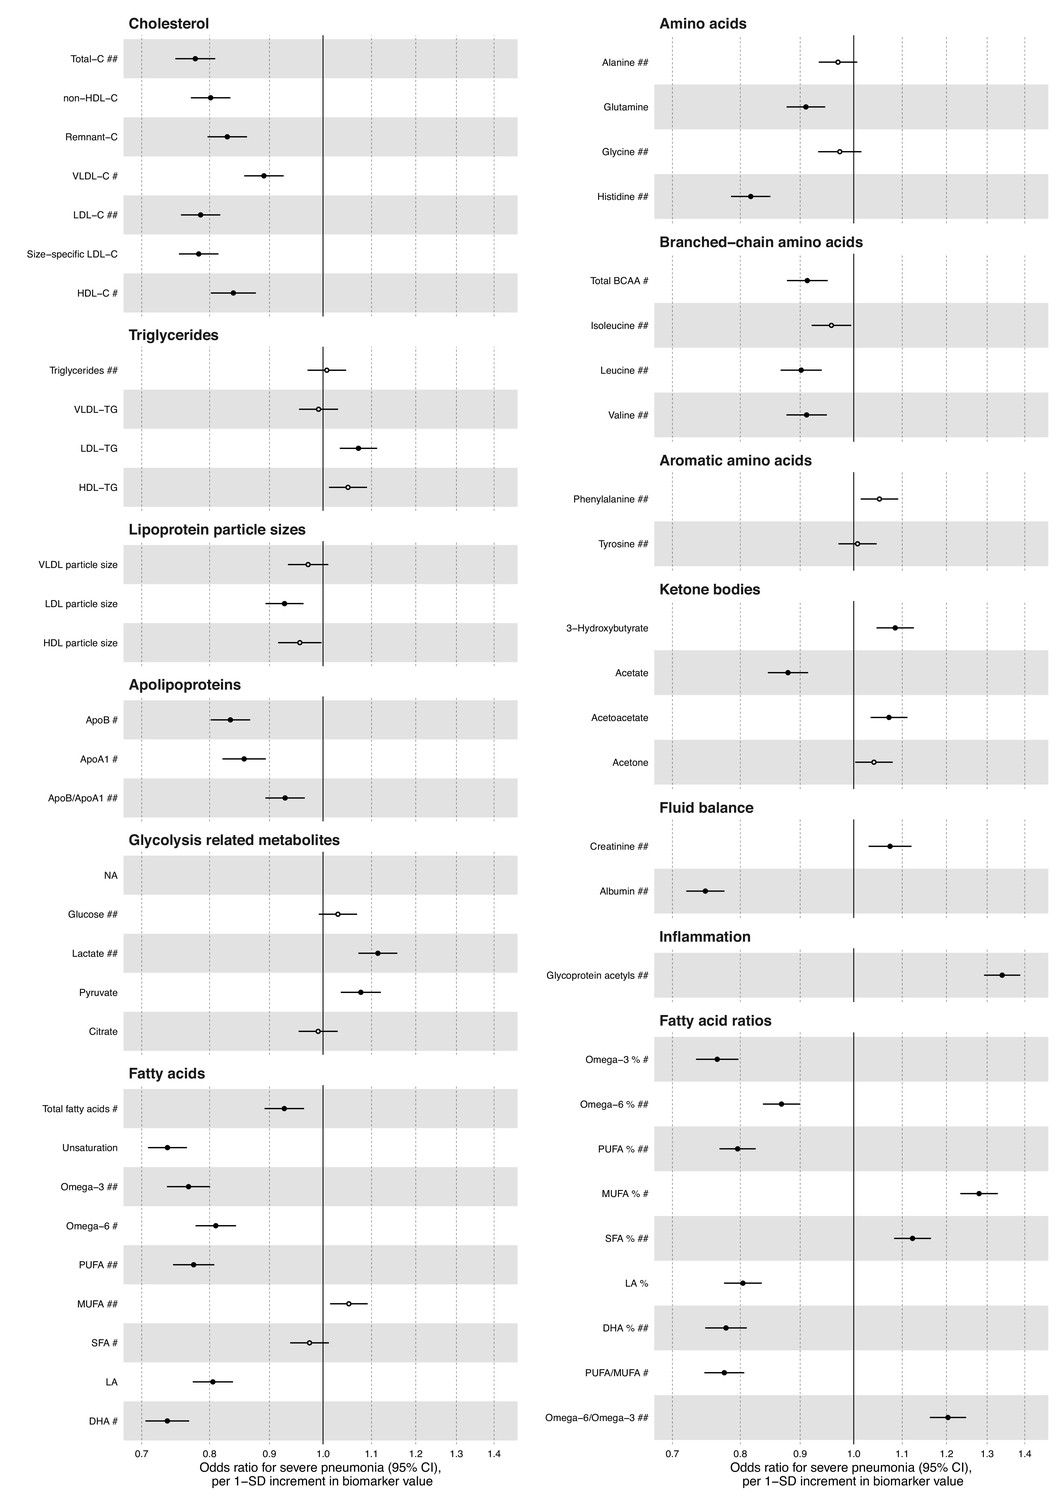
Relation of all biomarkers measured by the Nightingale Health NMR platform to risk of severe pneumonia in UK Biobank (n = 105 146; 2507 events).
Odds ratios with severe pneumonia (2507 hospitalisations or deaths during a median of 8 years of follow-up) for 56 metabolic measures quantified by the Nightingale Health NMR platform. The metabolic measures cover cholesterol and triglycerides in major lipoprotein fractions, lipoprotein particle size, apolipoproteins, glycolysis related metabolites, absolute levels of fatty acids and corresponding ratio measures relative to total circulating concentration of fatty acids, amino acids, ketone bodies, and markers of fluid balance and inflammation. Statistical models are adjusted for age, sex, and assessment centre. Odds ratios are per 1-SD increment in biomarker levels. Horizontal bars denote 95% confidence intervals. Closed circles denote p-value<0.001 and open circles p-value>0.001. Abbreviations: ApoA1, apolipoprotein A1; ApoB, apolipoprotein B; BCAA: branched-chain amino acids; C, cholesterol; DHA, docosahexaenoic acid; HDL, high-density lipoprotein; LA, linoleic acid; LDL, low-density lipoprotein; LA, linoleic acid; MUFA, monounsaturated fatty acids; NA; not available; PUFA, polyunsaturated fatty acids; SFA, saturated fatty acids; TG, triglycerides; VLDL, very-low-density lipoprotein.
Figure 2—figure supplement 2
Relation of all biomarkers measured by the Nightingale Health NMR platform to risk of severe pneumonia in UK Biobank (n = 105 146; 2507 events).
Odds ratios with severe pneumonia (2507 hospitalisations or deaths during a median of 8 years of follow-up) for 81 metabolic measures quantified by the Nightingale Health NMR platform. The metabolic measures cover lipid concentrations in major lipoprotein fractions and 14 lipoprotein subclasses. Percentage measures are concentration of specific lipid relative to total lipid concentration within the given lipoprotein subclass. Statistical models are adjusted for age, sex, and assessment centre. Odds ratios are per 1-SD increment in biomarker levels. Horizontal bars denote 95% confidence intervals. Closed circles denote p-value<0.001 and open circles p-value>0.001. C, cholesterol; CE, cholesteryl esters; FC, free cholesterol; HDL, high-density lipoprotein; IDL, intermediate-density lipoprotein; LDL, low-density lipoprotein; P, particle concentration; PG, phosphoglycerides; PL, phospholipids; TG, triglycerides; VLDL, very-low-density lipoprotein.
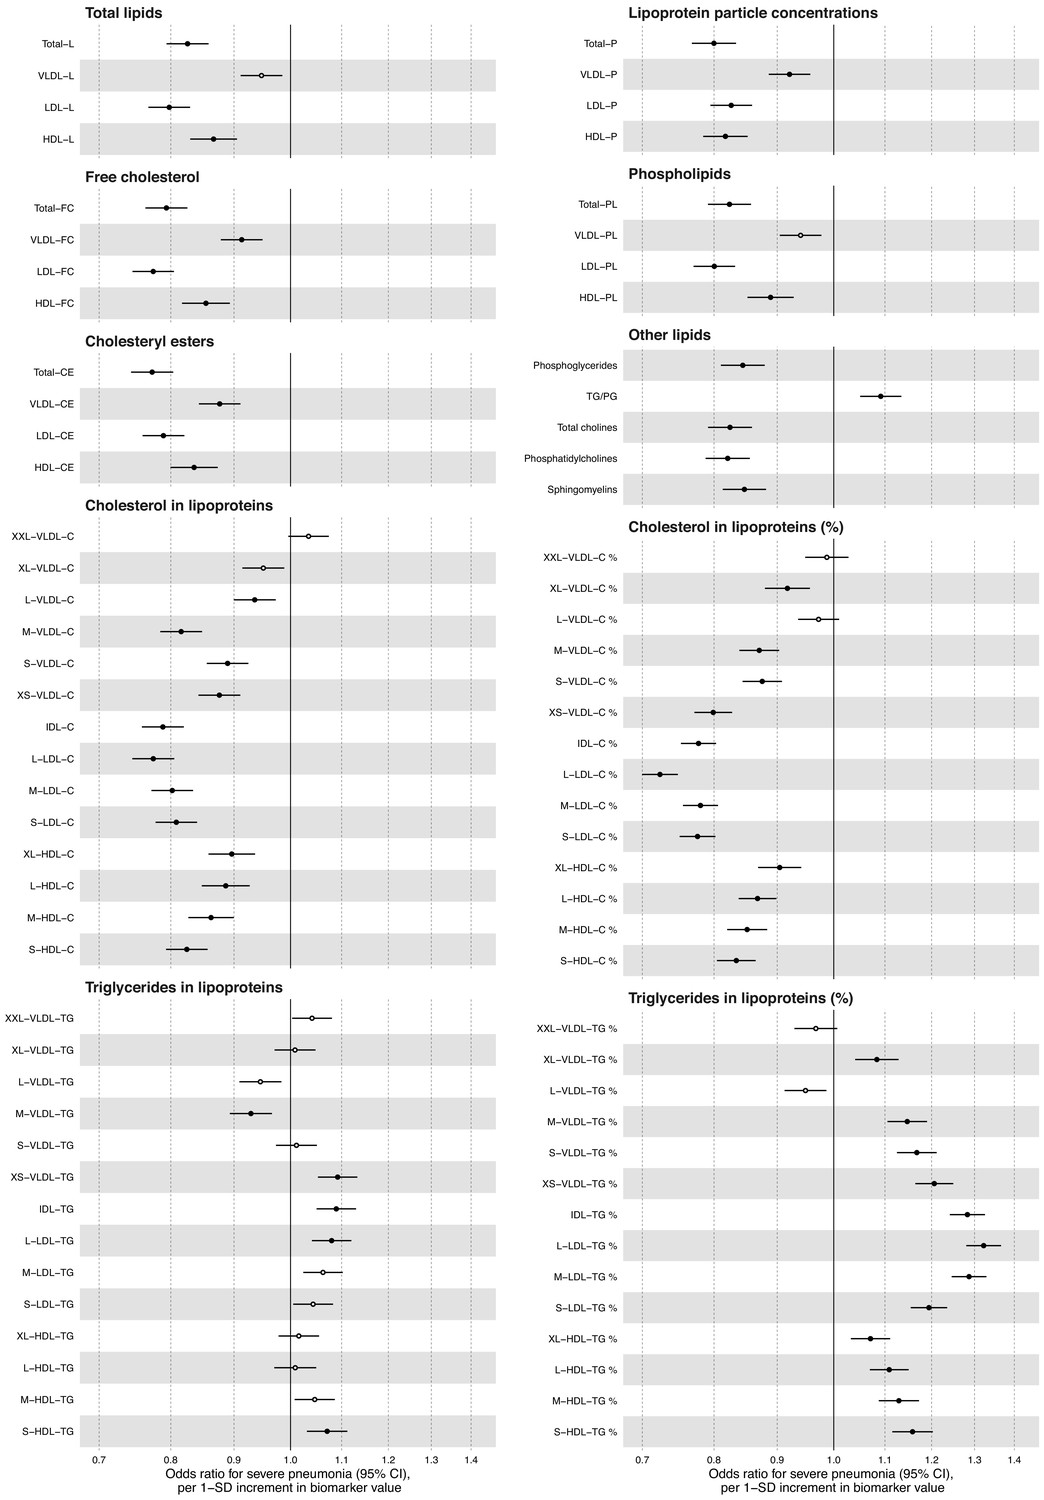
Figure 2—figure supplement 3
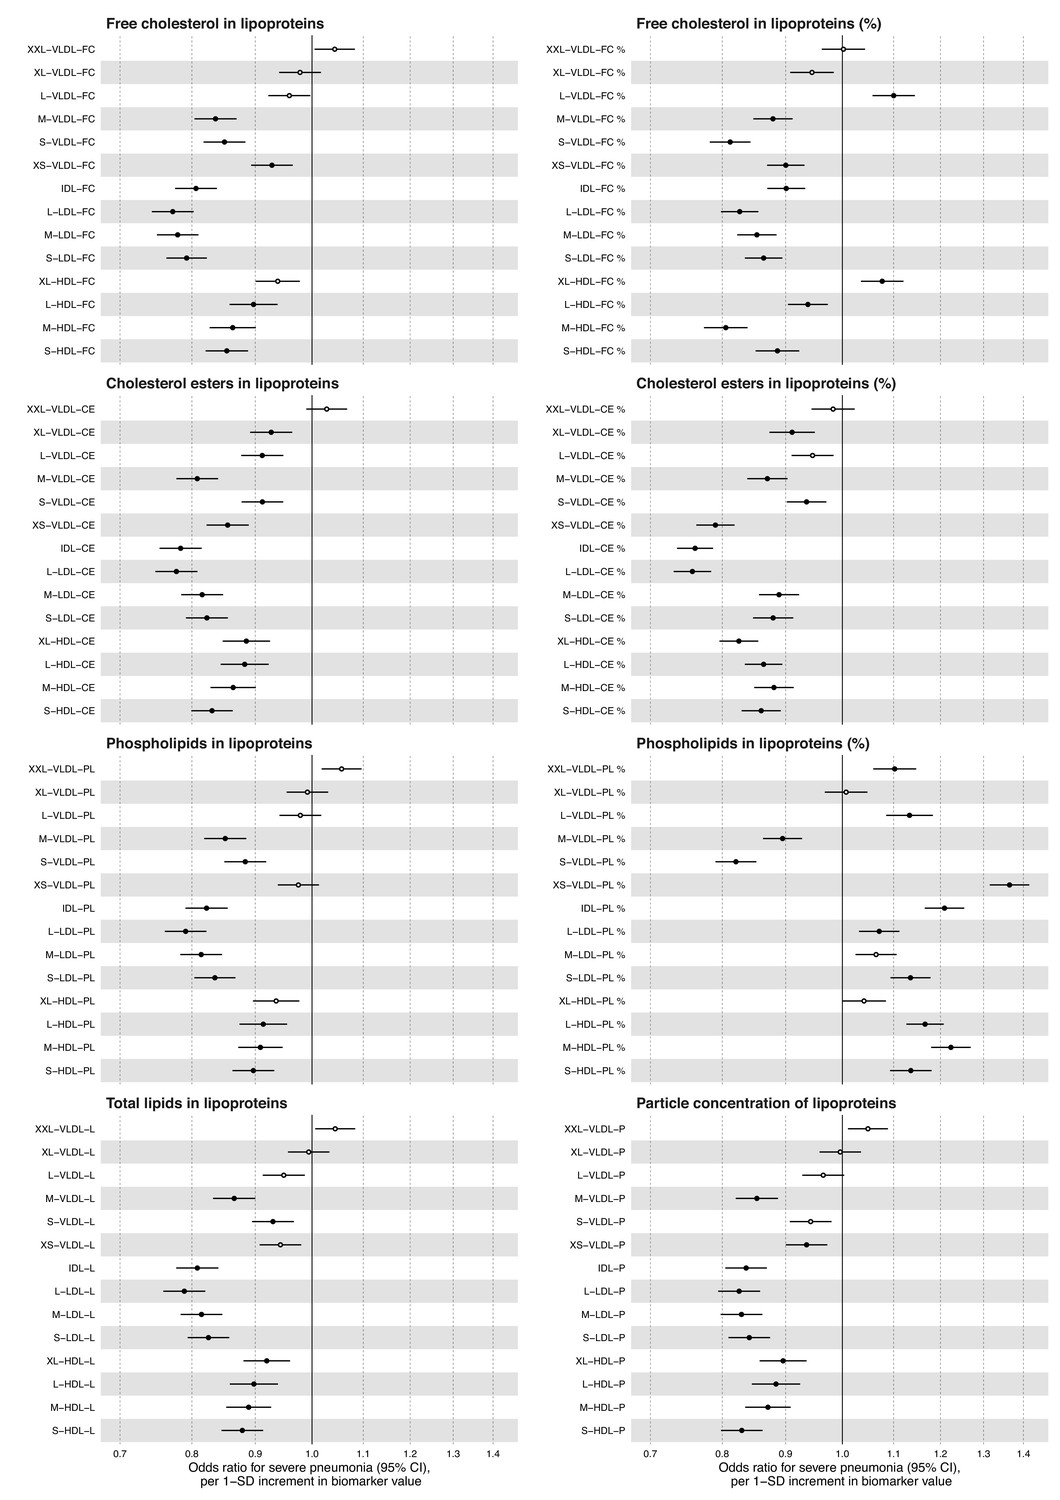
Relation of all biomarkers measured by the Nightingale Health NMR platform to risk of severe pneumonia in UK Biobank (n = 105 146; 2507 events).
Odds ratios with severe pneumonia (2507 hospitalisations or deaths during a median of 8 years of follow-up) for 112 metabolic measures quantified by the Nightingale Health NMR platform. The metabolic measures cover lipid concentrations in 14 lipoprotein subclasses. Percentage measures are concentration of specific lipid relative to total lipid concentration within the given lipoprotein subclass. Statistical models are adjusted for age, sex, and assessment centre. Odds ratios are per 1-SD increment in biomarker levels. Horizontal bars denote 95% confidence intervals. Closed circles denote p-value<0.001 and open circles p-value>0.001. CE, cholesteryl esters; FC, free cholesterol; HDL, high-density lipoprotein; IDL, intermediate-density lipoprotein; L, total lipid concentration; LDL, low-density lipoprotein; PL, phospholipids; VLDL, very-low-density lipoprotein.
Figure 3

Relation of the multi-biomarker infectious disease score to future risk of severe pneumonia with additional adjustments and in subgroups (n = 52 573; 1250 incident events).
(A) Odds ratios with severe pneumonia after additional adjustments for BMI, smoking status, and prevalent diseases. (B) Odds ratios with severe pneumonia in study participants with and without prevalent diseases. (C) Odds ratios by age tertiles at the time of blood sampling. (D) Odds ratios for men and women separately. All models are adjusted for age, sex, and assessment centre. The left-hand side shows odds ratios per 1-SD increment in the multi-biomarker infectious disease score, and the right-hand side odds ratios for comparing individuals in the highest and lowest quintiles of the score. The results are based on the validation half of the study population not used in deriving the infectious disease score (1250 events during a median of 8 years of follow-up).
-
Figure 3—source data 1
Numerical tabulation of odds ratios, betas, standard errors, and p-values for results shown in Figure 3.
- https://cdn.elifesciences.org/articles/63033/elife-63033-fig3-data1-v2.csv
Figure 4 with 1 supplement
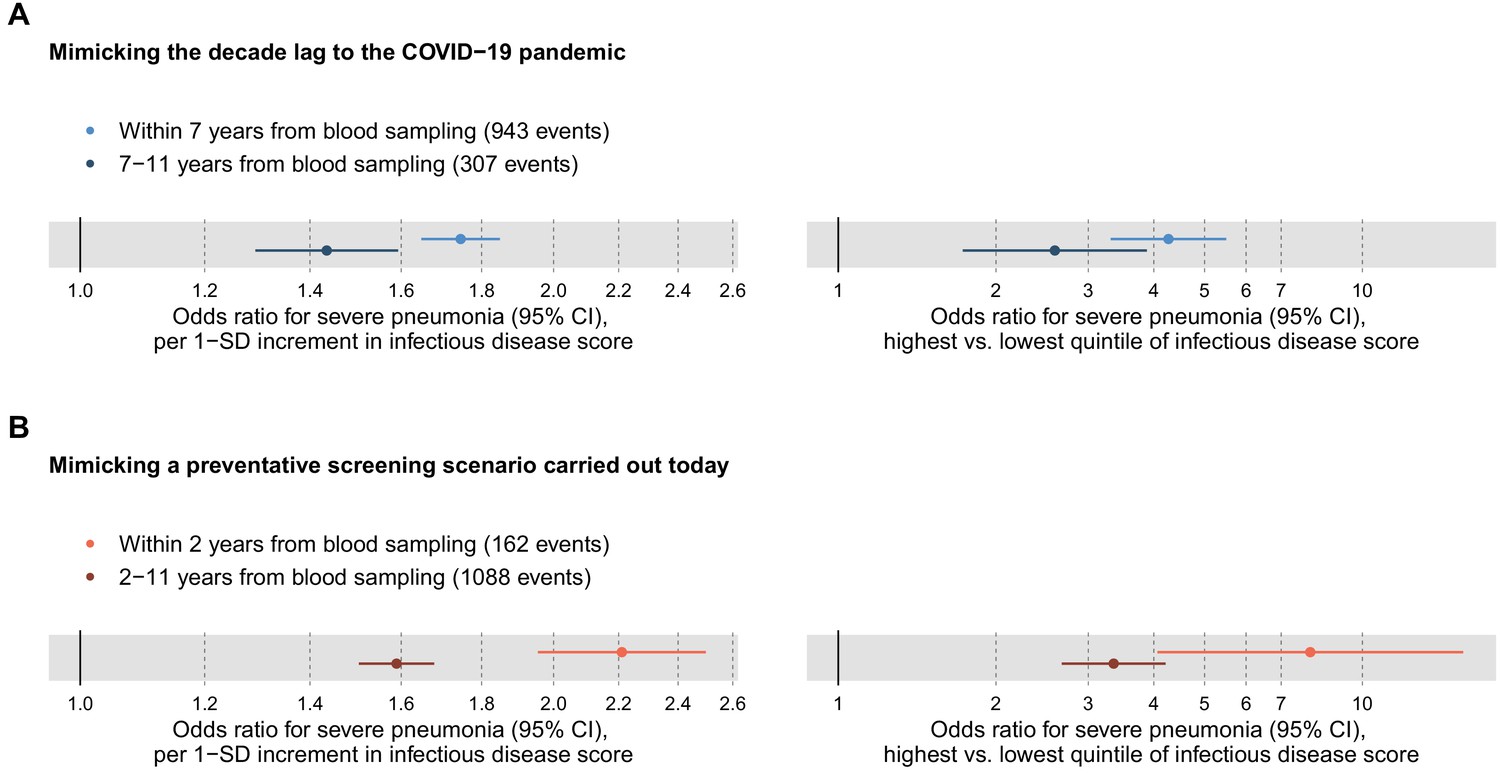
Relation of the multi-biomarker infectious disease score to long-term and short-term future risk for severe pneumonia (n = 52 573; 1250 incident events).
(A) Odds ratios with severe pneumonia events occurring within the first 7 years after the blood sampling, compared to events that occurred 7–11 years after blood sampling. (B) Odds ratios for severe pneumonia occurring within and after the first 2 years of blood sampling. Models are adjusted for age, sex, and assessment centre. The left-hand side shows odds ratios per 1-SD increment in the multi-biomarker infectious disease score, and the right-hand side odds ratios for comparing individuals in the highest and lowest quintiles of the score. The results are based on the validation half of the study population that was not used in deriving the infectious disease score.
-
Figure 4—source data 1
Numerical tabulation of odds ratios, betas, standard errors, and p-values for results shown in Figure 4.
- https://cdn.elifesciences.org/articles/63033/elife-63033-fig4-data1-v2.csv
Figure 4—figure supplement 1
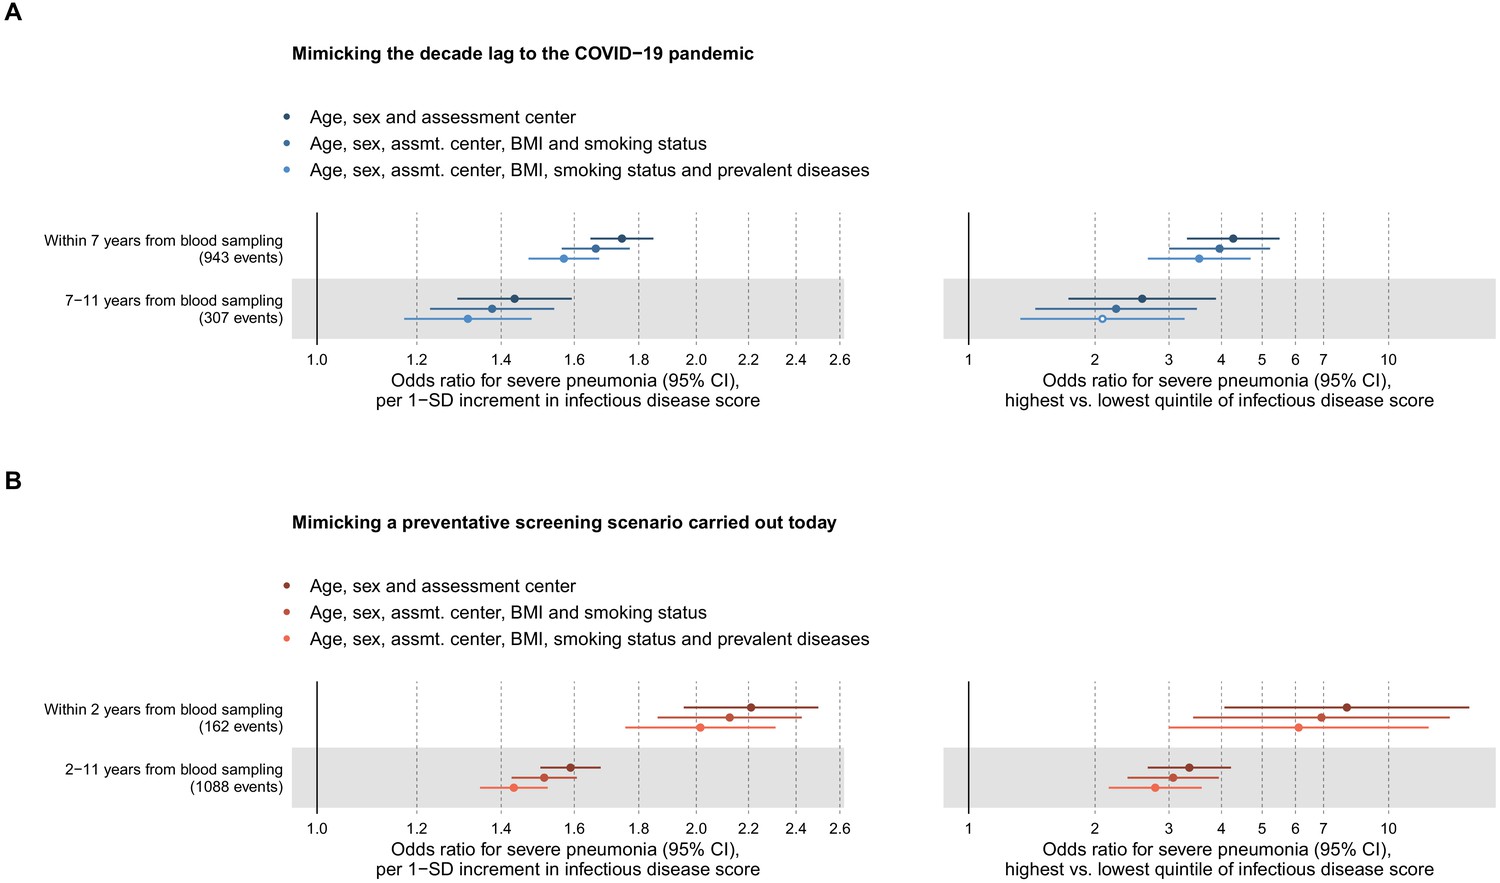
Relation of the multi-biomarker infectious disease score to long-term and short-term risk for severe pneumonia after adjustment for risk factors and prevalent diseases (n = 52 573; 1250 events).
(A) Odds ratios of the multi-biomarker infectious disease score with severe pneumonia events occurring within the first 7 years of blood sampling and events occurring 7–11 years after blood sampling, showing the influence of the adjustment for BMI, smoking status and prevalent diseases. (B) Odds ratios of the multi-biomarker infectious disease score with severe pneumonia events occurring within and after the first 2 years of blood sampling, showing the influence of additional adjustment for BMI, smoking status and prevalent diseases. All models are adjusted for age, sex, and assessment centre. The left-hand side shows odds ratios per 1-SD increment in the multi-biomarker infectious disease score, and the right-hand side odds ratios for comparing individuals in the highest and lowest quintiles of the score. The results are based on the validation half of the study population that was not used in deriving the infectious disease score.
Figure 5 with 1 supplement
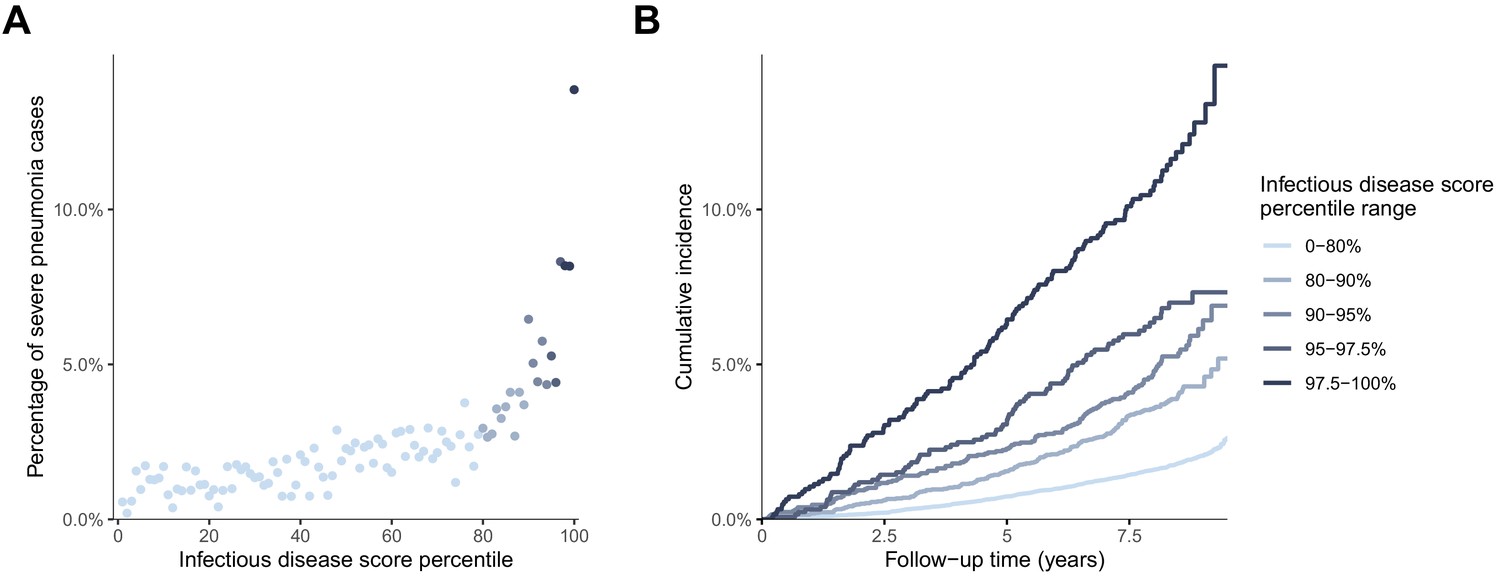
Risk gradient for contracting severe pneumonia after the blood sampling according to percentiles of the multi-biomarker infectious disease score (n = 52 573; 1250 incident events).
(A) Proportion of individuals who contracted severe pneumonia during a median follow-up time of 8.1 years after the blood sampling according to percentiles of the multi-biomarker infectious disease score. Each point represents approximately 500 individuals. (B) Kaplan-Meier curves of the cumulative probability for severe pneumonia in quantiles of the multi-biomarker infectious disease score. The follow-up time was truncated at 9.5 years since only a small fraction of individuals were followed longer. Results are based on the validation half of the study population that was not used in deriving the infectious disease score (n = 52,573). The corresponding plots for individuals free of baseline respiratory and cardiometabolic diseases are shown in Figure 5—figure supplement 1.
-
Figure 5—source data 1
Numerical tabulation of event rates for each percentile in Figure 5A.
- https://cdn.elifesciences.org/articles/63033/elife-63033-fig5-data1-v2.csv
Figure 5—figure supplement 1
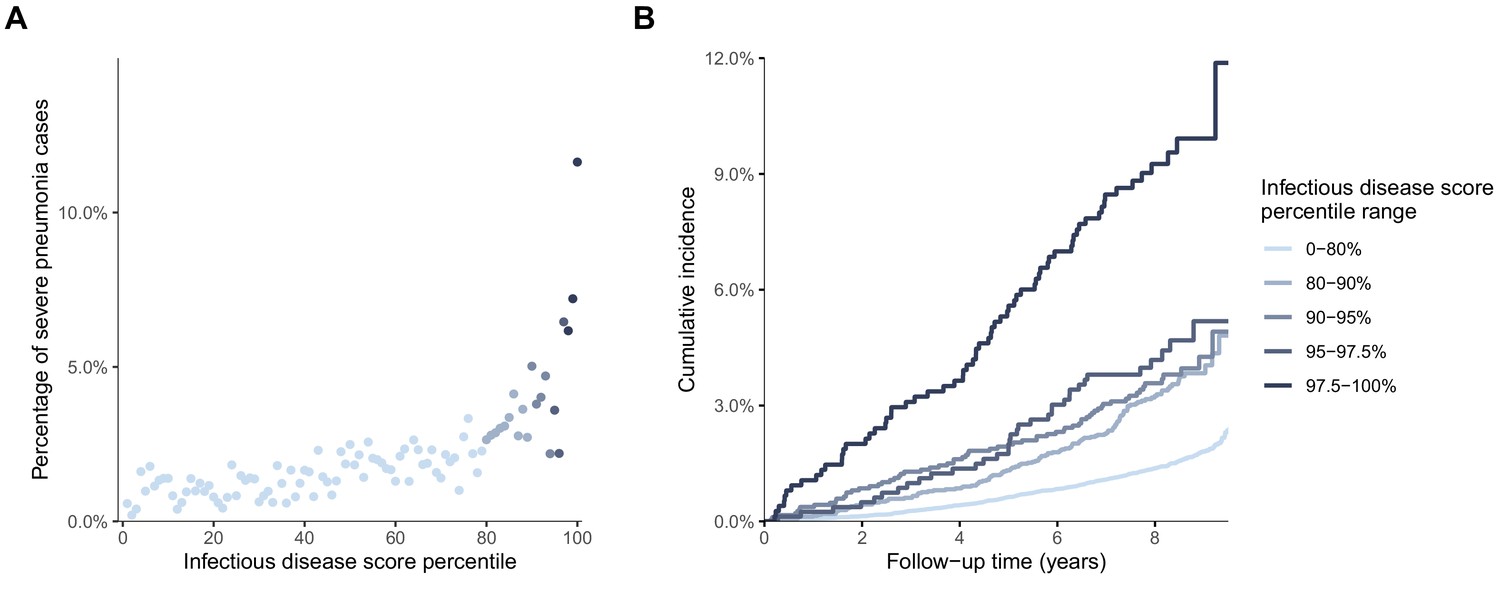
Risk gradients for contracting severe pneumonia by percentiles of the multi-biomarker infectious disease score among individuals without prevalent diseases at time of blood sampling (n = 46,252; 877 events).
(A) Proportion of individuals, without prevalent diseases at the time of blood sampling, who contracted severe pneumonia during a median of 8 years of follow-up according to percentiles of the multi-biomarker infectious disease score. Each dot represents approximately 450 individuals. (B) Kaplan-Meier curves of the cumulative probability of severe pneumonia in quantiles of the infectious disease score. The follow-up time was truncated at 9.5 years since only a small fraction of individuals were followed longer. Both plots show results based on the validation half of the study population that was not used for deriving the infectious disease score. Individuals with the following diseases at time of blood sampling were excluded: cardiovascular disease, diabetes, lung cancer, COPD, liver diseases, renal failure and dementia.
Figure 6
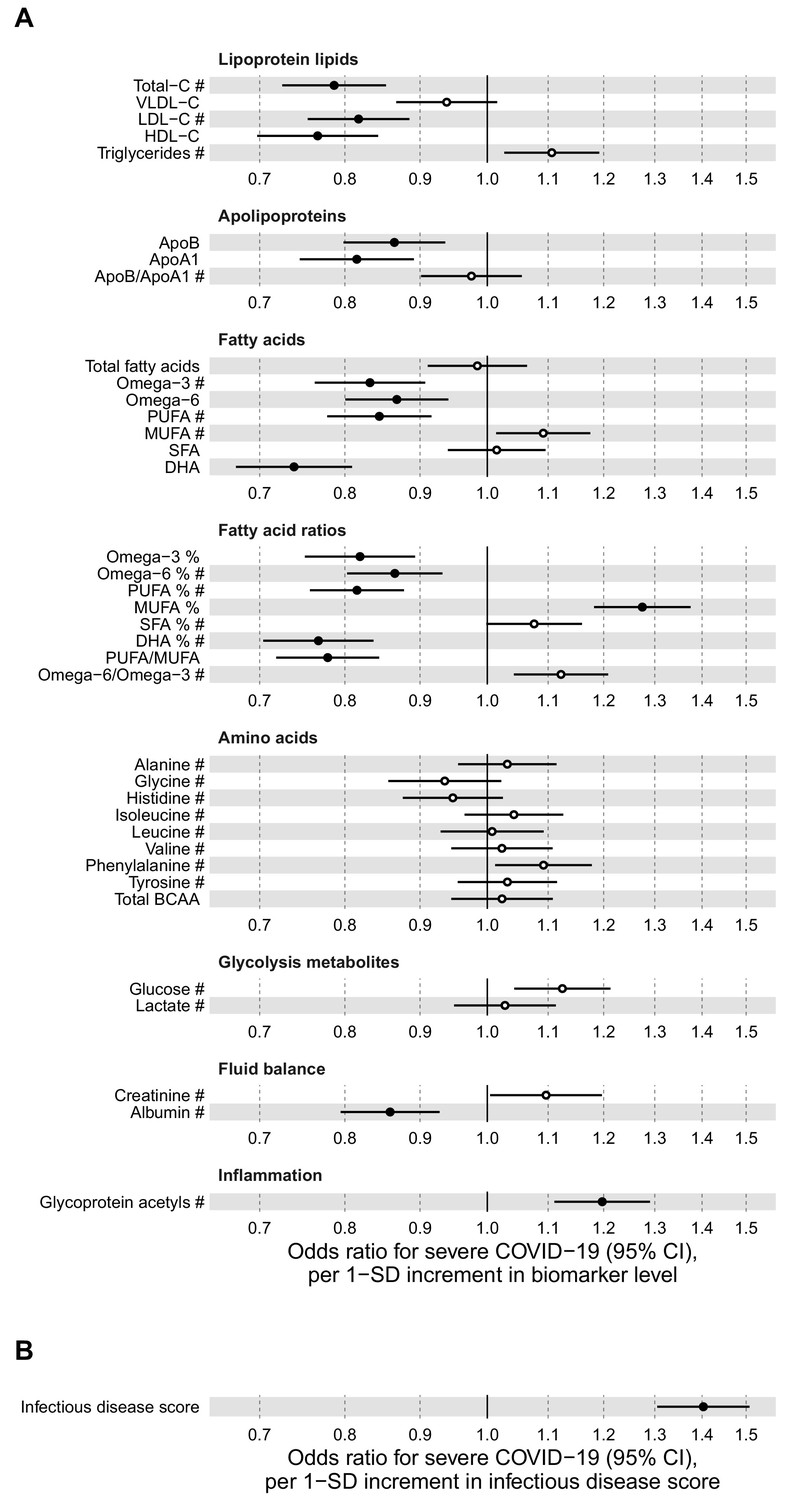
Relation of baseline biomarkers and multi-biomarker infectious disease score to future risk of severe COVID-19 (n = 92 725; 652 cases diagnosed in hospital).
(A) Odds ratios with severe COVID-19 (defined as PCR-positive diagnosis in hospital; 652 cases out of 92 725 individuals) for 37 clinically validated biomarkers measured by NMR. (B) Odds ratio with severe COVID-19 for the multi-biomarker infectious disease score. Biomarkers included in the infectious disease score are marked by #. Odds ratios are per 1-SD increment in the biomarker levels. Models are adjusted for age, sex, and assessment centre.
-
Figure 6—source data 1
Numerical tabulation of odds ratios, betas, standard errors, and p-values for results shown in Figure 6.
- https://cdn.elifesciences.org/articles/63033/elife-63033-fig6-data1-v2.csv
Figure 7

Concordance of the overall pattern of biomarker associations with future onset of severe pneumonia and severe COVID-19.
Biomarker associations with future onset of severe pneumonia (y-axis) plotted against the corresponding associations with severe COVID-19 (x-axis). The odds ratios, with adjustment for age, sex, and assessment centre, for each of the 37 clinically validated biomarkers in the Nightingale Health NMR platform are given with 95% confidence intervals in vertical and horizontal error bars. The dashed line denotes the diagonal.
-
Figure 7—source data 1
Numerical tabulation of odds ratios, and 95% confidence intervals for results shown in Figure 7.
- https://cdn.elifesciences.org/articles/63033/elife-63033-fig7-data1-v2.csv
Figure 8
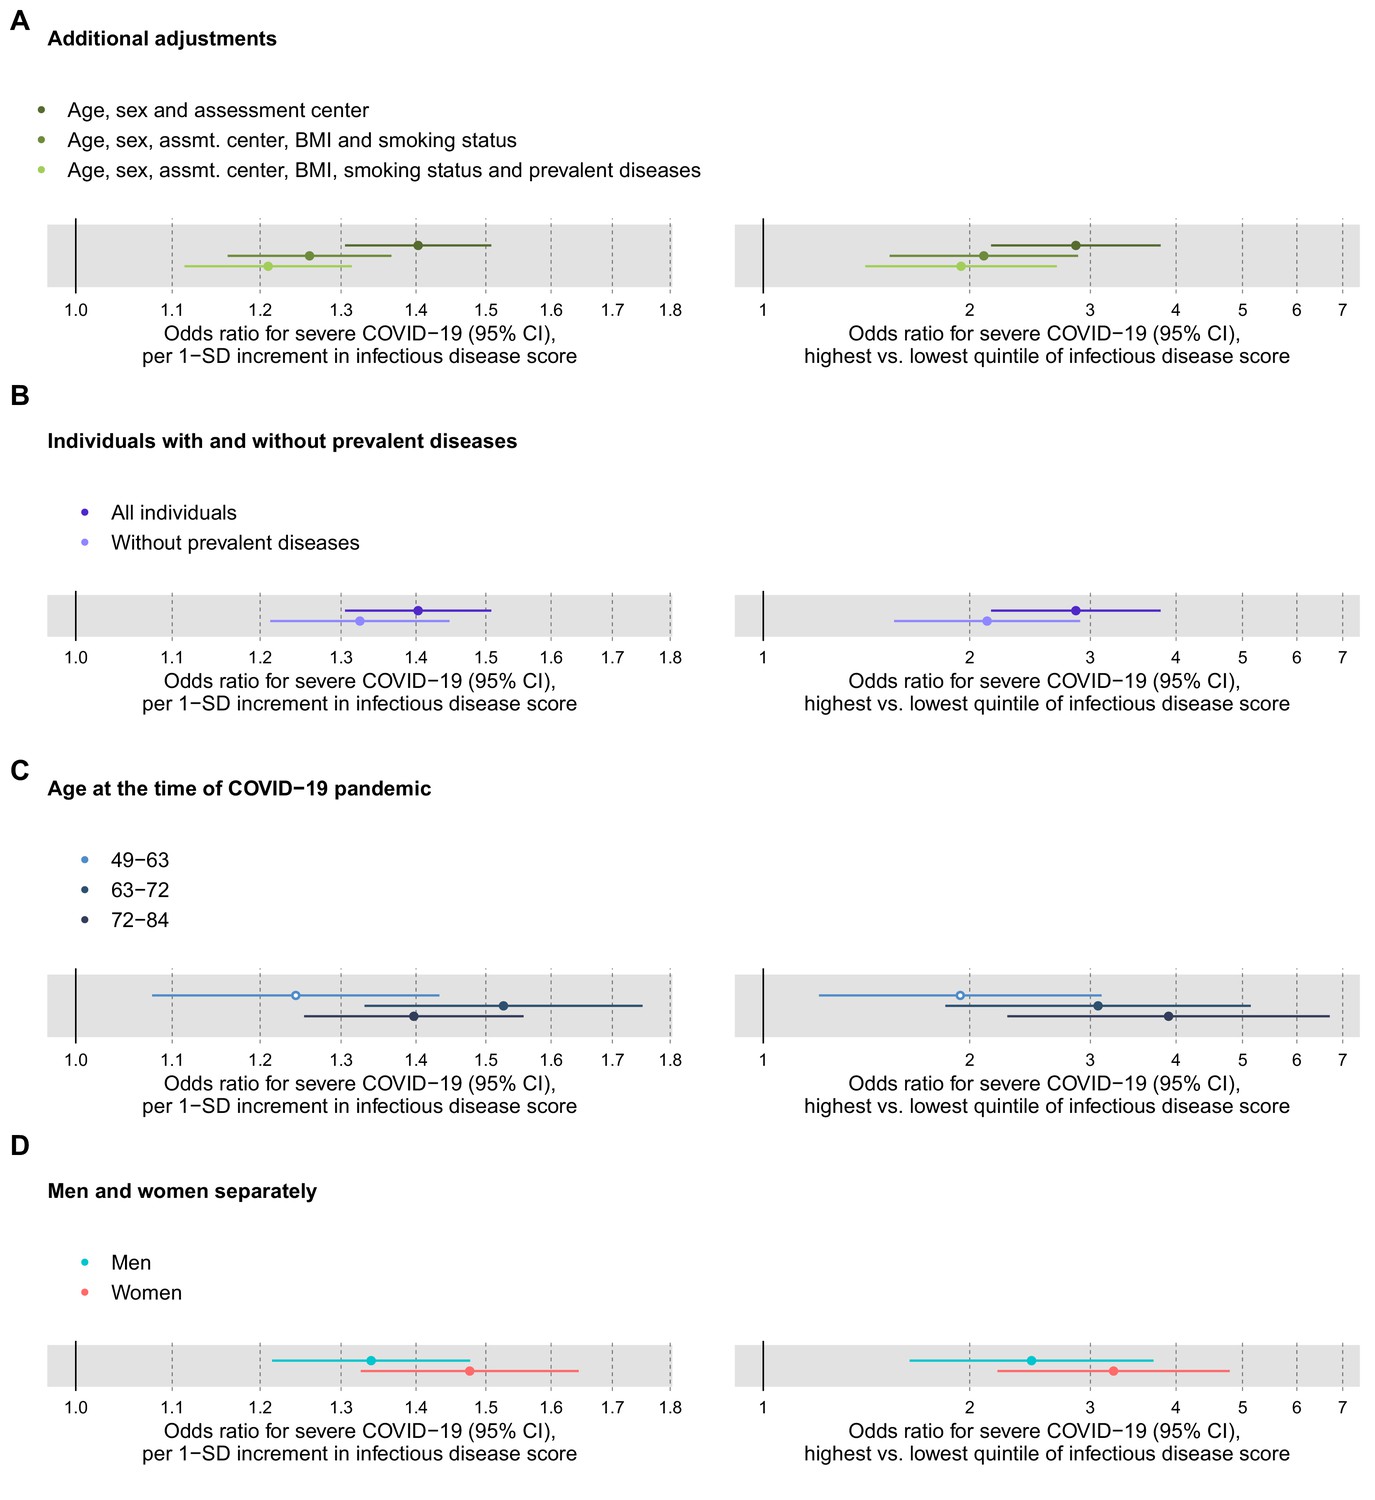
Relation of the multi-biomarker infectious disease score to future risk of severe COVID-19 with additional adjustments and in subgroups of the study population (n = 92,725; 652 cases diagnosed in hospital).
(A) Odds ratios with severe COVID-19 after additional adjustments for BMI, smoking status and prevalent diseases. (B) Odds ratios with severe pneumonia in study participants with and without prevalent diseases at the time of blood sampling. (C) Odds ratios by age tertiles at the time of the COVID-19 pandemic. (D) Odds ratios for men and women, separately. The left-hand side shows the odds ratios per 1-SD increment in the multi-biomarker infectious disease score, and the right-hand side the odds ratios for comparing individuals in the highest and lowest quintiles of the score. All models are adjusted for age, sex, and assessment centre.
-
Figure 8—source data 1
Numerical tabulation of odds ratios, betas, standard errors, and p-values for results shown in Figure 8.
- https://cdn.elifesciences.org/articles/63033/elife-63033-fig8-data1-v2.csv
Figure 9
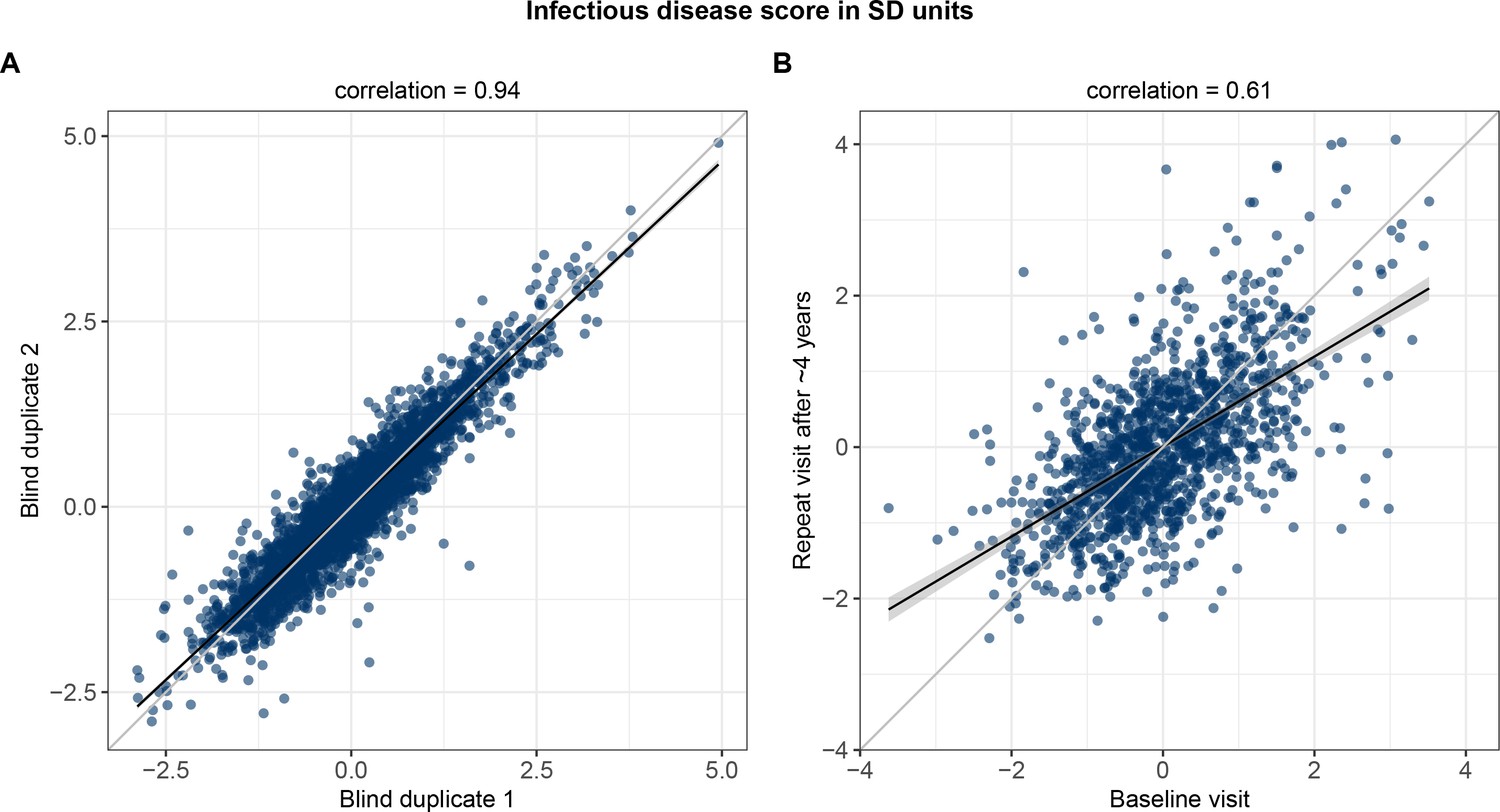
Technical repeatability for measuring the multi-biomarker infectious disease score and biological stability in repeat measures 4 years after the baseline blood sampling.
(A) Technical repeatability of the infectious disease score assessed in blind duplicate samples. The correlation plot is based on 2863 blind duplicate plasma samples measured along with the regular measurements of ~105,000 samples in the Nightingale Health-UK Biobank initiative. (B) Biological stability of the infectious disease score based on plasma samples from 1298 individuals who attended both the baseline visit as well as a repeat visit ~4 years later at the UK Biobank assessment centres.
Tables
Table 1
Clinical characteristics of the UK Biobank participants in the current study.
| Severe pneumonia (diagnosis in hospital or death record) | Severe COVID-19 (diagnosis in hospital) | |||
|---|---|---|---|---|
| Incident cases | Controls | Incident cases | Controls | |
| Individuals with NMR biomarker measures | 2507 | 102 639 | 652 | 92 073 |
| Age at blood sampling (median, [range]) | 62 [40-70] | 58 [39-70] | 60 [40-70] | 58 [39-70] |
| Females (%) | 44% | 54% | 43% | 54% |
| Body mass index (mean, kg/m2) | 28.5 | 27.4 | 28.7 | 27.3 |
| Proportion with prevalent diseases | ||||
| Cardiovascular disease (%) | 17.5% | 6.6% | 14.7% | 6.4% |
| Diabetes (%) | 9.3% | 3.9% | 9.2% | 3.8% |
| Lung cancer (%) | 0.4% | 0.1% | 0.3% | 0.1% |
| Chronic obstructive pulmonary disease (%) | 6.1% | 0.7% | 1.8% | 0.8% |
| Liver diseases (%) | 1.5% | 0.7% | 1.7% | 0.7% |
| Renal failure (%) | 3.6% | 1.3% | 2.9% | 1.4% |
| Dementia (%) | 0.1% | 0.01% | 0.0% | 0.01% |
-
The number of individuals analysed for severe COVID-19 is slightly lower than for severe pneumonia, since COVID-19 data were not available from assessment centres in Scotland and Wales.
Additional files
-
Supplementary file 1
Table of weights of the biomarkers included in the multi-biomarker infectious disease score derived using LASSO regression.
The table indicates the weights for the 25 biomarkers that were selected in derivation of the multi-biomarker infectious disease score, based on optimising prediction for severe pneumonia using logistic regression with LASSO in the derivation half of the study population (n = 52,573). Each biomarker was scaled to SD-units prior to the analyses. The infectious disease score was then calculated as β1×X1 + β2×X2 + … + β25×X25, with Xi denoting the SD-standardised biomarker level for the ith biomarker and βi denoting the coefficient from the multi-biomarker logistic regression model. DHA indicates docosahexaenoic acid; MUFA: monounsaturated fatty acids; PUFA: polyunsaturated fatty acids; SFA: saturated fatty acids.
- https://cdn.elifesciences.org/articles/63033/elife-63033-supp1-v2.docx
-
Supplementary file 2
Mean biomarker concentrations and standard deviations, and odds ratios of all 249 biomarkers with severe pneumonia.
The table indicates mean concentrations and standard deviations used for biomarker scaling. The table also includes numerical results of odds ratios of all 249 biomarkers with severe pneumonia, with corresponding 95% confidence intervals and p-values, and whether each biomarker is clinically validated and included in the multi-biomarker infectious disease score.
- https://cdn.elifesciences.org/articles/63033/elife-63033-supp2-v2.xlsx
-
Transparent reporting form
- https://cdn.elifesciences.org/articles/63033/elife-63033-transrepform-v2.docx
Download links
A two-part list of links to download the article, or parts of the article, in various formats.
Downloads (link to download the article as PDF)
Open citations (links to open the citations from this article in various online reference manager services)
Cite this article (links to download the citations from this article in formats compatible with various reference manager tools)
Metabolic biomarker profiling for identification of susceptibility to severe pneumonia and COVID-19 in the general population
eLife 10:e63033.
https://doi.org/10.7554/eLife.63033


