Combinatorial deployment of F-actin regulators to build complex 3D actin structures in vivo
- Department of Biological Sciences, University of Denver, United States
Figures
Figure 1 with 2 supplements

Rapid formation and dissolution of cortical actin cap structures.
(A) Still images from live-imaging of apical F-actin dynamics (UAS:moeABD:mCherry, cycle 11) at t = 0, 20, 90, 180, 270, 360, 540 s. Scale bar = 5 μm. (B) WT actin cap area dynamics from cycle 11 (measured cap n = 15, from embryo N = 4). Cap areas are normalized to the size at t = 0 s. Four different phases are labeled (Exp.: Expansion; Stab.: Stabilization; Elong.: Elongation; and Frag.: Fragmentation phases). (C) WT actin cap expansion rate from 30 s rolling window (cycle 11, n = 15, N = 4). Inset has y-axis re-scaled to visualize changes after expansion. (D) WT actin cap area (μm2) from cycle 11 at t = 0, 60, 120, 180, 240, 300, 360, 420, 480, 540 s (n = 15, N = 4). (E) WT actin cap area change in different phases (cycle 11, n = 15, N = 4). The values are calculated by the cap area at the end point divided by the area at the beginning of each phase. (F) Average WT actin cap area expansion rate (μm2/s) in different phases (cycle 11, n = 15, N = 4). (G) Average WT actin cap intensity (A.U.) from cycle 11 at t = 0, 60, 120, 180, 240, 300, 360, 420, 480, 540 s (n = 12, N = 3). (H) WT actin cap heterogeneity dynamics from cycle 11 (n = 15, N = 4). The heterogeneity is measured as the intensity standard deviation normalized to the value at t = 0 s. (I) WT actin cap heterogeneity from cycle 11 at t = 0, 60, 120, 180, 240, 300, 360, 420, 480, 540 s (n = 15, N = 4).
-
Figure 1—source data 1
Cap dynamics data.
- https://cdn.elifesciences.org/articles/63046/elife-63046-fig1-data1-v2.xlsx
Figure 1—figure supplement 1
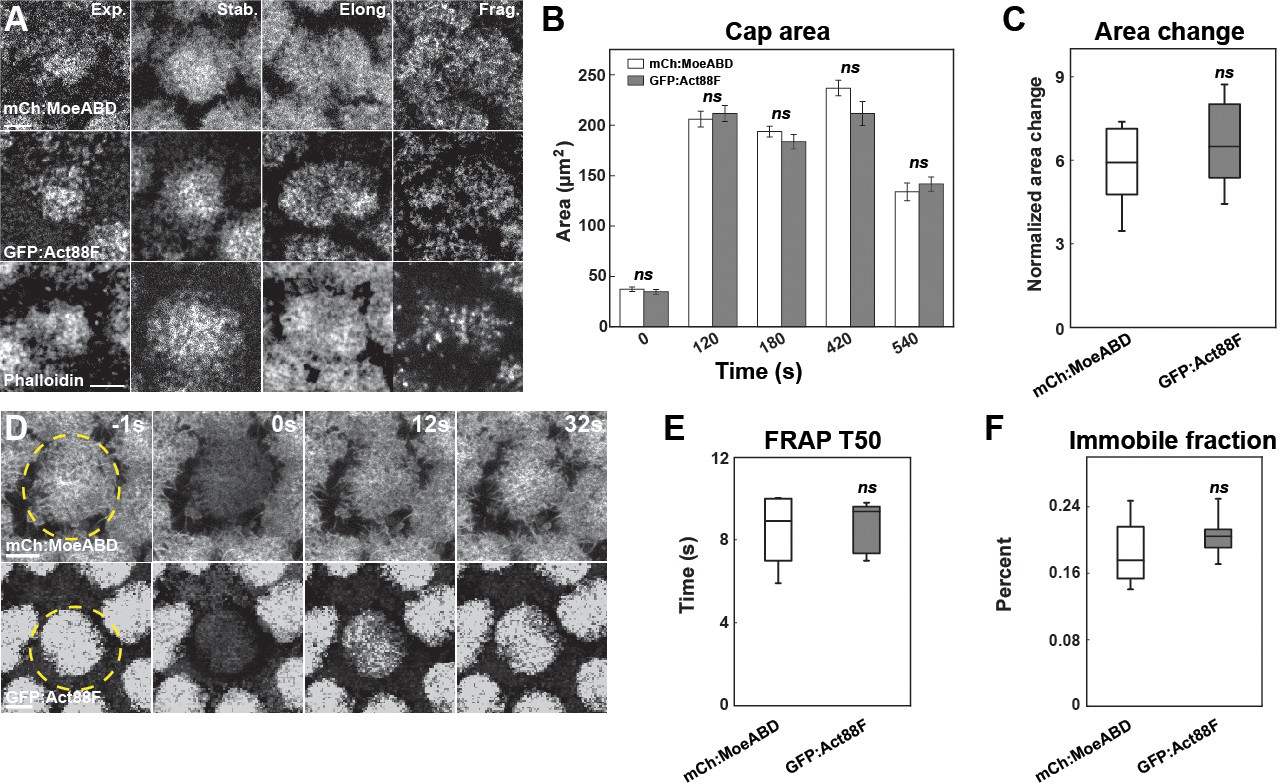
Similar actin labeling with different actin markers.
(A) Representative images from live-imaged mCh:MoesinABD (actin-binding domain of Moesin labeled with mCherry), live-imaged GFP:Act88F (Actin directly labeled with GFP) live-imaging, and fixed Phalloidin staining. Expansion (Exp.), stabilization (Stab.), elongation (Elong.), and fragmentation (Frag.) phases are shown. Scale bar = 5 μm. (B) Cap area comparison of mCh:MoeABD (n = 15, N = 4) and GFP:Act88F (n = 10, N = 3) at t = 0, 120, 180, 420, 540 s. ns: not significant. (C) Normalized cap area change of mCh:MoeABD (n = 15, N = 4) and GFP:Act88F (n = 10, N = 3) at 120 s. (D) Representative FRAP images from mCh:MoesinABD and GFP:Act88F at t = −1 s (1 s before photobleaching), 0 s (photobleaching), 12 s, and 32 s in cycle 11 caps during stabilization phase. Scale bar = 5 μm. (E, F) FRAP T50 and immobile fraction of different F-actin markers: mch:MoeABD (n = 6) and GFP:Act88F (n = 7) structures in cycle 11 caps at ~120 s.
Figure 1—figure supplement 2
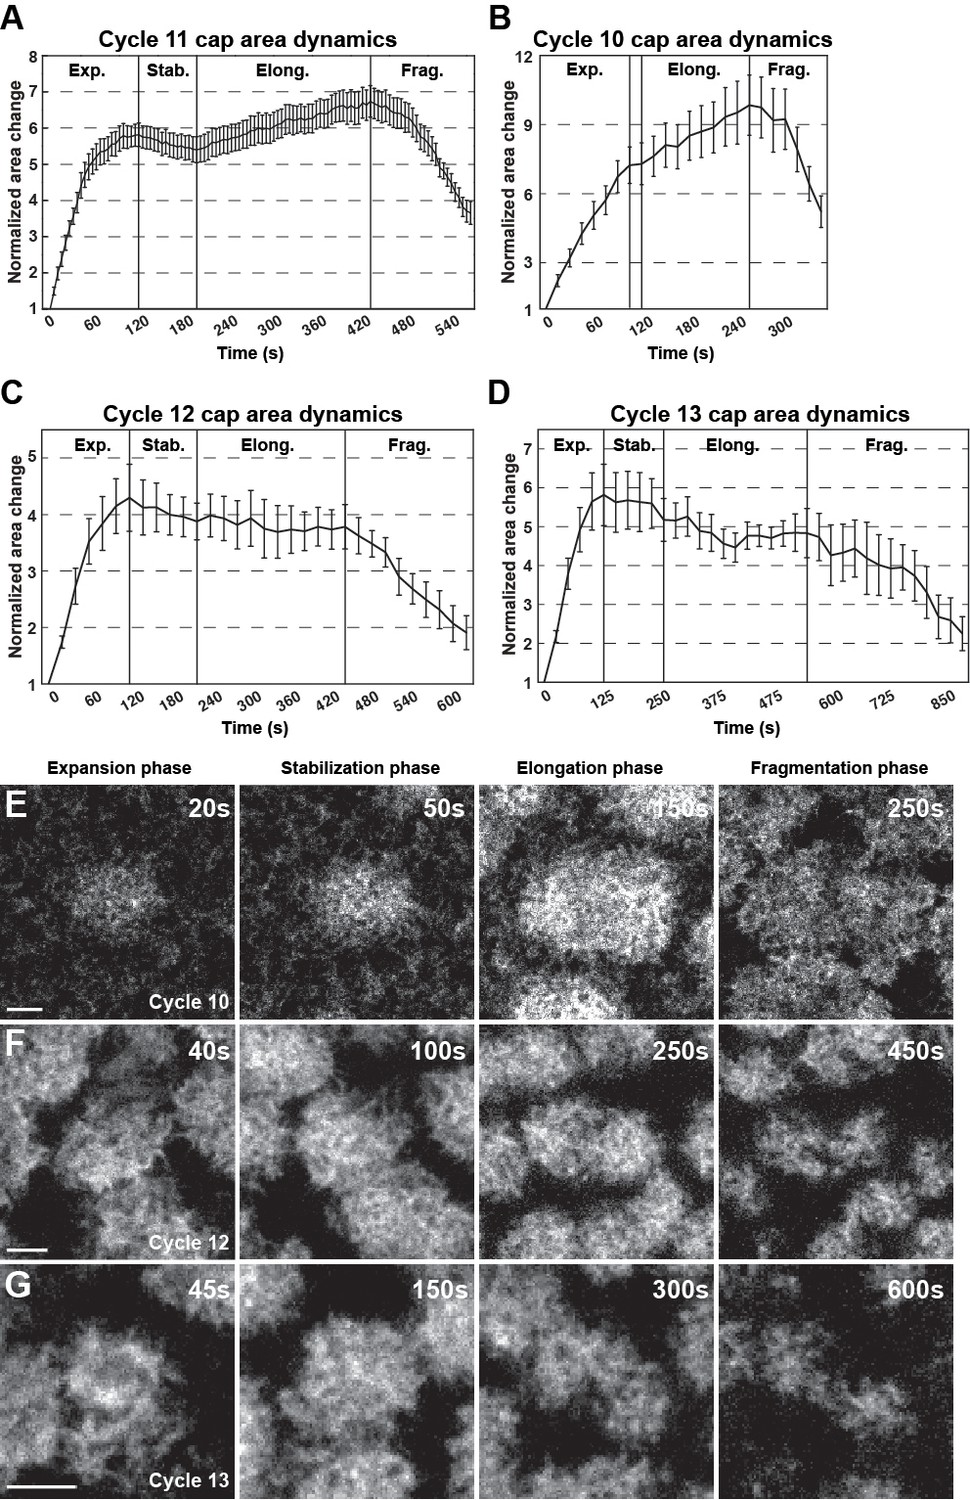
WT area dynamics of cortical actin caps in cycle 10–13.
(A) Cycle 11 actin cap area dynamics (n = 15, N = 4) as the standard for analysis. n = 15, N = 4. Cap areas are normalized to the size at t = 0 s. Four different phases are labeled (Exp.: Expansion; Stab.: Stabilization; Elong.: Elongation; and Frag.: Fragmentation phases). (B–D) Cycle 10, cycle 12, and cycle 13 actin cap area dynamics. Cycle 10: n = 6, N = 2, measured every 15 s; cycle 12: n = 6, N = 2, measured every 20 s; cycle 13: n = 6, N = 2, measured every 25 s. Cap areas are normalized to t = 0 s at each cycle. (E–G) Examples of cycle 10, cycle 12, and cycle 13 caps during Expansion, Stabilization, Elongation, and Fragmentation phases. Scale bar = 5 µm.
Figure 2 with 1 supplement
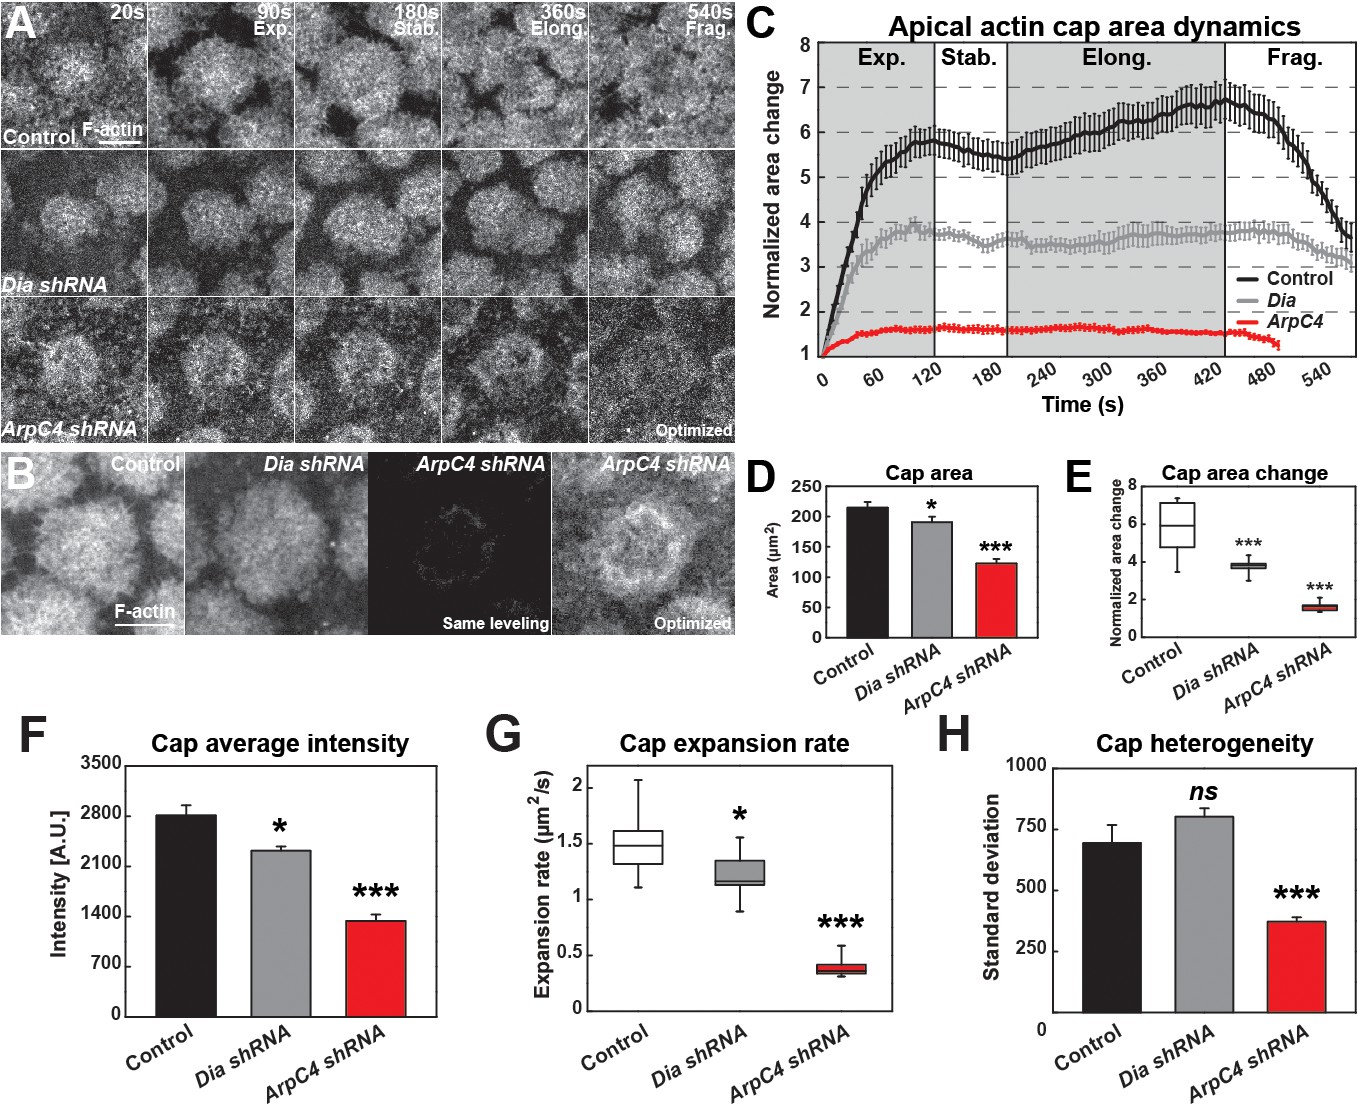
Quantitative dynamics of Formin and Arp2/3-driven actin networks.
(A) Still images from live-imaging of apical F-actin dynamics (UAS:moeABD:mCherry, cycle 11) from control, Dia shRNA and ArpC4 shRNA lines at t = 20, 90, 180, 360, 540 s. Four different phases are labeled (Exp.: Expansion; Stab.: Stabilization; Elong.: Elongation; and Frag.: Fragmentation phases). Scale bar = 5 μm. (B) Still images showing F-actin cap intensities by live-imaging (UAS:moeABD:mCherry, cycle 11) from control, Dia shRNA and ArpC4 shRNA lines at t = 120 s. First three panels are leveled and imaged equivalently, with the last panel optimized for visualization. Scale bar = 5 μm. (C) Actin cap area dynamics of control (black, n = 15, N = 4), Dia shRNA (grey, n = 10, N = 3) and ArpC4 shRNA (red, n = 11, N = 3) from cycle 11. Cap areas are normalized to the size at t = 0 s. (D) Actin cap area (μm2) of control (n = 15, N = 4), Dia shRNA (n = 10, N = 3), and ArpC4 shRNA (n = 11, N = 3) at t = 120 s in cycle 11. *: p<0.05, ***: p<0.0005. (E) Actin cap area change of control (n = 15, N = 4), Dia shRNA (n = 10, N = 3), and ArpC4 shRNA (n = 11, N = 3) from t = 120 s to t = 0 s in cycle 11. ***: p<0.0005. (F) Average intensity of apical cap structures of control (n = 12, N = 3), Dia shRNA (n = 10, N = 3), and ArpC4 shRNA (n = 11, N = 3) at t = 120 s in cycle 11. *: p<0.05, ***: p<0.0005. (G) Actin cap area expansion rate of control (n = 15, N = 4), Dia shRNA (n = 10, N = 3), and ArpC4 shRNA (n = 11, N = 3) from 0 to 120 s in cycle 11. *: p<0.05, ***: p<0.0005. (H) Actin cap heterogeneity (intensity standard deviation) of control (n = 15, N = 4), Dia shRNA (n = 10, N = 3), and ArpC4 shRNA (n = 11, N = 3) at t = 120 s in cycle 11. ns: not significant, ***: p<0.0005.
-
Figure 2—source data 1
Arp and Dia disrupted data.
- https://cdn.elifesciences.org/articles/63046/elife-63046-fig2-data1-v2.xlsx
Figure 2—figure supplement 1
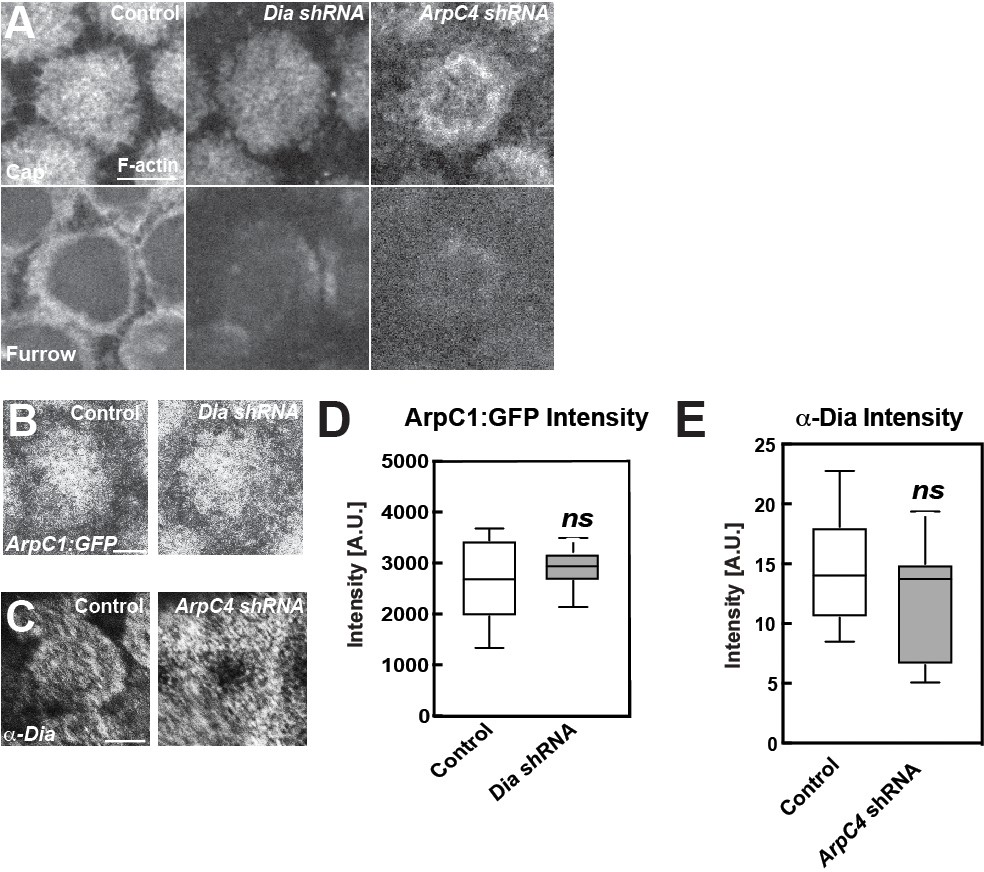
Apical and furrow-associated actin populations in Dia or Arp2/3 compromised embryos.
(A) Cycle 11 apical cap and furrow actin distributions in Control, Dia shRNA and ArpC4 shRNA embryos at t = 120 s. Scale bar = 5 μm. Cap (0.9 μm below apical most layer) and furrow level (3.9 μm below apical most layer). (B, C) ArpC1:GFP in Diaphanous shRNA (B) or anti-Diaphanous antibody staining in ArpC4 shRNA. (D, E) Mean intensity box-and-whisker plot of indicated signals. ns: not significant. n > 10 in group. Scale bar = 5 μm.
Figure 3 with 1 supplement
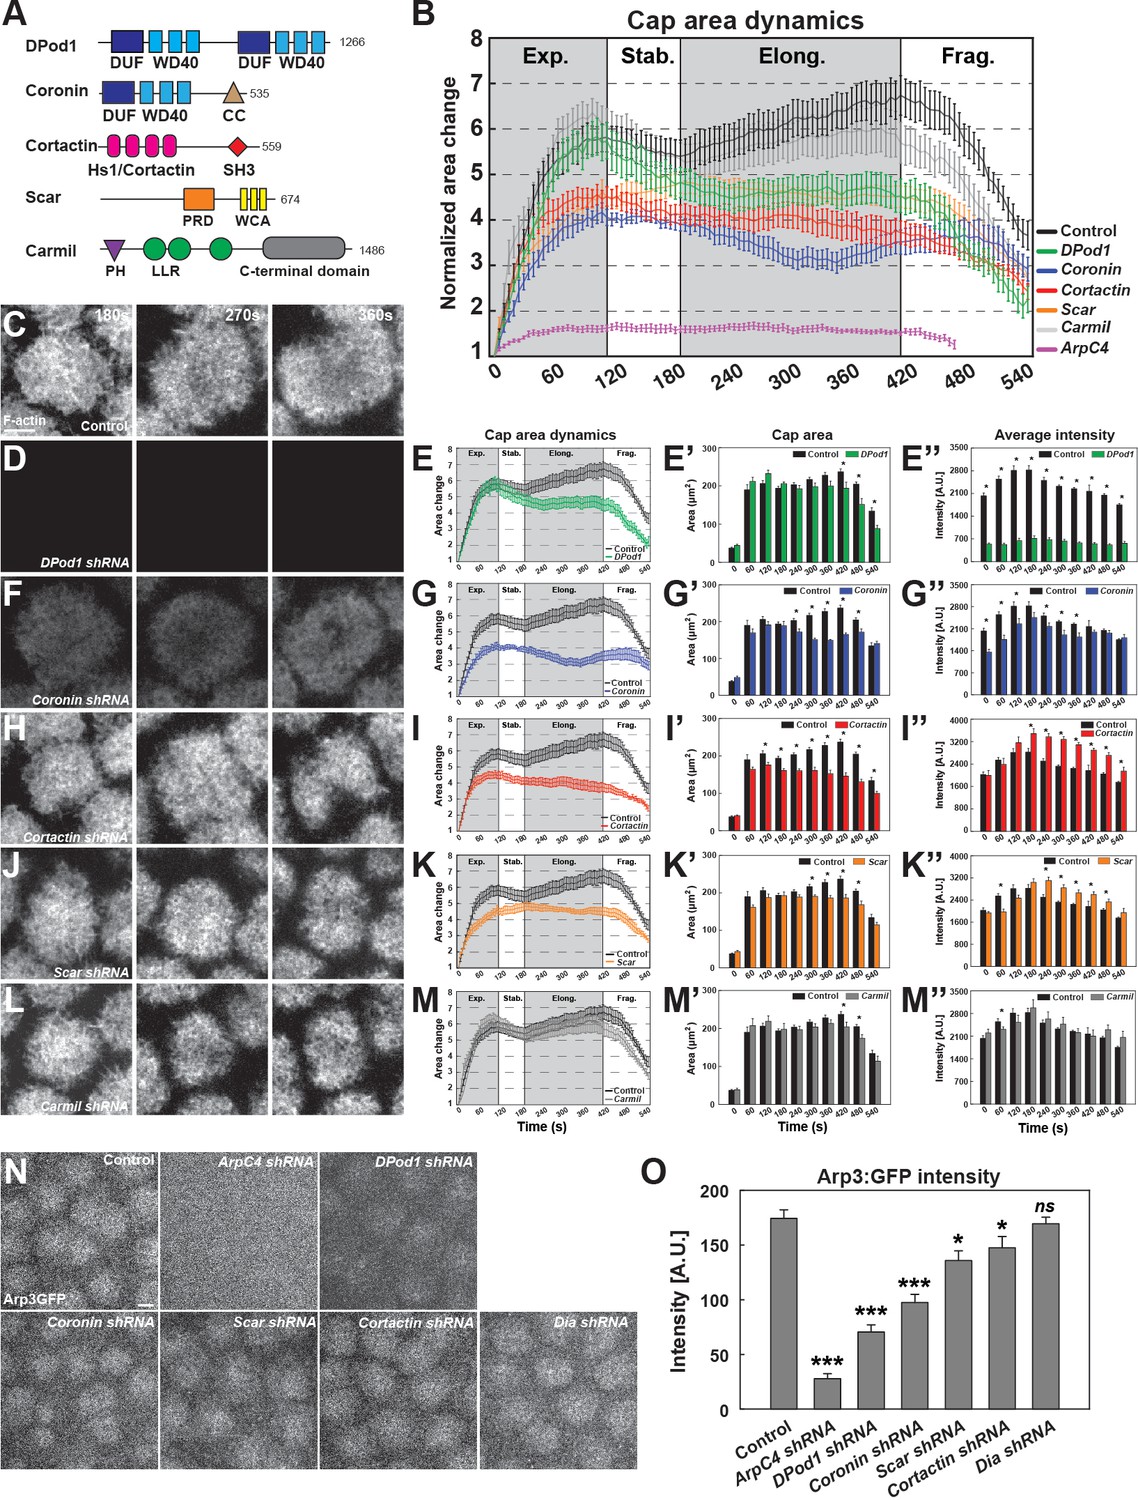
ANRPs have distinct roles in building cortical actin structures.
(A) Schematics of different ANRPs domain organization. Domains are collected from Flybase (Pfam/SMART) and UniProt. WD40: WD40 repeats; CC: coiled-coil domain; Hs1/Cortactin: Hs1/Cortactin repeats; SH3: SH3 domain; PRD: proline-rich domain; WCA: WH2/verprolin, cofilin, acidic domains; LRR: Leucine-rich repeats; PH: pleckstrin homology domain; LLR: Leucine-rich repeats; C-terminal: Carmil c-terminal domain; DUF: domains of unknown function. Domain size is not to scale. (B) Cycle 11 apical actin cap area dynamics in control, Arp2/3, and ANRP disrupted embryos: control (black, n = 15, N = 4), DPod1 shRNA (green, n = 11, N = 3), Coronin shRNA (blue, n = 9, N = 3), Cortactin shRNA (red, n = 12, N = 3), Scar shRNA (orange, n = 11, N = 3), Carmil shRNA (grey, n = 9, N = 3), and ArpC4 shRNA (magenta, n = 11, N = 3). Cap areas are normalized to the size at t = 0 s. (C, D, F, H, J, L) Still images from live-imaging of apical F-actin dynamics (UAS:moeABD:mCh, cycle 11) at t = 180, 270, 360 s, from control (C), DPod1 shRNA (D), Coronin shRNA (F), Cortactin shRNA (H), Scar shRNA (J), and Carmil shRNA (L) embryos. Images are identically leveled and imaged. Scale bar = 5 μm. (E, G, I, K, M) Apical actin cap area dynamics (cycle 11) in control (black, n = 15, N = 4), DPod1 shRNA (green, n = 11, N = 3), Coronin shRNA (blue, n = 9, N = 3), Cortactin shRNA (red, n = 12, N = 3), Scar shRNA (orange, n = 11, N = 3), Carmil shRNA (gray, n = 9, N = 3), and ArpC4 shRNA (magenta, n = 11, N = 3). Cap areas are normalized to the size at t = 0 s. (E’, G’, I’, K’, M’) Absolute actin cap areas (μm2) in control and ANRP-compromised embryos from cycle 11 at indicated time points. *: p<0.05. (E’’, G’’, I’’, K’’, M’’) Actin cap average intensity in control and ANRP-compromised embryos from cycle 11 at indicated time points. *: p<0.05. Bar graphs without * labeled in (E’–E’’, G’–G’’, I’–I’’, K’–K’’, M’–M’’) are not significant. (N) Still images of endogenous CRISPR Arp3:GFP behavior in control and actin regulator disrupted embryos at t = 120 s in cycle 11. Scale bar = 5 μm. (O) CRISPR Arp3:GFP intensity in control and different actin regulators functional disruption embryos at t = 120 s in cycle 11. control: n = 13, N = 3; ArpC4 shRNA: n = 18, N = 3; DPod1 shRNA: n = 34, N = 3; Coronin shRNA: n = 30, N = 3; Scar shRNA: n = 24, N = 3; Cortactin shRNA: n = 27, N = 3; Dia shRNA: n = 28, N = 3. ns: not significant, *: p<0.05, **: p<0.005; ***: p<0.0005.
-
Figure 3—source data 1
ANRP measurement data.
- https://cdn.elifesciences.org/articles/63046/elife-63046-fig3-data1-v2.xlsx
Figure 3—figure supplement 1
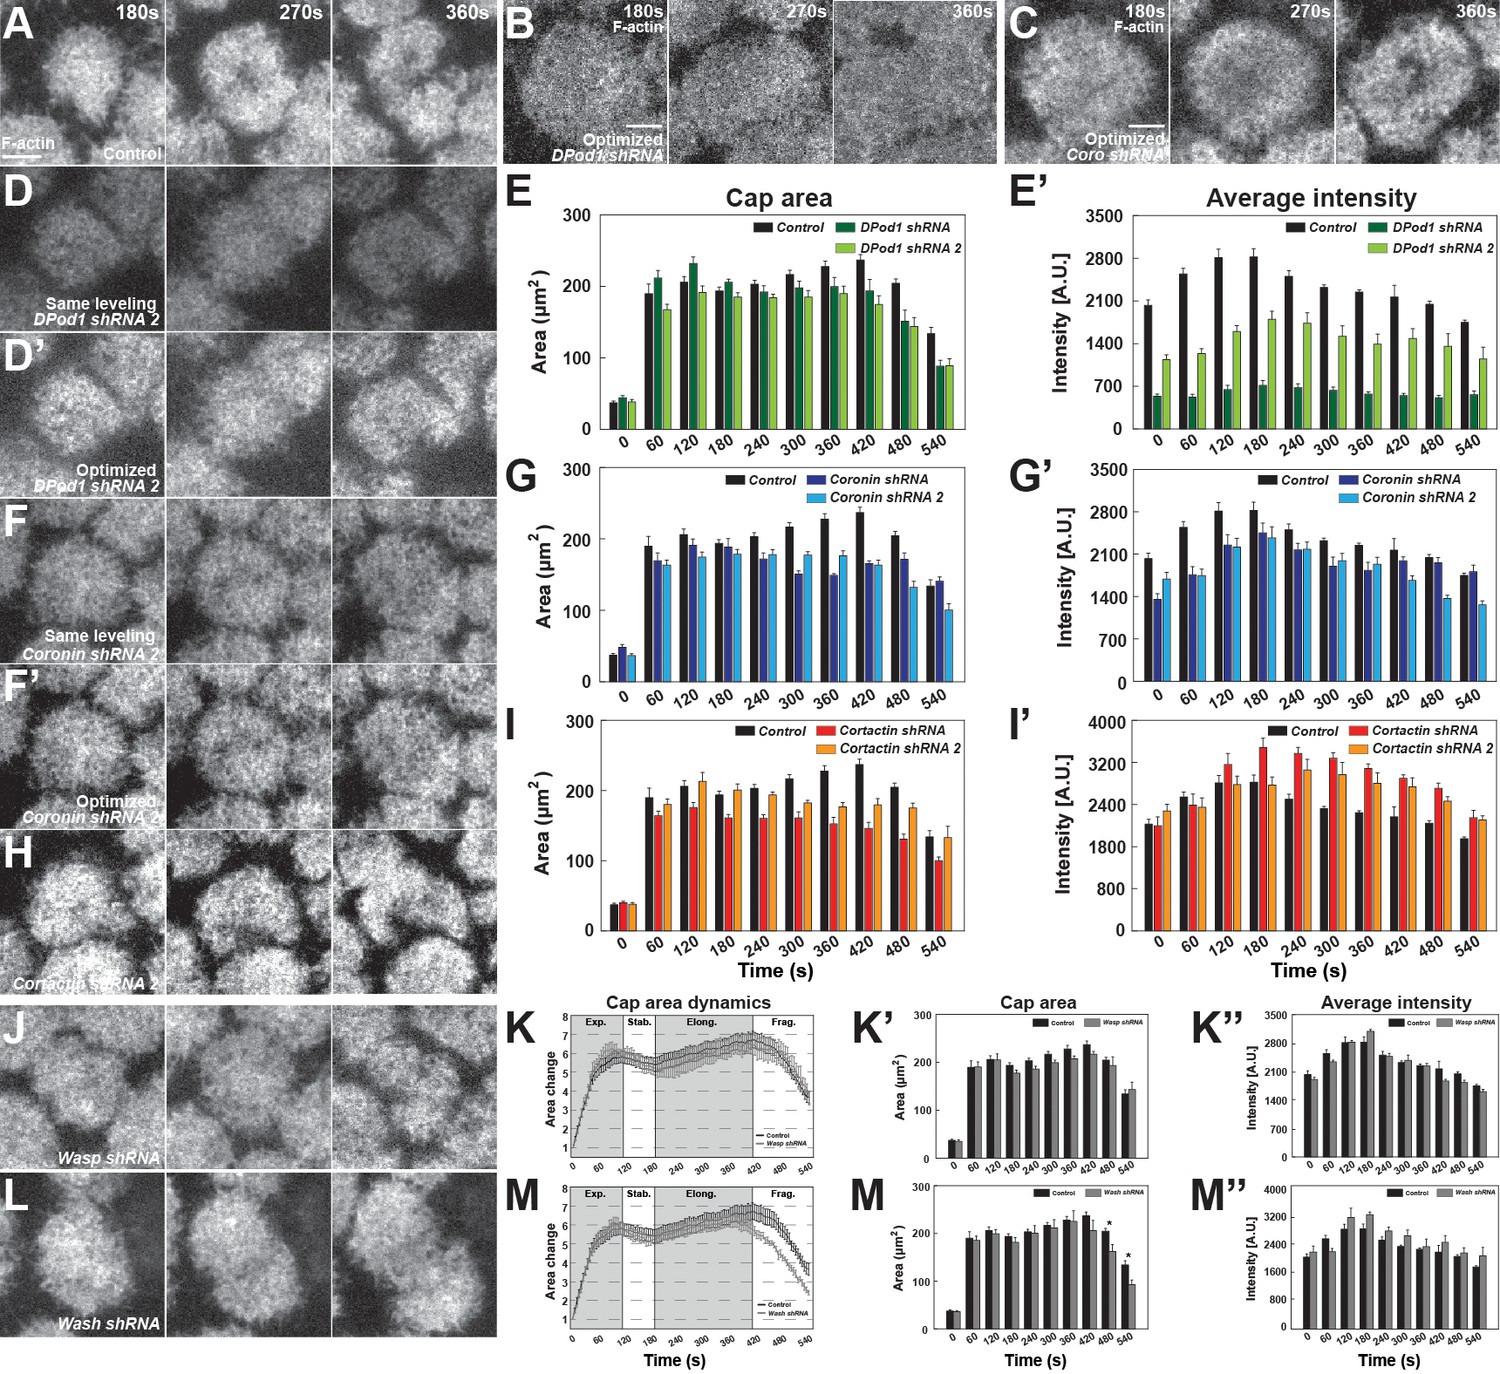
ANRPs have distinct roles in building apical actin structures.
(A, B, C, D, D’, F, F’, H) Still images from live-imaging of apical F-actin dynamics in cycle 11 at t = 180, 270, 360 s, from control (A), DPod1 shRNA (B), Coronin shRNA (C), DPod1 shRNA 2 (D–D’), Coronin shRNA 2 (F–F’), and Cortactin shRNA 2 (H). Images of (B) and (C) are the same images from Figure 3D and F but leveled optimally for visualization. Images of (D’) and (F’) are optimized leveled from (D) and (F). Other images are identically imaged and leveled as (A). Scale bar = 5 μm. (E, G, I) Absolute actin cap areas (μm2) of cycle 11 in control (black, n = 15, N = 4); DPod1 shRNA (dark green, n = 11, N = 3), DPod1 shRNA 2 (light green, n = 10, N = 3); Coronin shRNA (dark blue, n = 9, N = 3), Coronin shRNA 2 (light blue, n = 12, N = 3); Cortactin shRNA (red, n = 12, N = 3), Cortactin shRNA 2 (orange, n = 11, N = 3), respectively. (E’, G’, I’) Actin cap average intensity in control and ANRP- compromised embryos from cycle 11 at indicated time points: control (black, n = 15, N = 4); DPod1 shRNA (dark green, n = 11, N = 3), DPod1 shRNA 2 (light green, n = 10, N = 3); Coronin shRNA (dark blue, n = 9, N = 3), Coronin shRNA 2 (light blue, n = 12, N = 3); Cortactin shRNA (red, n = 12, N = 3), Cortactin shRNA 2 (orange, n = 11, N = 3). (J, L) Still images from live-imaging of apical F-actin dynamics in cycle 11 at t = 180, 270, 360 s from Wasp shRNA (J), and Wash shRNA (L). Images are identically leveled and imaged as (A). Scale bar = 5 μm. (K, M) Apical actin cap area dynamics (cycle 11) in control (black, n = 15, N = 4), Wasp shRNA (grey, n = 11, N = 3), and Wash shRNA (grey, n = 9, N = 3), respectively. Cap areas are normalized to the size at t = 0 s. (K’, M’) Absolute actin cap areas (μm2) in control, Wasp, and Wash-compromised embryos from cycle 11 at indicated time points. (K’’, M’’) Actin cap average intensity in control and ANRP-compromised embryos from cycle 11 at indicated time points. *: p<0.05. Bar graphs without * labeled in (K’–K’’, M’–M’’) are not significant.
Figure 4 with 1 supplement
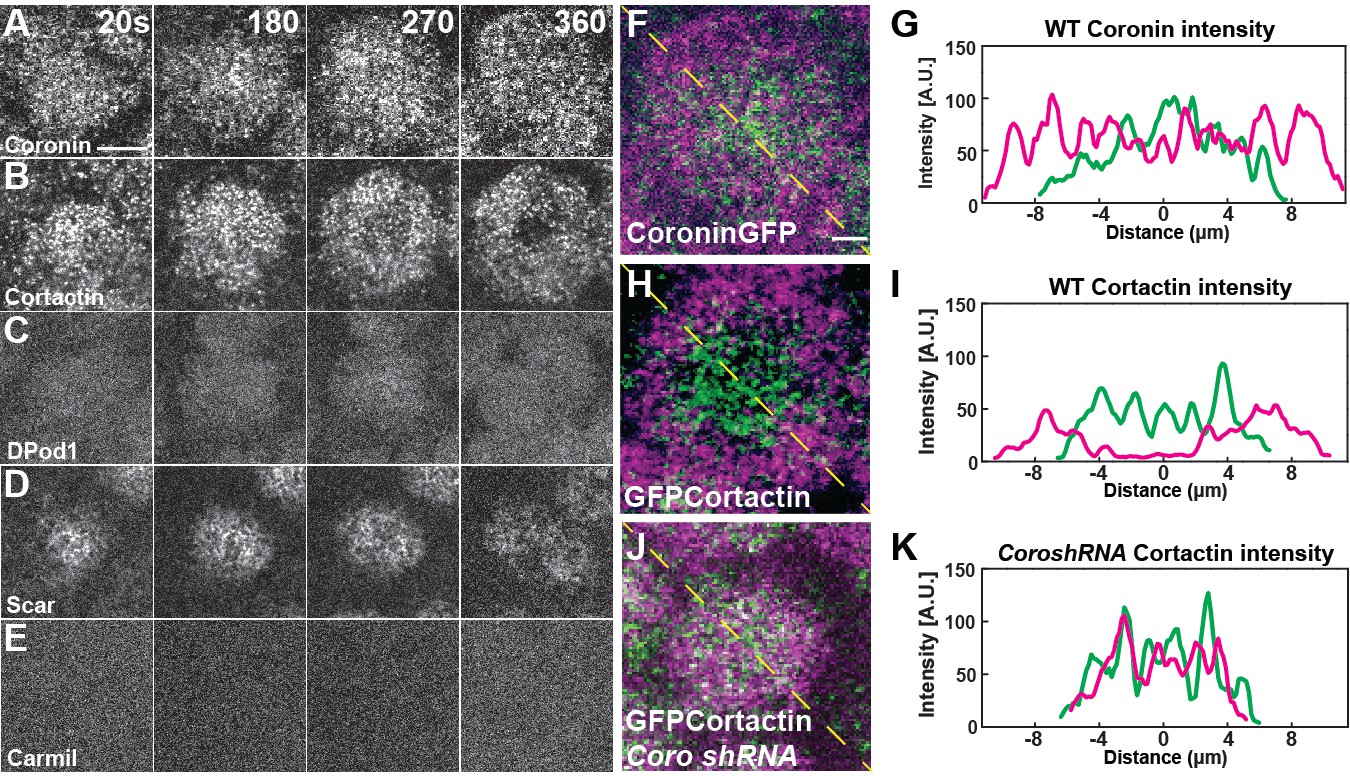
ANRP localization at apical actin caps.
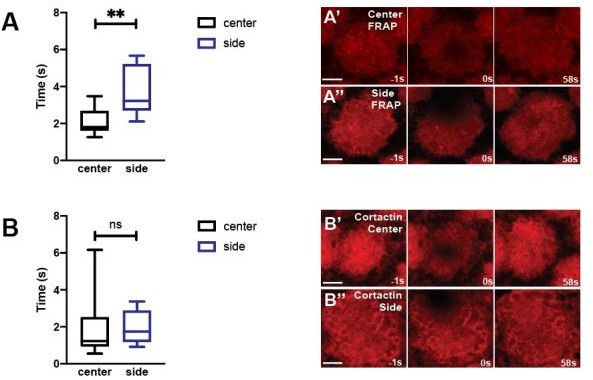
(A–E) Coronin (UAS:Coronin:GFP), Cortactin (UAS:GFP:Cortactin), DPod1 (UAS:DPod1:GFP), Scar (UAS:Scar:GFP), and Carmil (UAS:Carmil:GFP) localization on apical cap structures at t = 20, 180, 270, and 360 s. Additional Cortactin CRISPR and DPod1 CRISPR allele and anti-Coronin immunostaining data in Fig. Supplement 4-1. Scale bar = 5 μm. (F–H) Cortactin transitions to actin periphery through Coronin antagonism during cap growth. Overlapped images from t = 360 s (magenta) to t = 180 s (green) from live-imaging. Coronin (F) and Cortactin (H) images are derived from live-imaging of UAS:Coronin:GFP (F) and CRISPR GFP:Cortactin (Fig S6B), respectively. Scale bar = 2 μm. (J) CRISPR GFP:Cortactin t = 180 s (green) and 360 s (magenta) overlapped images in Coronin shRNA disrupted embryo. Scale bar = 2 μm. (G, I, K) Intensity profiles from (F), (H), and (J) yellow lines, respectively. Distance = 0 μm indicates the center of apical cap structures.
-
Figure 4—source data 1
RT PCR source data.
- https://cdn.elifesciences.org/articles/63046/elife-63046-fig4-data1-v2.xlsx
Figure 4—figure supplement 1
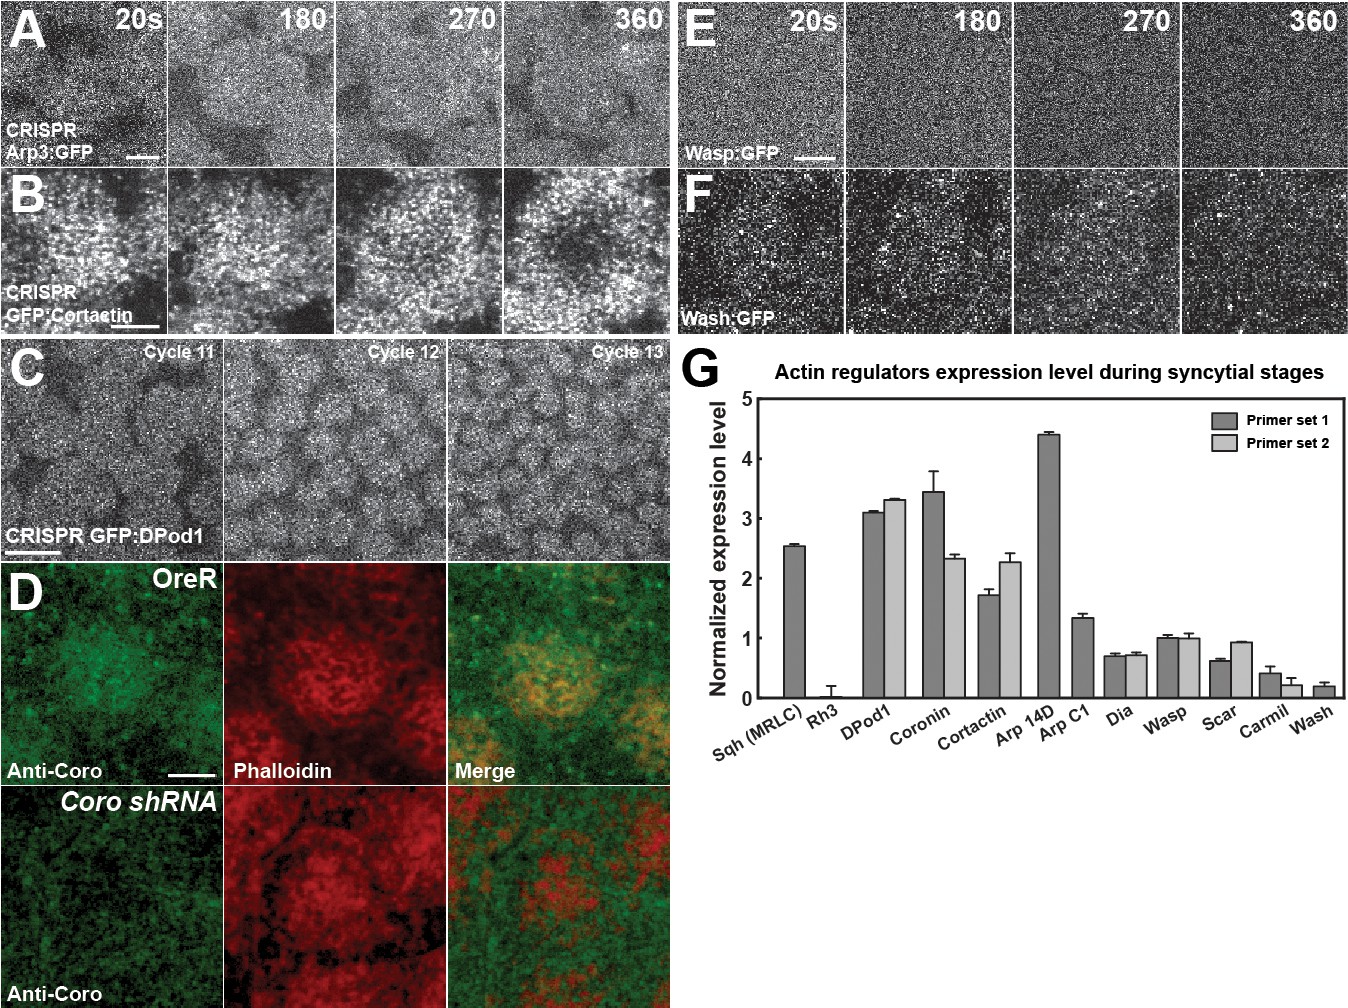
Expression levels and endogenous localization data of ANRPs.
(A, B) Still images from live-imaging of apical CRISPR Arp3:GFP (A) and CRISPR GFP:Cortactin (B) in cycle 11 at t = 20, 180, 270, 360 s. Scale bar = 3 μm. (C) Still images from live-imaging of apical CRISPR GFP:DPod1 in cycles 11–13. Scale bar = 10 μm. (D) Anti-Coronin (peptide antibody) staining of OreR (WT) and Coronin shRNA embryos in cycle 11 with phalloidin staining and merged channels. (E, F) Still images from live-imaging of apical Wasp:GFP (E) and Wash:GFP (F) in cycle 11 at t = 20, 180, 270, 360 s. Scale bar = 3 μm. (G) Actin regulators expression level during syncytial cycles by qPCR. Sqh (Myosin II regulatory light chain, MRLC) as positive control, and Rh3 (Rhodopsin 3) as negative control. The data are normalized to Wasp. DPod1, Coronin, Dia, Wasp, Scar, and Carml are tested by two independent sets of primers.
Figure 5 with 1 supplement
Arp2/3 and Formin network analysis suggests competition for free G-actin.
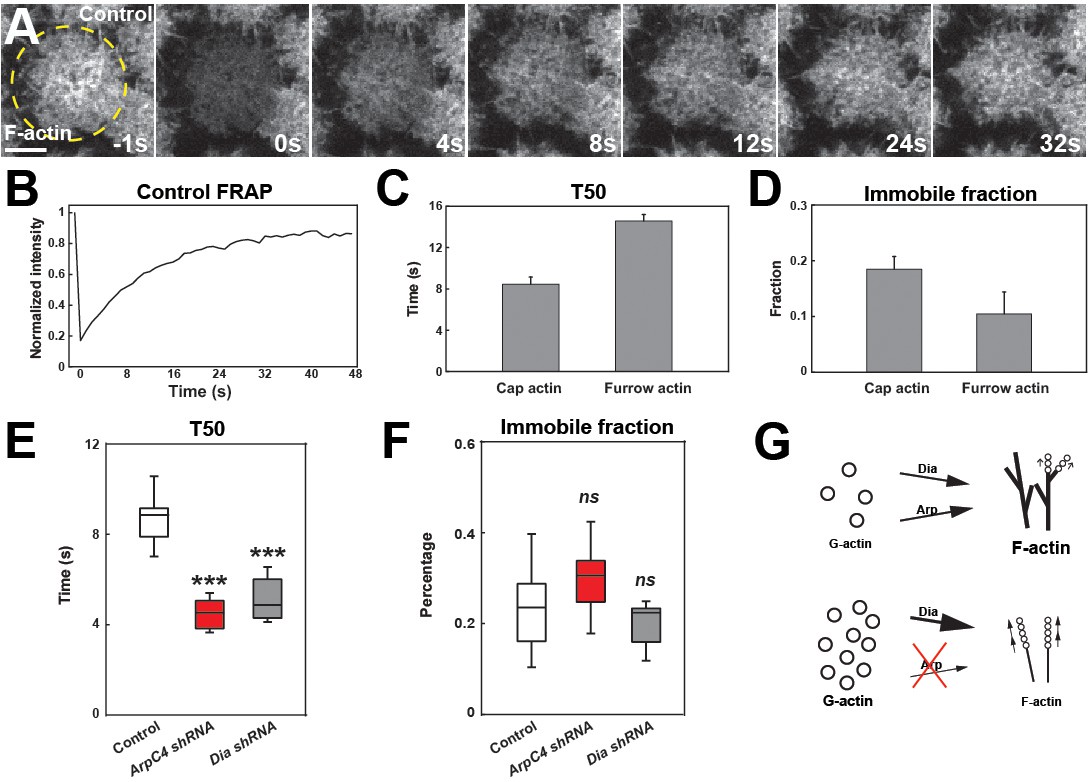
(A) Still images from FRAP recovery of F-actin live-imaging (UAS:moeABD:mCh) in cycle 11 embryos at t = −1s (1 s before photobleaching), 0 s (photobleaching), 4 s, 8 s, 12 s, 24 s, and 32 s. Scale bar = 5 μm. (B) FRAP recovery dynamics in control apical actin cap at cycle 11. Intensity is normalized to the value at t = −1s. (C, D) FRAP T50 and immobile fraction of F-actin at apical cap (n = 6) and furrow (n = 3) structures in cycle 11. (E, F) FRAP T50 and immobile fraction of F-actin at apical cap structures from control (n = 13), ArpC4 shRNA (n = 14), and Dia shRNA (n = 9) in cycle 11 embryos showing faster actin recovery rates in ArpC4 and Dia shRNA embryos. ns: not significant, ***: p<0.005. (G) Schematic of Arp2/3 and Dia competition for limited G-actin pool.
-
Figure 5—source data 1
FRAP actin network source data.
- https://cdn.elifesciences.org/articles/63046/elife-63046-fig5-data1-v2.xlsx
Figure 5—figure supplement 1

FRAP on Arp2/3 and ANRPs disrupted embryos.
(A, B) FRAP T50 and immobile fraction of F-actin in control and indicated actin regulator compromised embryos in cycle 11. ns: not significant, *: p<0.05, **: p<0.005, ***: p<0.0005. Control: n = 13; ArpC4 shRNA: n = 14; Dia shRNA: n = 9; DPod1 shRNA: n = 9; Cortactin shRNA: n = 8; Coronin shRNA: n = 8; Scar shRNA: n = 7 (C, D) FRAP T50 and immobile fraction of F-actin in control (n = 13), Latrunculin B (LatB) (n = 9), and Jasplakinolide (Jasp) injected embryos (n = 8), or performed in ArpC4 shRNA embryos (n = 9) and ArpC4 shRNA with Jasp injection (n = 8). (E) Individual FRAP representative examples in the indicated backgrounds. *: p<0.05, ***: p<0.0005.
Figure 6 with 1 supplement
In vivo nucleator recruitment strengths of actin regulatory proteins.
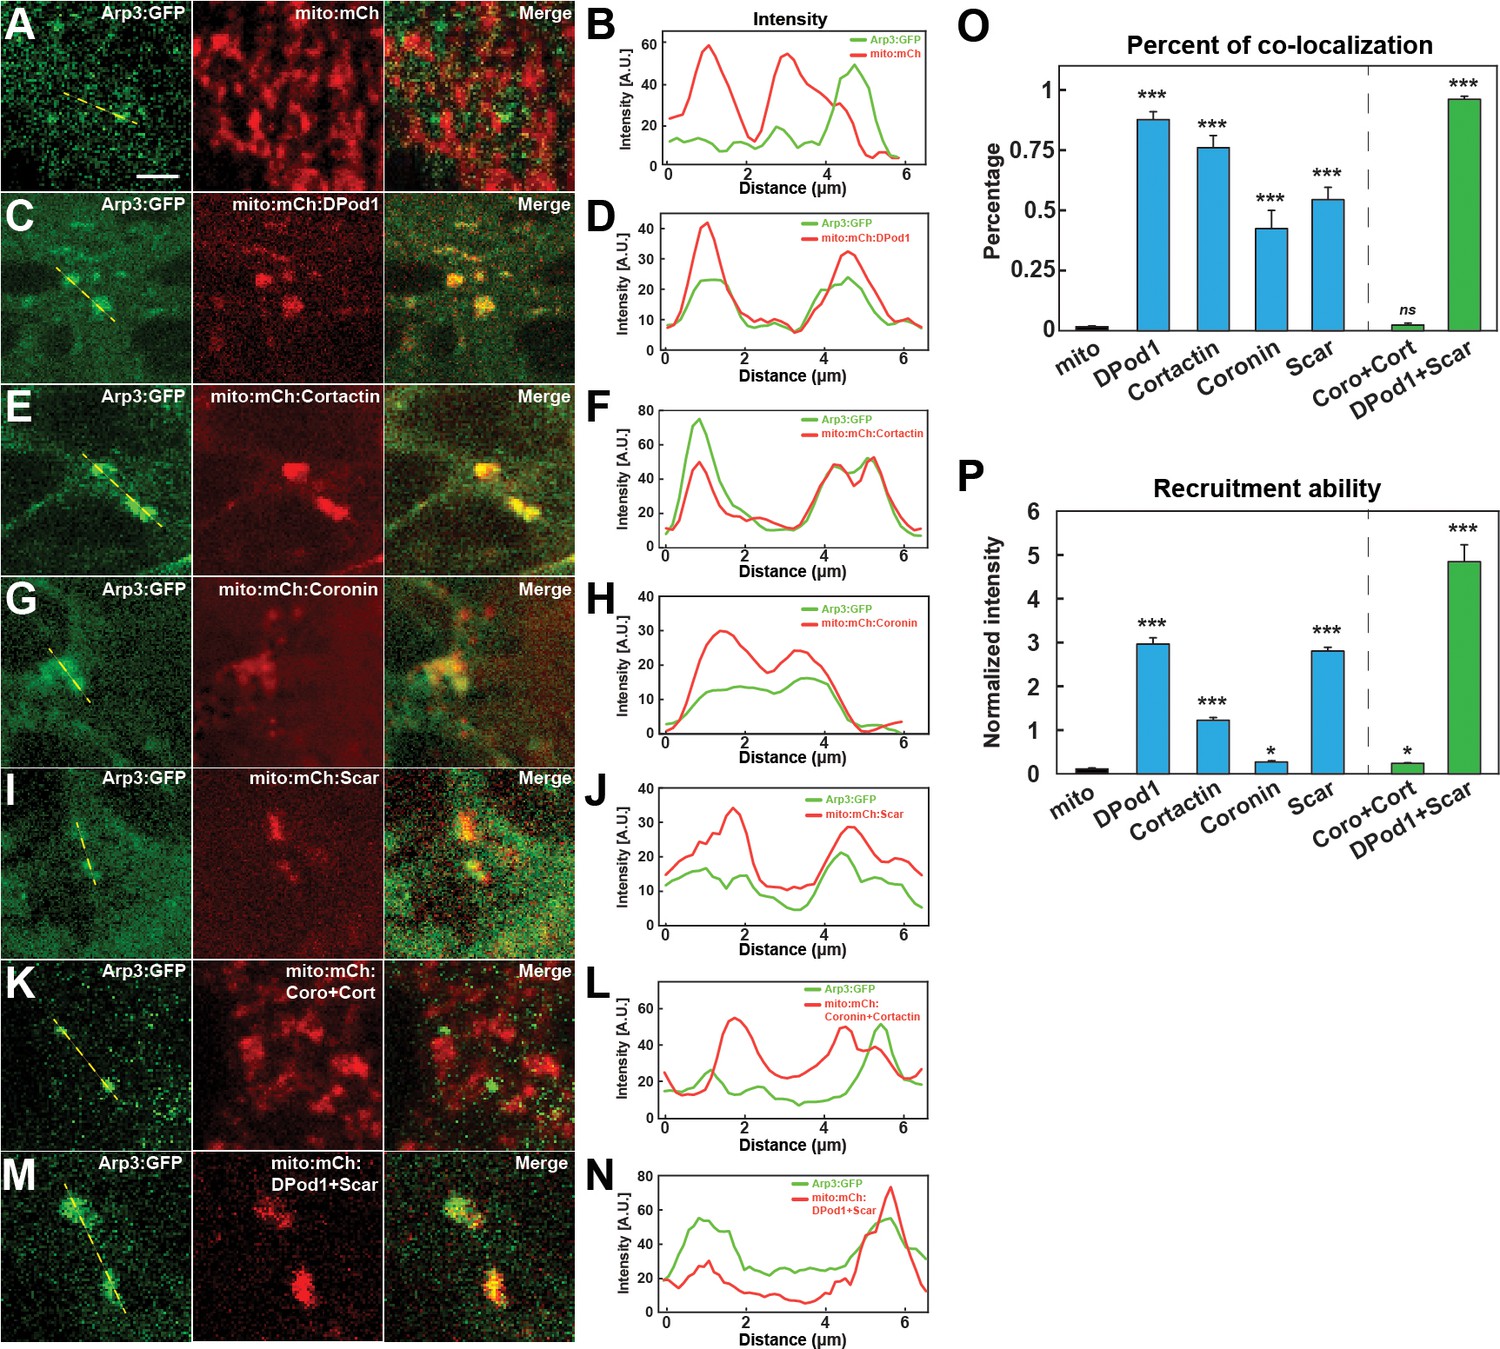
(A, C, E, G, I, K, M) Images of CRISPR Arp3:GFP with mito-tagged mCherry control (A) or mCherry:ANRPs (C, E, G, I, K, M) in cells at stage 12. Scale bar = 3 μm. (B, D, F, H, J, L, N) Intensity line plots of CRISPR Arp3:GFP and different mito-ANRP measured from yellow dashed lines in (A, C, E, G, I, K, M). (O) Percent of Arp3:GFP-positive compartments that colocalize with mito-ANRP puncta. Mito-control tag (no ANRP): n = 150; N = 4; DPod1: n = 338, N = 6; Cortactin: n = 198, N = 3; Coronin: n = 80, N = 4; Scar: n = 74, N = 6; Coro + Cort: n = 28, N = 4; DPod1 + Scar: n = 282, N = 4. Similar data trends were observed after calculation of Pearson correlation coefficients with Mito-control tag (no ANRP): r = −0.036 ± 0.025; DPod1: r = 0.625 ± 0.033; Cortactin: r = 0.492 ± 0.039; Coronin: r = 0.234 ± 0.028; Scar: r = 0.313 ± 0.024; Coro + Cort: r = 0.0231 ± 0.012; DPod1 + Scar: r = 0.551 ± 0.020. Reported Pearson values are (mean) ± (standard error of mean). (P) Arp3 recruitment ability (normalized GFP:mCherry intensity ratio in Arp3:GFP-positive mito-ANRP compartments) by mito-tagged DPod1, Cortactin, Coronin, and Scar. DPod1: n = 26, N = 3; Cortactin: n = 29, N = 3; Coronin: n = 27, N = 4; Scar: n = 40, N = 3; Coro + Cort: n = 25, N = 4; DPod1 +Scar: n = 46, N = 5.
-
Figure 6—source data 1
Mito-localization source data.
- https://cdn.elifesciences.org/articles/63046/elife-63046-fig6-data1-v2.xlsx
Figure 6—figure supplement 1
Mito-tagged ANRPs can direct F-actin polymerization.
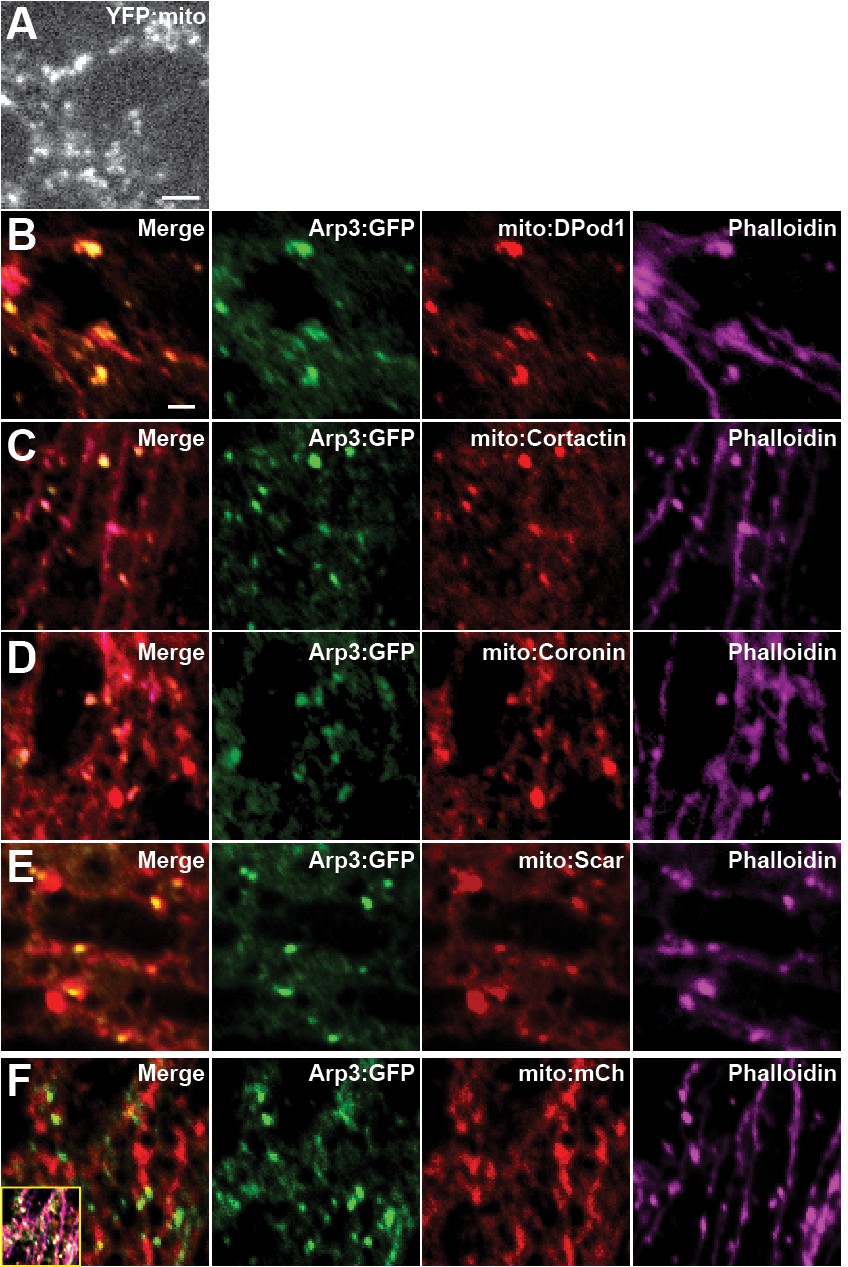
(A) Still images of mitochondrial morphology from YFP:mito in stage 12 embryo. Scale bar = 1 μm. (B–E) Staining images of CRISPR Arp3:GFP (anti-GFP) with mito-tagged mCherry:ANRPs (anti-dsRed) and F-actin (Phalloidin) in cells at stage 12. (F) Control staining images of CRISPR Arp3:GFP (anti-GFP) with mCherry-tagged mitochondrial marker (anti-dsRed) and F-actin (Phalloidin) in cells at stage 12. Main merge panel is two-way merge between Arp3:GFP and mito:mCh, inset is three-way merge between all channels. Scale bar = 1 μm.
Figure 7
Requirement for filamentous actin cap ANRP function in anchoring embryonic nuclei.
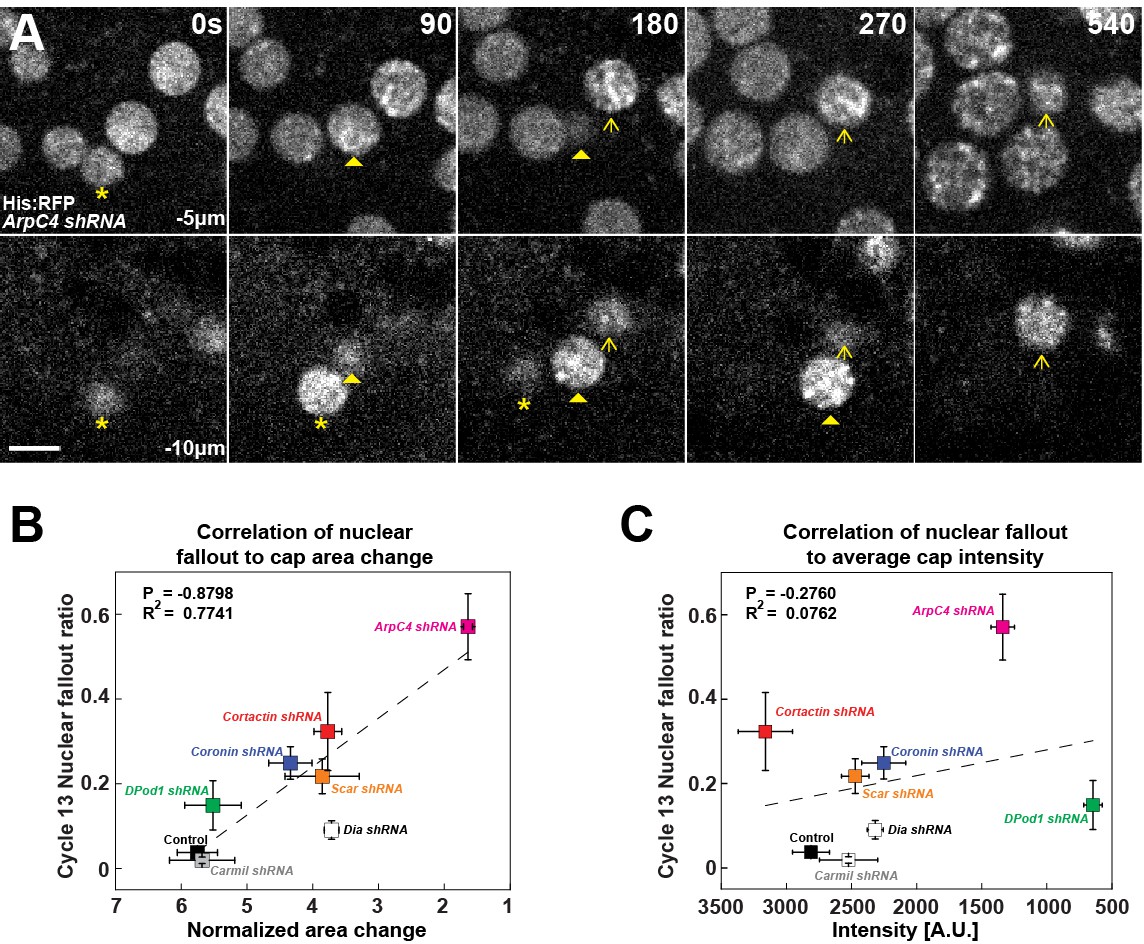
(A) Nuclei (marked by Histone:RFP) lose apical anchorage and fall into the embryonic interior in ArpC4 shRNA embryos during cycle 12 at t = 0 s, 90 s, 180 s, 270 s, and 540 s. Medial z-layer (−5 μm from apical most portion of embryo) indicates plane of normal nuclear positioning, and basal layer (−10 μm) images are shown. Asterisk, arrowhead, and arrow indicate individual falling-out nuclei. Scale bar = 5 μm. (B) Correlation of nuclear fallout rates to cap area expansion rates (t = 0–120 s) in indicated backgrounds (cycle 13 embryos). (C) Correlation of nuclear fallout rates to average actin cap intensities (t = 120 s) in indicated backgrounds (cycle 13 embryos). (B, C) Control (n > 12, N > 3), Dia shRNA (n = 10, N = 3), ArpC4 shRNA (n = 11, N = 3), DPod1 shRNA (n = 11, N = 3), Coronin shRNA (n = 9, N = 3), Cortactin shRNA (n = 12, N = 3), Scar shRNA (n = 11, N = 3), and Carmil shRNA (n = 9, N = 3). Dashed lines indicate linear regression fitting. P: Pearson’s correlation coefficient, R2: coefficient of determination.
-
Figure 7—source data 1
Nuclear fallout source data.
- https://cdn.elifesciences.org/articles/63046/elife-63046-fig7-data1-v2.xlsx
Author response image 1
Tables
Table 1
Arp2/3 and ANRPs toolkit.
| Construct | Vector | Chromosome |
|---|---|---|
| CRISPR Arp3:GFP | Endogeous | III |
| CRISPR GFP:Cortactin | Endogeous | III |
| CRISPR GFP:DPod1 | Endogeous | X |
| UAS:GFP:Cortactin | pUAST | X, II, III |
| UAS:Cortactin:GFP | pUAST,pUASp | X, II, III |
| UAS:mCherry:Cortactin | pUASp | II, III |
| UAS:DPod1:GFP | pUAST | X, II, III |
| UAS:Coronin:GFP | pUAST | II, III |
| UAS:GFP:Carmil FL | pUAST | X, II, III |
| UAS:Carmil FL:GFP | pUAST | X, II, III |
| UAS:Scar:GFP | pUASp | II, III |
| UAS:mito:mCherry:Cortactin | pUASp | II, III |
| UAS:mito:mCherry:Coronin | pUASp | X, II, III |
| UAS:mito:mCherry:DPod1 | pUASp | II, III |
| UAS:mito:mCherry:Scar | pUASp | II, III |
| UAS:mito:mCherry | pUASp | II, III |
Table 2
Stocks and genetics.
| Stocks | Source | Identifier |
|---|---|---|
| General stocks | ||
| P[mat-tub-Gal4] mat67 | D. St Johnston | |
| P[mat-tub-Gal4] mat15 | D. St Johnston | |
| UAS:mCherry:MoesinABD | T. Millard | |
| Histone:RFP | BDSC | BDSC 23650 III; BDSC 23651 II |
| UAS:GFP:Act88F | BDSC | BDSC #9253 |
| Wasp:sGFP | VDRC | VDRC #318474 |
| Wash:GFP | BDSC | BDSC #81644 |
| YFP:mito | BDSC | BDSC #7194 |
| UAS:mCh:mitoOMM | BDSC | BDSC #66532, 66533 |
| nos-Cas9 | Bestgene | NIG-FLY #CAS-0001, CAS-0003 |
| w1118 | Bestgene | |
| shRNA (Valium) lines | ||
| ArpC4 shRNA | DRSC/TRiP | BDSC #41888 |
| Dia shRNA | DRSC/TRiP | BDSC #35479 |
| DPod1 shRNA | DRSC/TRiP | BDSC #41705 |
| Coronin shRNA | DRSC/TRiP | BDSC #40841 |
| Cortactin shRNA | DRSC/TRiP | BDSC #44425 |
| Carmil shRNA | DRSC/TRiP | BDSC #41686 |
| Scar shRNA | DRSC/TRiP | BDSC #51803 |
| Wasp shRNA | DRSC/TRiP | BDSC #51802 |
| Wash shRNA | DRSC/TRiP | BDSC #62866 |
| Cofilin shRNA | DRSC/TRiP | BDSC #33670 |
| DPod1 shRNA 2 | VDRC/KK | VDRC #108886 |
| Coronin shRNA 2 | VDRC/KK | VDRC #109644 |
| Cortactin shRNA 2 | VDRC/KK | VDRC #105289 |
Table 3
Reagents.
| Reagent | Source | Identifier |
|---|---|---|
| Antibodies and dyes | ||
| Rabbit anti-GFP | Invitrogen | A11122 |
| Mouse anti-dsRed | Clontech | 632393 |
| Alexa Fluor Goat anti rabbit 488 | Invitrogen | A11034 |
| Alexa Fluor Goat anti mouse 568 | Invitrogen | A11031 |
| Alexa 568-Phalloidin | Invitrogen | Cat# A12380 |
| Alexa 647-Phalloidin | Invitrogen | Cat# A22287 |
| Rabbit anti-Dia | Wasserman lab | |
| Chemicals and kits | ||
| Halocarbon oil 27 | Cat# H8773 | |
| Halocarbon oil 700 | Cat# H8898 | |
| Paraformaldehyde | Electron Microscopy Sciences | Cat# 15714 |
| ProLong Gold | Invitrogen | Cat# P36931 |
| Jasplakinolide | Santa Cruz Biotech | Cat# sc202191 |
| Latrunculin B | Sigma | Cat# L5288 |
| QIAShredder | QIAGEN | Cat# 79654 |
| Quick-RNA MicroPrep | Zymo Research | Cat# R1050 |
| QuantiTech Reverse Transcription Kit | QIAGEN | Cat# 205310 |
| QuantiTech SYBR Green RT-PCR | QIAGEN | Cat# 204141 |
| Q5 site-directed mutagenesis EZNA insect DNA kit | NEB Omega Biotek | Cat# E0554S Cat# D0926-01 |
| Software | ||
| iQ5 | Bio-Rad | bio-rad.com |
| FIJI/ImageJ | Schindelin et al., 2012 | Fiji.sc |
| Micromanager 1.4 | Edelstein et al., 2014 | micro-manager.org |
| OriginPro | OriginLab | originlab.com |
| Photoshop | Adobe | adobe.com |
| Illustrator | Adobe | adobe.com |
| Peptides and oligonucleotides | ||
| Coronin peptide for antibody | GenScript | CLPAKKAGNILNKPR |
| TOM70-HA | S. Munro lab | |
| qPCR primers | ||
| Sqh(MRLC) | QuantiTect | Cat# QT00499065 |
| Rh3 | QuantiTect | Cat# QT00978481 |
| DPod1 set1 | QuantiTect | Cat# QT00499464 |
| DPod1 set2 | Eurofins | 5′-TCCTCACCAAGAACCACTGC |
| Eurofins | 5′-GTGGGTGGGAACAGATCGTC | |
| Coronin set1 | QuantiTect | Cat# QT00940737 |
| Coronin set2 | Eurofins | 5′-ACAGGCTTCAACCGTAGCTC |
| Eurofins | 5′-GAACATTACGCCGTTGGACG | |
| Cortactin set1 | QuantiTect | Cat# QT00979020 |
| Cortactin set2 | Eurofins | 5′-TTCGGAGTGCAAGAGGATCG |
| Eurofins | 5′-GCACTCCAAATTTGCCTCCG | |
| Arp14D | QuantiTect | Cat# QT00923419 |
| ArpC1(sop2) | QuantiTect | Cat# QT00936222 |
| Dia set1 | QuantiTect | Cat# QT00939477 |
| Dia set2 | Eurofins | 5′-CAAATCGAAGGAGGAGCGACA |
| Eurofins | 5′-CCCATTCTGCAGGTATTCCAC | |
| Wasp set1 | QuantiTect | Cat# QT00984641 |
| Wasp set2 | Eurofins | 5′-ATGGCATGGAGGTGGTCAAG |
| Eurofins | 5′-TTACGCGTCTCTATGGTGGC | |
| Scar set1 | QuantiTect | Cat# QT00934584 |
| Scar set2 | Eurofins | 5′-ACGATCCATAGAACCCGTGC |
| Eurofins | 5′-GGCGAATGATGTTCGTCAGC | |
| Carmil set1 | Eurofins | 5′-CCACTGGTGGGTCGTAAGTC |
| Eurofins | 5′-GGCATAGACGTCTCCTCAGC | |
| Carmil set2 | Eurofins | 5′-GCTGAGGAGACGTCTATGCC |
| Eurofins | 5′-ATAACACTACCCTCGCCTGC | |
| Wash | Eurofins | 5′-GCGTAGGAAGAGTGTGGGAC |
| Eurofins | 5′-GTGATGGAATTGCGCTCGTC | |
| Guide RNAs for CRISPR | ||
| Arp3:GFP | ||
| chiRNA1 | Eurofins | 5′-CTTCGCTATCAGGTGTGTCACACGA |
| Eurofins | 5′-AAACTCGTGTGACACACCTGATAGC | |
| chiRNA2 | Eurofins | 5′-CTTCGCCAGTTCAACCCCCTATCTA |
| Eurofins | 5′-AAACTAGATAGGGGGTTGAACTGGC | |
| GFP:Cortactin | ||
| chiRNA1 | Eurofins | 5′-CTTCGGGGCCGACAAAGCCGGATC |
| Eurofins | 5′-AAACGATCCGGCTTTGTCGGCCCC | |
| chiRNA2 | Eurofins | 5′-CTTCGGTGGCCTGAATCTGGTGAC |
| Eurofins | 5′-AAACGTCACCAGATTCAGGCCACC | |
| GFP:DPod1 | ||
| chiRNA1 | Eurofins | 5′-CTTCGAGCGACTGAGAGGGAGCCAC |
| Eurofins | 5′-AAACGTGGCTCCCTCTCAGTCGCTC | |
| chiRNA2 | Eurofins | 5′-CTTCGCGATGTTGTTACCGTACGTC |
| Eurofins | 5′-AAACGACGTACGGTAACAACATCGC | |
| DPod1 mutated PAM sites in homologous constructs | This study | 5′-CCACCGGACTAGTGACACTCGAC 5′-GCAGCGCACAACTGACACTCGAC |
| This study | 5′-GTGGGCAGCTACCAGACGTACGG 5′-GTGGGCAGTTATCAAACCTATGG | |
Additional files
Download links
A two-part list of links to download the article, or parts of the article, in various formats.
Downloads (link to download the article as PDF)
Open citations (links to open the citations from this article in various online reference manager services)
Cite this article (links to download the citations from this article in formats compatible with various reference manager tools)
Combinatorial deployment of F-actin regulators to build complex 3D actin structures in vivo
eLife 10:e63046.
https://doi.org/10.7554/eLife.63046


