Subcellular sequencing of single neurons reveals the dendritic transcriptome of GABAergic interneurons
- Max Planck Institute for Brain Research, Germany
- Department of Biochemistry and Molecular Biology, Veterinary School, Complutense University of Madrid, Spain
- Department of Behavior and Brain Organization, Center of Advanced European Studies and Research, Germany
Figures
Figure 1 with 3 supplements
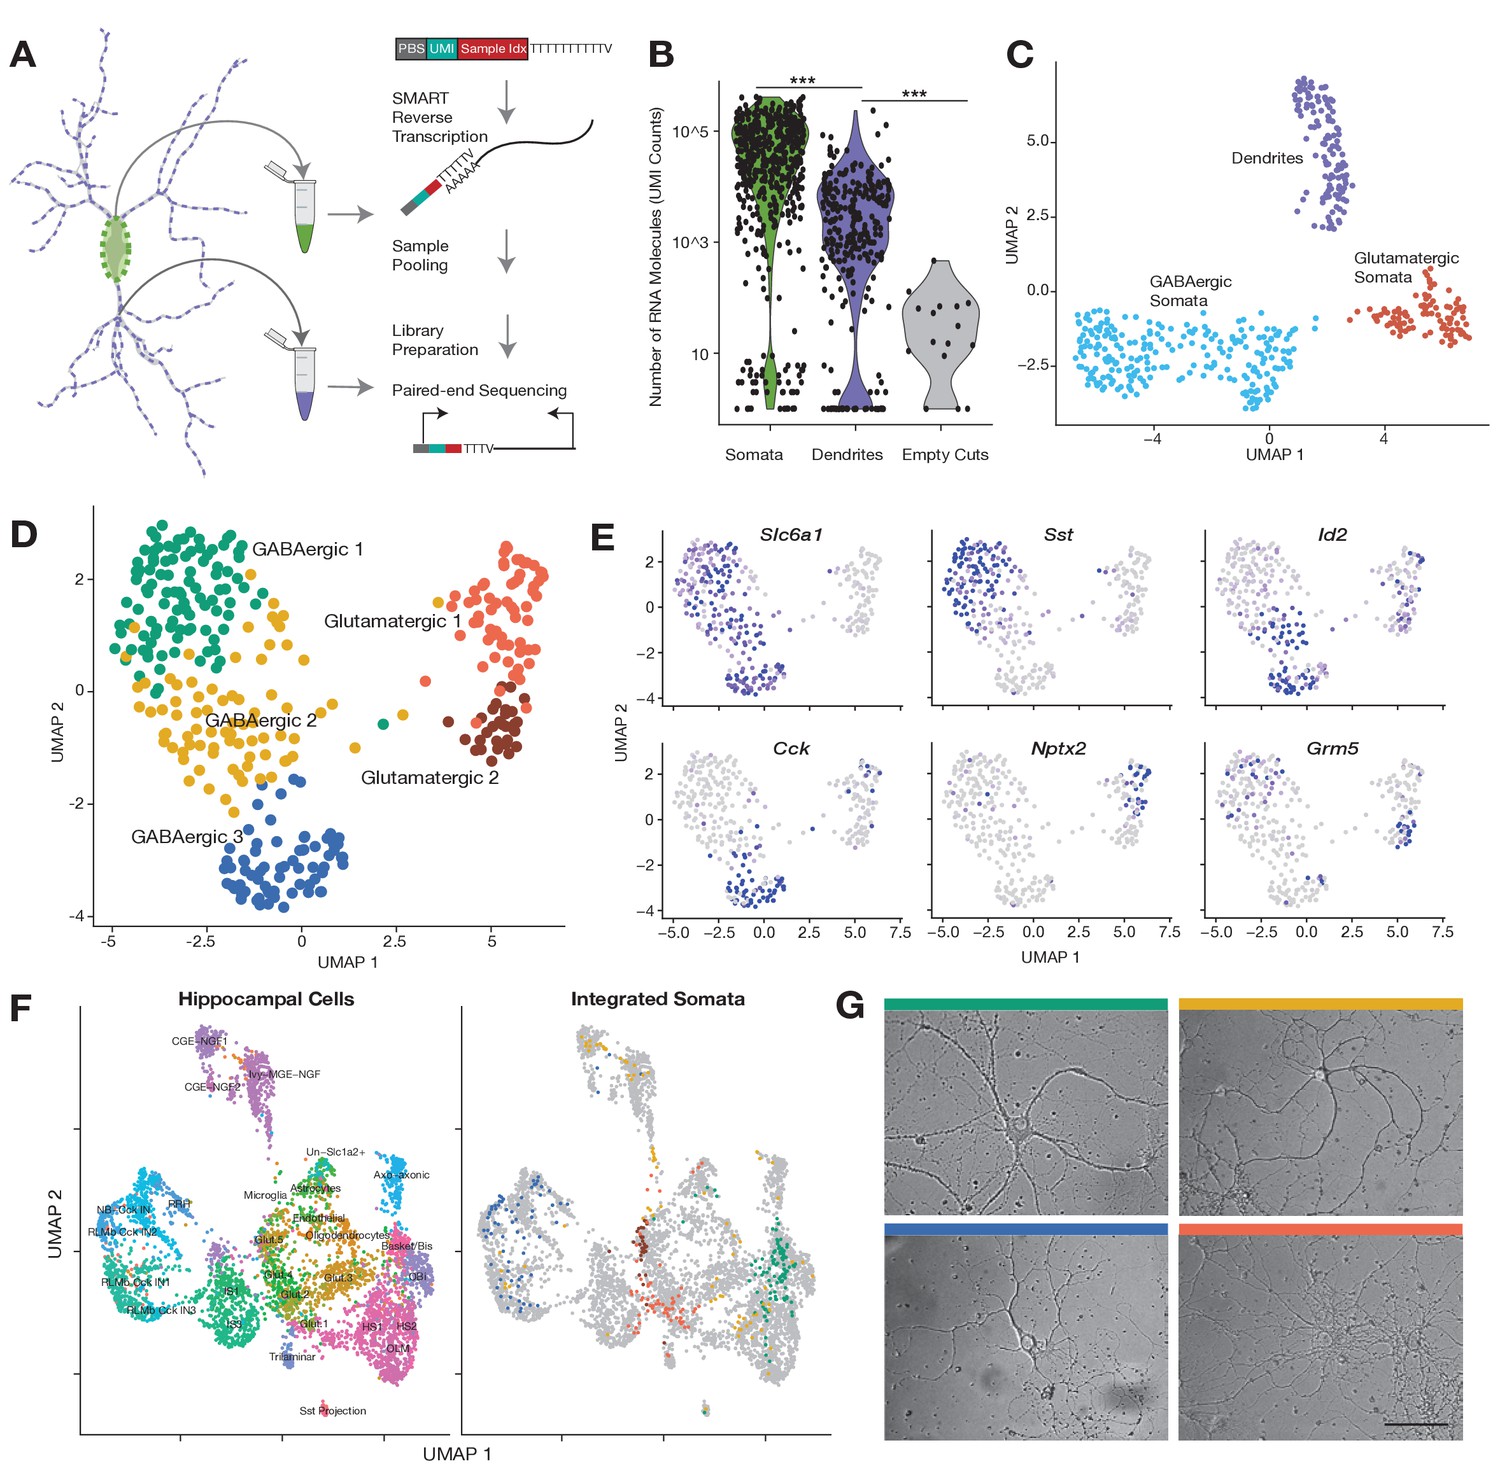
Subcellular single cell RNA-seq (scRNA-seq), compartment-specific transcriptomic signatures, and identification of cell types based on the somatic transcriptome.
(A) Experimental workflow: After fixation, the soma and dendritic arbor of individual cultured hippocampal neurons were acquired separately by laser capture microdissection. After membrane lysis, mRNAs from a single soma or dendritic arbor were reverse transcribed using a primer containing a PCR primer binding site (PBS), unique molecular identifier (UMI), and a sample index. A template switch reaction added a complementary PBS at the mRNA 5’ end. Samples were then pooled, amplified, and prepared for paired-end sequencing. See also Materials and methods and Figure 1—figure supplement 1D for a description of the sequencing data analysis. (B) Number of RNA molecules (UMI counts) detected in different sample groups. (C) Uniform manifold approximation and projection (UMAP) plot of somatic and dendritic samples, colored by cluster identity. (D) UMAP plot of somata samples, colored by cluster identity, revealed two glutamatergic types and three GABAergic cell types. (E) Normalized expression of marker genes projected onto UMAP plot in D. (F) Seurat integration was used to find cell type correspondence between hippocampal tissue single neurons (from two separate studies Zeisel et al., 2015 and Harris et al., 2018) and single somata acquired in this study. Left panel shows the cluster organization of hippocampal tissue cells only, and right panel shows the integration of single somata from this study (color indicates cell type as established in D) with hippocampal tissue cells (gray). For left panel: Basket/Bis: Basket and bistratified cells, CGE-NGF: Caudal ganglionic eminence neurogliaform, Glut: Glutamatergic, HS: Hippocampo-septal interneuron, IS: Interneuron-selective interneuron, Ivy-MGE-NGF: Ivy medial ganglionic eminence neurogliaform, NB: Cck+ non-border interneuron, OBi: Oriens-bistratified neurons, OLM: Oriens-lacunosum-moleculare, Sst+ projection neurons, RLMb: Cck+ Radiatum-lacunosum moleculare border interneuron, RRH: Radiatum-Retrohippocampal neurons. (G) Images of representative cells (that were subsequently harvested using laser capture) exhibiting morphology most commonly observed among identified cell types. Color of bar over image indicates cell type as indicated in D. Scale bar = 75 µm.
Figure 1—figure supplement 1

Subcellular single cell RNA-seq (scRNA-seq), genes detected, and compartment-specific transcriptomic signatures.
(A) Accuracy of the method is shown by comparing the number of input molecules and average number of detected molecules (unique molecular identifier [UMI] counts) for each ERCC RNA standard. R indicates Pearson correlation. (B) Sensitivity of the method is shown by comparing the number of input molecules for each ERCC and their detection probability (fraction of samples in which the ERCC is detected). Red line shows the mean relation using a fractional logistic regression model. Confidence bands correspond to 95% = confidence interval. Calculation of detection limit is shown by blue dashed lines indicating the point in which the relation reaches 50% detection rate when the RNA species contains four molecules, suggesting one in four molecules present are detected. (C) Images showing the dissection of a neuron’s soma and dendrites using laser capture microdissection (LCM). Scale bar = 50 µm. (D) Analysis pipeline of subcellular scRNA-seq data. (E) Relationship between molecules counted and genes detected in each sample group shows that detection of genes in somata began to saturate after approximately 100,000 molecules were detected. Saturation was not approached in dendritic samples, likely due to insufficient detection of molecules. Red dashed lines show the gene detection cutoffs used to remove low-content samples. (F) Uniform manifold approximation and projection (UMAP) clustering of all samples sequenced, colored according to the main groups identified. (G) Expression of glial markers among sequenced samples.
Figure 1—figure supplement 2
Compartment-specific transcriptomic signatures.
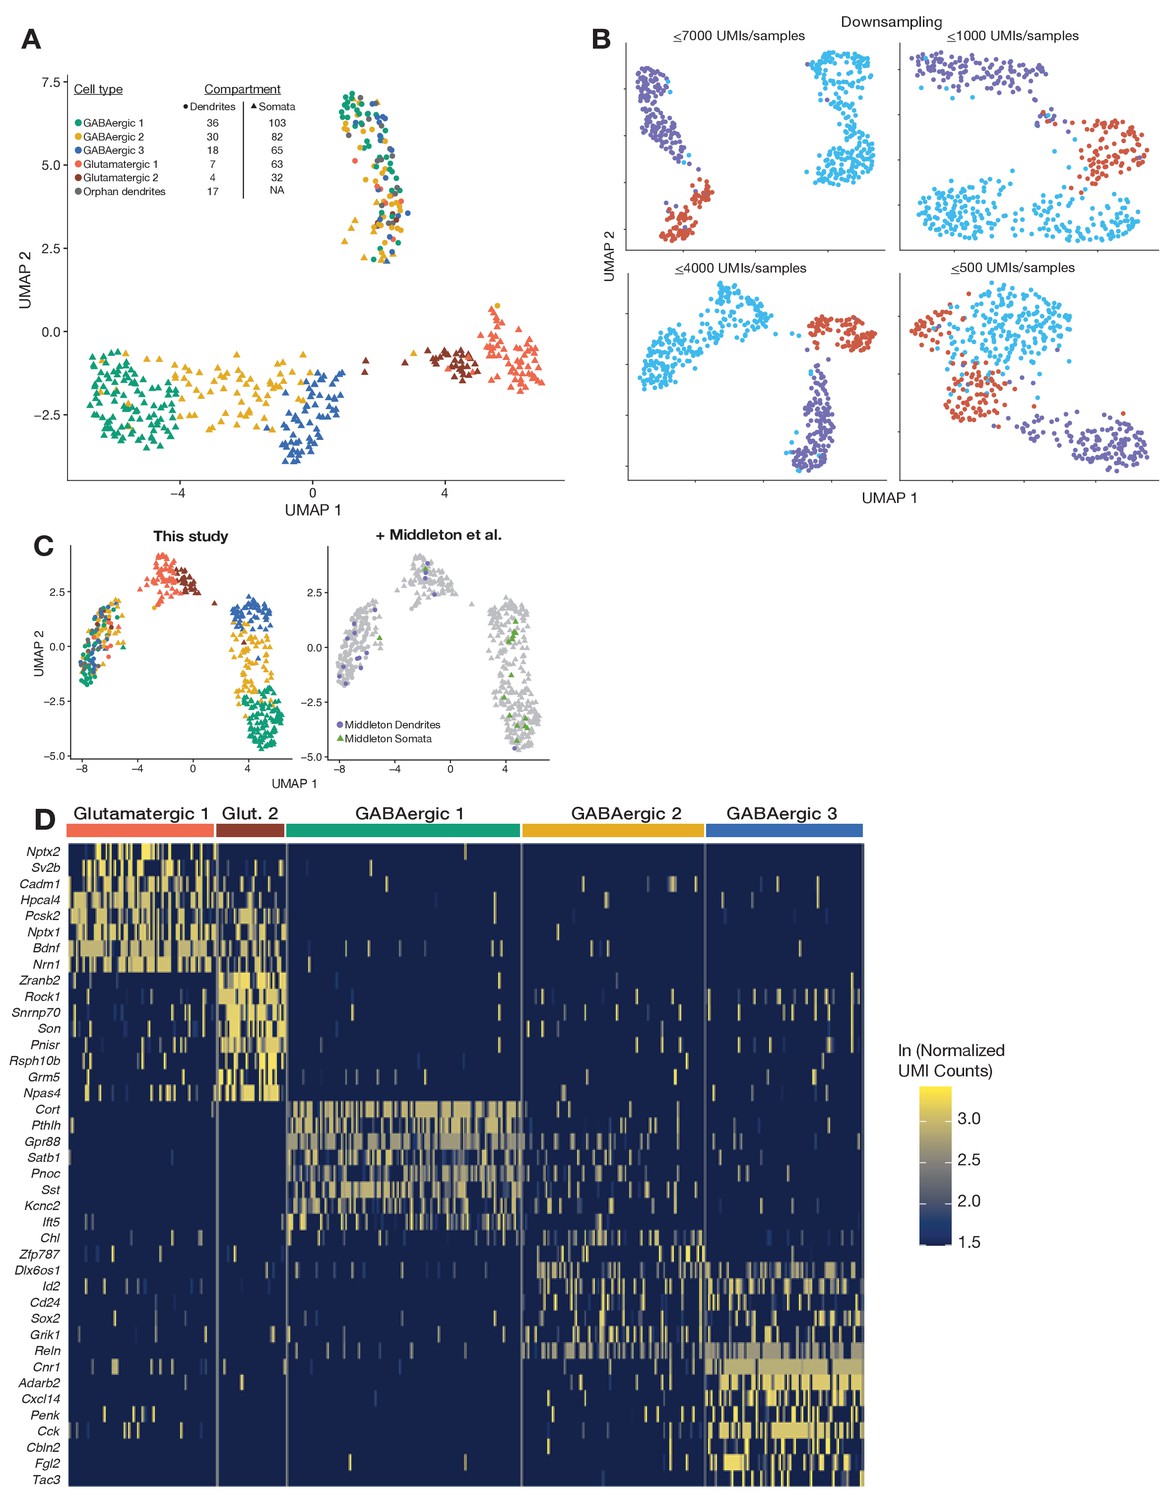
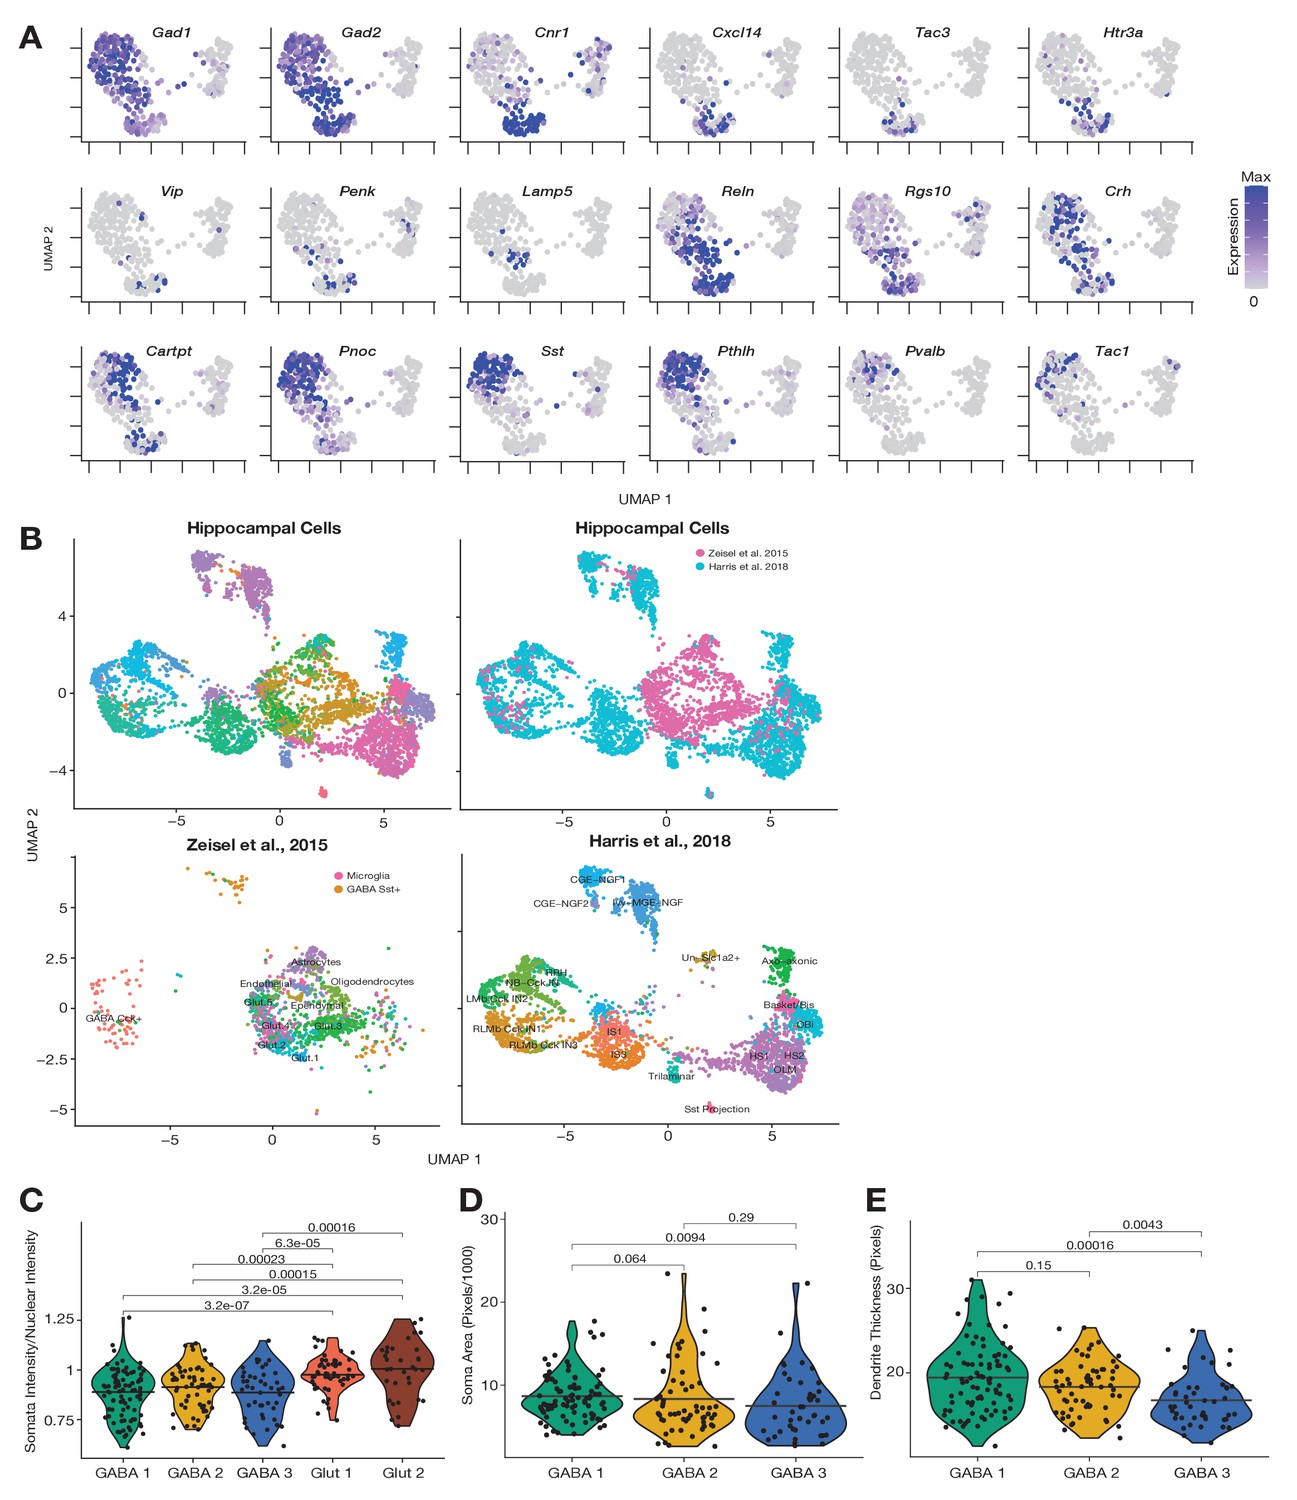
(A) Same as Figure 1C but color-coded according to cell types subsequently described in Figure 1D. (B) Uniform manifold approximation and projection (UMAP) clustering of somatic and dendritic samples, after various degrees of randomly downsampling somatic unique molecular identifier (UMI) counts. (C) UMAP plot showing transcriptome-based integration of the dendrites and soma of 16 single neurons profiled in a previous study (Middleton et al., 2019) to the dendrites and somata profiled in this study. (D) Heatmap showing genes most differentially expressed between cell types. Each column indicates a single soma.
Figure 1—figure supplement 3
Somatic inhibitory marker expression, integration of single cell RNA-seq (scRNA-seq) data sets, and morphological analyses.
(A) Expression of inhibitory interneuron markers projected onto Figure 1D uniform manifold approximation and projection (UMAP) plot. (B) Top-left panel shows Seurat integration of two scRNA-seq data sets derived from the hippocampus, color-coded according to identified cell types. Top-right panel shows the same integration color-coded according to data set of origin. Bottom-left panel shows localization within the plot of cells from Zeisel et al., 2015. Bottom-right panel shows localization within the plot of cells from Harris et al., 2018. See Figure 1F legend for a full description of abbreviated terms. (C–E) Morphological analyses of somatic intensity relative to nuclear intensity (C), somatic area (D), and dendrite thickness (E), for neurons imaged before laser capture, transcriptome profile, and cell type classification. Differences were evaluated using Kruskal–Wallis test and for multiple comparisons Dunn’s test. Adjusted p-values of significantly different groups are shown in C and for all comparisons in D and E.
Figure 2 with 1 supplement
The dendritic transcriptome of GABAergic interneurons.
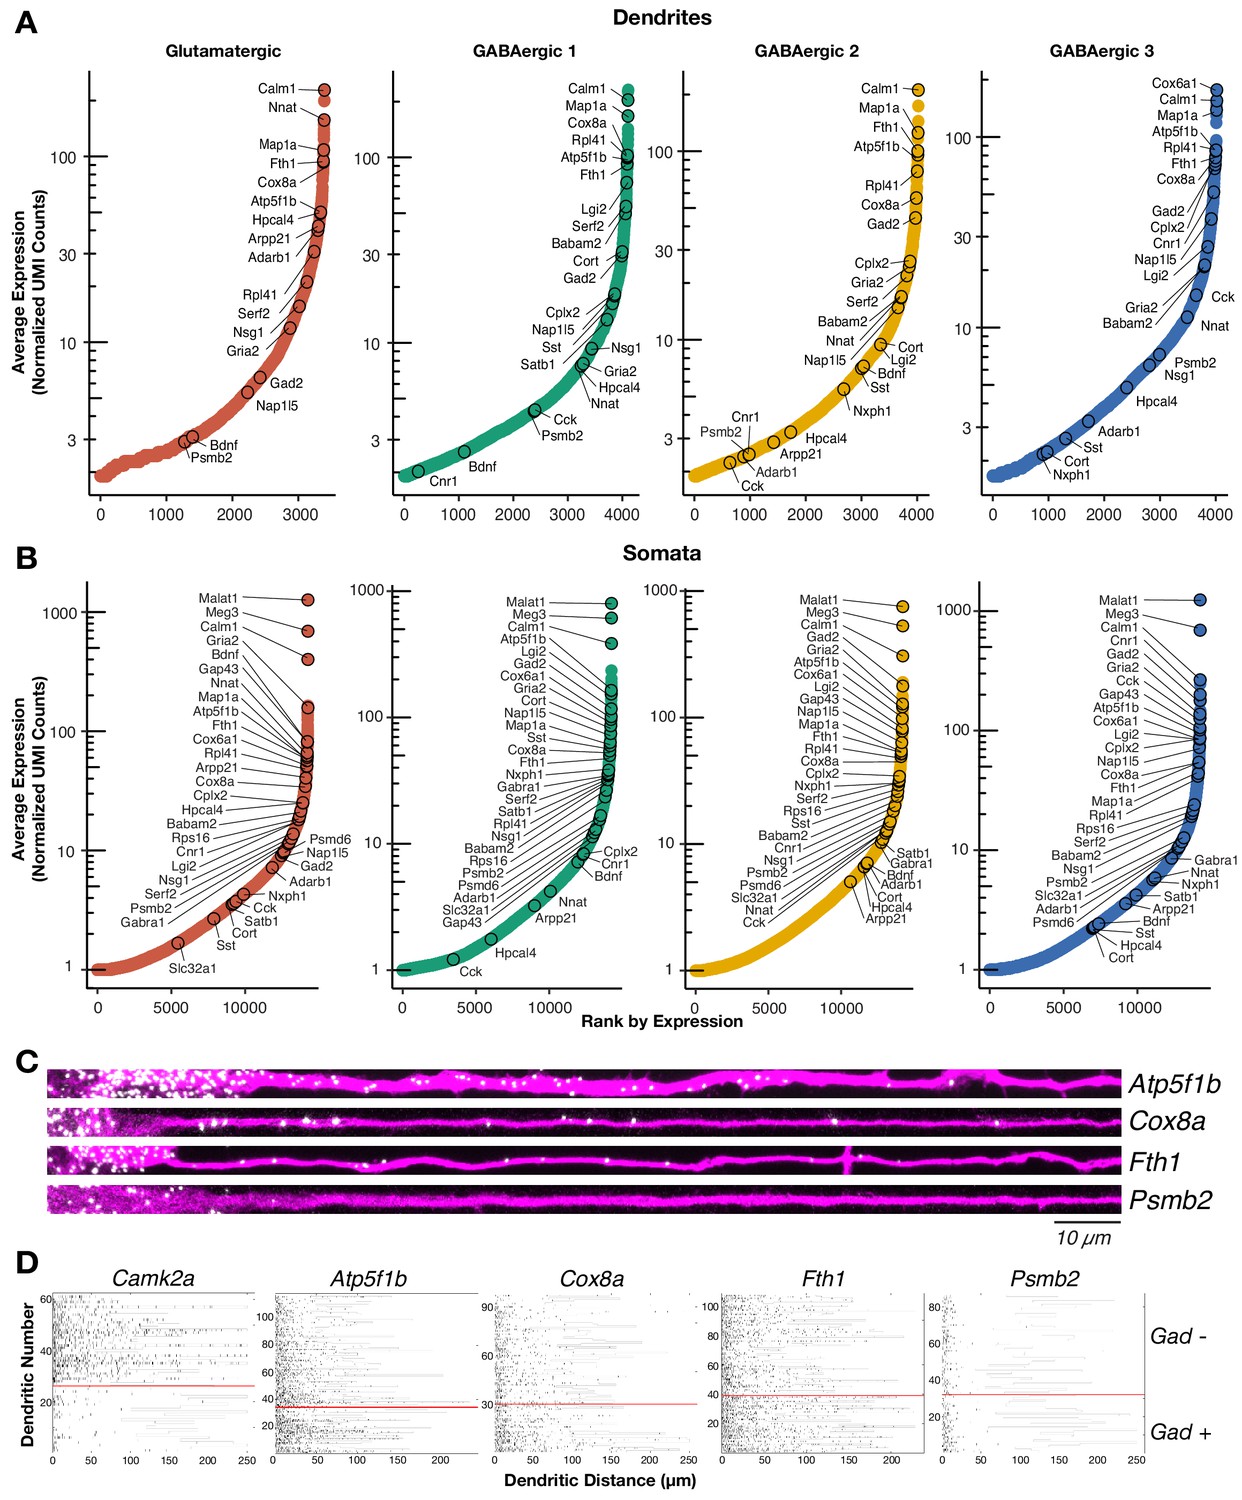
(A) Plots showing the average normalized unique molecular identifier (UMI) counts of genes detected in the dendrites (≥1.9 molecule per sample on average) of the indicated cell types. X-axis shows genes ranked according to their expression from lowest to highest. Some genes are indicated by name. N = glutamatergic (11), GABAergic 1 (36), GABAergic 2 (30), and GABAergic 3 (18). (B) Same as A but for somatic samples. N = glutamatergic (95), GABAergic 1 (103), GABAergic 2 (82), and GABAergic 3 (65). (C) smFISH for indicated mRNAs (in white) observed in GABAergic dendrites immunolabeled with an anti-Map2 antibody (magenta). GABAergic identity was determined by smFISH Gad1/2 as seen in Figure 2—figure supplement 1A. Scale bar = 10 µm. (D) Raster plot showing smFISH dendritic detection pattern over a large number of dendrites. Dendrites of both excitatory and inhibitory cells were straightened from the same images, sorted according to the expression of Gad1/2 (positive below red line, negative above red line) and the gene of interest channel displayed, after automated peak detection, as a raster plot.
Figure 2—figure supplement 1

Cell type-specific effects in the dendritic transcriptome.
(A) Gad1/2 expression (green) as determined by smFISH. Images from double smFISH with respective gene. See expression of respective gene in 2C. (B) Density of puncta (puncta/10 µm) in distal dendrites for gene of interest, in Gad1/2 positive or negative neurons as determined by double smFISH. (C) Density plots showing distribution of p-values in comparisons between the real members of each group, 1000 mock comparisons after random reshuffling, and the average of the mock comparisons. (D) Cumulative distribution of the mock permutation average was used to identify the p-value in which a 5% false discovery rate was observed for each comparison. The cumulative distribution of the real comparison is also shown as reference. (E) Diagram showing the hierarchy of cell types established in clustering analysis (see Figure 1D).
Figure 3 with 1 supplement
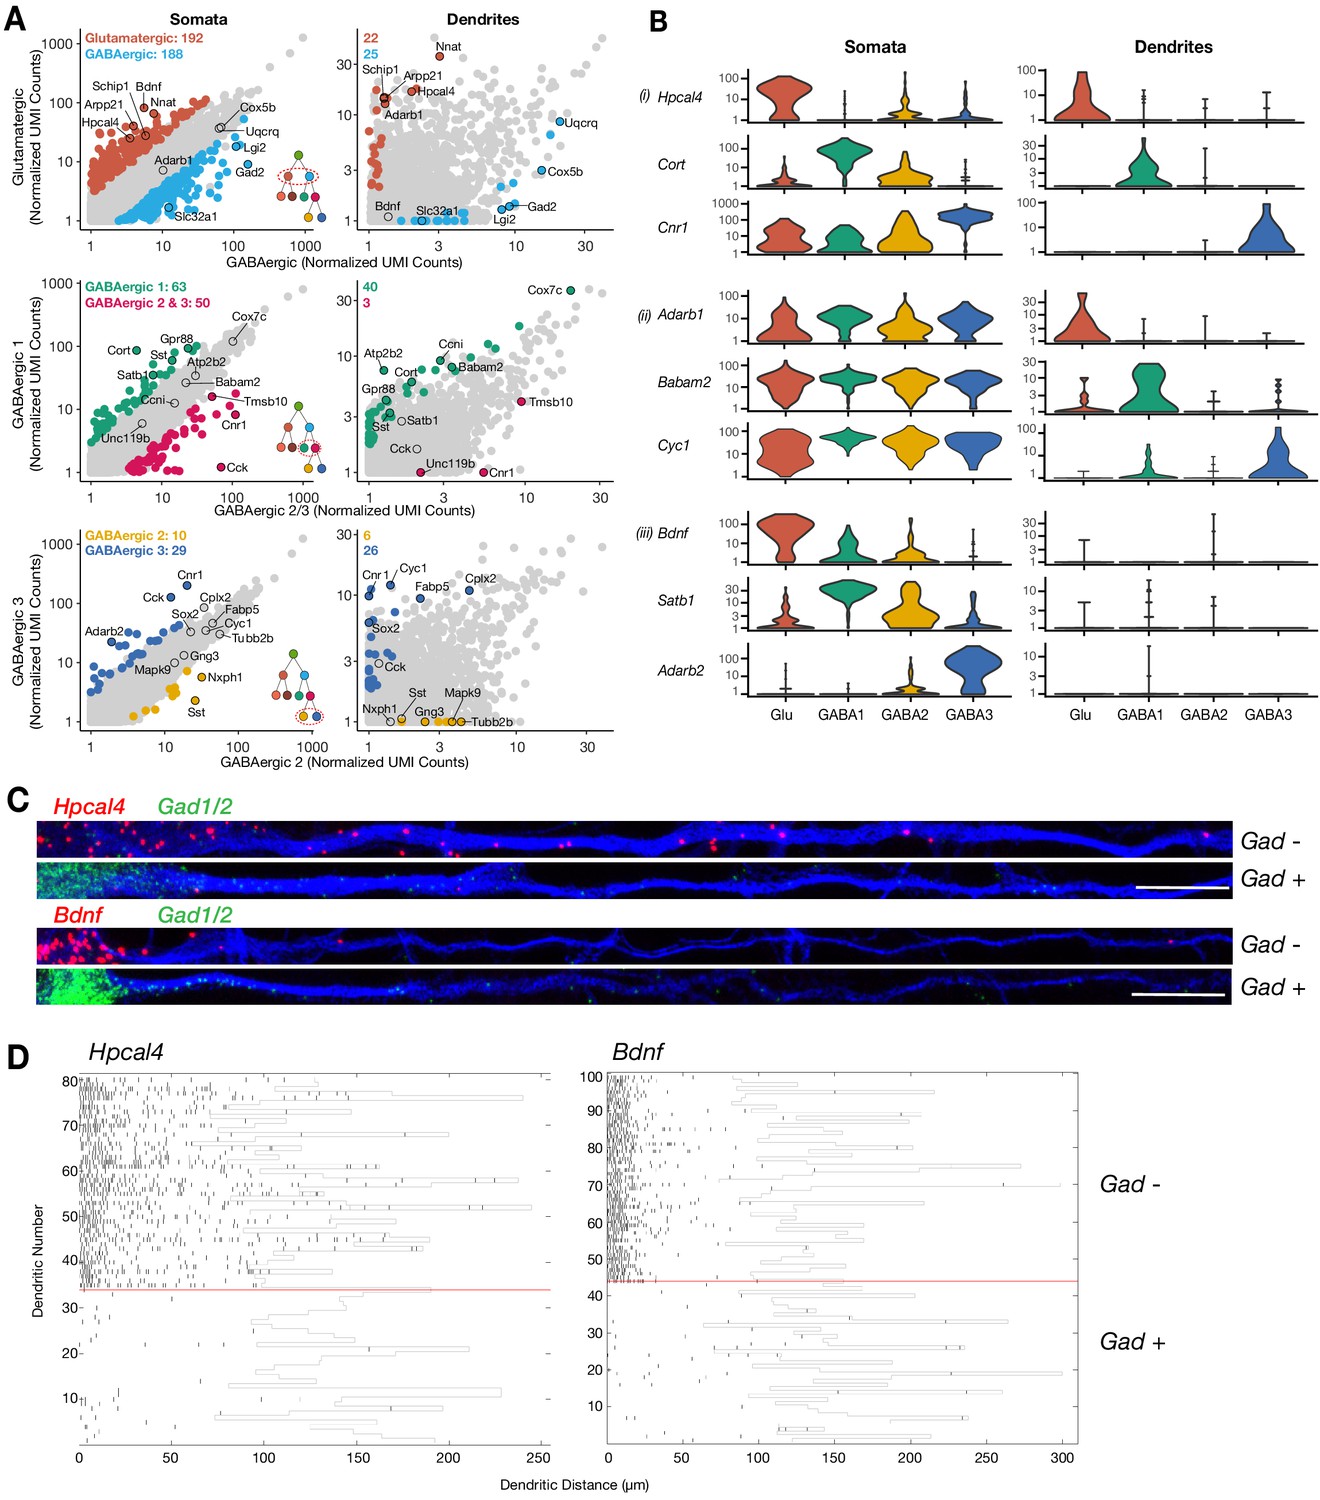
Cell type-specific effects in the dendritic transcriptome.
(A) Scatterplots comparing mean expression between somata or dendrites of different cell types as indicated by x- and y-axes. Significant differentially expressed genes (logistic regression model) are colored in each panel; some significant genes are indicated by name. Inserts in the bottom right of somata scatterplot indicate the comparison within the established hierarchy of cell types (see Figure 2—figure supplement 1E), and on the top left corner of each panel the number of significant genes for each group. Somata N = glutamatergic (95), GABAergic 1 (103), GABAergic 2 (82), and GABAergic 3 (65). Dendrites N = glutamatergic (11), GABAergic 1 (36), GABAergic 2 (30), and GABAergic 3 (18). (B) Examples of cell type-specific differential expression (i) in both somata and dendrites, (ii) only on dendrites, or (iii) only in somata are shown. (C) Double smFISH for either Hpcal4 or Bdnf (both in red) and Gad1/2 (green). Exemplary dendrites from Gad-negative and -positive neurons extracted from experiments as shown in Figure 3—figure supplement 1B, and oriented from soma (left side) to distal dendrite (right side). Scale bar = 20 µm. (D) Raster plot showing smFISH dendritic detection pattern over a large number of dendrites from a single representative experiment. Dendrites of both excitatory and inhibitory cells were straightened from the same images, sorted according to the expression of the cell type marker (positive below red line, negative above red line) and the Hpcal4 or Bdnf channels displayed after automated peak detection as raster plot.
Figure 3—figure supplement 1
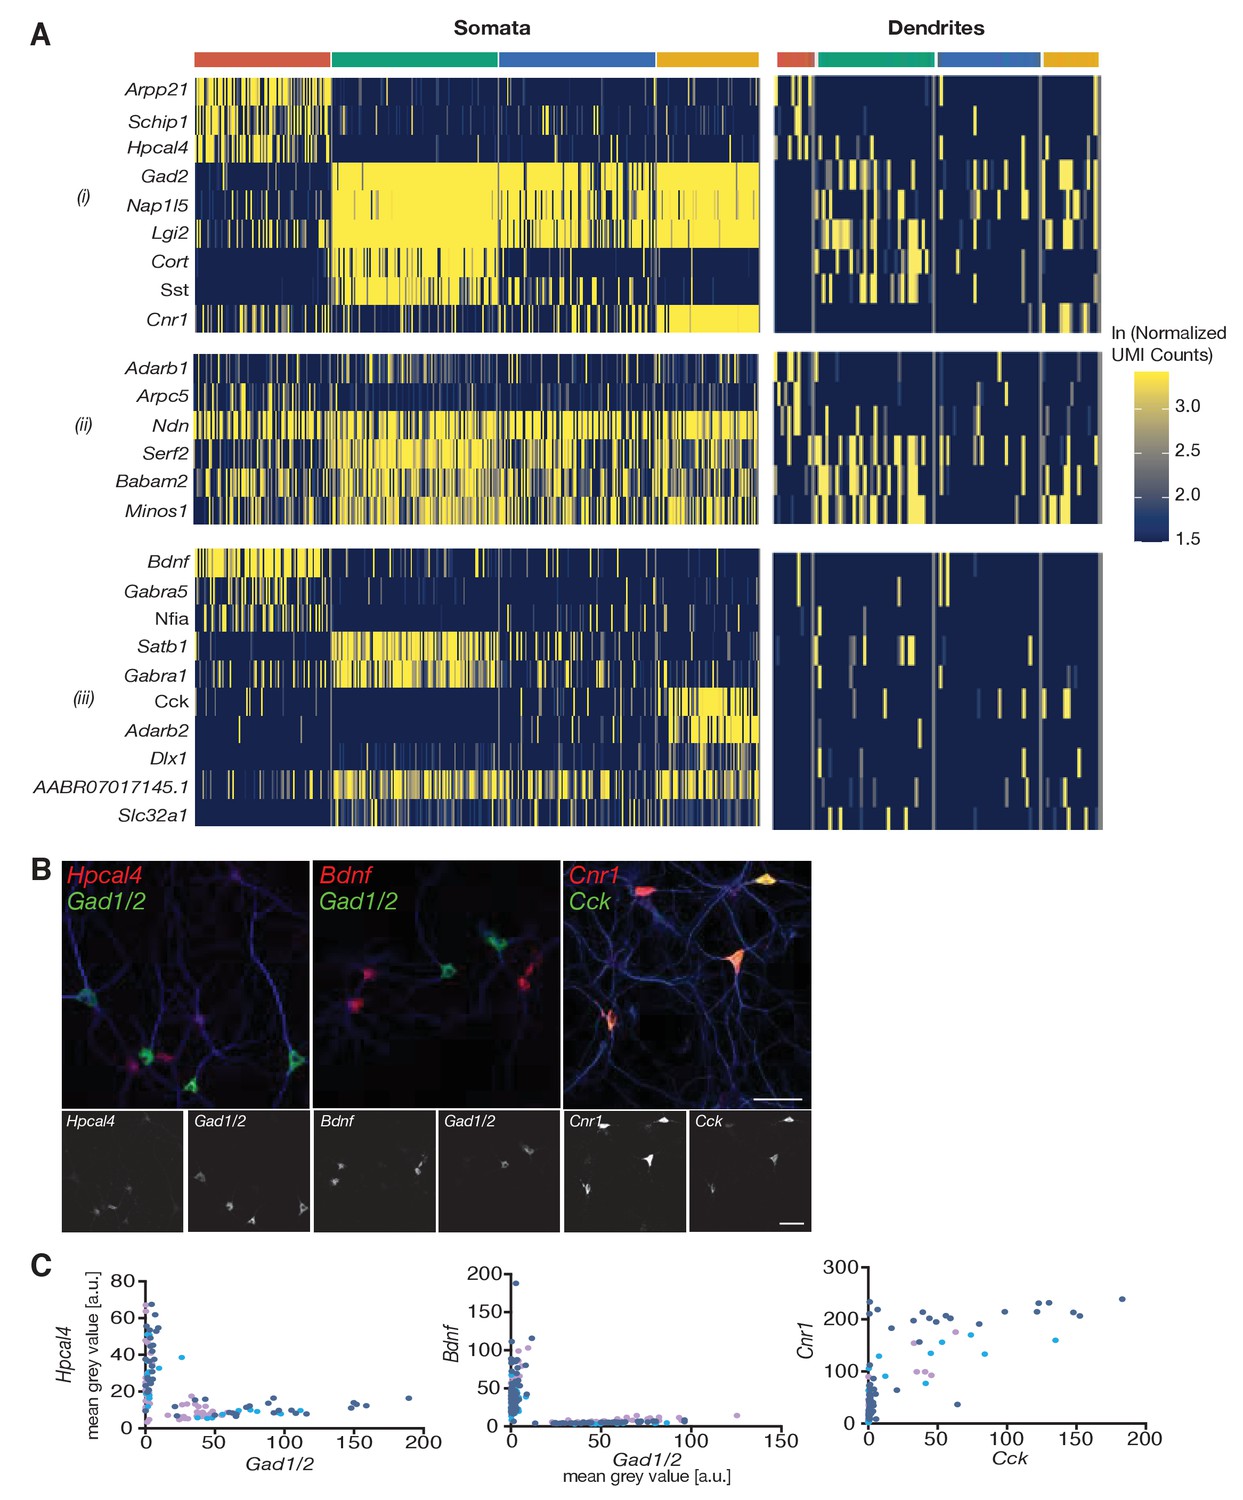
Cell type-specific effects in the dendritic transcriptome.
(A) Heatmap showing genes differentially expressed between cell types (i) in both somata and dendrites, (ii) only on dendrites, or (iii) only in somata. Each column indicates a single soma or dendritic sample. (B) Representative confocal microscopy images of smFISH experiments for Hpcal4 (left), Bdnf (middle), and Cnr1 (right, all in red) and the cell type marker probe sets Gad1/Gad2 (left, middle) or Cck (right, all in green). Neuronal somata and dendrites are shown by MAP2 immunocytochemistry (blue). The two FISH channels are shown separately below each merged image in gray scale (left red; right green). (C) Quantification of FISH intensities in single cell somata of experiments shown in B: both Hpcal4 and Bdnf expression cells separate from the Gad1/2 expressing population. Cells with high Cck expression also express Cnr1. Each dot represents a single cell soma. Different dot colors indicate three different experiments.
Figure 4 with 1 supplement
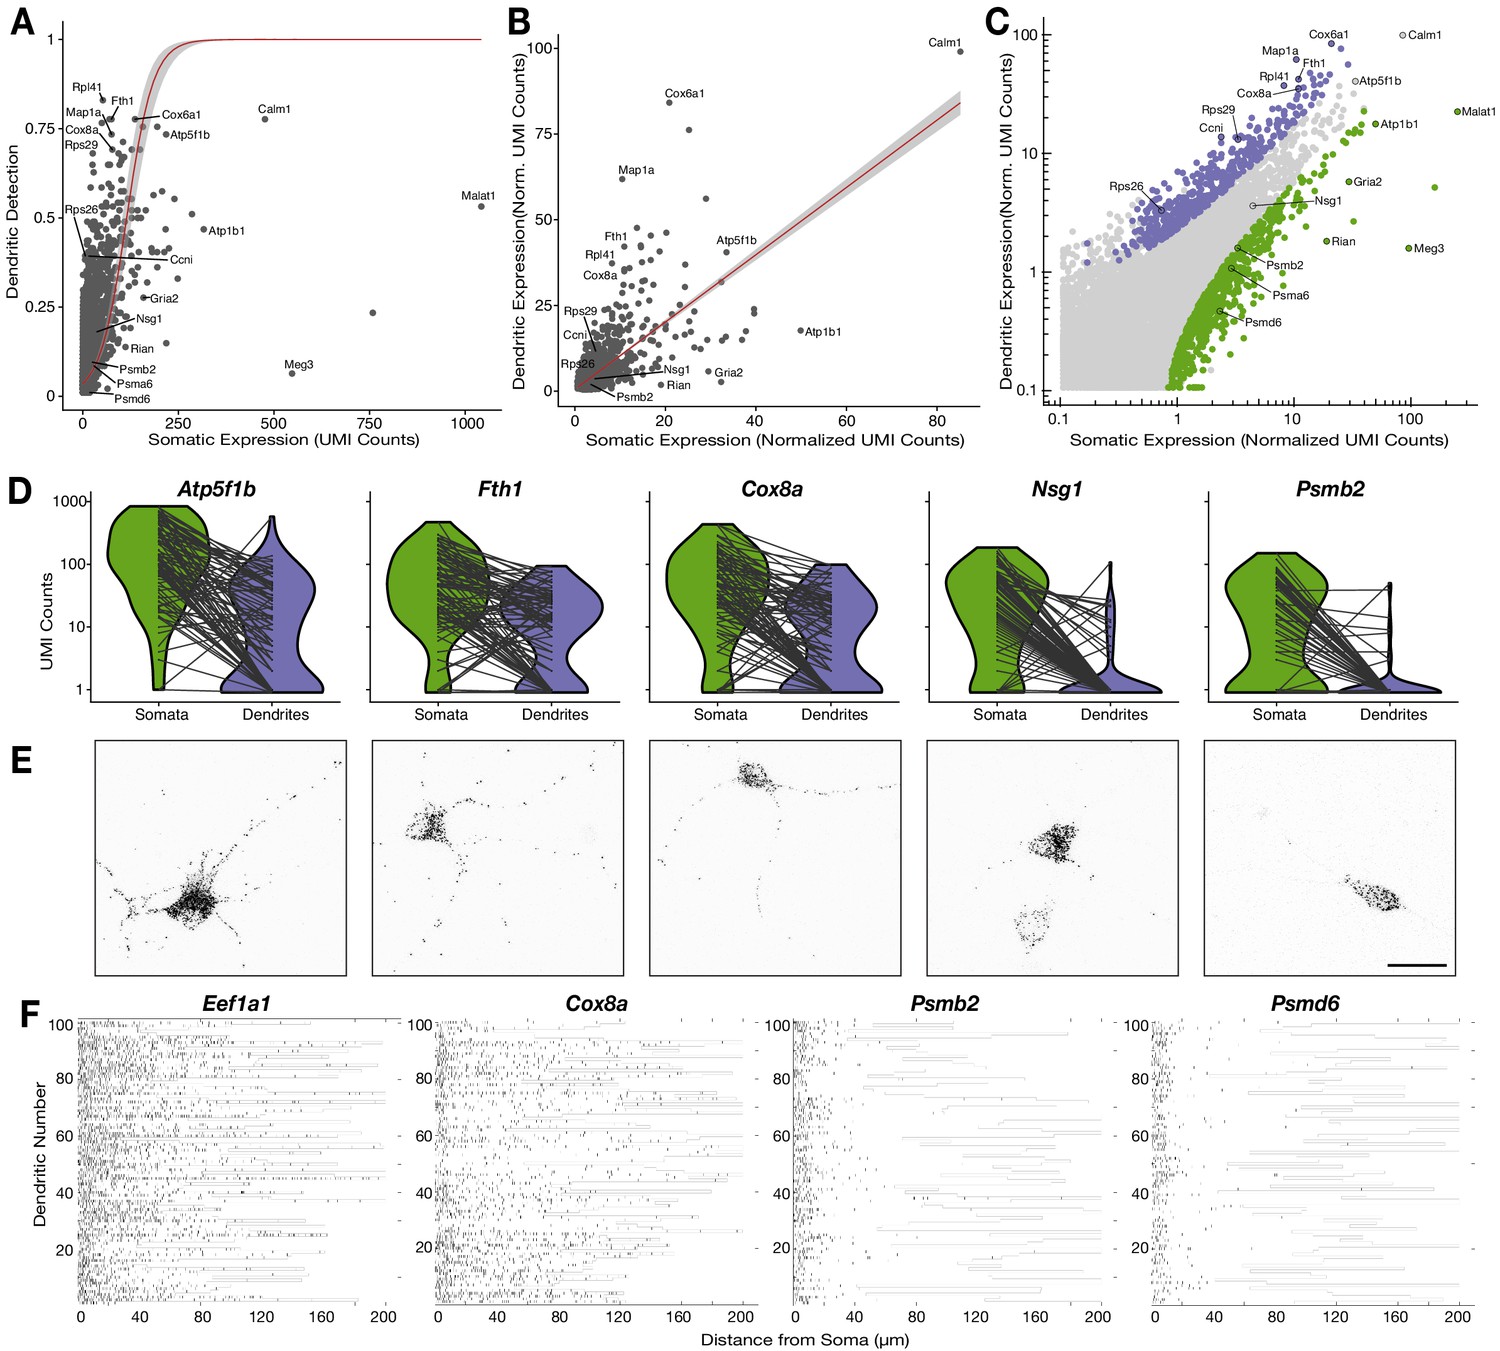
Relationship between the somatic and dendritic transcriptomes of single neurons.
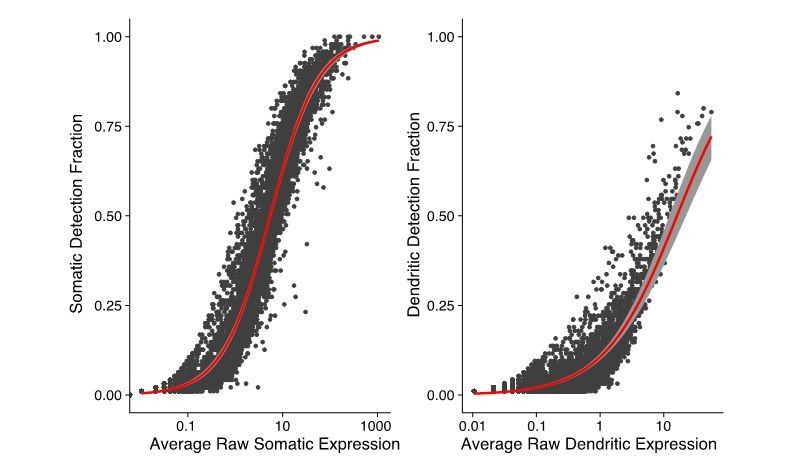
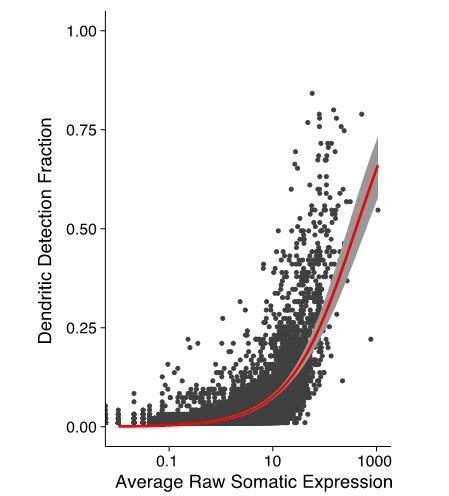
(A) Scatterplot showing the relationship between somatic abundance (in average unique molecular identifier [UMI] counts) and the fraction of samples in which an mRNA species is detected in the dendrites. A logistic regression model revealed a significant correlation (p=1.29 × 10⁻⁶, McFadden’s Pseudo R2 = 0.33). Gray area indicates the 95% confidence interval. Some genes discussed in the text are indicated by name. (B) Correlation between somatic and dendritic expression for genes expressed in at least 20% of dendritic samples. Red curve shows a linear regression model (p=2 × 10⁻¹⁶, R2 = 0.50). Some genes discussed in the text are indicated by name. Gray area indicates the 95% confidence interval. (C) Scatterplot showing the results of paired differential expression analysis using a Poisson generalized linear model. Colored dots indicate statistically significant genes (adjusted p<0.05) in somata (green) or dendrites (purple); some significant genes are indicated by name. (D) Violin plots showing the raw counts in somata and dendrites of gene examples. Lines between violins indicate the paired values of soma and dendrites from the same neuron. (E) FISH validations for genes indicated in D. The abundance and distribution of mRNAs detected (black) are shown. Neurons were identified by anti-Map2 immunolabeling (see images in Figure 4—figure supplement 1C). Scale bar = 25 µm. (F) Raster plot showing the cell-to cell variability of mRNA localization as determined by smFISH, for candidate dendritically enriched (Eef1a1, Cox8a) and dendritically de-enriched (Psmb2, Psmd6) mRNAs. One dendrite was chosen per cell, straightened, and the profile converted via peak detection into a raster plot (displayed from soma/proximal dendrite to distal dendrite, from left to right).
Figure 4—figure supplement 1
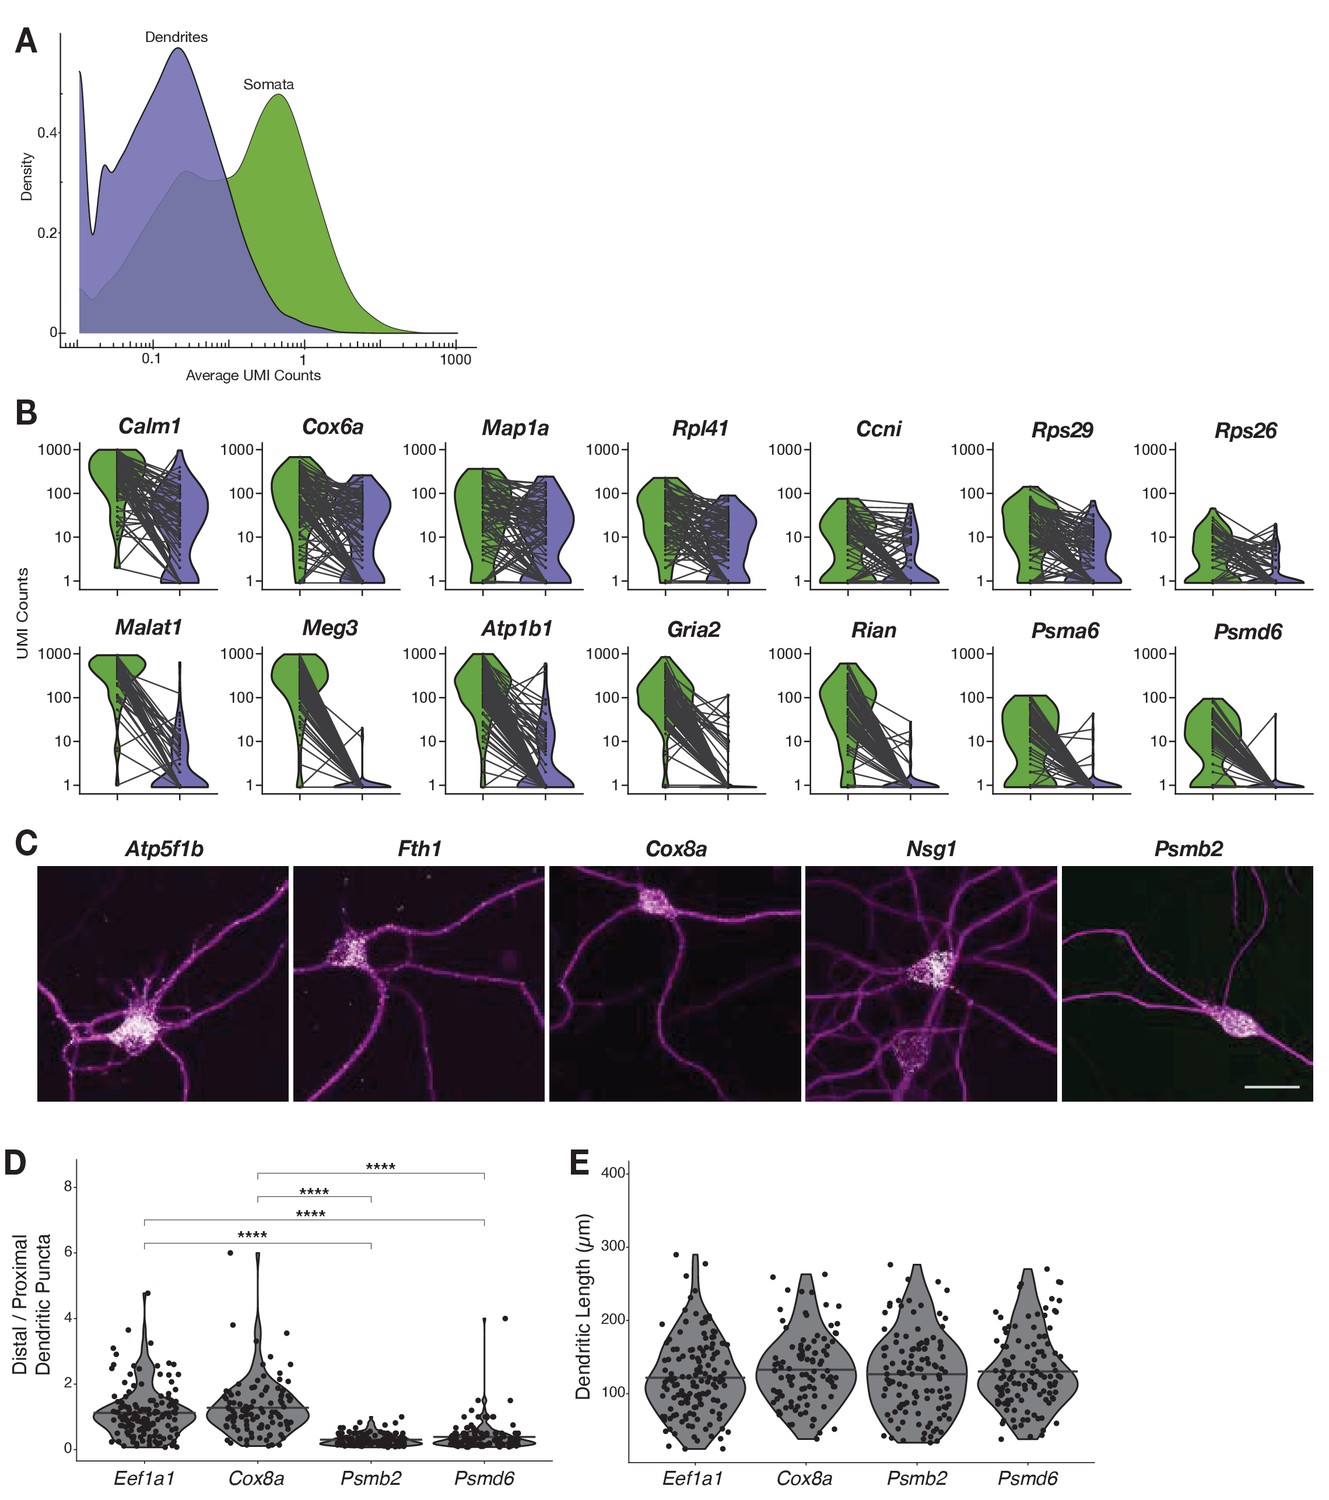
Relationship between the somatic and dendritic transcriptomes of single neurons.
(A) Density plot showing the distribution of expression values based on unique molecular identifier (UMI) counts (logarithmic scale) of dendrites and somata. (B) Violin plots showing UMI counts in somata and dendrites of various genes. Lines between violins indicate the paired values of soma and dendrites from the same neuron. (C) FISH validations for genes indicated in Figure 4D showing the abundance and distribution of mRNAs (white) as shown in Figure 4E, and the neuron structured outlined by anti-Map2 immunolabeling(magenta). Scale bar = 25 µm. (D) Quantification of puncta observed in the distal vs. proximal dendrites for genes shown in Figure 4F. (E) Lengths of dendrites used in the quantification of dendritic puncta for genes shown in Figure 4F.
Figure 5
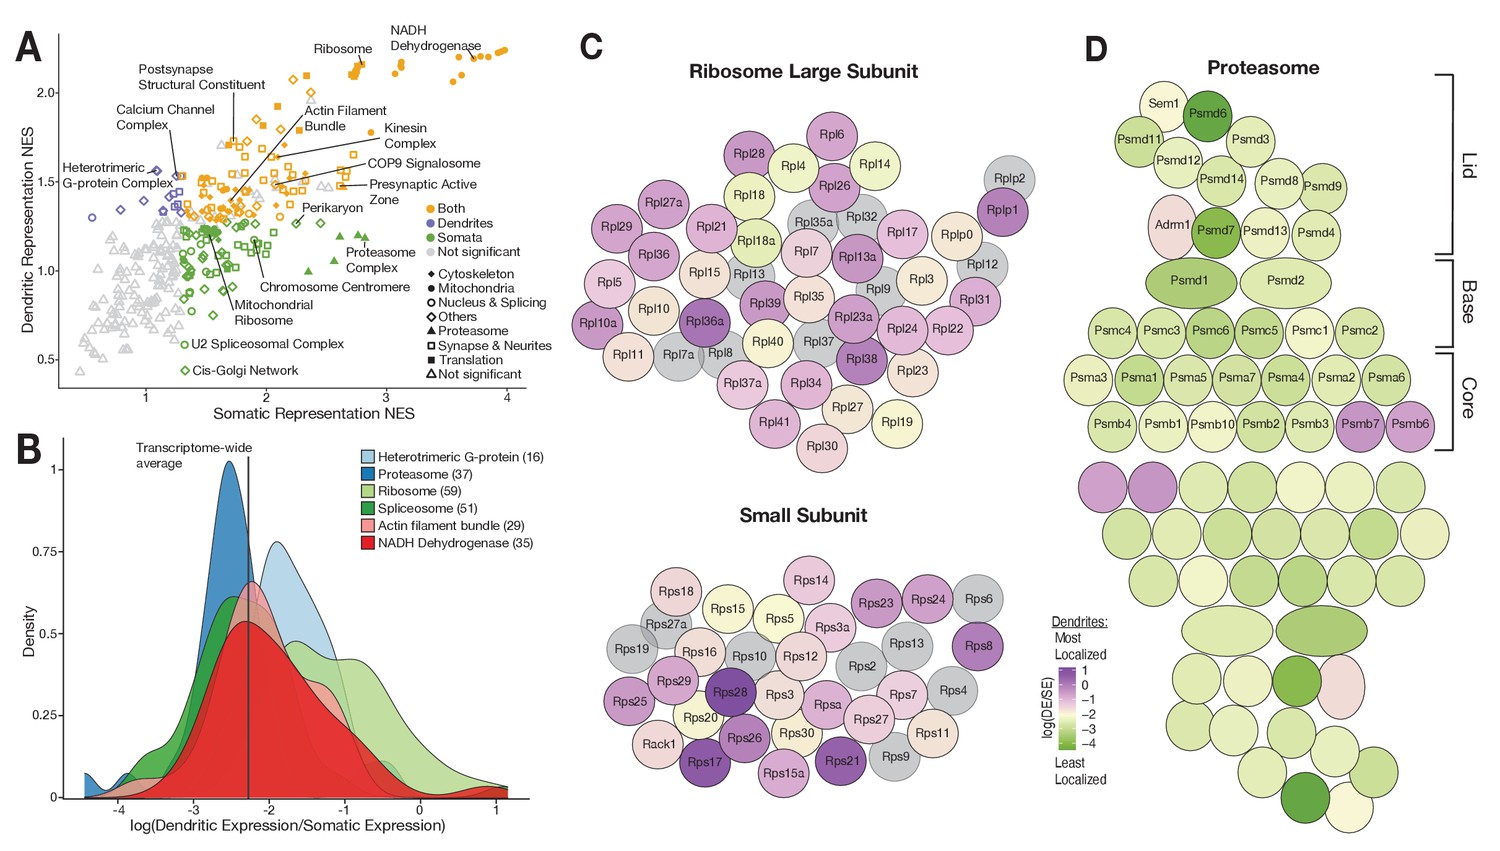
Functional associations of dendritically enriched and de-enriched transcripts.
(A) Gene ontology analyses of dendritic enrichments. Shown are the normalized enrichments scores (NES) of different cellular component and synaptic terms (GOCC and SynGO) calculated from ranked-lists of dendritic and somatic mRNAs. Genes were ranked according to a ‘representation score’ which equals detection frequency × mean expression. Terms with a significant enrichment score (FDR < 0.25) are colored according to their significant compartment. Some terms are indicated by name. (B) Density plot showing the distribution of the relative dendritic enrichments for genes belonging to six GOCC terms. Relative enrichments equated the average ratio between dendritic and somatic expression in a single neuron. Distributions are colored according to the complex and the number of genes evaluated for each complex is shown in parenthesis next to the term in the figure legend. (C) Cartoon showing the proteins of the ribosome colored according to the relative dendritic enrichments of their mRNAs. Gray color indicates that the mRNA species was not detected. (D) Same as C but for proteins of the proteasome.
Figure 6
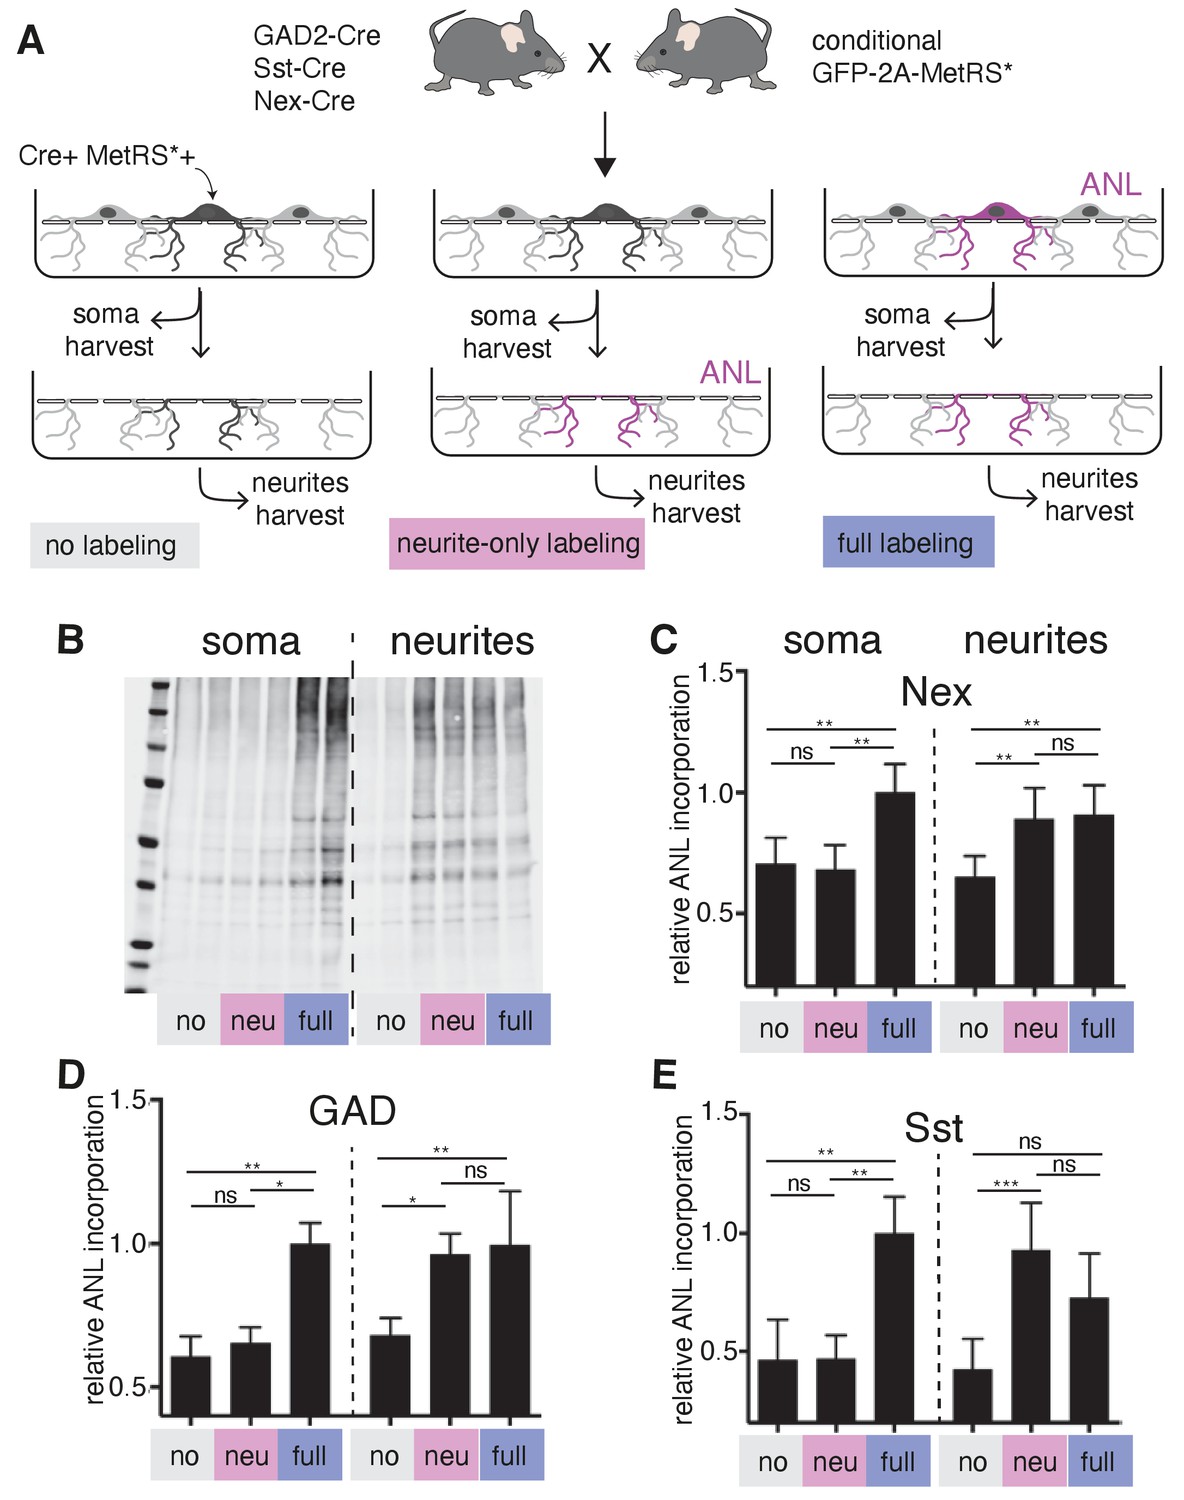
Local protein synthesis occurs in the dendrites of GABAergic neurons.
(A) Schematic outline of the experiment addressing translational capacity of GABAergic neurites (in GAD-Cre::GFP-2A-MetRS*, Sst-Cre::GFP-2A-MetRS*) and glutamatergic neurites (Nex-Cre::GFP-2A-MetRS*) with cell type-specific ANL incorporation and BONCAT for results shown in B–E. (B) Representative biotin immunoblot for an experiment with Sst-Cre::GFP-2A-MetRS* mouse cortical neurons as outlined in A. (C–E) Quantification of the relative biotin western blot signal representing 15 min ANL incorporation in the soma (left bars) or neurite (right bars) fractions harvested under the conditions shown in (A) from cortical neuron cultures prepared from the indicated mouse lines: (C) GAD-Cre::GFP-2A-MetRS*, (D) Sst-Cre::GFP-2A-MetRS*, and (E) Nex-Cre::GFP-2A-MetRS* (mean ± SD; GAD: soma no 0.61 ±0.07, soma neu 0.65 ± 0.06, soma full 1.00 ± 0.07, neurites no 0.68 ± 0.06, neurites neu 0.96 ± 0.07, neurites full 1.00 ± 0.19; Sst: soma no 0.47 ± 0.17, soma neu 0.47 ± 0.1, soma full 1.00 ± 0.15, neurites no 0.43 ± 0.13, neurites neu 0.93 ± 0.2, neurites full 0.73 ± 0.19; Nex: soma no 0.71 ± 0.11, soma neu 0.68 ± 0.10, soma full 1.00 ± 0.12, neurites no 0.65 ± 0.09, neurites neu 0.89 ± 0.13, neurites full 0.91 ± 0.12). Equal protein amounts were loaded within soma fractions and within neurite fractions. The biotin immunoreactivity in the neurite fraction of the neurite-only labeling from all investigated mouse lines was significantly higher than in unlabeled controls ([Kruskal–Wallis test with Dunn’s multiple comparison’s test for GAD, n = 6 (three experiments); GAD soma: soma no vs soma neu p>0.9999, soma no vs soma full p=0.0032, soma neu vs soma full p=0.0304; GAD neurites: neurites no vs neurites neu p=0.0239, neurites no vs neurites full p=0.0073, neurites neu vs neurites full p>0.9999; Sst n = 7 (three experiments); Sst soma: soma no vs soma neu p>0.9999, soma no vs soma full p=0.0023, soma neu vs soma full p=0.0089; Sst neurites: neurites no vs neurites neu p=0.0008, neurites no vs neurites full p=0.0635, neurites neu vs neurites full p=0.5449]; Nex n = 8 [four experiments] Nex soma: soma no vs soma neu p>0.9999, soma no vs soma full p=0.0036, soma neu vs soma full p=0.0017; Nex neurites: neurites no vs neurites neu p=0.0050, neurites no vs neurites full p=0.0080, neurites neu vs neurites full p>0.9999).
Author response image 1
Author response image 2

Author response image 3
Author response image 4
Author response image 5

Tables
Key resources table
| Reagent type (species) or resource | Designation | Source or reference | Identifiers | Additional information |
|---|---|---|---|---|
| Genetic reagent (Rattus norvegicus) | Primary neurons | Other | Animals obtained from our animal house | |
| Genetic reagent Mus musculus | Primary neurons | Other | Animals obtained from our animal house | |
| Genetic reagent (M. musculus) | Sst-IRES-Cre | Jackson | JAX013044 | |
| Genetic reagent (M. musculus) | Gad2-IRES-Cre | Jackson | JAX010802 | |
| Genetic reagent (M. musculus) | Nex-Cre | Obtained from the laboratory of Dr. Klaus-Armin Nave | Goebbels et al., 2006 PMID:17146780 | |
| Genetic reagent (M. musculus) | STOPflox R26-GFP-2A-MetRS*(L274G) | Developed in house | JAX028071 | |
| Antibody | Rabbit polyclonal anti-biotin | SIGMA | 31852 | (1:1000) IB |
| Antibody | Guinea pig polyclonal anti-MAP2 | Synaptic Systems | 188004 | (1:1000) IF |
| Antibody | Goat polyclonal anti-rabbit IRDye680 | Licor | Goat anti-rabbit IRDye680 | (1:5000) IB |
| Antibody | Goat polyclonal anti-guinea pig Dylight405 | Jackson ImmunoResearch | Goat anti-guinea pig Dylight405 | (1:500-1:1000) IF |
| Antibody | Goat polyclonal anti-guinea pig-Alexa488 | Thermo-fisher | Goat anti-guinea pig-Alexa488 | (1:1000) IF |
| Commercial assay or kit | Nextera XT DNA Library prep kit | Illumina | FC-131–1096 | |
| Commercial assay or kit | NextSeq 500/550 High Output Kit v2.5 (75 Cycles) | Illumina | 20024906 | |
| Commercial assay or kit | ViewRNA ISH Cell Assay Kit | Thermo-fisher | QVC0001 | |
| Software, algorithm | Cufflinks 2.2.1 | Cufflinks 2.2.1 | Annotation of Rat 3’UTRs | |
| Software, algorithm | Drop-seq tools (v2.3.0) | Drop-seq tools (v2.3.0) | Sequencing data processing | |
| Software, algorithm | Fastp | Fastp (v0.20.1) | Read quality control | |
| Software, algorithm | STAR 2.5.4b | STAR 2.5.4b | Genome alignments | |
| Software, algorithm | Seurat 3.1.5 | Seurat 3.1.5 | Data analyses | |
| Software, algorithm | GSEA_4.0.3 | GSEA_4.0.3 | Pathway enrichment analyses | |
| Software, algorithm | Fiji ImageJ Version 2.0.0-rc-68/1.52 n | Fiji ImageJ Version 2.0.0-rc-68/1.52 n | FISH data analyses |
Additional files
-
Supplementary file 1
Sample metadata.
- https://cdn.elifesciences.org/articles/63092/elife-63092-supp1-v2.tsv
-
Supplementary file 2
Count data.
- https://cdn.elifesciences.org/articles/63092/elife-63092-supp2-v2.tsv
-
Supplementary file 3
Somatic and dendritic transcriptomes of GABAergic and glutamatergic neurons.
Related to Figure 2. Contains average normalized unique molecular identifier (UMI) counts of genes detected in the dendrites (Tab 1) and somata (Tab 2) of GABAergic and glutamatergic neurons.
- https://cdn.elifesciences.org/articles/63092/elife-63092-supp3-v2.xlsx
-
Supplementary file 4
Somata and dendrites cell type-specific differential expression results.
Related to Figure 3. Contains results of differential expression test for: (Tab 1) GABAergic vs glutamatergic somata, (Tab 2) GABAergic vs glutamatergic dendrites, (Tab 3) GABAergic 1 vs GABAergic 2 and 3 somata, (Tab 4) GABAergic 1 vs GABAergic 2 and 3 dendrites, (Tab 5) GABAergic 2 vs GABAergic 3 somata, (Tab 6) GABAergic 1 vs GABAergic 2 and 3 dendrites.
- https://cdn.elifesciences.org/articles/63092/elife-63092-supp4-v2.xlsx
-
Supplementary file 5
Somata vs dendrites differential expression results.
Related to Figure 4. Contains results of somata vs dendrites differential expression test.
- https://cdn.elifesciences.org/articles/63092/elife-63092-supp5-v2.tsv
-
Supplementary file 6
Gene ontology analysis.
Related to Figure 5. Contains results of GSEA ranked test for somata (Tab 1) and dendrites (Tab 2).
- https://cdn.elifesciences.org/articles/63092/elife-63092-supp6-v2.xlsx
-
Supplementary file 7
Sequences of primers used in this study.
Related to methods.
- https://cdn.elifesciences.org/articles/63092/elife-63092-supp7-v2.xlsx
-
Transparent reporting form
- https://cdn.elifesciences.org/articles/63092/elife-63092-transrepform-v2.pdf
Download links
A two-part list of links to download the article, or parts of the article, in various formats.
Downloads (link to download the article as PDF)
Open citations (links to open the citations from this article in various online reference manager services)
Cite this article (links to download the citations from this article in formats compatible with various reference manager tools)
Subcellular sequencing of single neurons reveals the dendritic transcriptome of GABAergic interneurons
eLife 10:e63092.
https://doi.org/10.7554/eLife.63092


