A novel haemocytometric COVID-19 prognostic score developed and validated in an observational multicentre European hospital-based study
- Sysmex Europe GmbH, Germany
- Amphia Hospital, Netherlands
- Elisabeth-Tweesteden Hospital, Netherlands
- Hospital Papa Giovanni XXIII, Italy
- Erasmus MC, University Medical Center, Netherlands
- Leiden University Medical Center, Netherlands
- Albert Schweitzer Hospital, Netherlands
- Canisius Wilhelmina Hospital, Netherlands
- Catharina Hospital, Netherlands
- University Hospital Antwerp, Belgium
- University Medical Center Groningen, University of Groningen, Netherlands
- Zuyderland Medical Center, Netherlands
- Radboud University Medical Center, Netherlands
Figures
Figure 1

Patient flow chart from prognostic score development and validation cohorts, including sample numbers for CBC-Diff (with or without RET) and clinical outcome.
Footnote. (a) Details of how the validation patient cohort patients were selected are provided in Figure 10 , (b) the exclusion criteria for the validation cohort were the same as for the development patient cohort.
Figure 2
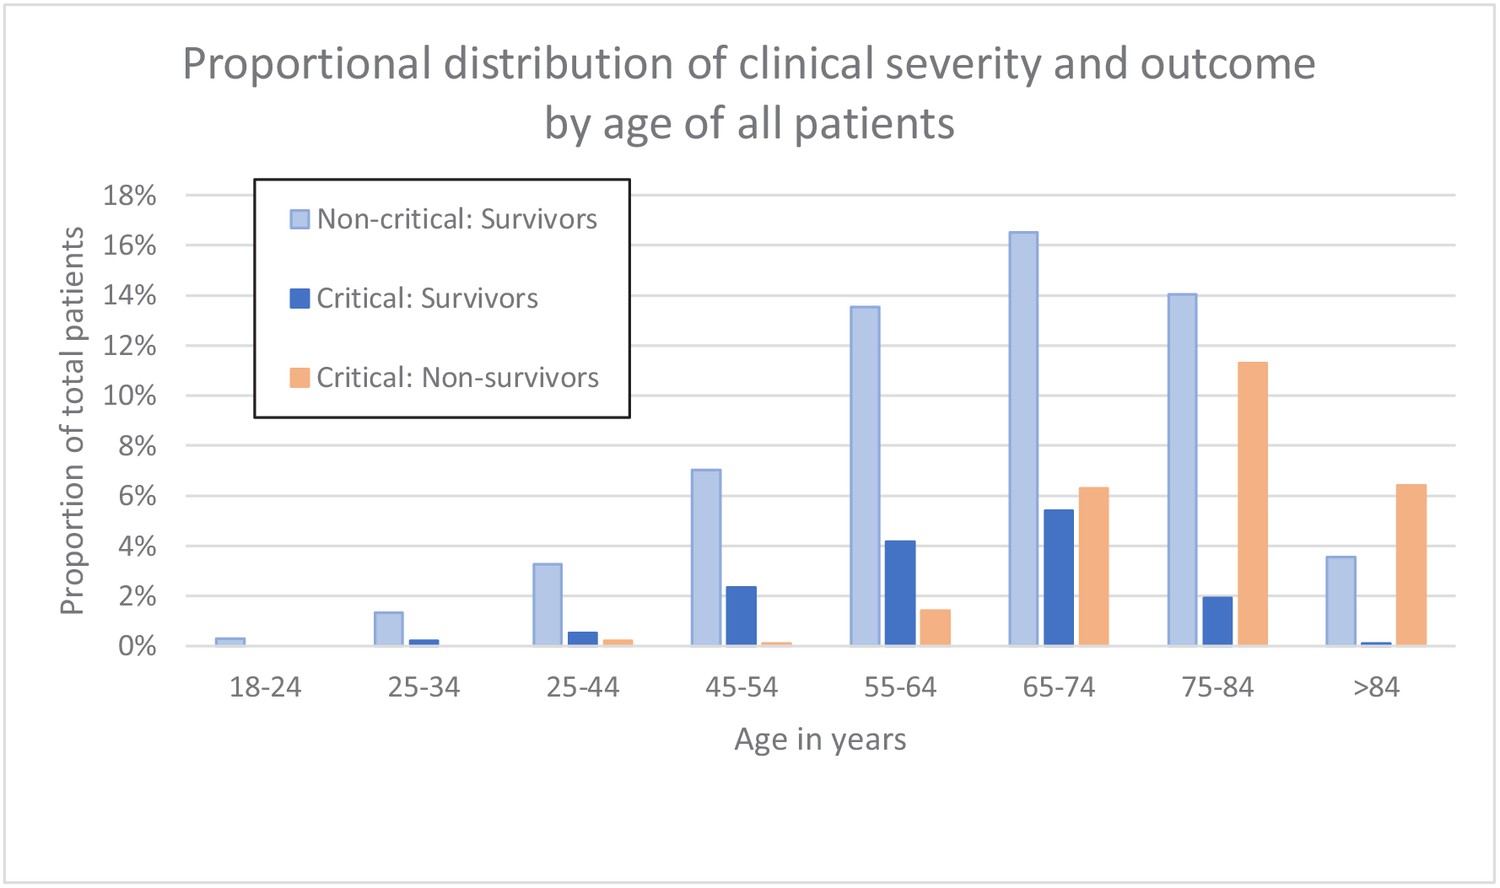
Clinical severity and outcome by age of all patients.
-
Figure 2—source data 1
Source data for clinical severity and outcome by age of all patients.
- https://cdn.elifesciences.org/articles/63195/elife-63195-fig2-data1-v2.csv
Figure 3

Trends of lymphocyte-related parameters over 14 days of hospitalisation in critical illness (CI) and non-critical (NC) patients.
Note: 14 days of hospitalisation refers to Day 0 (day of admission) plus the next 13 days after admission. The normal reference range is depicted by the area between the dotted horizontal lines. Vertical bars indicate standard error of the mean (SEM). (A) Absolute lymphocyte count (LYMPH), (B) neutrophil-to-lymphocyte ratio (NLR), (C) antibody-synthesising lymphocytes as percentage of lymphocytes (AS-LYMPH%/L), (D) reactive lymphocytes minus AS-LYMPH (as a percentage of lymphocytes). The number of sample measurements available per day for the trend analysis for the parameters plotted per patient group are shown in Figure 3—source data 1.
-
Figure 3—source data 1
Source data for number of measurements for each day of hospitalisation that were available per patient group for the trends of lymphocyte-related parameters over 14 days of hospitalisation.
- https://cdn.elifesciences.org/articles/63195/elife-63195-fig3-data1-v2.xlsx
-
Figure 3—source data 2
Source data for trends of absolute lymphocyte count over 14 days of hospitalisation in critical illness (CI) and non-critical (NC) patients.
- https://cdn.elifesciences.org/articles/63195/elife-63195-fig3-data2-v2.csv
-
Figure 3—source data 3
Source data for trends of neutrophil-to-lymphocyte ratio over 14 days of hospitalisation in critical illness (CI) and non-critical (NC) patients.
- https://cdn.elifesciences.org/articles/63195/elife-63195-fig3-data3-v2.csv
-
Figure 3—source data 4
Source data for trends of AS-LYMPH%/L over 14 days of hospitalisation in critical illness (CI) and non-critical (NC) patients.
- https://cdn.elifesciences.org/articles/63195/elife-63195-fig3-data4-v2.csv
-
Figure 3—source data 5
Source data for trends of RE-Lymph minus AS-LYMPH as a percentage of total lymphocytes over 14 days of hospitalisation in critical illness (CI) and non-critical (NC) patients.
- https://cdn.elifesciences.org/articles/63195/elife-63195-fig3-data5-v2.csv
Figure 4

Trends of neutrophil-related parameters over 14 days of hospitalisation in critical illness (CI) and non-critical (NC) patients.
Note: 14 days refers to day 0 (day of admission) plus the next 13 days after admission. The normal reference range is depicted by the area between the dotted horizontal lines. Vertical bars indicate standard error of the mean (SEM). (A) Absolute neutrophil count (NEUT), (B) neutrophil reactivity index (NEUT-RI), (C) immature granulocytes (IG), (D) Immature granulocyte-to-lymphocyte ratio *100 (IGLR). The number of sample measurements available per day for the trend analysis for the parameters plotted per patient group are shown in Figure 4—source data 1.
-
Figure 4—source data 1
Source data for number of measurements for each day of hospitalisation that were available per patient group for the trends of neutrophil-related parameters over 14 days of hospitalisation.
- https://cdn.elifesciences.org/articles/63195/elife-63195-fig4-data1-v2.xlsx
-
Figure 4—source data 2
Source data for trends of absolute neutrophil count over 14 days of hospitalisation in critical illness (CI) and non-critical (NC) patients.
- https://cdn.elifesciences.org/articles/63195/elife-63195-fig4-data2-v2.csv
-
Figure 4—source data 3
Source data for trends of NEUT-RI over 14 days of hospitalisation in critical illness (CI) and non-critical (NC) patients.
- https://cdn.elifesciences.org/articles/63195/elife-63195-fig4-data3-v2.csv
-
Figure 4—source data 4
Source data for trends of immature granulocyte count over 14 days of hospitalisation in critical illness (CI) and non-critical (NC) patients.
- https://cdn.elifesciences.org/articles/63195/elife-63195-fig4-data4-v2.csv
-
Figure 4—source data 5
Source data for trends of immature granuclocyte-to-lymphocyte ratio over 14 days of hospitalisation in critical illness (CI) and non-critical (NC) patients.
- https://cdn.elifesciences.org/articles/63195/elife-63195-fig4-data5-v2.csv
Figure 5
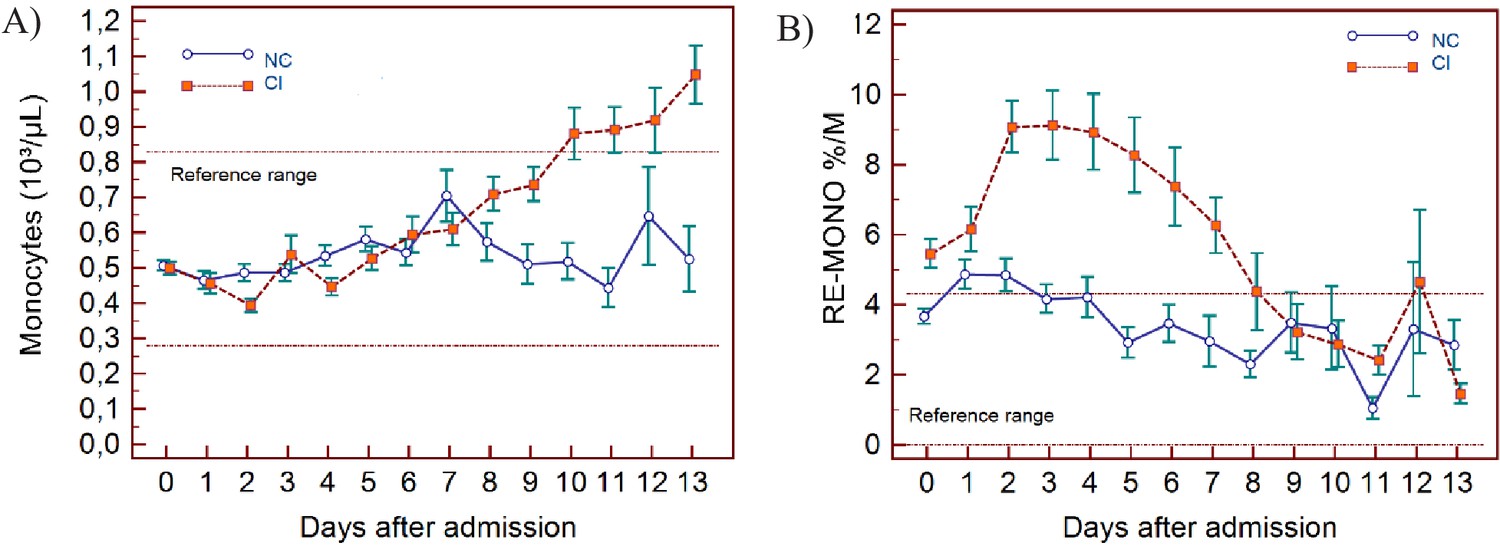
Trends of monocyte parameters over 14 days of hospitalisation in critical illness (CI) and non-critical (NC) patients.
Note: 14 days of hospitalisation refers to day 0 (day of admission) plus the first 13 days after admission. The normal reference range is depicted by the area between the dotted horizontal lines. Vertical bars indicate standard error of the mean (SEM). (A) Absolute monocyte count (MONO), (B) reactive monocytes as a percentage of monocytes (RE-MONO%/M). The number of sample measurements available per day for the trend analysis for the parameters plotted per patient group are shown in Figure 5—source data 1.
-
Figure 5—source data 1
Source data for number of measurements for each day of hospitalisation that were available per patient group for the trends of monocyte parameters over 14 days of hospitalisation.
- https://cdn.elifesciences.org/articles/63195/elife-63195-fig5-data1-v2.xlsx
-
Figure 5—source data 2
Source data for trends of absolute monocyte count over 14 days of hospitalisation in critical illness (CI) and non-critical (NC) patients.
- https://cdn.elifesciences.org/articles/63195/elife-63195-fig5-data2-v2.csv
-
Figure 5—source data 3
Source data of trends of reactive monocytes as a percentage of total monocyte count over 14 days of hospitalisation in critical illness (CI) and non-critical (NC) patients.
- https://cdn.elifesciences.org/articles/63195/elife-63195-fig5-data3-v2.csv
Figure 6
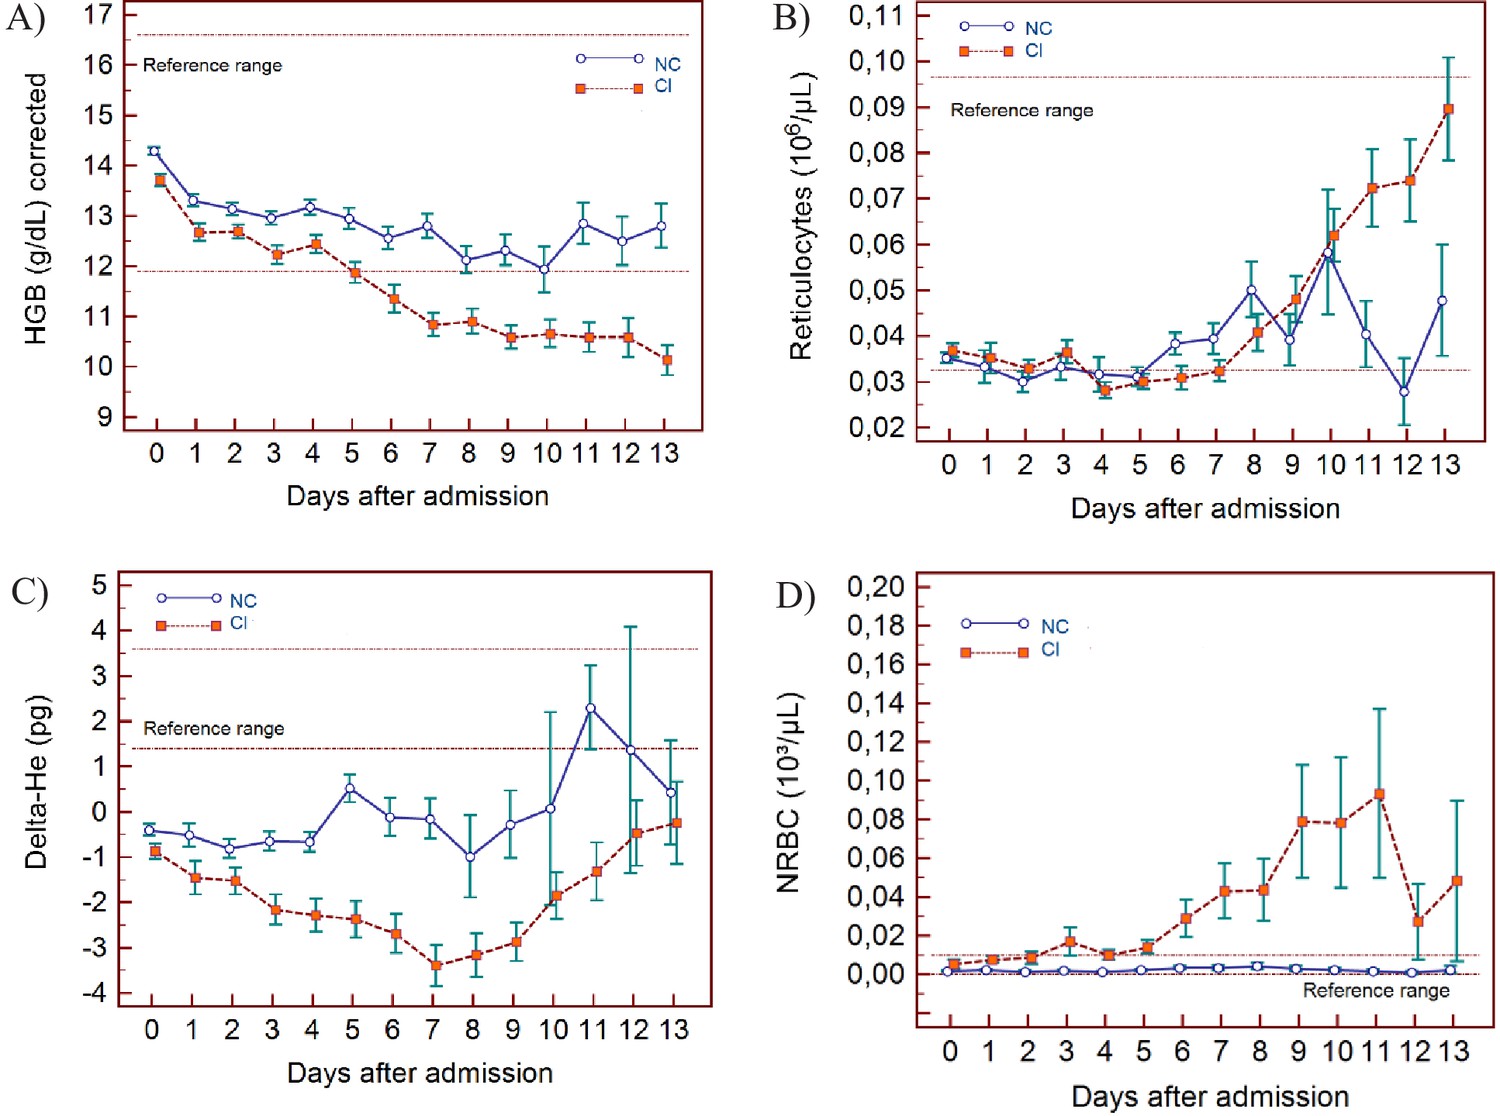
Trends of red blood cell-related parameters over 14 days of hospitalisation in critical illness (C) and non-critical (NC) patients.
Note: 14 days of hospitalisation refers to day 0 (day of admission) plus the first 13 days after admission. The normal reference range is depicted by the area between the dotted horizontal lines. Vertical bars indicate standard error of the mean (SEM). (A) Haemoglobin (HGB) corrected for age and gender, (B) reticulocyte count (RET), (C) difference in haemoglobinisation of reticulocytes and red blood cells (DELTA-He), (D) nucleated red blood cells (NRBC). The number of sample measurements available per day for the trend analysis for the parameters plotted per patient group are shown in Figure 6—source data 1.
-
Figure 6—source data 1
Source data for number of measurements for each day of hospitalisation that were available per patient group for the trends of red blood cell-related parameters over 14 days of hospitalisation.
- https://cdn.elifesciences.org/articles/63195/elife-63195-fig6-data1-v2.xlsx
-
Figure 6—source data 2
Source data for trends of corrected haemoglobin values over 14 days of hospitalisation in critical illness (CI) and non-critical (NC) patients.
- https://cdn.elifesciences.org/articles/63195/elife-63195-fig6-data2-v2.csv
-
Figure 6—source data 3
Source data for trends of absolute reticulocyte count over 14 days of hospitalisation in critical illness (CI) and non-critical (NC) patients.
- https://cdn.elifesciences.org/articles/63195/elife-63195-fig6-data3-v2.csv
-
Figure 6—source data 4
Source data for trends of Delta-He values over 14 days of hospitalisation in critical illness (CI) and non-critical (NC) patients.
- https://cdn.elifesciences.org/articles/63195/elife-63195-fig6-data4-v2.csv
-
Figure 6—source data 5
Source data for trends of nucleated red blood cell counts over 14 days of hospitalisation in critical illness (CI) and non-critical (NC) patients.
- https://cdn.elifesciences.org/articles/63195/elife-63195-fig6-data5-v2.csv
Figure 7
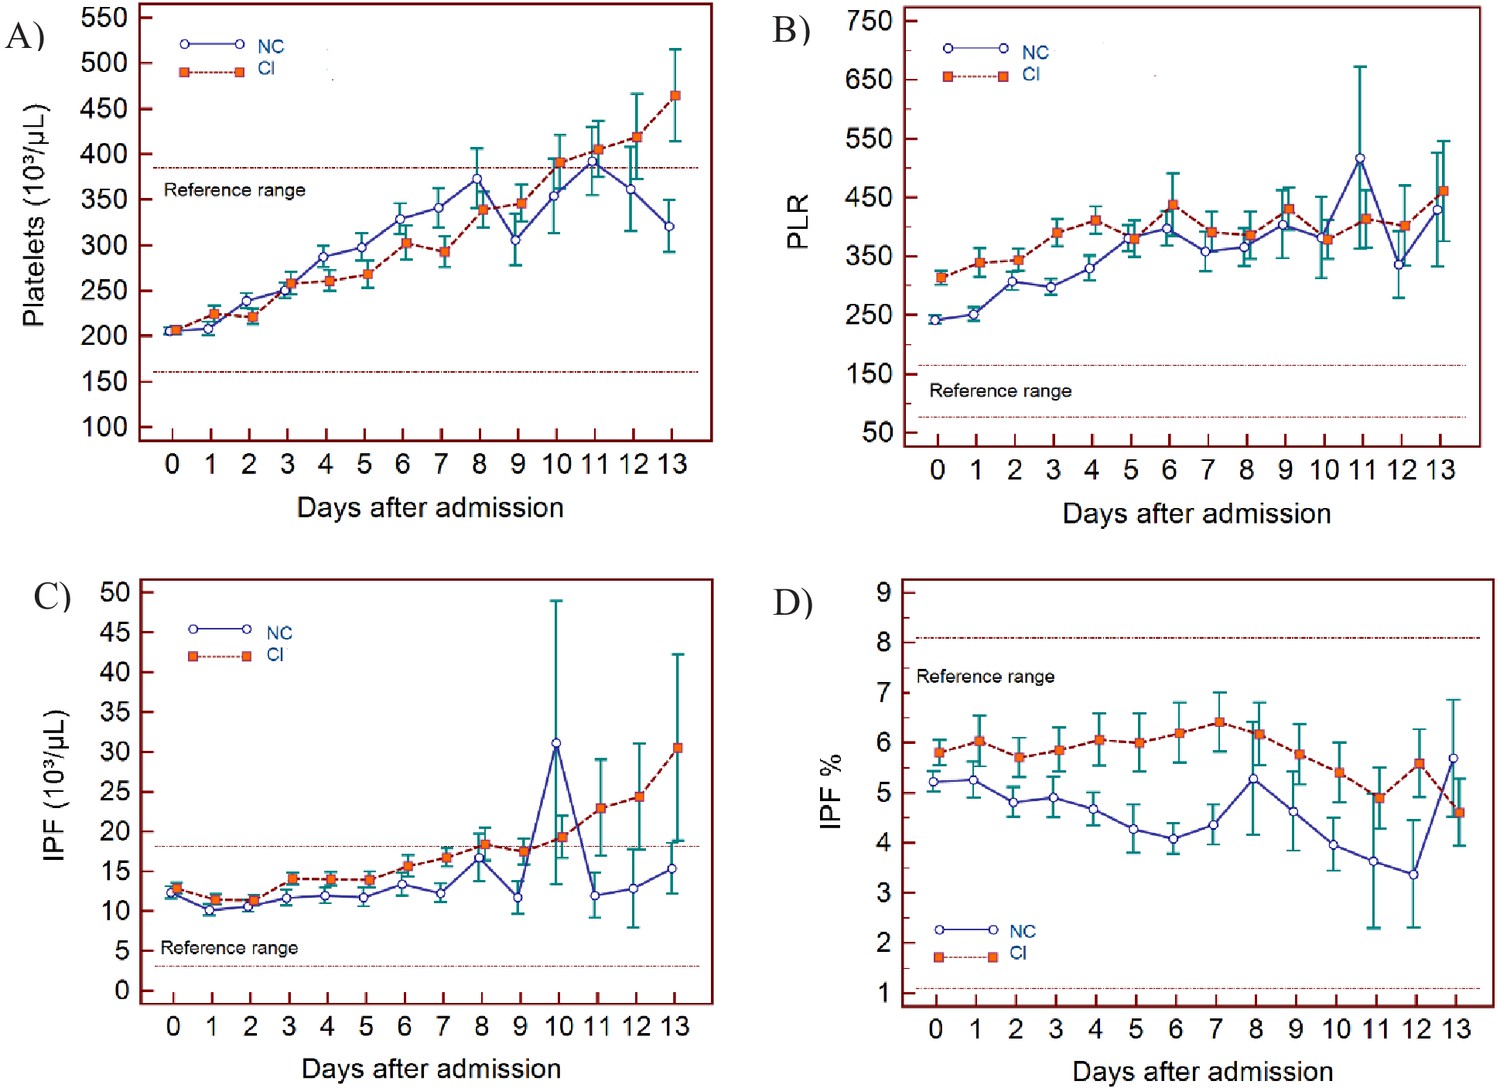
Trends of platelet parameters over 14 days of hospitalisation in critical illness (CI) and non-critical (NC) patients.
Note: 14 days refers to day 0 (day of admission) plus the first 13 days after admission. The normal reference range is depicted by the area between the dotted horizontal lines. Vertical bars indicate standard error of the mean (SEM). (A) Platelet count (PLT), (B) platelet-to-lymphocyte ratio (PLR), (C) immature platelet count (IPF#) (D) immature platelet fraction (IPF%). The number of sample measurements available per day for the trend analysis for the parameters plotted per patient group are shown in Figure 7—source data 1.
-
Figure 7—source data 1
Source data for number of measurements for each day of hospitalisation that were available per patient group for the trends of platelet parameters over 14 days of hospitalisation.
- https://cdn.elifesciences.org/articles/63195/elife-63195-fig7-data1-v2.xlsx
-
Figure 7—source data 2
Source data for trends of platelet count over 14 days of hospitalisation in critical illness (CI) and non-critical (NC) patients.
- https://cdn.elifesciences.org/articles/63195/elife-63195-fig7-data2-v2.csv
-
Figure 7—source data 3
Source data for trends of platelet-to-lymphocyte count ratio over 14 days of hospitalisation in critical illness (CI) and non-critical (NC) patients.
- https://cdn.elifesciences.org/articles/63195/elife-63195-fig7-data3-v2.csv
-
Figure 7—source data 4
Source data for trends of absolute immature platelet count (IPF#) over 14 days of hospitalisation in critical illness (CI) and non-critical (NC) patients.
- https://cdn.elifesciences.org/articles/63195/elife-63195-fig7-data4-v2.csv
-
Figure 7—source data 5
Source data for trends of immature platelet fraction (IPF%) over 14 days of hospitalisation in critical illness (CI) and non-critical (NC) patients.
- https://cdn.elifesciences.org/articles/63195/elife-63195-fig7-data5-v2.csv
Figure 8
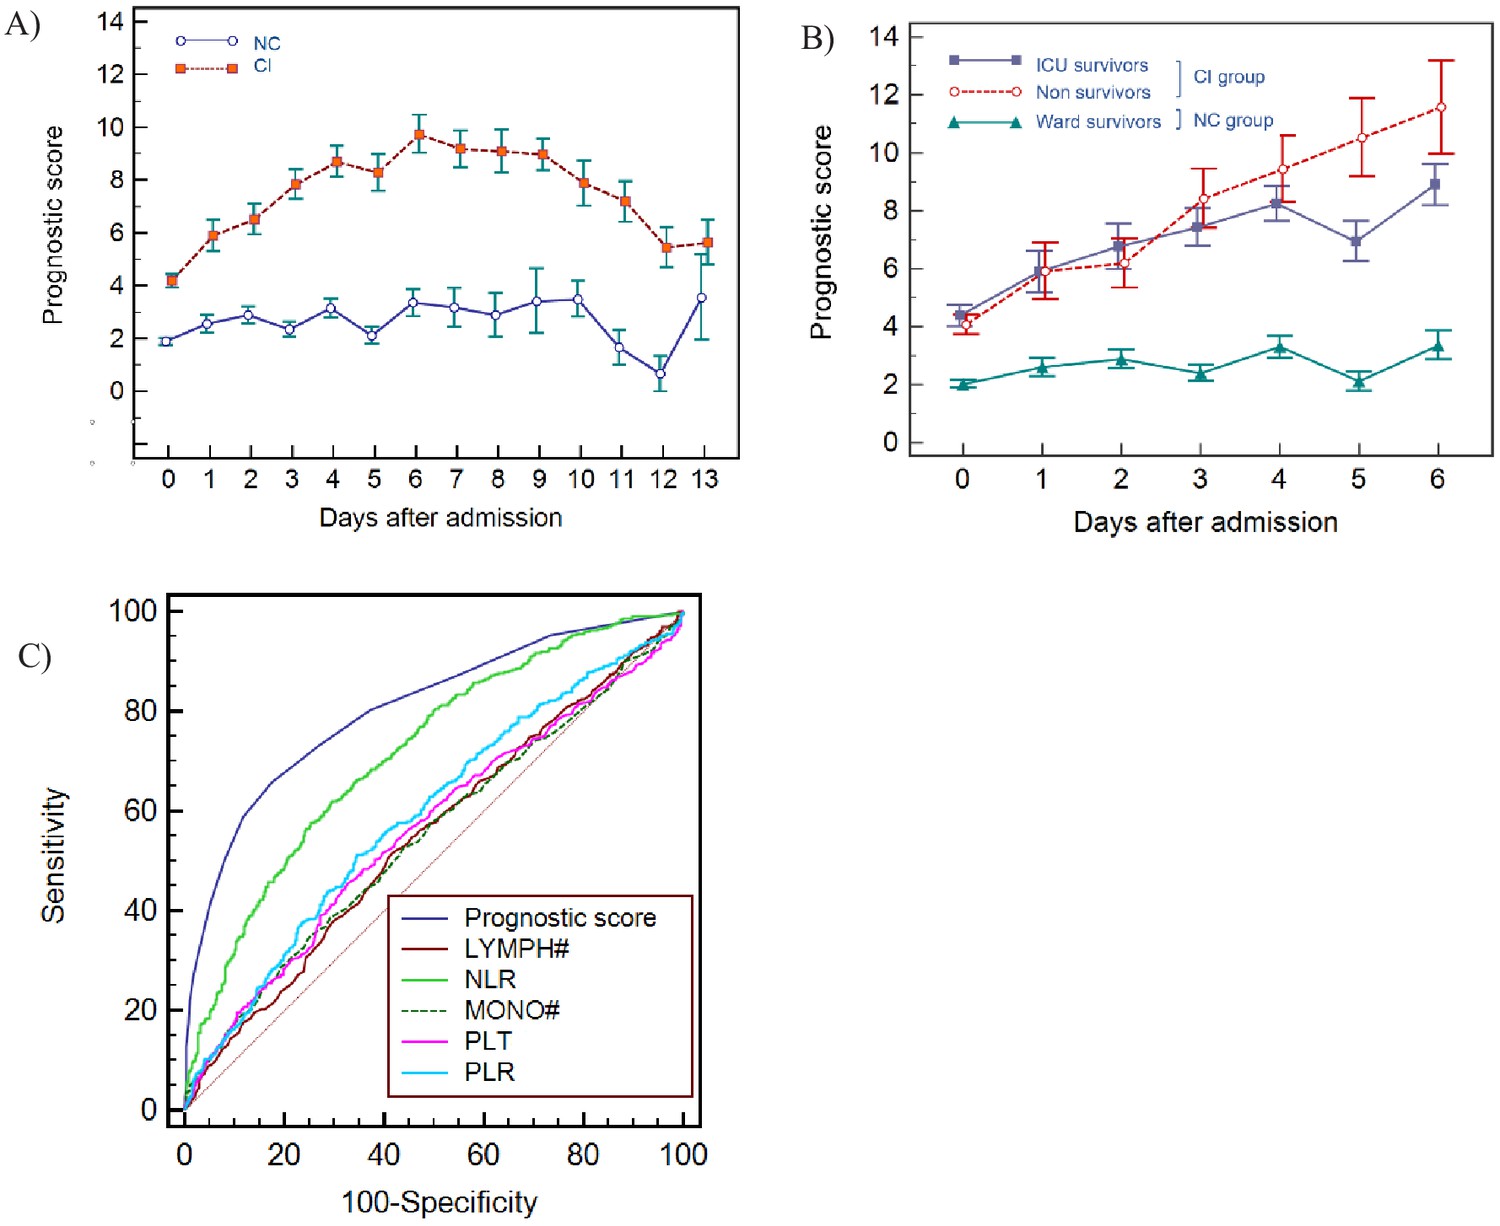
Haemocytometric COVID-19 prognostic score prediction of clinical severity in the development cohort.
(A) Development cohort prognostic score 14-day hospitalisation time horizon (day of admission plus the first 13 days thereafter) comparing non-critical (NC) and critical illness (CI) groups. Points shown are mean values with vertical bars representing SEM (B) development cohort prognostic score 7-day hospitalisation time horizon comparing outcomes for the critical illness group (recovered with ICU or died) and the non-critical group (recovered without ICU). Points shown are mean values with vertical bars representing SEM, (C) ROC curve to compare the capability of prediction of critical illness disease progression of the prognostic score, absolute lymphocyte count (LYMPH#), neutrophil-to-lymphocyte ratio (NLR), absolute monocyte count (MONO#), platelet count (PLT) and platelet-to-lymphocyte ratio (PLR) for development cohort incorporating all measurements over the initial 14-day period of hospitalisation. The number of measurements for each day of hospitalisation that were available per patient group are shown in Figure 8—source data 1. There were markedly fewer measurements for the second week, notably in the NC group which may have contributed to bias.
-
Figure 8—source data 1
Source data for number of measurements for each day of hospitalisation that were available per patient group for prognostic score prediction of clinical severity in the development cohort.
- https://cdn.elifesciences.org/articles/63195/elife-63195-fig8-data1-v2.xlsx
-
Figure 8—source data 2
Source data for development cohort prognostic score 14-day hospitalisation time horizon (day of admission plus the first 13 days thereafter) comparing non-critical (NC) and critical illness (CI) groups.
- https://cdn.elifesciences.org/articles/63195/elife-63195-fig8-data2-v2.csv
-
Figure 8—source data 3
Source data for development cohort prognostic score 7-day hospitalisation time horizon comparing outcomes (recovered without ICU, recovered with ICU or died).
- https://cdn.elifesciences.org/articles/63195/elife-63195-fig8-data3-v2.csv
-
Figure 8—source data 4
Source data for ROC curves to assess the capability of prediction of critical illness disease progression of the prognostic score, absolute lymphocyte count (LYMPH), neutrophil-to-lymphocyte ratio (NLR), absolute monocyte count (MONO), platelet count (PLT), and platelet-to-lymphocyte ratio (PLR) for development cohort incorporating all measurements over the initial 14-day period of hospitalisation.
- https://cdn.elifesciences.org/articles/63195/elife-63195-fig8-data4-v2.csv
Figure 9
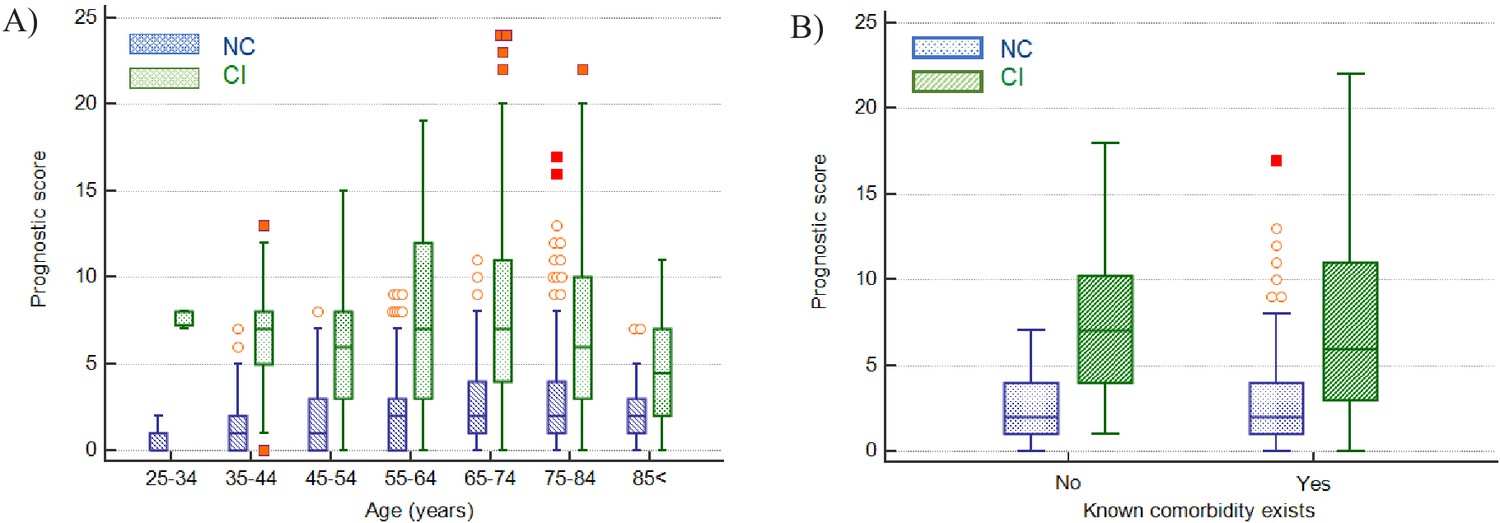
Impact of age and presence of comorbidities on prediction of disease severity.
(A) Box and whisker plots of prognostic score values for NC and CI groups segregated by age. The prognostic score can predict severity independent of age, therefore potentially assisting in identifying young patients at risk for severe disease progression as well as older patients not at risk. (B) Box and whisker plots of prognostic score values for NC and CI groups segregated by comorbidities in the 75-84-year-old group, as an illustrative example. The prognostic score is significantly higher in patients with severe disease progression independent of the presence of comorbidities. Please refer to Table 6 for more detailed information on all age groups.
-
Figure 9—source data 1
Impact of age on prediction of disease severity.
- https://cdn.elifesciences.org/articles/63195/elife-63195-fig9-data1-v2.csv
Figure 10
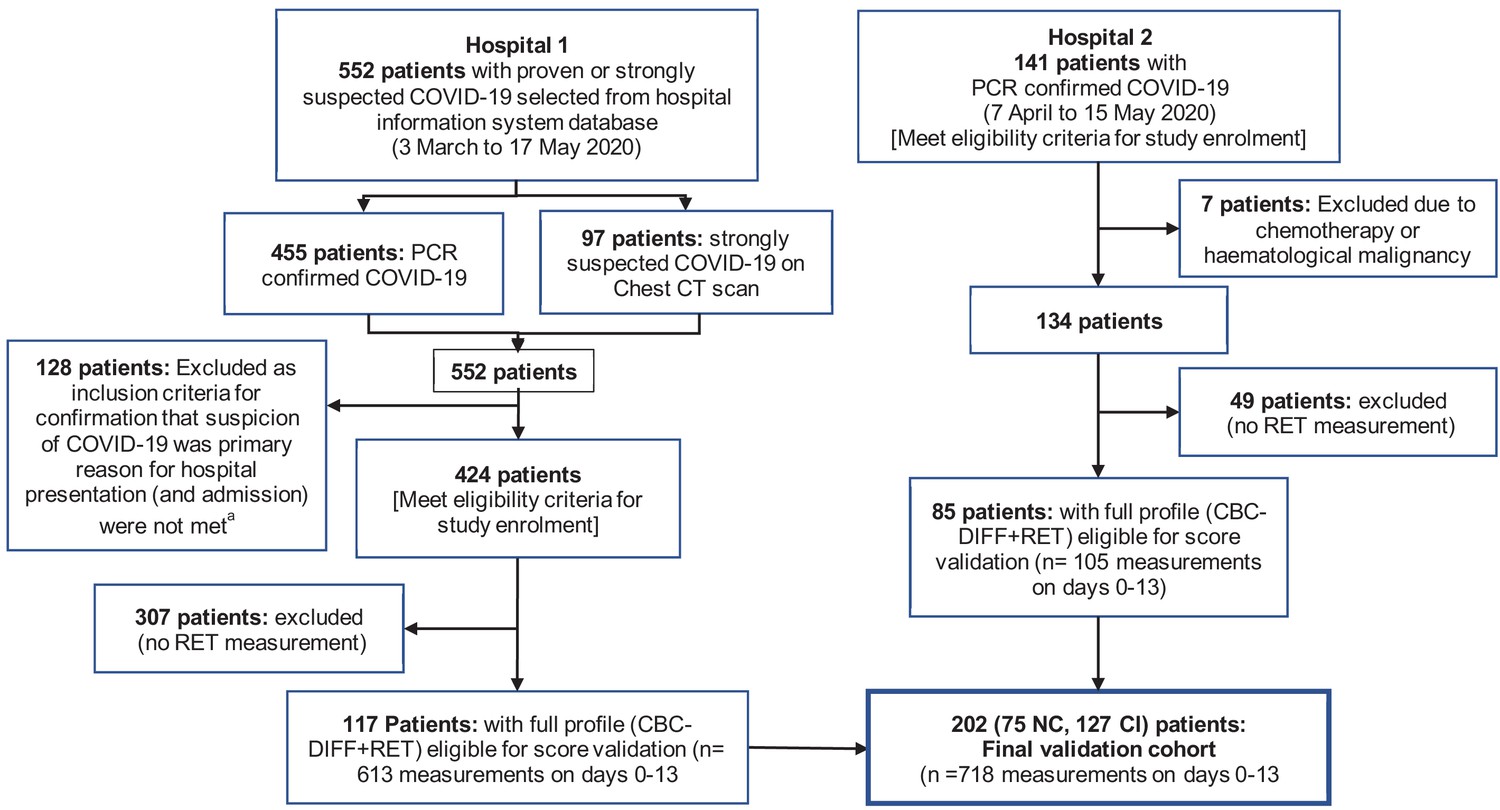
Flow chart showing inclusion and exclusion of validation cohort patient.
Abbreviations: NC, non-critical patient group; CI, critical illness patient group. (a) The following criteria were used to ensure selection of only those patients for whom the primary presentation at hospital was related to COVID-19: Emergency department location on day 0, provisional diagnosis of pneumonia, if admitted, with admission to a general ward, internal medicine, ICU or anaesthesia (critical care).
Figure 11
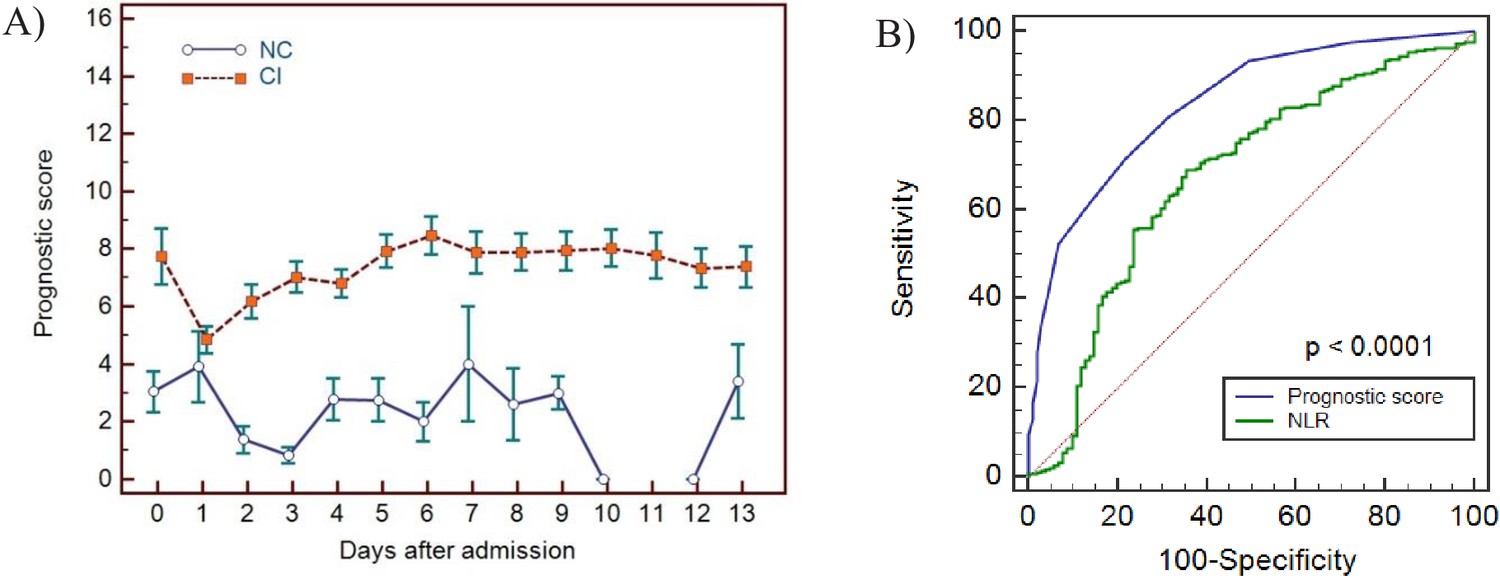
Haemocytometric COVID-19 prognostic score prediction of clinical severity in the validation cohort.
(A) Validation cohort prognostic score 14-day hospitalisation time horizon comparing non-critical (NC) and critical illness (CI) groups, (B) ROC curve comparisons of prognostic score and NLR over 14 days. The prognostic score AUC (0.838, 95%CI 0.809-0.864) was significantly higher (P<0.0001) than the NLR AUC (0.673,95% CI 0.637-0.707). The number of measurements for each day of hospitalisation that were available per patient group are shown in Figure 11—source data 1. Overall, there were relatively few measurements per day for the NC group which has contributed to greater variance per time point.
-
Figure 11—source data 1
Source data for number of measurements for each day of hospitalisation that were available per patient group for prognostic score prediction of clinical severity in the validation cohort.
- https://cdn.elifesciences.org/articles/63195/elife-63195-fig11-data1-v2.xlsx
-
Figure 11—source data 2
Source data for haemocytometric COVID-19 prognostic score prediction of clinical severity in the validation cohort over 14 day hospitalisation time horizon comparing non-critical (NC) and critical illness (CI) groups.
- https://cdn.elifesciences.org/articles/63195/elife-63195-fig11-data2-v2.csv
-
Figure 11—source data 3
Source data for ROC curve comparisons of prognostic score and NLR over 14 days.
- https://cdn.elifesciences.org/articles/63195/elife-63195-fig11-data3-v2.csv
Figure 12
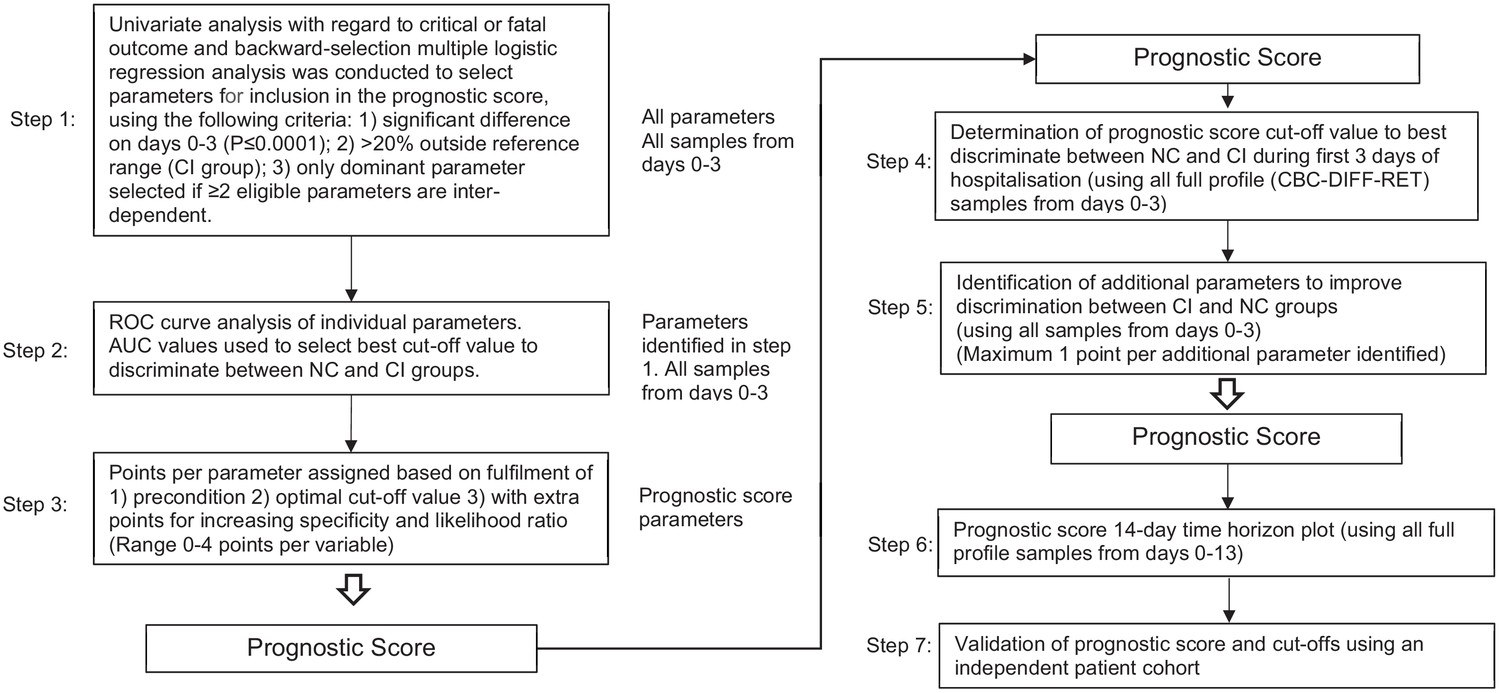
Flow chart illustrating steps involved in prognostic score development.
Abbreviations: NC, non-critical patient group; CI, critical illness patient group; ROC, receiver operating characteristics (curve); AUC, area under the curve.
Tables
Table 1
Basic demographic characteristics of COVID-19 PCR confirmed patients enrolled for prognostic score development.
| Total | Mild | Moderate | Severe | Critical | Fatal | |
|---|---|---|---|---|---|---|
| All patients n [%] | 982 | 64 [6.5] | 198 [20.2] | 323 [32.9] | 144 [14.7] | 253 [25.8] |
| Age Years (range) | 18–96 | 18–96 | 22–91 | 19–93 | 28–88 | 42–95 |
| Age Years (median) | 71 | 59 | 68 | 69,5 | 65 | 79 |
| Females | ||||||
| n [%] | 314 [32.0] | 27 [8.6] | 74 [23.6] | 113 [36.0] | 38 [12.1] | 62 [19.7] |
| Age Years (range) | 18–95 | 18–92 | 22–86 | 19–93 | 28–81 | 56–95 |
| Age Years (median) | 69 | 62 | 67 | 69 | 64 | 79.5 |
| Males | ||||||
| n, [%] | 668 [68.0] | 37 [5.5] | 124 [18.6] | 210 [31.4] | 106 [15.9] | 191 [28.6] |
| Age Years (range) | 26–96 | 35–96 | 30–91 | 26–89 | 32–88 | 42–93 |
| Age Years (median) | 72 | 59 | 68 | 69.5 | 65 | 79 |
| Length of hospitalisation | ||||||
| Days (range) | 0–78 | 0 | 1–5 | 6–46 | 2–78 | 1–44 |
| Days (median) | 6 | 0 | 3 | 10 | 22 | 6 |
| Comorbidities* | ||||||
| Absent† [%] | [27] | [68] | [45] | [35] | [24] | [13] |
| Present‡ [%] | [73] | [32] | [55] | [65] | [76] | [87] |
| Diabetes [%] | [15.9] | [5.5] | [15.0] | [14.9] | [20.5] | [18.2] |
| Hypertension [%] | [12.8] | [1.8] | [7.9] | [14.5] | [17.9] | [13.9] |
| Cardiovascular disorders [%] | [27.6] | [16.3] | [21.3] | [25.6] | [18.8] | [41.6] |
| Respiratory disorders [%] | [12.0] | [5.5] | [8.7] | [12.6] | [12.5] | [14.8] |
| CNS disorders [%] | [4.3] | [3.6] | [3.2] | [4.6] | [1.8] | [6.2] |
| Renal disorders [%] | [4.8] | [1.8] | [3.9] | [5.0] | [5.4] | [5.7] |
| Malignancy [%] | [9.2] | [0] | [9.5] | [8.4] | [9.8] | [12.0] |
| Autoimmune disease [%] | [3.7] | [5.5] | [3.9] | [2.3] | [6.3] | [3.3] |
| Pregnancy [%] | [0.3] | [1.8] | [0.8] | [0] | [0] | [0] |
| Obesity§ [%] | [2.7] | [0] | [3.1] | [3.4] | [1.8] | [2.9] |
| Other¶ [%] | [7.8] | [5.5] | [4.7] | [10.7] | [12.5] | [4.3] |
-
* Occurrence of comorbidities is shown as a relative frequency expressed as a percentage (patients with a comorbidity divided by total number of patients in whom the presence or absence of comorbidities was recorded) as 2 of the participating study centres did not document the presence or absence of comorbidities.
† Absent – comorbidities confirmed to be absent.
-
‡ Present – one or more comorbidities confirmed to be present.
§ Body mass index (BMI) measurements were not undertaken as part of this study. It was also up to the discretion of the physician to document obesity as a comorbidity. As this study was undertaken in the early phase of the pandemic, it may not have been common knowledge to all attending physicians that obesity is significant contributor to adverse outcomes in COVID-19.
-
¶ Other includes gastrointestinal disorders, musculoskeletal disorders, endocrine disorders, lipid disorders, haemochromatosis psoriasis, malnutrition, and Down syndrome.
-
Table 1—source data 1
Source data for basic demographic characteristics of COVID-19 PCR confirmed patients enrolled for prognostic score development.
- https://cdn.elifesciences.org/articles/63195/elife-63195-table1-data1-v2.csv
Table 2
Demographic and first haemocytometric data at hospital presentation or within 3 days after admission.
| Non-critical group (NC) | Critical illness group (CI) | P value | All patients | Reference values healthy volunteers | % abnormal results | |
|---|---|---|---|---|---|---|
| Patients [n] | 557 | 366 | <0.0001 | 923 | ||
| Female [n] | 201 | 91 | <0.0001 | 292 | ||
| Male [n] | 356 | 276 | <0.0001 | 631 | ||
| Age (Years, median) | 65 | 74 | <0.0001 | 68 | ||
| Female [Y, median] | 64 | 73 | 0.0040 | 67 | ||
| Male [Y, median] | 66 | 74 | 0.0010 | 69 | ||
| Female vs. Male in NC [n] [F, M] | [201, 356] | na | ns | na | ||
| Female vs. Male in CI [n] [F, M] | na | [91, 276] | ns | na | ||
| Duration of symptoms [Days, median] | 7 | 7 | ns | 7 | ||
| Haemocytometry | ||||||
| Patients/healthy volunteers, [samples] | 557, [899] | 366, [688] | 923, [1587] | 12782 | ||
| White blood cells findings | Median [95% CI] | Median [95% CI] | P value | Median [95% CI] | Median [95% CI] | % |
| WBC (white blood cell count) [10³/µL] | 5.92 [2.42–13.17] | 7.75 [3.02–18.61] | <0.0001 | 6.43 [2.59–16.10] | 5.84 [3.64–9.61] | 28.4 |
| NEUT (neutrophil count) [10³/µL] | 4.37 [1.39–11.21] | 6.25 [2.17–15.18] | <0.0001 | 4.96 [1.53–13.61] | 3.12 [1.62–5.86] | 41.4 |
| IG (immature granulocyte count) [10³/µL] | 0.04 [0.01–0.26] | 0.06 [0.01–0.67] | <0.0001 | 0.05 [0.01–0.48] | 0.03 [0.01–0.09] | 16.3 |
| LYMPH (lymphocyte count) [10³/µL] | 0.91 [0.35–2.09] | 0.74 [0.26–1.91] | <0.0001 | 0.78 [0.28–2.00] | 1.92 [1.07–3.41] | 70.5 |
| NLR (neutrophil-to-lymphocyte ratio) [ratio] | 4.7 [1.3–17.7] | 8.1 [2.1–39.0] | <0.0001 | 6.0 [1.4–28.5] | 1.6 [0.8–3.6] | 77.1 |
| IGLR (immature granulocyte-to-lymphocyte ratio) [ratio*100] | 3.9 [0.8–36.1] | 7.3 [1.2–69.1] | <0.0001 | 4.8 [0.81–52.7] | 1.8 [0.5–4.8] | 49.4 |
| MONO (monocyte count) [10³/µL] | 0.43 [0.13–1.29] | 0.43 [0.10–1.22] | 0.0172 | 0.42 [0.11–1.27] | 0.48 [0.28–0.83] | 22.8 |
| EO (eosinophil count) [10³/µL] | 0.01 [0.00–0.26] | 0.01 [0.00–0.31] | ns. | 0.01 [0.00–0.29] | 0.16 [0.04–0.47] | 76.6 |
| BASO (basophil count) [10³/µL] | 0.01 [0.00–0.05] | 0.01 [0.00–0.08] | ns. | 0.01 [0.00–0.07] | 0.04 [0.02–0.09] | 56.1 |
| WBC extended parameters | ||||||
| NEUT-RI (neutrophil reactivity index) [FI] | 50.0 [43.9–57.0] | 50.6 [44.2–59.2] | 0.0023 | 50.2 [44.0–58.1] | 46.1 [41.9–50.6] | 47.0 |
| NEUT-GI (neutrophil granularity index) [GI] | 153 [143–163] | 153 [141–163] | ns | 153 [143–163] | 149 [142–157] | 23.2 |
| RE-LYMPH (reactive lymphocytes as % of lymphocytes) [% of lymph] | 9.9 [2.6–23.6] | 10.0 [2.4–28.9] | <0.0001 | 10.5 [2.5–26.3] | 3.3 [1.3–7.6] | 73.3 |
| AS-LYMPH (antibody-synthesising lymphocytes as % of lymphocytes) [% of lymph] | 3.6 [0.0–13.2] | 4.2 [0.0–19.8] | <0.0001 | 3.8 [0.0–17.4] | 0.0 [0.0–0.0] | 90.4 |
| RE-MONO (reactive monocytes as % of monocytes) [% of mono] | 2.5 [0.2–17.9] | 3.9 [0.0–30.0] | <0.0001 | 3.0 [0.3–22.7] | 0.0 [0.0–4.3] | 37.3 |
| Red blood cells findings | ||||||
| HGB (haemoglobin) [g/dL] | 13.4 [9.6–16.3] | 12.9 [8.4–16.5] | <0.0001 | 13.2 [8.9–16.3] | 14.1 [11.9–16.6] | 26.5 |
| RBC (red blood cell count) [106/µL] | 4.8 [3.10–5.54] | 4.31 [2.90–5.62] | <0.0001 | 4.42 [3.00–5.58] | 4,73 [3.99–5.60] | 26.8 |
| MCV (mean cell volume) [fL] | 89.1 [78.3–101.6] | 90.2 [77.9–103.0] | ns | 89.5 [78.3–101.9] | 90.1 [82.5–97.8] | 14.2 |
| RET (reticulocyte count) [10³/µL] | 30.2 [14.1–80.0] | 30.0 [13.9–95.6] | ns | 30.1 [14.1–89.5] | 57.5 [32.6–96.6] | 55.5 |
| NRBC (nucleated red blood cell count) [/µL] | 0 [0–10] | 0 [0–60] | <0.0001 | 0 [0–30] | 0 [0–10] | 46 |
| RET-He (reticulocyte haemoglobin equivalent) [pg] | 30.2 [23.6–35.5] | 29.4 [22.9–34.8] | ns | 29.9 [23.1–35.2] | 32.8 [29.4–35.4] | 44.4 |
| RBC extended parameters | ||||||
| DELTA-He (difference in reticulocyte and RBC haemoglobin content) [pg] | −0.5 [−4.8–3.1] | −1.2 [−7.0–3.1] | <0.0001 | −0.7 [−5.9–3.1] | 2.6 [1.4–3.6] | 85.7 |
| MICRO-R (% of RBC that are microcytic) [%] | 1.5 [0.4–8.5] | 1.5 [0.4–10.0] | ns | 1.5 [0.4–9.5] | 1.1 [0.3–4.2] | 9.9 |
| HYPO-He (% of RBC that are hypochromic) [%] | 0.2 [0.1–2.0] | 0.3 [0.1–2.6] | <0.0001 | 0.2 [0.1–2.5] | 0.1 [0.0–0.5] | 21.9 |
| Platelet findings | ||||||
| PLT (platelet count) [10³/µL] | 199 [96–451] | 205 [64–435] | ns | 201 [79–446] | 256 [161–385] | 32.7 |
| IPF% (immature platelet fraction) [%] | 4.3 [1.7–12.9] | 4.9 [2.0–5.9] | ns | 4.5 [1.7–14.2] | 3.0 [1.1–8.1] | 14.6 |
| PLT extended parameters | ||||||
| IPF# (absolute immature platelet count) [10³/µL] | 9.4 [3.6–30.9] | 11.2 [3.5–28.7] | 0.0001 | 10.2 [3.5–29.6] | 7.9 [3.1–18.1] | 15.4 |
-
Note: The expanded name of the haemocytometric parameters is shown in brackets in italics. The unit of measure for each parameter is shown in square brackets. A more detailed explanation of the haemocytometric parameters is provided in Table 7 .
Abbreviations: na, not applicable; ns, not significant.
-
Table 2—source data 1
Source data for demographic and first haemocytometric data available for patients at hospital presentation or within 3 days after admission.
- https://cdn.elifesciences.org/articles/63195/elife-63195-table2-data1-v2.csv
Table 3
Haemocytometric COVID-19 prognostic score cut-off values.
| Variable | Precondition | 1 Point | 2 Points | 3 Points | 4 Points | |
|---|---|---|---|---|---|---|
| Primary Variables | IG/L*100 | IG* ≥ 0,09 | ≥10 | ≥20 | ≥40 | ≥45 |
| NLR | none | [<7,7 and LYMPH† < 1,07 and N/L²≥7,5] or [≥7,7 < 16,5 and LYMPH† < 0,65] | [≥7,7 < 16,5 and LYMPH† ≥ 0,65] | [≥7,7 < 16,5 and LYMPH† ≥ 1,07] | ≥16,5 | |
| RE-MONO/M [%] | none | [≥5 < 15 and RE-MONO‡ < 0,03] | [≥5 < 15 and Re-MONO‡ ≥ 0,03] | n/a | ≥15 | |
| AS-LYMPH/L [%] | none | [≥5 and LYMPH§ < 10] | ≥10 | n/a | ≥15 | |
| DELTA-He [pg] | RET¶ ≥ 6.0 | [< −1 ≥ −2] or [<0,4 ≥ −1 and RET¶ ≥ 20.0] | [< −2 ≥ −4] | n/a | < −4 | |
| NRBC [/µL] | HGB** ≥ 9 and RET¶ < 90 | n/a | ≥ 20 | n/a | ≥40 | |
| Secondary Variables | HGB [g/dl] | none | ≥17 | |||
| HYPO-He [%] | Micro-R†† < 10 | ≥1,9 | ||||
| PLT [10³/µL] | none | <85 | ||||
| IPF# [10³/µL] | none | ≥25 |
-
Note: For the primary variables, one point = value above the cut-off value for the best AUC; two points = value above the cut-off value for the best AUC and ≥80% specificity; three points = value above the cut-off value for the best AUC and >90% specificity; and four points = value above the cut-off value for the best AUC and >95% specificity. The cut-off values for the secondary variables were chosen exclusively based on observed extremes of values in critical disease, with the maximum award of 1 point per variable.
The prognostic score values were calculated automatically using a pre-set algorithm, using the above cut-off values to assign points per individual parameter. The aim is to have the formula for the calculation incorporated into the Laboratory Information System software in use in individual laboratories.
-
Abbreviations: IGLR, immature granulocytes-to-lymphocyte ratio; NLR, neutrophil-to-lymphocyte ratio; AS-LYMPH%/L, antibody synthesising lymphocytes as a proportion of lymphocytes; RE-MONO%/M, reactive monocytes as a proportion of monocytes; DELTA-He, difference in haemoglobinisation of reticulocytes and red blood cells; NRBC, absolute nucleated red blood cell count; HGB, haemoglobin; HYPO-He, percentage of red blood cells that are hypochromic; PLT, platelet count; IPF, absolute immature platelet count; N/L2, neutrophil-to-lymphocyte squared ratio.
* Unit of measure for IG (absolute immature granulocyte count) is x 103/µL.
-
† Unit of measure for LYMPH (absolute lymphocyte count) is x 103/µL.
‡ Unit of measure for RE-MONO (absolute reactive monocyte count) is x 103/µL.
-
§ Unit of measure for LYMPH% (percentage lymphocyte count).
¶ Unit of measure for RET (absolute reticulocyte count) is x 103/µL.
-
** Unit of measure for HGB (haemoglobin) is g/dL.
†† Unit of measure for Micro-R is %.
Table 4
Development cohort prognostic score values by day based on clinical severity group, initial management, and outcome.
| Not hospitalised | Hospitalised with admission to a general ward on day of initial presentation (non-ICU) | Hospitalised with admission directly to ICU on day of initial presentation | ||||||||
|---|---|---|---|---|---|---|---|---|---|---|
| day | Mild Median score* | n | Recovered Median score* | n | Died Median score* | n | Recovered Median score* | n | Died Median score* | n |
| 0 | 0.5 (0.0–1.0) | 34 | 1.0 (1.0–2.0) | 243 | 3.0 (2.0–4.0) | 86 | 4.0 (3.0–6.0) | 70 | 4.0 (2.6–8.4) | 21 |
| 1 | 2.0 (1.5–3.0) | 59 | 4.0 (1,5–6.7) | 15 | 6.5 (3.0–9.3) | 24 | 7.0 (1.5–14,1) | 10 | ||
| 2 | 2.0 (1.0–3.0) | 96 | 5.0 (4.0–6.0) | 23 | 7.0 (6.0–8.9) | 37 | 12.5 (1.8–16.6) | 8 | ||
| 3 | 2.0 (1.0–3.0) | 75 | 5.0 (4.4–7.6) | 16 | 8.0 (7.0–9.0) | 31 | 12.5 (7.8–18.3) | 8 | ||
| 4 | 3.0 (2.0–4.0) | 59 | 7.0 (6.0–8.7) | 15 | 8.0 (6.0–10.8) | 30 | 15.0 (3.8–20.4) | 8 | ||
| 5 | 2.0 (1.0–3.0) | 37 | 12.0 (6.5–14.9) | 13 | 6.5 (4.8–8.3) | 34 | 7.0 (0.8–19.1) | 8 | ||
| 6 | 3.0 (2.0–4.0) | 37 | 11.0 (6.1–14.8) | 9 | 9.0 (7.0–11.0) | 29 | 14.0 (na†) | 5 | ||
| 7 | 2.0 (0.3–6.7) | 23 | 11.0 (5.2–15.4) | 6 | 8.0 (6.0–11.2) | 29 | 8.0 (5.8–12.4) | 11 | ||
-
Note: Recovered refers to patients that survived and were discharged from hospital. By definition, ‘Mild’ patients are not hospitalised and therefore only day 0 prognostic score values are available.
* Median score refers to the median value obtained for the haemocytometric COVID-19 prognostic score for the patient group for patients with the same length of hospitalisation on the day of measurement. Values in brackets represent the 95% CI for the median.
-
† Sample size was too small to calculate 95% CI.
-
Table 4—source data 1
Source data for development cohort prognostic score values by day based on clinical severity group, initial management, and outcome.
- https://cdn.elifesciences.org/articles/63195/elife-63195-table4-data1-v2.csv
Table 5
Receiver Operator Characteristics (ROC) curve comparisons between the haemocytometric COVID-19 prognostic score versus other parameters.
| Prognostic score | LYMPH (x10³/µL) | NLR | MONO (x10³/µL) | PLT (x10³/µL) | PLR | |
|---|---|---|---|---|---|---|
| Day* < 4 [n† = 859] | ||||||
| [AUC] | 0.753 | 0.591 | 0.709 | 0.516 | 0.537 | 0.602 |
| [95% CI] | 0.723 to 0.781 | 0.558 to 0.624 | 0.678 to 0.740 | 0.482 to 0.550 | 0.503 to 0.570 | 0.568 to 0.635 |
| [cut-off value] | >3 | <0.810 | >7.7 | <0.400 | >234 | >308 |
| [P value vs prognostic score] | na | <0.0001 | 0.0066 | <0.0001 | <0.0001 | <0.0001 |
| Day < 14 [n = 1423] | ||||||
| [AUC] | 0.806 | 0.55 | 0.718 | 0.551 | 0.563 | 0.591 |
| [95% CI] | 0.784 to 0.826 | 0.523 to 0.576 | 0.694 to 0.741 | 0.525 to 0.577 | 0.537 to 0.589 | 0.565 to 0.617 |
| [cut-off value] | >4 | <0.810 | >7.1 | >0.640 | >268 | >308 |
| [P value vs prognostic score] | na | <0.0001 | <0.0001 | <0.0001 | <0.0001 | <0.0001 |
| Day 0 [n = 454] | ||||||
| [AUC] | 0.722 | 0.603 | 0.683 | 0.506 | 0.537 | 0.605 |
| [95% CI] | 0.678 to 0.763 | 0.556 to 0.648 | 0.638 to 0.726 | 0.459 to 0.553 | 0.490 to 0.584 | 0.558 to 0.650 |
| [cut-off value] | >3 | <0.780 | >7.6 | >0.700 | >234 | >375 |
| [P value vs prognostic score] | na | 0.0001 | 0.0660 | <0.0001 | <0.0001 | 0.0001 |
| Day 1 [n = 109] | ||||||
| [AUC] | 0.737 | 0.557 | 0.664 | 0.511 | 0.555 | 0.602 |
| [95% CI] | 0.644 to 0.817 | 0.459 to 0.652 | 0.567 to 0.751 | 0.413 to 0.608 | 0.457 to 0.651 | 0.504 to 0.695 |
| [cut-off value] | >4 | <0.620 | >11.6 | >0.180 | >218 | >358 |
| [p value vs. prognostic score] | na | 0.0036 | 0.1132 | 0.0012 | 0.0045 | 0.0265 |
| Day 2 [n = 164] | ||||||
| [AUC] | 0.739 | 0.572 | 0.714 | 0.575 | 0.515 | 0.526 |
| [95% CI] | 0.665 to 0.804 | 0.492 to 0.649 | 0.638 to 0.782 | 0.495 to 0.652 | 0.436 to 0.594 | 0.446 to 0.604 |
| [cut-off value] | >4 | <1.020 | >5.1 | <0.470 | <118 | >217 |
| [P value vs prognostic score] | na | 0.0006 | 0.4780 | 0.0026 | <0.0001 | 0.0001 |
| Day 3 [n = 132] | ||||||
| [AUC] | 0.875 | 0.602 | 0.827 | 0.501 | 0.582 | 0.647 |
| [95% CI] | 0.806 to 0.926 | 0.514 to 0.686 | 0.751 to 0.887 | 0.413 to 0.590 | 0.493 to 0.667 | 0.559 to 0.728 |
| [cut-off value] | >3 | <0.810 | >7,3 | <0.680 | >255 | >280 |
| [p value vs prognostic score] | na | <0.0001 | 0.1860 | <0.0001 | <0.0001 | <0.0001 |
| Day 4 [n = 112] | ||||||
| [AUC] | 0.867 | 0.604 | 0.778 | 0.572 | 0.531 | 0.583 |
| [95% CI] | 0.790 to 0.924 | 0.507 to 0.695 | 0.690 to 0.851 | 0.475 to 0.665 | 0.434 to 0.626 | 0.486 to 0.676 |
| [cut-off value] | >4 | <0.710 | >7.7 | <0.270 | <238 | >330 |
| [p value vs prognostic score] | na | <0.0001 | 0.0070 | <0.0001 | <0.0001 | <0.0001 |
| Day 5 [n = 92] | ||||||
| [AUC] | 0.877 | 0.578 | 0.753 | 0.578 | 0.599 | 0.506 |
| [95% CI] | 0.792 to 0.936 | 0.471 to 0.680 | 0.652 to 0.837 | 0.470 to 0.680 | 0.492 to 0.700 | 0.400 to 0.612 |
| [cut-off value] | >4 | <1.140 | >6.5 | <0.580 | <227 | <350 |
| [p value vs prognostic score] | na | <0.0001 | 0.0030 | <0.0001 | <0.0001 | <0.0001 |
| Day 6 [n = 80] | ||||||
| [AUC] | 0.875 | 0.517 | 0.688 | 0.511 | 0.589 | 0.545 |
| [95% CI] | 0.782 to 0.938 | 0.403 to 0.630 | 0.575 to 0.787 | 0.397 to 0.625 | 0.474 to 0.698 | 0.430 to 0.657 |
| [cut-off value] | >4 | <1.620 | >7.0 | >0.640 | <277 | <153 |
| [p value vs prognostic score] | na | <0.0001 | <0.0001 | <0.0001 | <0.0001 | <0.0001 |
| Day 7 [n = 100] | ||||||
| [AUC] | 0.856 | 0.633 | 0.724 | 0.561 | 0.596 | 0.549 |
| [95% CI] | 0.772 to 0.918 | 0.531 to 0.727 | 0.625 to 0.808 | 0.458 to 0.660 | 0.493 to 0.693 | 0.446 to 0.649 |
| [cut-off value] | >3 | <0.940 | >4.7 | <0.310 | <298 | >311 |
| [p value vs prognostic score] | na | 0.0002 | 0.0044 | <0.0001 | <0.0001 | <0.0001 |
-
Note:”Prognostic score’ refers to the haemocytometric COVID-19 prognostic score comprised of NLR, IGLR, RE-MONO%/M, AS-LYMPH%/L, DELTA-He, NRBC, HGB, Hypo-He, PLT, and IPF#.
Abbreviations: NLR, neutrophil-to-lymphocyte ratio; IGLR, immature granulocyte-to-lymphocyte ratio; RE-MONO%/M, reactive monocytes as percentage of total monocyte count; AS-LYMPH%/L, antibody-synthesising lymphocytes as percentage of total lymphocyte count; DELTA-He, difference in haemoglobinisation of reticulocytes and red blood cells; NRBC, absolute nucleated red blood cell count; HGB, haemoglobin; Hypo-He, percentage of red blood cells that are hypochromic; PLT, platelet count; IPF#, absolute immature platelet count; LYMPH, absolute lymphocyte count; MONO, absolute monocyte count; PLR, platelet-to-lymphocyte ratio; AUC, area under the curve; CI, confidence interval; na, not applicable.
-
* ‘Day’ refers to the number of days of hospitalisation of patient at time of blood sample measurement. Day 0 refers to the day of first presentation at hospital.
† ‘n’ refers to the number of complete profile (complete blood and differential count and reticulocyte channel) sample measurements available at a particular time point and included in the ROC curve analysis.
-
Table 5—source data 1
Source data for Receiver Operator Characteristics (ROC) curve comparisons between the haemocytometric COVID-19 prognostic score versus other parameters.
- https://cdn.elifesciences.org/articles/63195/elife-63195-table5-data1-v2.csv
Table 6
Mann-Whitney test for significance of the difference in prognostic score between critical illness (CI) and non-critical (NC) patients.
| Age range (years) | 25-34† | 35–44 | 45–54 | 55–64 | 65–74 | 75–84 | >84 |
|---|---|---|---|---|---|---|---|
| CI vs NC | p=0.0030 | p<0.0001 md = 7 | p<0.0001 md = 6 | p<0.0001 md = 4 | p<0.0001 md = 5 | p<0.0001 md = 3 | p=0.0006 md = 2 |
| CI vs NC with reported comorbidities* | Sample size insufficient | p=0.0046 md = 5 | p=0.0094 md = 3 | p<0.0001 md = 5 | p<0.0001 md = 5 | p<0.0001 md = 4 | p=0.0748 md=2‡ |
| CI vs NC with comorbidities* reported as ‘none’ | Sample size insufficient | p=0.0011 md = 7 | p<0.0001 md = 5 | p<0.0001 md = 4 | p=0.0305 md = 2 | p<0.0001 md = 5 | p=0.0339 md = 3 |
-
Note: The data is shown per age group for all patients as well as for patients segregated according to the presence or absence of reported comorbidities. ‘md’ refers to the Hodges-Lehmann median difference in prognostic score values between the NC and CI groups in each age category.
* Patients that were enrolled into the study from the two hospitals that did not report on comorbidities were excluded from the analysis.
-
† Sample size was too small for analysis in this age group segregated by comorbidities.
‡ Patients older than 84 years and with reported comorbidities were the only group where the difference between CI and NC groups was not significant.
-
Table 6—source data 1
Mann–Whitney test for significance of the difference in prognostic score between critical illness (CI) and non-critical (NC) patients.
- https://cdn.elifesciences.org/articles/63195/elife-63195-table6-data1-v2.csv
Table 7
Sysmex XN-1000 haematology analyser parameters used in this study.
| Parameter name | Standard parameters* | Parameter description | Measurement profile |
|---|---|---|---|
| AS-LYMPH | Antibody synthesising lymphocyte count (this is a subset of RE-LYMPH) | CBC-DIFF | |
| AS-LYMPH% | Antibody-synthesising lymphocyte percentage of total white blood cell count | CBC-DIFF | |
| AS-LYMPH%/L | Antibody-synthesising lymphocytes as a percentage of lymphocytes | CBC-DIFF | |
| BASO | Yes | Basophil count | CBC-DIFF |
| Delta-He | Standard parameter calculated by the equation RET-He minus RBC-He | RET | |
| EO | Yes | Eosinophil count | CBC-DIFF |
| HCT | Yes | Haematocrit | CBC-DIFF |
| HGB | Yes | Haemoglobin concentration | CBC-DIFF |
| HYPO-He | The ratio of the count in the low-level area of the forward scattered light signal in the RBC area of the RET scattergram, to mature red blood cells (% of hypochromic red blood cells of total red blood cells) | RET | |
| IG | Immature granulocyte count | CBC-DIFF | |
| IPF | Immature platelet fraction (% of immature platelets of total platelet count) | RET (PLT-F)† | |
| IPF# | Immature platelet fraction count (immature platelet absolute count) | RET (PLT-F)† | |
| LYMPH | Yes | Lymphocyte count | CBC-DIFF |
| MCH | Yes | Mean corpuscular haemoglobin | CBC-DIFF |
| MCHC | Yes | Mean corpuscular haemoglobin concentration | CBC-DIFF |
| MCV | Yes | Mean corpuscular volume | CBC-DIFF |
| MicroR | Micro RBC ratio (proportion of small red blood cells (RBCs) as a % of total RBCs) | RET | |
| NEUT | Yes | Neutrophil count | CBC-DIFF |
| MONO | Yes | Monocyte count | CBC-DIFF |
| NEUT-GI | Neutrophil granularity index (reactivity of neutrophils (cytoplasmic granulation)) | CBC-DIFF | |
| NEUT-RI | Neutrophil reactivity index (reactivity of neutrophils (metabolic activity)) | CBC-DIFF | |
| NRBC | Nucleated red blood cell count | CBC-DIFF | |
| PLT | Yes | Platelet count | CBC-DIFF |
| RBC | Yes | Red blood cell (erythrocyte) count | CBC-DIFF |
| RBC-He | Mature RBC haemoglobin equivalent (optical measurement of red blood cell haemoglobinisation) | RET | |
| RE-LYMPH | Reactive lymphocyte count | CBC-DIFF | |
| RE-LYMPH% | Reactive lymphocyte percentage of total white blood cell count | CBC-DIFF | |
| RE-LYMPH%/L | Reactive lymphocytes as a percentage of lymphocytes | CBC-DIFF | |
| RE-MONO | Number of monocytes with a side fluorescent signal > 150 channels representing activated monocytes | CBC-DIFF | |
| RE-MONO%/M | Reactive monocytes as a percentage of monocytes | CBC-DIFF | |
| RET# | Yes | Reticulocyte count | RET |
| RET-He | Reticulocyte haemoglobin equivalent (optical measurement of reticulocyte haemoglobinisation) | RET | |
| WBC | Yes | White blood cell (leukocyte) count | CBC-DIFF |
-
Note: The availability of individual parameters as either diagnostic (IVD) or research use only (RUO) is dependent on regulatory approval status which differs across regions.
* Standard parameters available in the complete blood count (CBC), differential (DIFF) or reticulocyte measurement (RET) channels across multiple manufacturer haematology analyser platforms.
-
† Depending on region, the immature platelet count (IPF# and IPF%) are obtained either from the RET or PLT-F channel. PLT-F refers to fluorescent optical platelet measurement.
Additional files
-
Source data 1
all data file.
- https://cdn.elifesciences.org/articles/63195/elife-63195-data1-v2.xlsx
-
Supplementary file 1
Basic demographic characteristics of COVID-19 PCR confirmed patients enrolled for prognostic score development demographic data by hospital.
- https://cdn.elifesciences.org/articles/63195/elife-63195-supp1-v2.docx
-
Supplementary file 2
Novel parameters of different manufacturers in relation to possible adaptability of the haemocytometric COVID-19 prognostic score.
- https://cdn.elifesciences.org/articles/63195/elife-63195-supp2-v2.docx
-
Transparent reporting form
- https://cdn.elifesciences.org/articles/63195/elife-63195-transrepform-v2.pdf
-
Reporting standard 1
TRIPOD checklist.
- https://cdn.elifesciences.org/articles/63195/elife-63195-repstand1-v2.docx
Download links
A two-part list of links to download the article, or parts of the article, in various formats.
Downloads (link to download the article as PDF)
Open citations (links to open the citations from this article in various online reference manager services)
Cite this article (links to download the citations from this article in formats compatible with various reference manager tools)
A novel haemocytometric COVID-19 prognostic score developed and validated in an observational multicentre European hospital-based study
eLife 9:e63195.
https://doi.org/10.7554/eLife.63195


