Optimized Vivid-derived Magnets photodimerizers for subcellular optogenetics in mammalian cells
- Department of Neuroscience and Cell Biology, Yale University School of Medicine, United States
- Howard Hughes Medical Institute, Yale University School of Medicine, United States
- Howard Hughes Medical Institute, Janelia Research Campus, United States
- Kavli Institute for Neuroscience, Yale University School of Medicine, United States
- Program in Cellular Neuroscience, Neurodegeneration and Repair, Yale University School of Medicine, United States
Figures
Figure 1 with 6 supplements
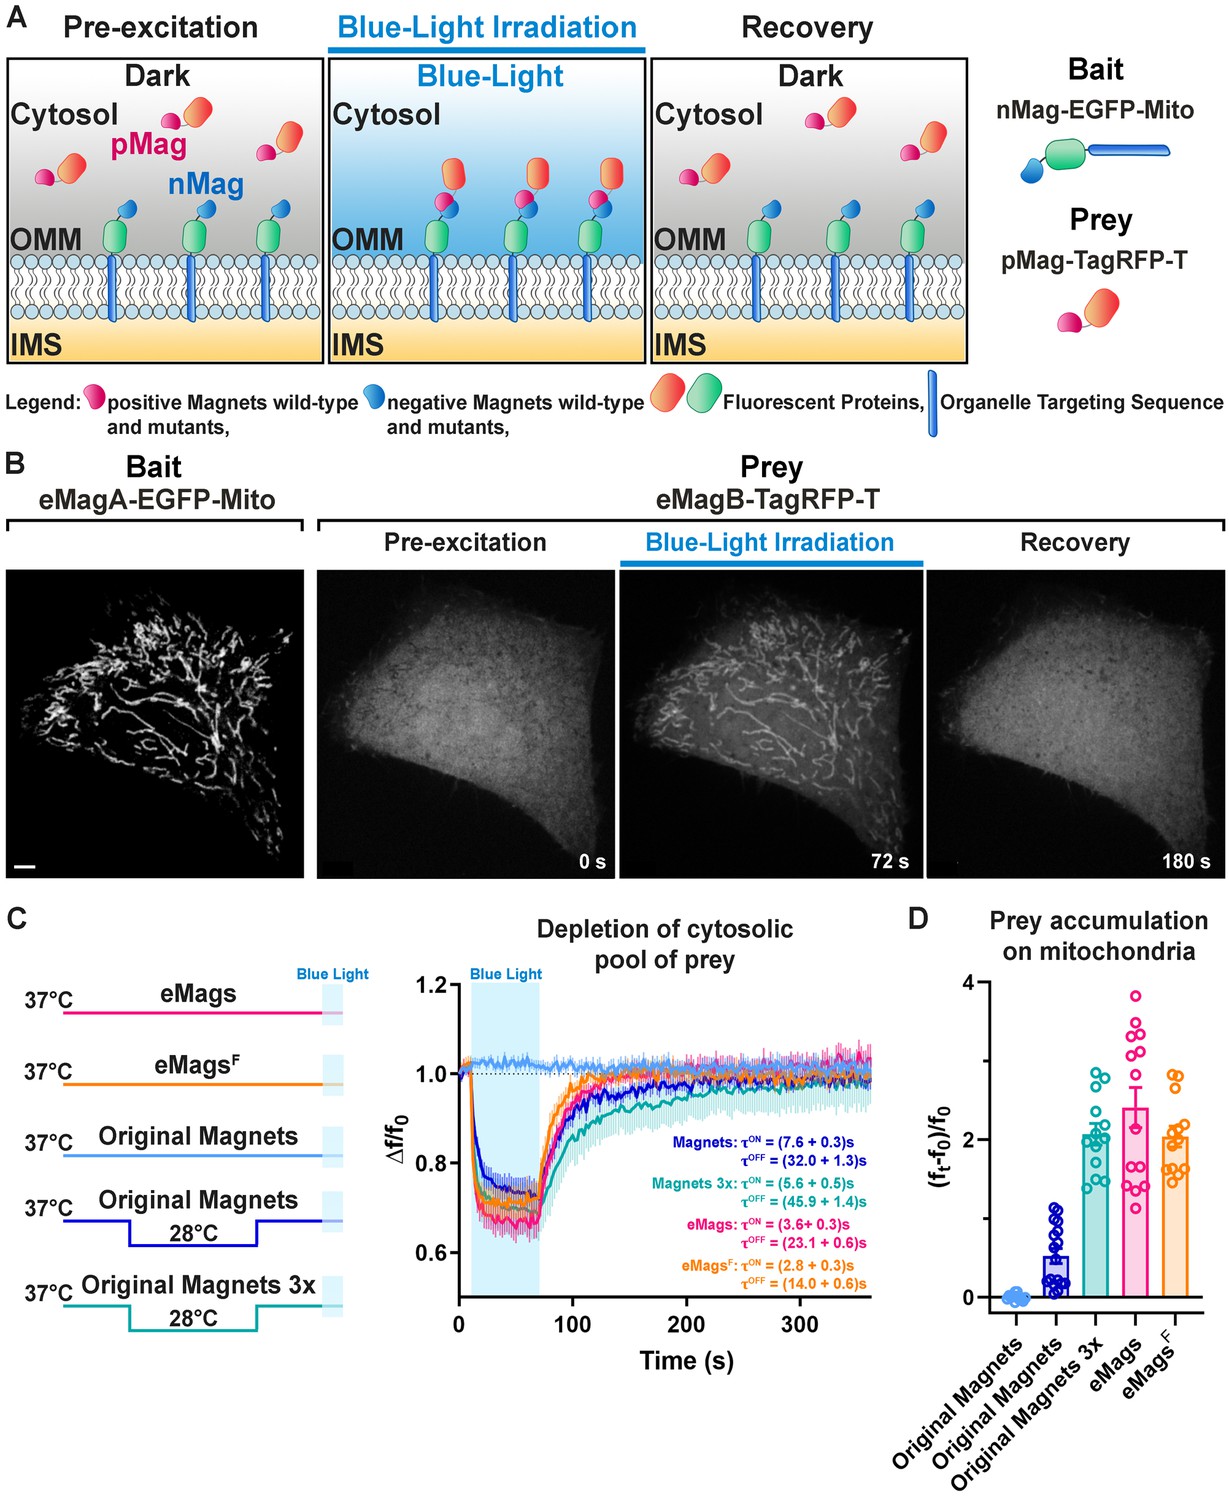
Development and validation of enhanced Magnets (eMags).
(A) Schematic of the assay used to screen for light-dependent Magnets heterodimerization in living cells. The negative Magnet was anchored to the outer mitochondrial membrane (OMM), while the positive Magnet was cytosolic and recruited to mitochondria upon heterodimerization. IMS = Intermembrane space. (B) Representative example of reversible light-dependent recruitment of eMagB-TagRFP-T (prey, enhanced pMag) to mitochondria in HeLa cells expressing the mitochondrial Mito-EGFP-eMagA (bait, enhanced nMag). Confocal images. Scale bar: 10 μm. (C) Left: schematic of experiment, with original Magnets being incubated at either 28 or 37°C before assay. Right: prey depletion from the cytosol (due to its recruitment to mitochondria) for each regime (original Magnets (37°C): n = 13 cells, original Magnets (28°C): 17 cells, original Magnets 3x (28°C): 13 cells, eMags: 14 cells, eMagsF: 13 cells; from three independent experiments). (D) Amount of prey recruited to mitochondria after 60 s of blue light exposure.
-
Figure 1—source data 1
Depletion of cytosolic pool of prey with original and enhanced Magnets.
- https://cdn.elifesciences.org/articles/63230/elife-63230-fig1-data1-v2.xlsx
Figure 1—figure supplement 1
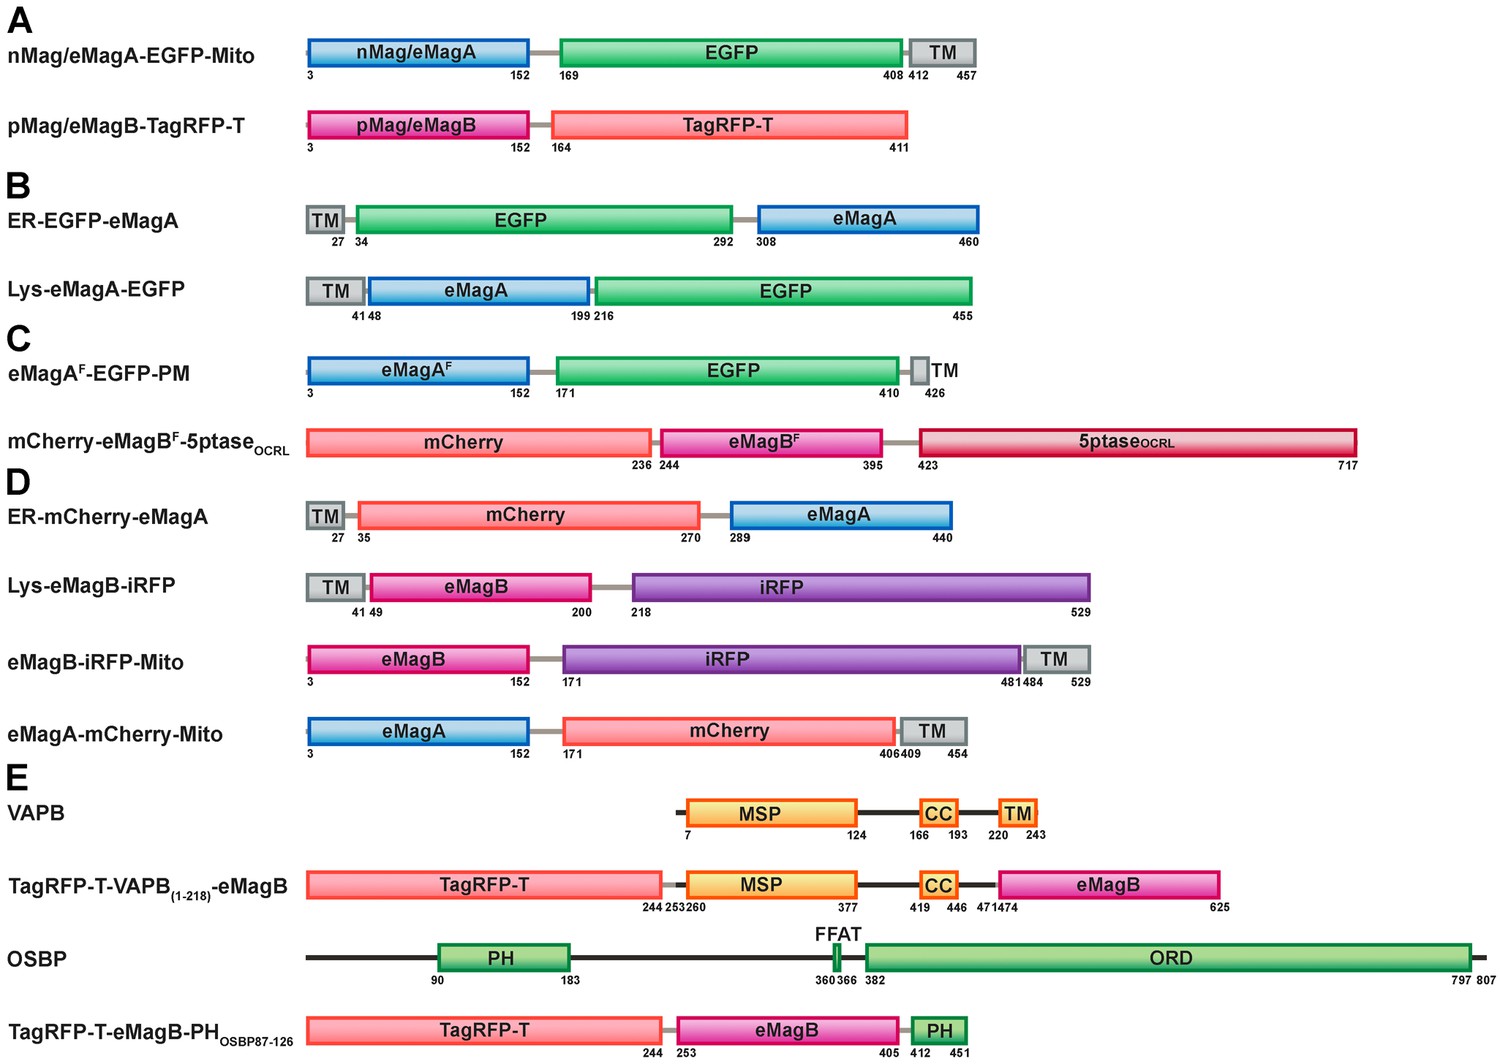
Domain organization diagrams of the constructs used in this study.
(A) Constructs used to induce wild-type and mutant Magnets heterodimerization at the outer mitochondrial membrane. (B) Bait proteins used for the light-dependent recruitment of soluble prey proteins to the ER and lysosomes. (C) Vectors used for the light-dependent modulation of PI(4,5)P2 at the plasma membrane. (D) Constructs used for the optogenetic induction of organelle contacts. (E) Constructs used to induce VAP reconstitution at the surface at the ER membrane (Opto-VAP). MSP, major sperm protein homology domain; CC, coiled-coil domain; TM, transmembrane domain; PH, Pleckstrin homology domain; FFAT, two phenylalanines (FF) in an Acidic Tract motif; ORD, OSBP-related protein lipid-binding domain.
Figure 1—figure supplement 2
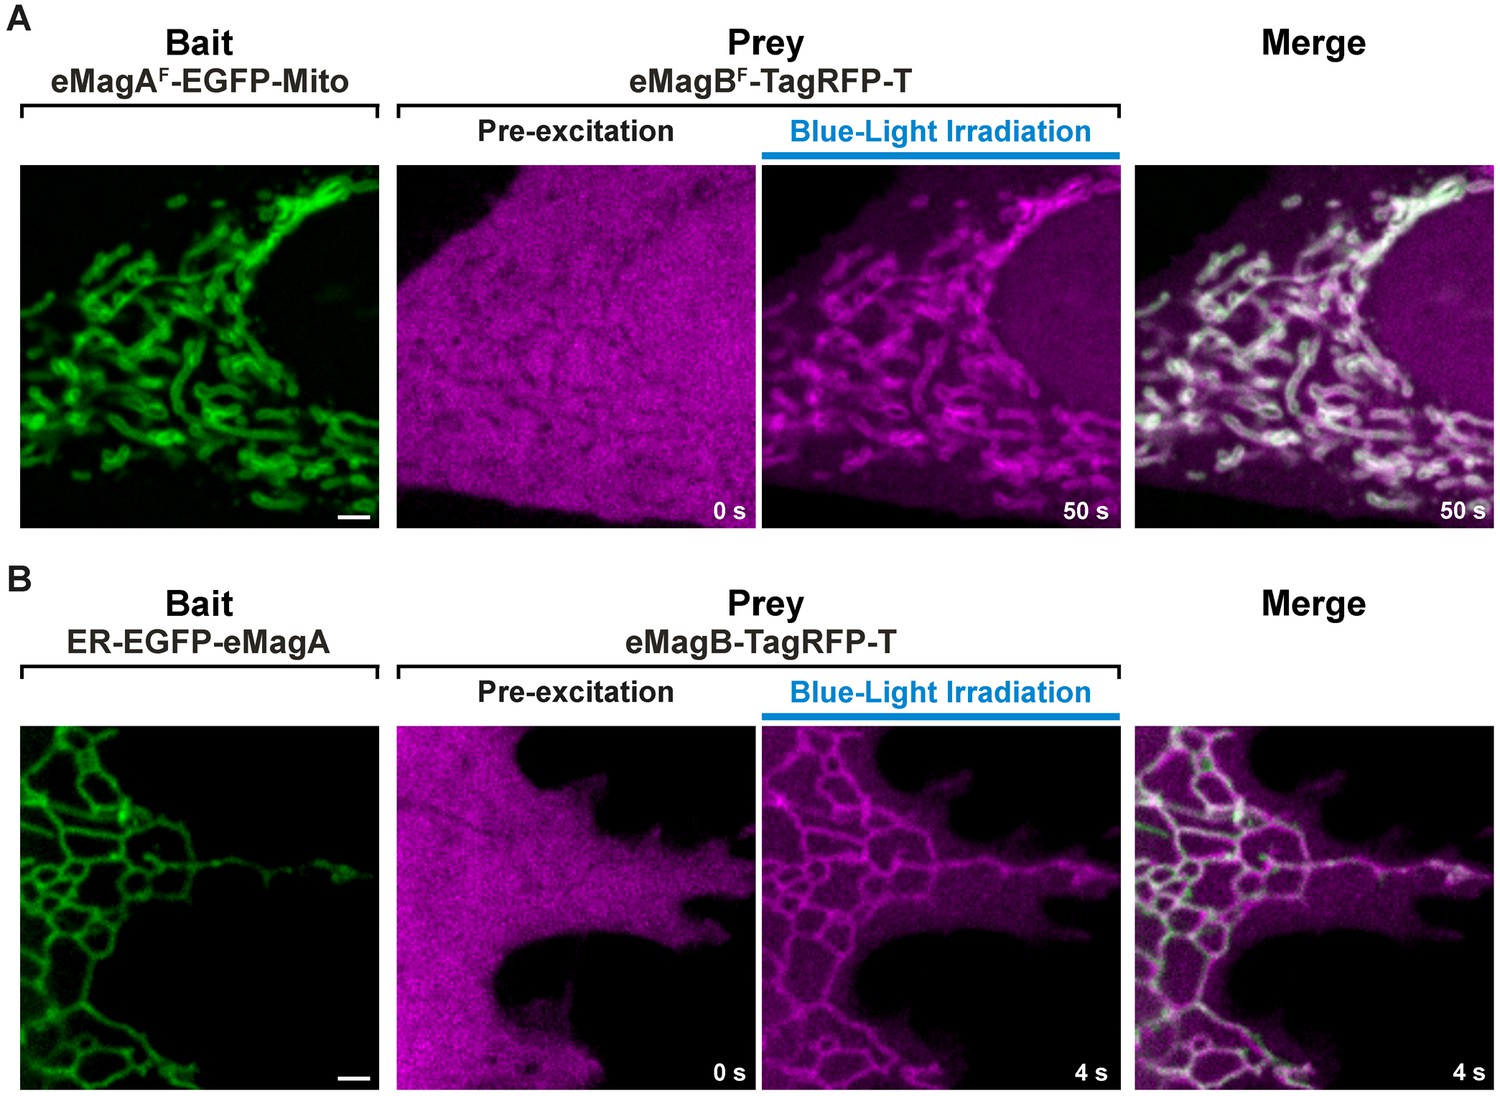
Recruitment of the cytosolic prey to the membrane-associated bait upon light stimulation.
Accumulation of a soluble prey (eMagBF-TagRFP-T or eMagB-TagRFP-T) to a mitochondria-anchored bait (eMagAF-EGFP-Mito) (A) or to an ER-associated bait (ER-EGFP-eMagA) (B) upon whole-cell illumination in a HeLa cell (A) or COS-7 cell (B). Scale bar: 2 μm.
Figure 1—figure supplement 3
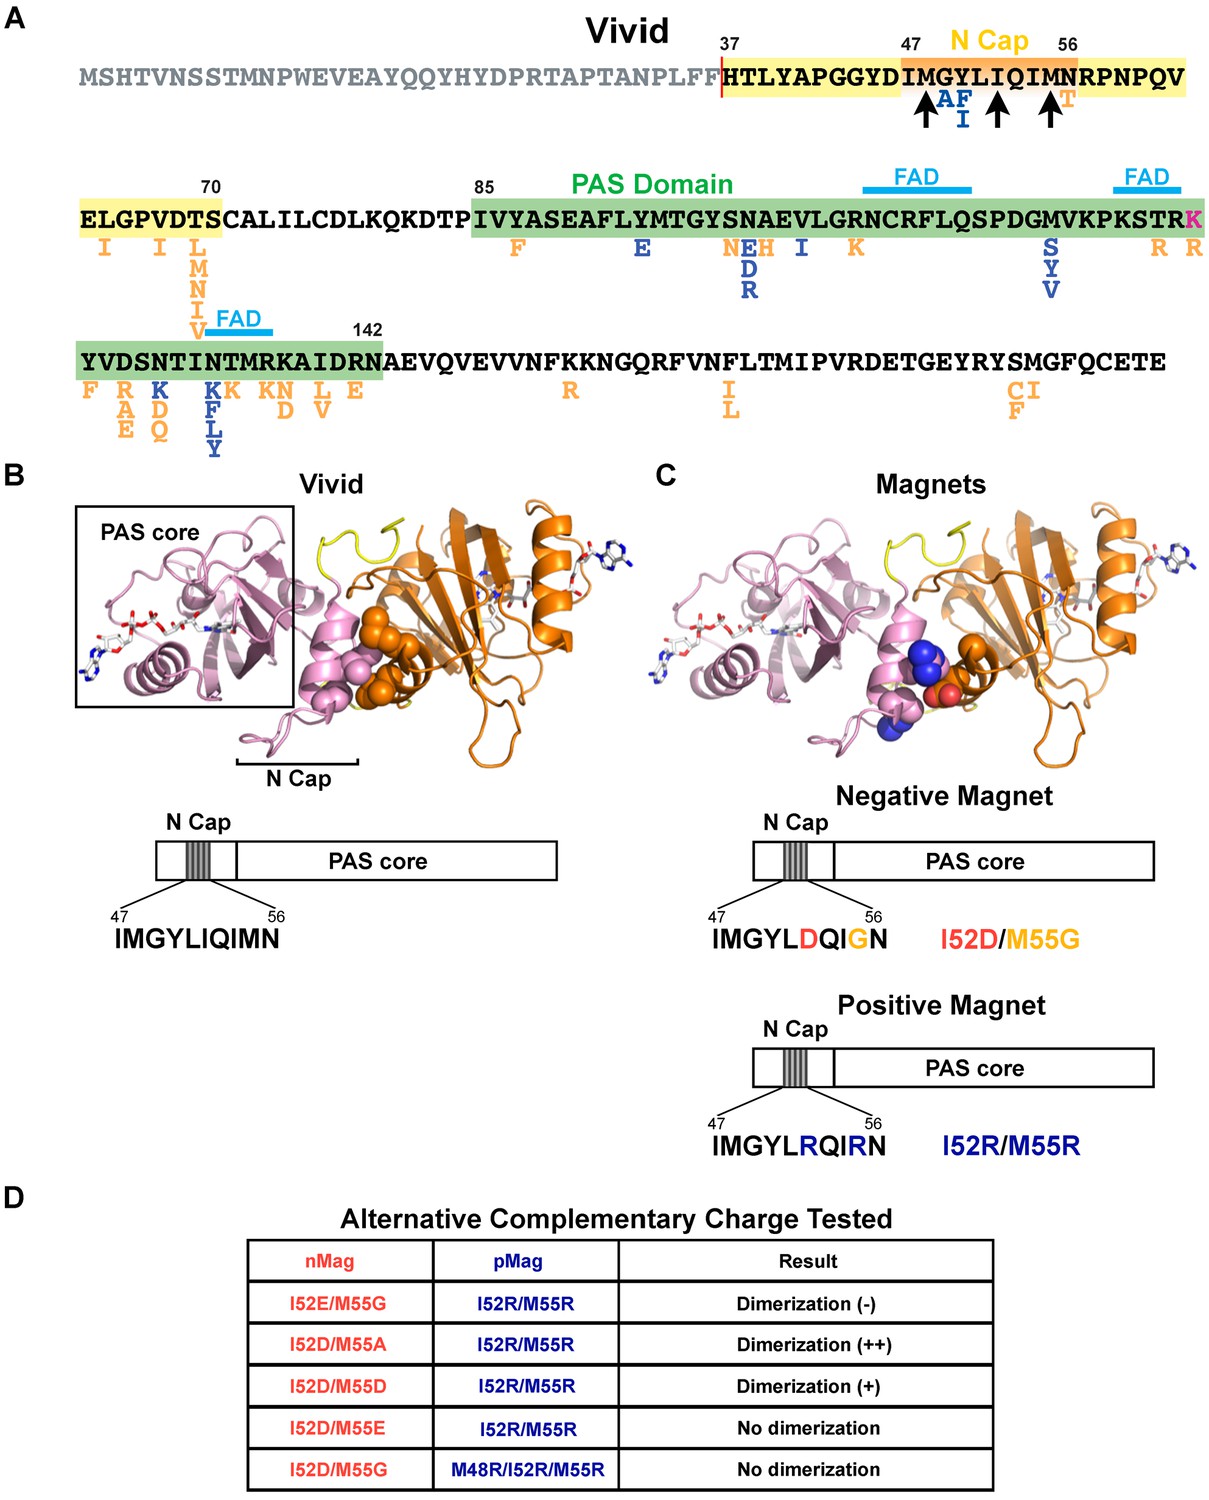
Magnets mutations tested to improve heterodimerization efficiency and thermodynamic stability.
(A) Primary sequence of the Neurospora crassa (strain ATCC 24698) photoreceptor Vivid (UniProtKB Q1K5Y8_NEUCR). The N-cap dimerization domain, the Per-ARNT-Sim (PAS) core domain (the photosensitive portion of the protein), and the amino acids involved in binding the flavin adenine dinucleotide (FAD) cofactor (Heintzen et al., 2001; Zoltowski et al., 2007) are indicated. The construct used for the crystal structure of the homodimer (see below) lacks the N-terminal 36 a.a.; Magnets also lack these 36 a.a. Arrows point to a.a. mutated in an attempt to generate Magnets with improved charge complementarity (see Table in panel D). Amino acid substitutions introduced during the screen are shown below the WT sequence. Magenta: mutations that abolish potential ubiquitination sites; blue, mutations predicted to improve packing or secondary-structure preference; orange, mutations that mimic corresponding residues in thermophilic ascomycetes. The effects on heterodimerization of each substitution and combinations of substitutions is summarized in Supplementary file 3. (B) Crystal structure of the Vivid homodimer and domain cartoon of the monomer. The two monomers are shown in orange and pink. Residues Ile52 and Met55 are shown as spheres. (C) Magnets were generated by introducing mutations to make the interface of one Vivid negatively charged (Ile52Asp/Met55Gly, ‘negative Magnet’), and the interface of the other Vivid positively charged (Ile52Arg/Met55Arg, ‘positive Magnets’), so that blue light radiation leads to hetero- rather than homo-dimerization. Residues Asp52/Gly55 in the ‘negative Magnet’ and Arg52/Arg55 of the ‘positive Magnet’ are shown as spheres. (D) Amino acid mutations tested for optimizing charge complementarity. (Scores: (-) less efficient than the original photoreceptors, (+) more efficient, (++) much more efficient).
Figure 1—figure supplement 4
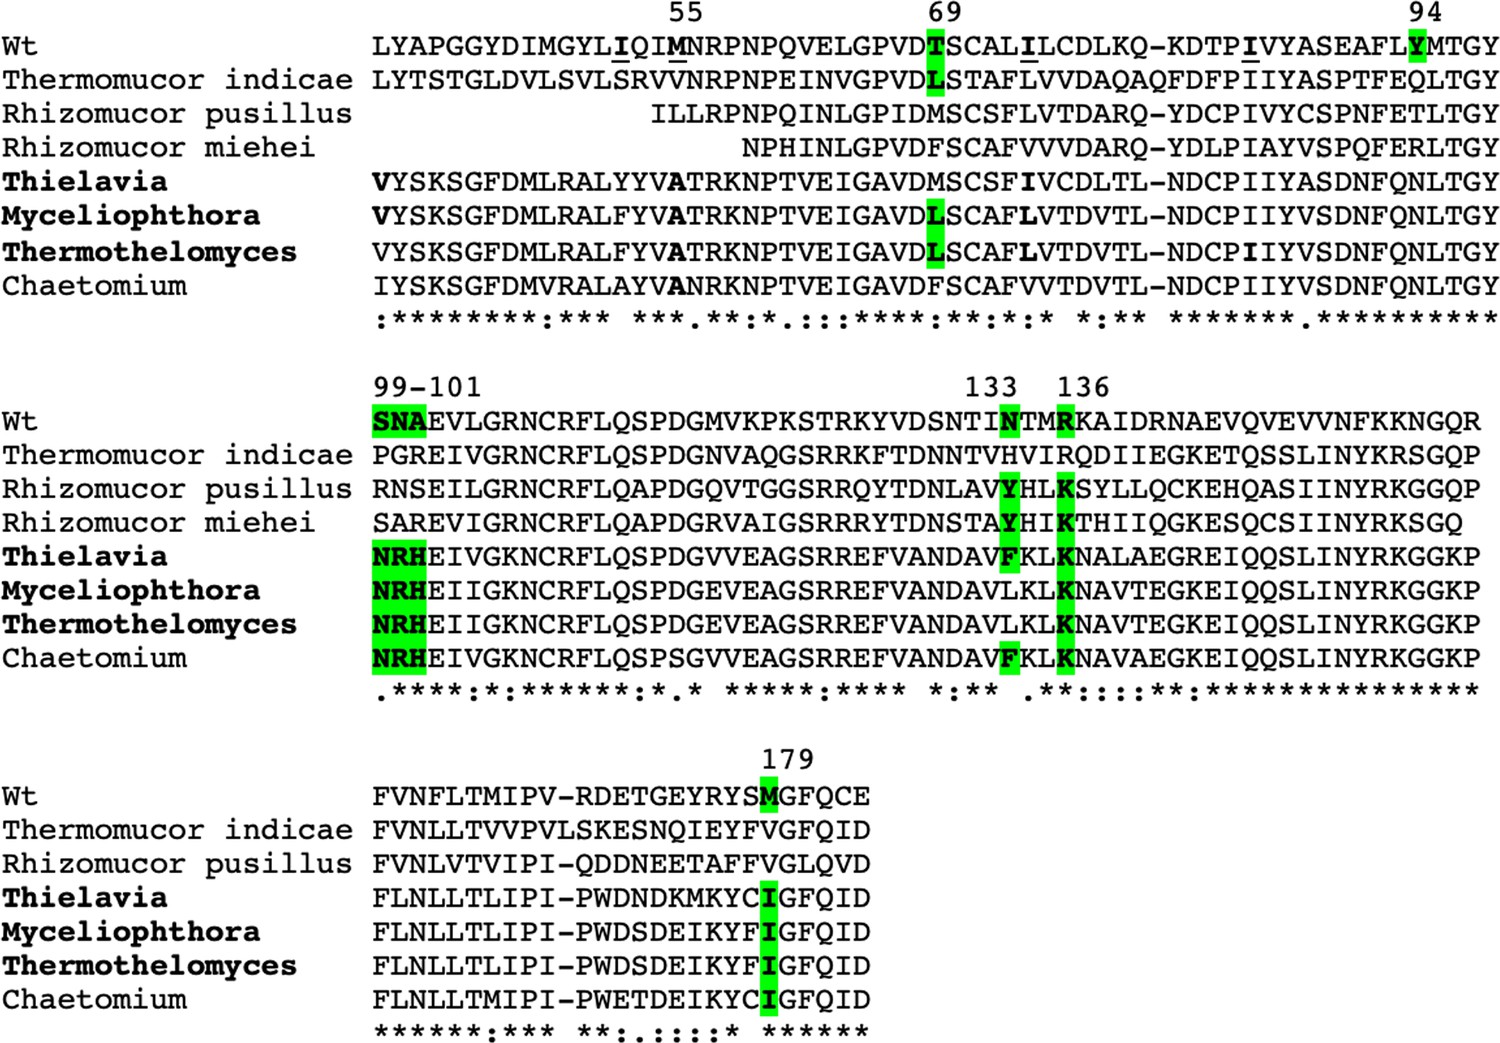
Alignment of Vivid domain sequences from thermophilic ascomycetes.
Sequences were retrieved from NCBI. The two Rhizomucor sequences come from incomplete whole-genome sequencing projects. The nine mutations in eMags are shown in bold; all but one mutation was to an amino acid occurring in one of the thermophilic homologues. Surprisingly, the 55Ala mutation introduced by rational design was subsequently found to occur at that position in many thermophilic homologues.
Figure 1—figure supplement 5
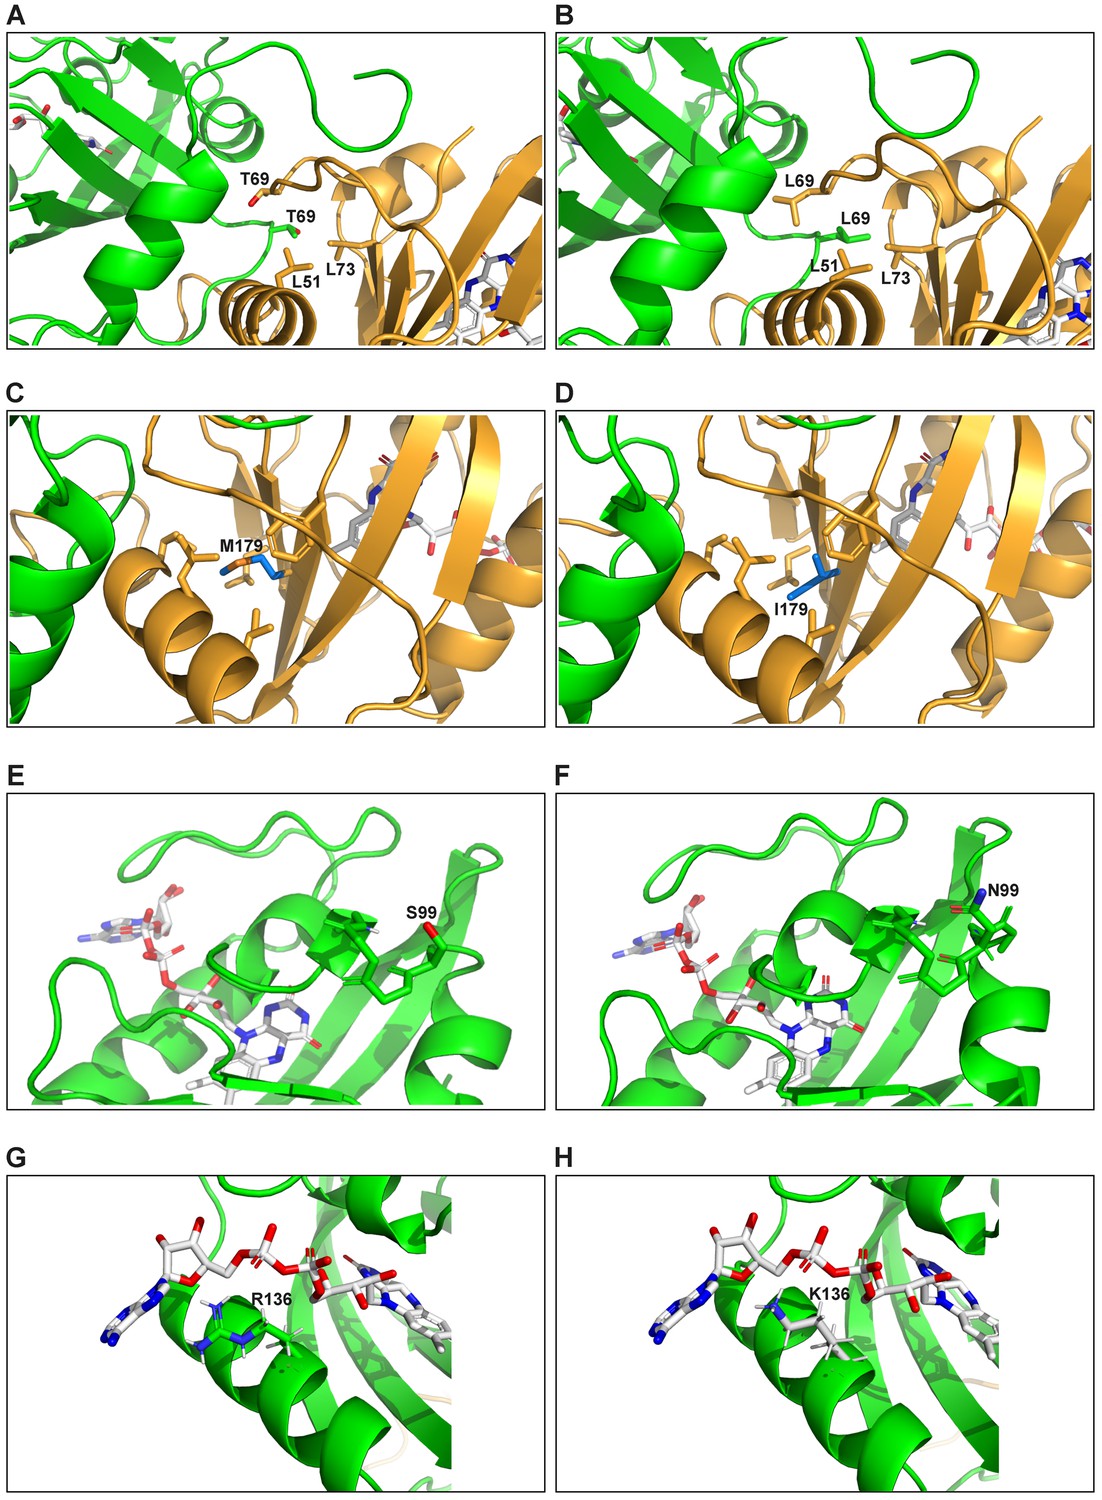
Molecular modeling of effects of specific eMags mutations.
(A) Wild-type Thr69 leaves an unsatisfied hydrogen bond donor and acceptor at the dimer interface and packs poorly. Thr also prefers strand over helix (this position is in a helical turn). (B) Thr69Leu shows much greater hydrophobic packing at the dimer interface, including with Leu69 on the other dimer half. Leu also prefers helix over strand. (C) Wild-type Met179 is a sub-standard hydrophobic packer and has high residue entropy. Met also has only modest preference for strand over helix. (D) Met179Ile makes more hydrophobic contacts and has low residue entropy. Ile also has excellent preference for strand over helix. (E) Wild-type Ser99 makes a weak ‘helix N-cap’ hydrogen bond to the backbone amide H of residue 102. Ser is also only weakly preferred as a residue in a helix N-cap turn. (F) Ser99Asn makes a strong ‘helix N-cap’ hydrogen bond to the backbone amide H of residue 102. Asn is also by far the most strongly preferred residue in a helix N-cap turn. (G) Wild-type Arg136 makes an ion pair with a phosphate of FAD, but quite closely approaches the adenine ring, with which it has suboptimal packing and electrostatics. (H) Arg136Lys still makes the ion pair with a phosphate of FAD, and less closely approaches the adenine ring, decreasing unfavorable contacts.
Figure 1—figure supplement 6
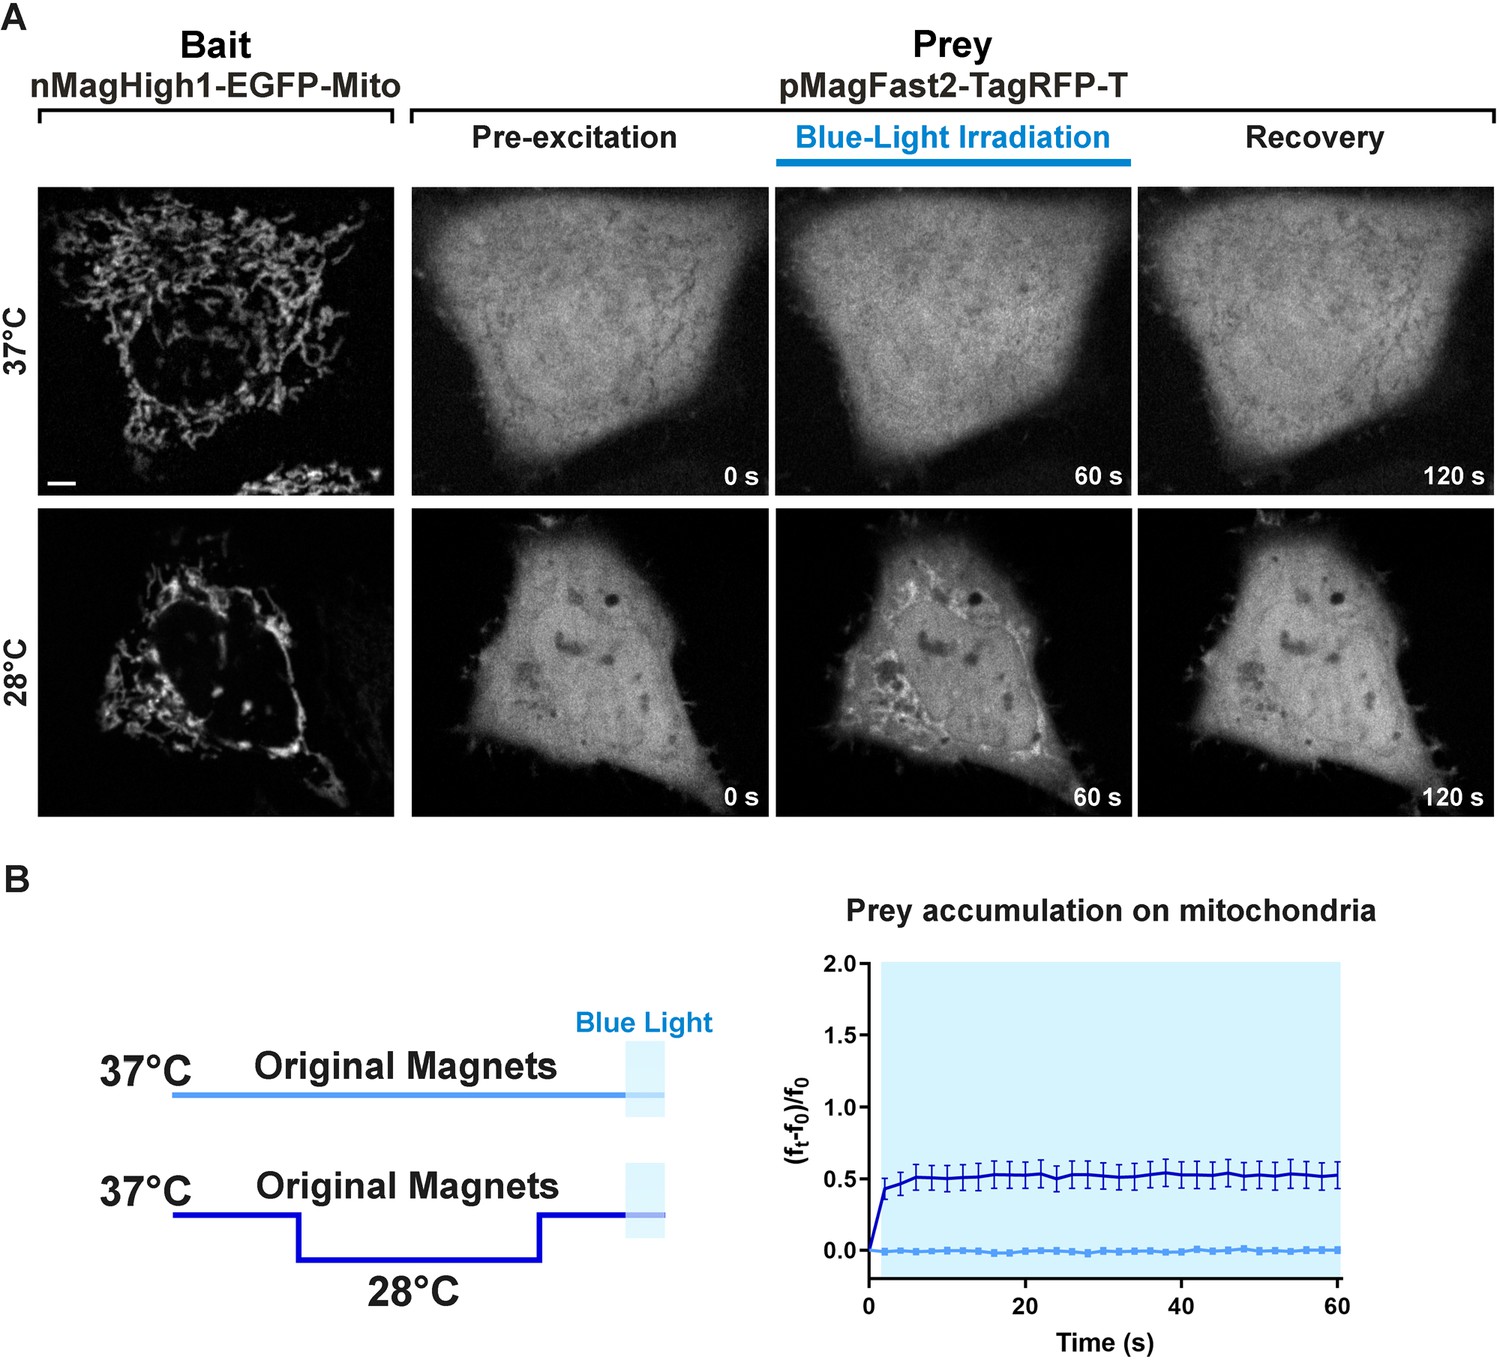
Light-dependent heterodimerization of the original Magnets at the mitochondrial surface with or without preincubation of cells at 28°C.
(A) Representative example of the light-dependent recruitment of the original Magnets prey (pMagFast2-TagRFP-T) to mitochondria in HeLa cells expressing the mitochondrial bait nMagHigh1-EGFP-Mito without (top) or with (bottom) a preincubation at 28°C. Scale bar: 5 μm. (B) Plot showing the accumulation of soluble prey from the cytosol to mitochondria in cells expressing the original Magnets either without or with a preincubation at 28°C for 12–24 hr prior to imaging and irradiation, as shown in the schematic at left (N = original Magnets: 12 cells, original Magnets (28°C): 17 cells; from three independent experiments).
-
Figure 1—figure supplement 6—source data 1
Accumulation of soluble prey from the cytosol to mitochondria in cells expressing the original Magnets either without or with a preincubation at 28°C.
- https://cdn.elifesciences.org/articles/63230/elife-63230-fig1-figsupp6-data1-v2.xlsx
Figure 2
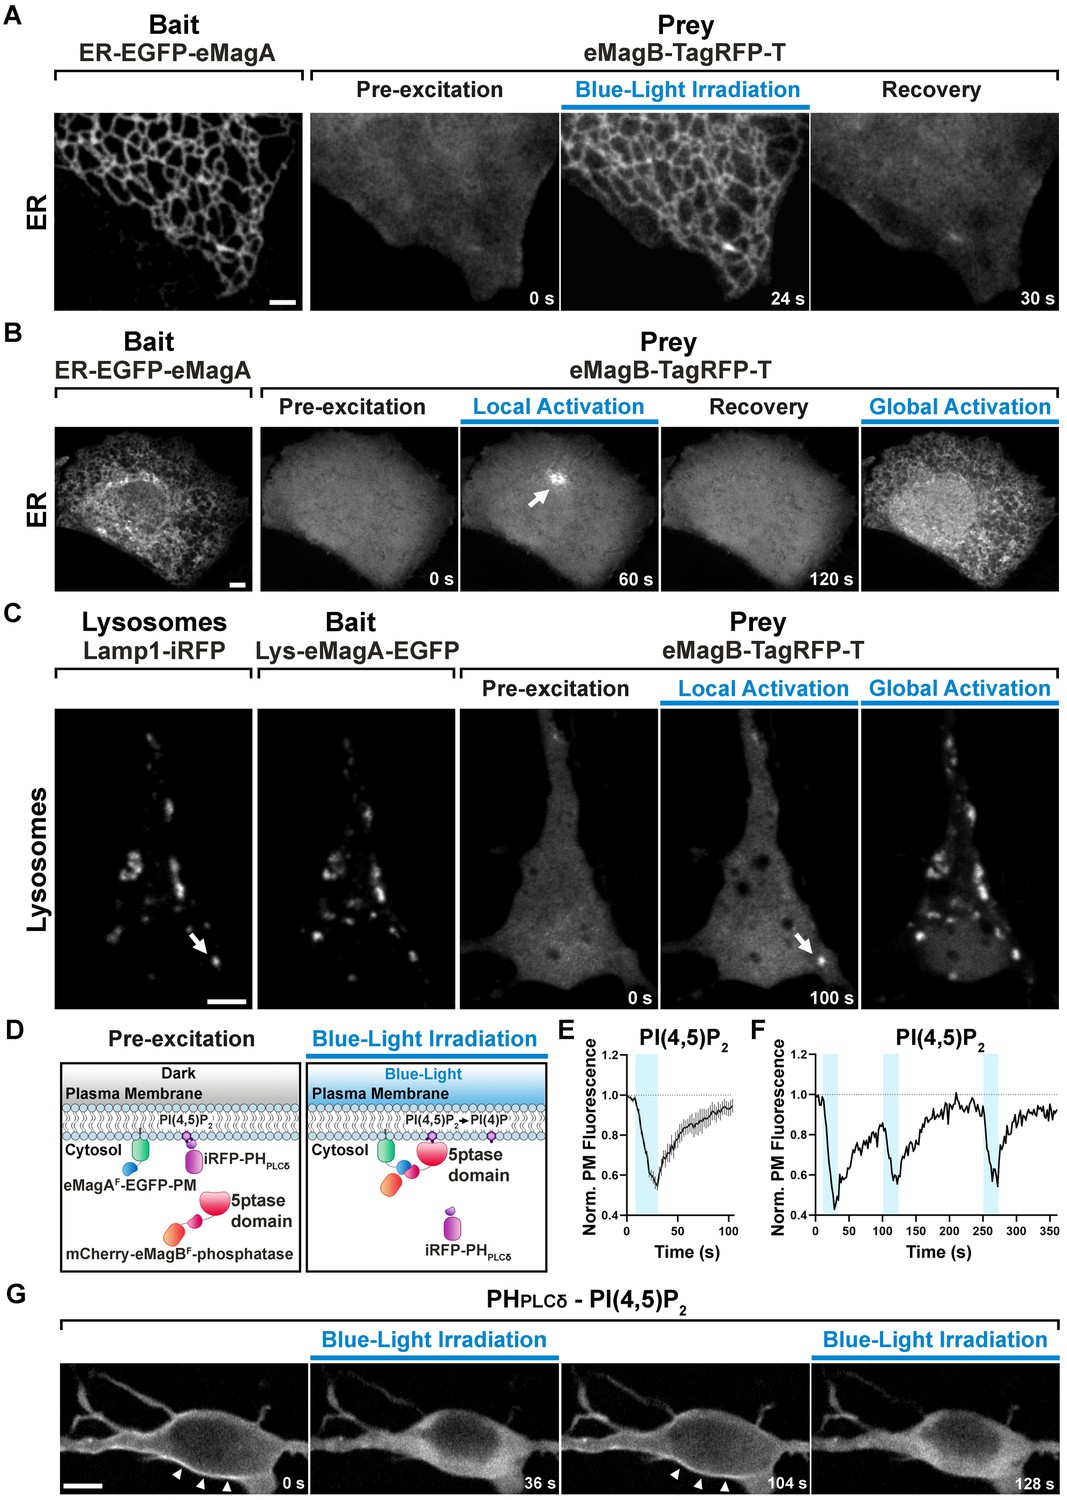
eMags-dependent recruitment of soluble cytosolic proteins to intracellular organelles and modulation of PI(4,5)P2 at the plasma membrane.
(A) Rapid, reversible accumulation of a soluble prey to an endoplasmic reticulum-anchored bait upon whole-cell illumination of a COS7 cell. In this and other examples in the figure, global cell blue-light irradiation was achieved with 200 ms blue-light pulses at 0.5 Hz. Time from the beginning of imaging given at the bottom. Scale bar: 2 μm. (B) Localized and global recruitment of a soluble prey to an ER-targeted bait in a HeLa cell. Localized activation was achieved by illuminating the cell within a 3 µm x 3 µm ROI with 200 ms blue-light pulses at 0.5 Hz for 60 s. The cell was then allowed to recover in the absence of blue light for 2 min prior to global illumination. Scale bar: 5 μm. (C). Recruitment of a soluble prey to lysosomes in a DIV14 primary hippocampal neuron. The left two fields show colocalization of the lysosomally anchored bait with the lysosomal marker Lamp1-iRFP. Recruitment of the prey to a single lysosome, or to all lysosomes, was achieved by local and global illumination, respectively. Following localized illumination delivered as in (B), the cell was allowed to recover in the absence of blue light for 1 min, and then globally illuminated. Scale bar: 5 μm. (D). Schematic representation of the strategy and constructs used to induce PI(4,5)P2 depletion at the plasma membrane via the eMagF-dependent recruitment of an inositol 5-phosphatase. iRFP-PHPLCδ is a PI(4,5)P2 probe. (E) PI(4,5)P2 dephosphorylation and re-phosphorylation elicited in DIV7 primary hippocampal neurons expressing the constructs shown in (D) (N = 10 dephosphorylation and re-phosphorylation events, three neurons), as reflected by the dissociation of iRFP-PHPLCδ from the plasma membrane. (F) Representative trace of PI(4,5)P2 level changes resulting from multiple brief illumination pulses of a single neuron. (G) Selected iRFP-PHPLCδ images of the neuron used for field (F) at the times indicated. Scale bar: 5 μm.
-
Figure 2—source data 1
PI(4,5)P2 dephosphorylation and re-phosphorylation events elicited in DIV7 primary hippocampal neurons.
- https://cdn.elifesciences.org/articles/63230/elife-63230-fig2-data1-v2.xlsx
Figure 3
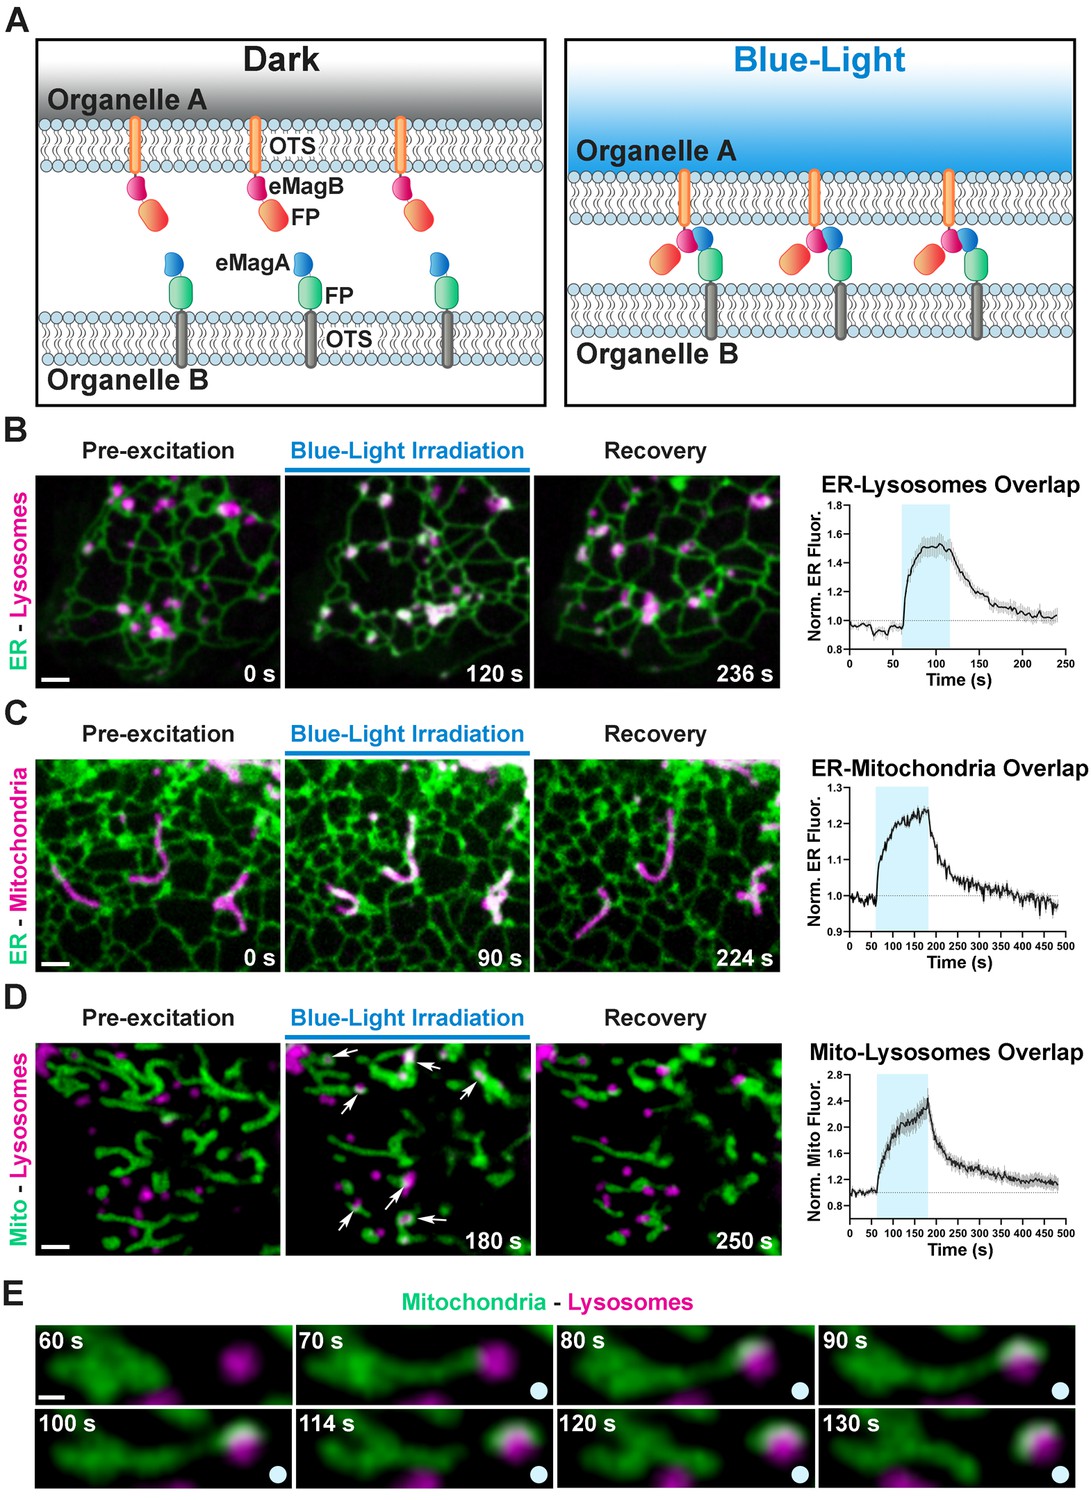
Optogenetic induction of organelle-organelle contacts.
(A) Graphical representation of the strategy used to establish contacts between membranes of intracellular organelles. Constructs encoding both components of the dimerization pair (eMagA and eMagB) were fused to a fluorescent protein (FP) and to an organelle-targeting sequence (OTS) to drive expression in specific organelles (Organelle A or B). Cells expressing, respectively: ER-Lysosomes (COS7) (B), ER-Mitochondria (HeLa) (C), or Mitochondria-Lysosomes (HeLa) (D). Cells shown before, during, and after blue-light illumination. Small arrows in (D) point to lysosomes. The overlap between the membranes of the two organelles increased during illumination, as illustrated by the white color in the fluorescence micrographs, quantified in graphs shown at right (ER-Lysosomes: n = 14, ER-Mitochondria: 14, Mito-Lysosomes: 17; three independent experiments). Scale bar: 2 µm. (E) Fission of a mitochondrion correlating with pulling by a lysosome after light-dependent contact formation/expansion. Scale bar: 0.5 µm.
-
Figure 3—source data 1
Relative increase in membranes overlap occurring upon optogentic induction of inter-organellar contacts.
- https://cdn.elifesciences.org/articles/63230/elife-63230-fig3-data1-v2.xlsx
Figure 4 with 3 supplements
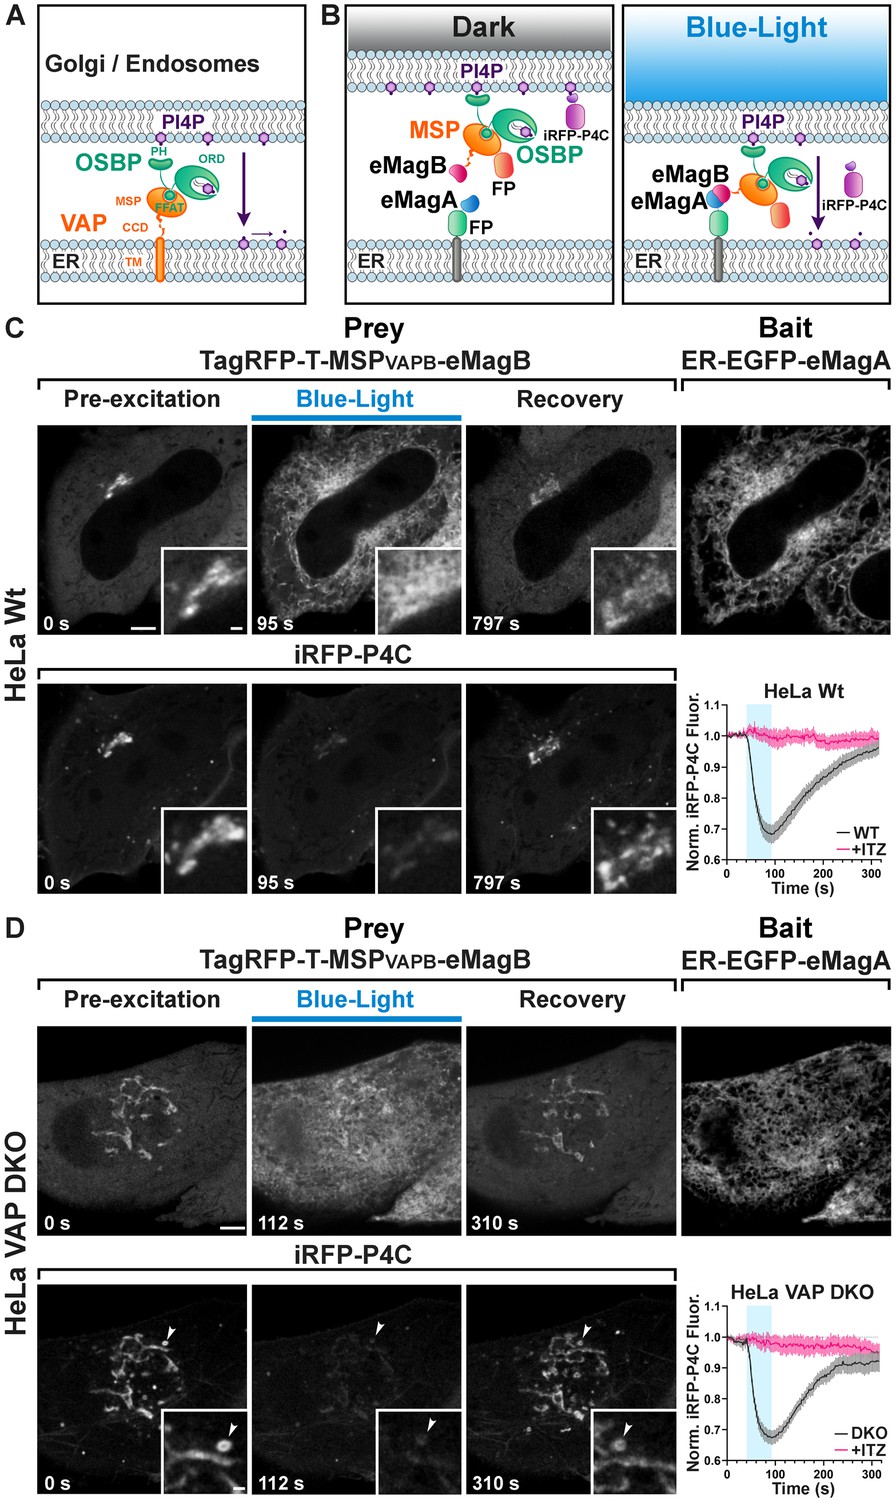
Light-dependent reconstitution of VAPB triggers PI4P transfer from the Golgi complex and endosomes to the ER.
(A) Domain organization of VAP and OSBP1, which together connect the ER to the PI4P-rich membranes of the Golgi complex (and an endosome subpopulation) to mediate PI4P transfer to the ER for degradation by the PI4P phosphatase Sac1. MSP: major sperm protein homology domain; CCD, coiled-coil domain; TM, transmembrane domain; PH, Pleckstrin homology domain; FFAT, FFAT motif; ORD, OSBP-related protein lipid-binding domain. In the experiment shown in the figure, OSBP represents the endogenous protein. (B) Schematic representation of reconstitution of a split VAP on the ER membranes using eMags (Opto-VAP). FP: fluorescent protein tags. The N-terminal portion of VAPB (VAPB(1-218)) fused to TagRFP-T and to eMagB (prey) was expressed together with ER-anchored eMagA fused to EGFP (bait) and with the PI4P reporter iRFP-P4C in HeLa cells. Upon blue-light illumination, eMags heterodimer formation results in reconstitution of the tether, allowing the ORD domain of endogenous OSBP to transfer PI4P to the ER for degradation, leading to PI4P loss from Golgi membranes. (C) Wild-type HeLa cell expressing TagRFP-T-MSP(VAPB(1-218))-eMagB, ER-EGFP-eMagA and the PI4P reporter iRFP-P4C, showing that blue-light dependent Opto-VAP activation results in the recruitment of the prey to the ER and concomitant dissociation of iRFP-P4C from the Golgi, reflecting PI4P loss. Scale bar: 5 µm. Insets show the Golgi complex area at higher magnification. Scale bar: 1 µm. The graph at bottom-right shows changes of normalized iRFP-P4C (PI4P) fluorescence in the Golgi complex before, during, and after Opto-VAP activation in wild-type HeLa cells, with or without ITZ treatment (N = 16 and 24 cells, respectively; from three independent experiments). (D) VAP-DKO HeLa cell expressing the same constructs as in (C). As previously reported (Dong et al., 2016), in VAP-DKO HeLa cells, the Golgi complex is disrupted with an accumulation of PI4P-rich hybrid endosome-Golgi organelles. Blue-light dependent Opto-VAP activation results in prey recruitment to the ER and concomitant dissociation of iRFP-P4C from these organelles. Scale bar: 5 µm. Insets of the iRFP-P4C images of Golgi-endosome elements at high magnification. The bright vesicular structure shown in the inset corresponds to the organelle indicated by an arrowhead in the low magnification image. Scale bar: 1 µm. The graph at bottom-right shows changes of normalized iRFP-P4C (PI4P) fluorescence in endosomes before, during, and after Opto-VAP activation, with or without ITZ treatment (N = 20 and 16, respectively; from three independent experiments).
-
Figure 4—source data 1
Changes of normalized iRFP-P4C (PI4P) fluorescence in the Golgi complex before, during, and after Opto-VAP activation in wild-type and VAP-DKO HeLa cells, with or without ITZ treatment.
- https://cdn.elifesciences.org/articles/63230/elife-63230-fig4-data1-v2.xlsx
Figure 4—figure supplement 1
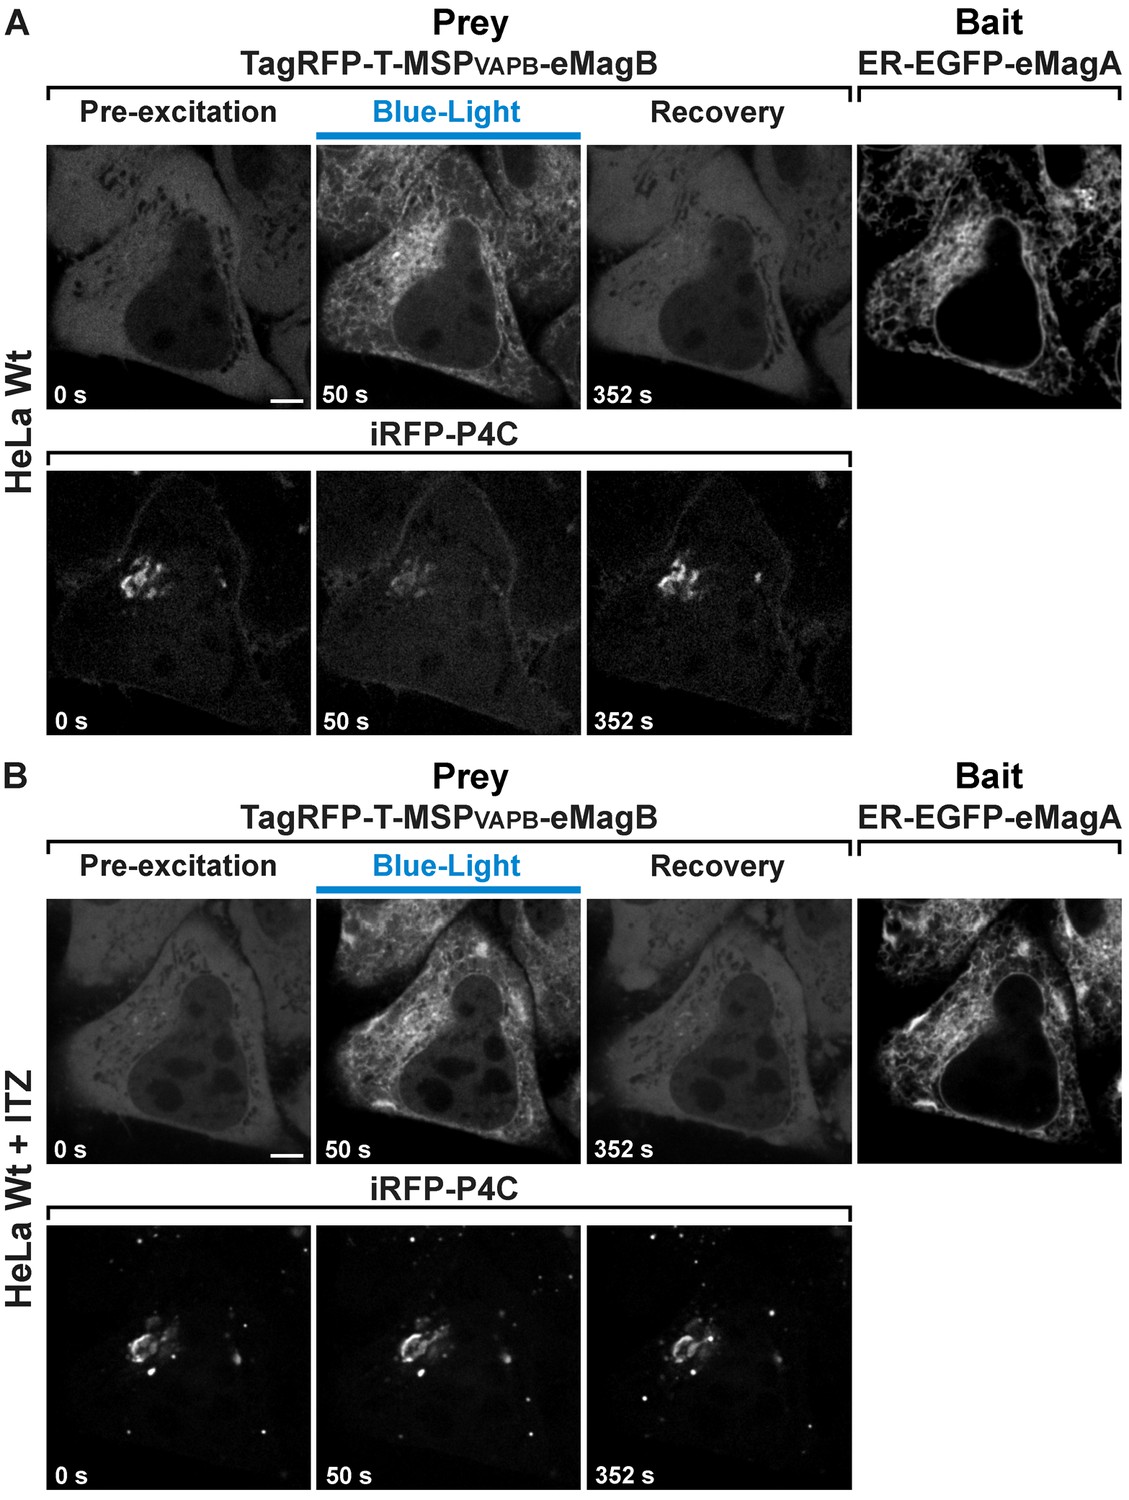
Opto-VAP reconstitution induces PI4P loss from the Golgi complex and this effect is blocked by ITZ treatment.
The same wild-type HeLa cell expressing TagRFP-T-MSP(VAPB(1-218))-eMagB, ER-EGFP-eMagA and the PI4P reporter iRFP-P4C was imaged before (A) and 45 min after ITZ treatment (B). Before ITZ treatment, we could detect a reduction in iRFP-P4C (PI4P) from the Golgi upon illumination (panel A, lower row). However, after ITZ incubation, we could not visualize iRFP-P4C loss upon illumination despite efficient activation of Opto-VAP (panel B, lower row). Scale bar: 5 µm.
Figure 4—figure supplement 2
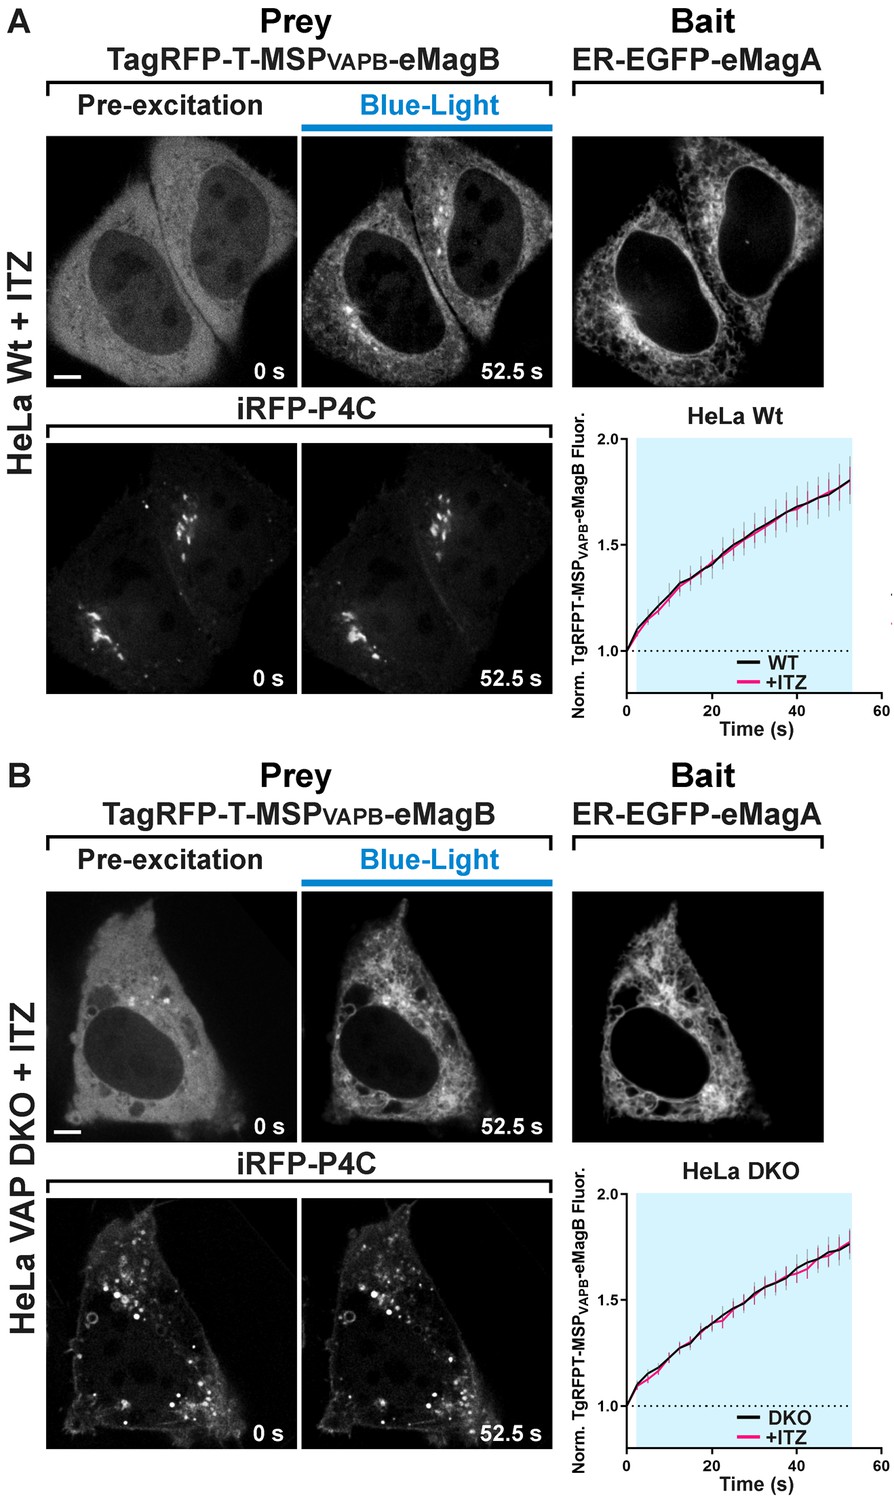
ITZ treatment blocks PI4P loss from the Golgi complex but does not affect Opto-VAP reconstitution in WT and VAP-DKO HeLa cells.
Wild-type (A) and VAP-DKO (B) HeLa cells expressing TagRFP-T-MSP(VAPB(1-218))-eMagB, ER-EGFP-eMagA and the PI4P reporter iRFP-P4C imaged 30 min after ITZ treatment. Despite the rapid and efficient association of TagRFP-T-MSP(VAPB(1-218))-eMagB to ER membranes upon light stimulation (graphs at right), ITZ prevented iRFP-P4C (PI4P) loss from the Golgi in wild-type HeLa cells and endosome/Golgi hybrid structures in HeLa VAP-DKO cells. Scale bar: 5 µm. (HeLa WT: τON = 50.7 ± 3.2 s, N = 24; HeLa WT + ITZ: τON = 46.5 ± 2.7 s, N = 16; HeLa VAP-DKO: τON = 81.1 ± 9.6 s, N = 20; HeLa VAP-DKO + ITZ: τON = 68.1 ± 8.2 s, N = 16; from three independent experiments).
-
Figure 4—figure supplement 2—source data 1
Changes of normalized TagRFP-T-MSP-VAPB fluorescence in the ER during Opto-VAP activation in wild-type and VAP-DKO HeLa cells, with or without ITZ treatment.
- https://cdn.elifesciences.org/articles/63230/elife-63230-fig4-figsupp2-data1-v2.xlsx
Figure 4—figure supplement 3
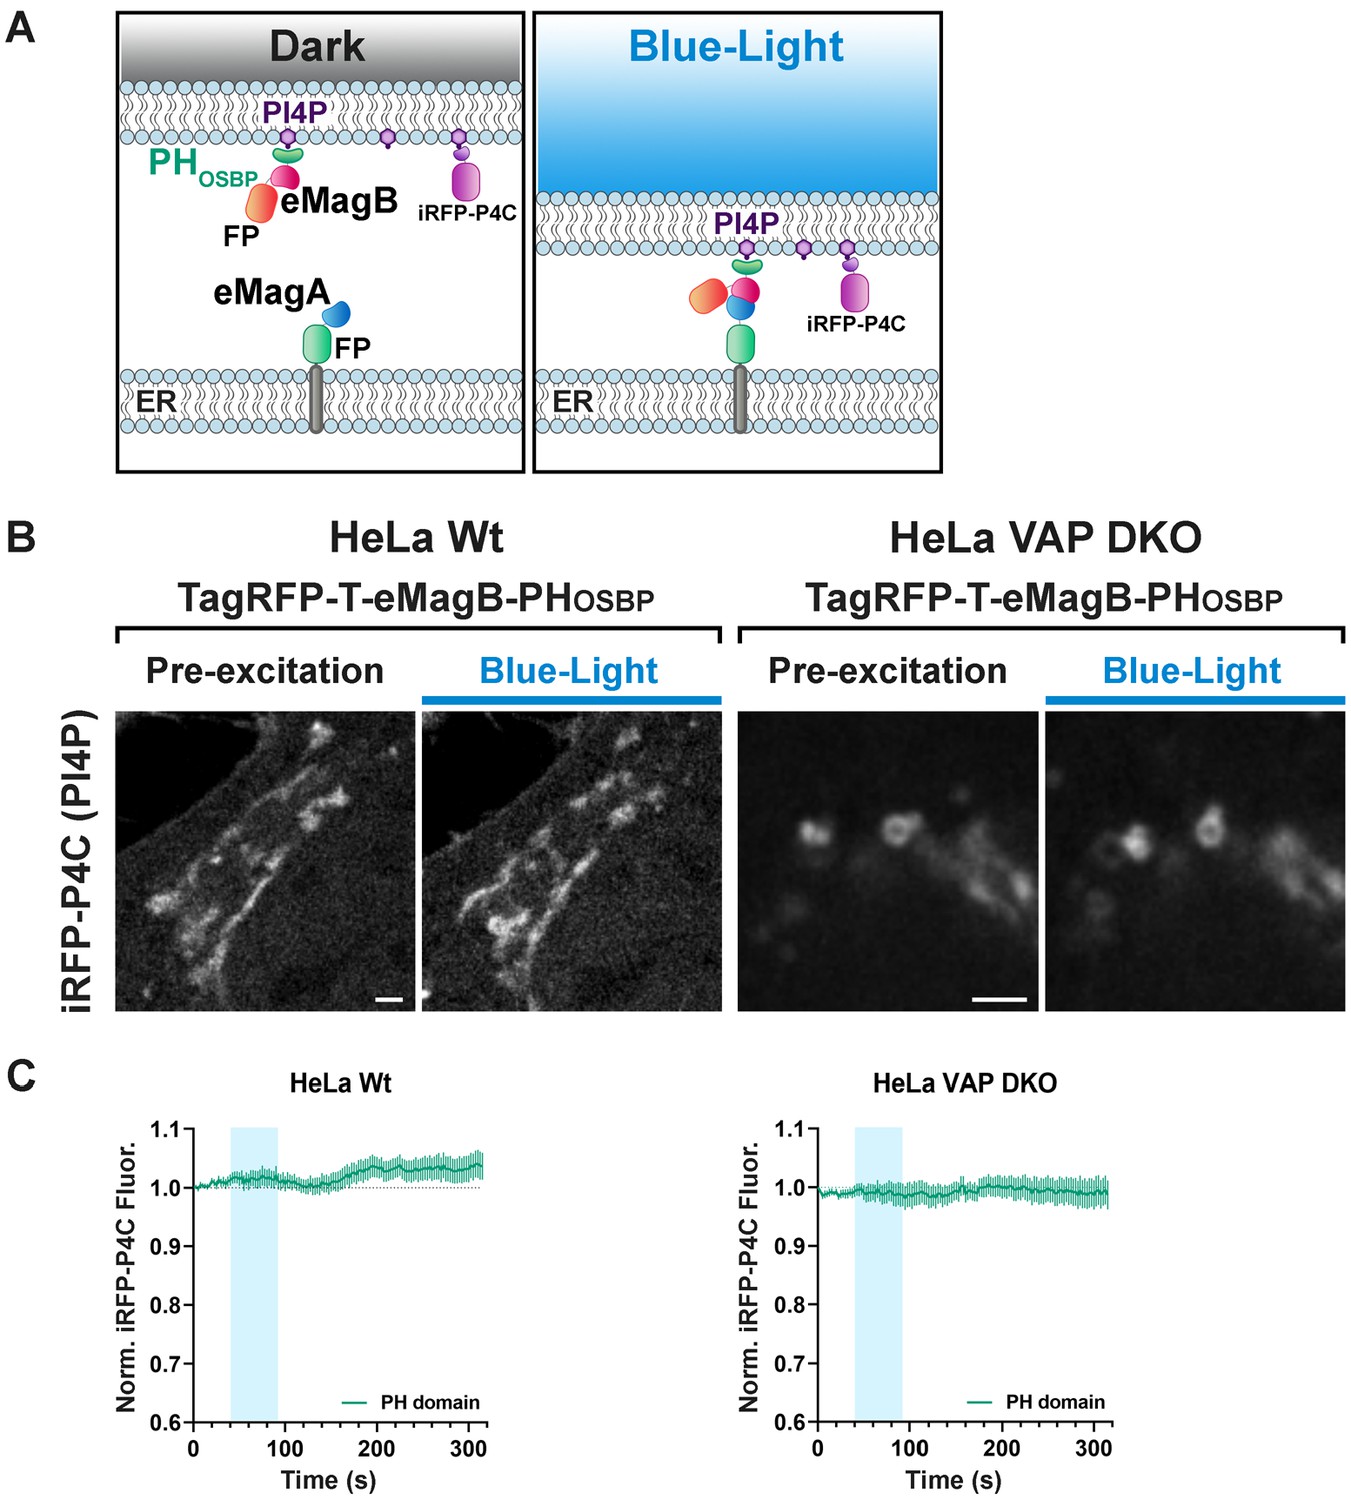
PHOSBP mediated tethering between the ER and PI4P-rich subcellular membranes is not associated with PI4P loss from these membranes.
(A) Graphical representation of the assay used to mediate VAP-independent membrane tethering of PI4P-enriched Golgi and endosomal membranes to the ER. Cells were transfected with (1) the PH domain of OSBP fused to TagRFP-T and eMagB (TagRFP-T-eMagB-PHOSBP), (2) an ER bait (ER-EGFP-eMagA), and (3) a PI4P reporter (iRFP-P4C). Before light activation (Dark), TagRFP-T-eMagB-PHOSBP is partially cytosolic and already partially bound to PI4P-enriched Golgi membranes (in WT cells) and Golgi/endosome hybrid membranes (in VAP-DKO cells). Upon blue-light illumination, eMags associated with the ER, including ER in proximity of the Golgi and endosomes, brings PI4P-enriched Golgi, or hybrid endosome-Golgi organelles, in close apposition to the ER, but no PI4P loss occurs given the absence of the ORD. (B) High-magnification view of the Golgi complex of a WT cell and of the hybrid Golgi/endosome organelles of a VAP-DKO HeLa cell expressing the constructs indicated in (A). The iRFP-P4C (PI4P) signal is shown. Blue light-dependent formation of the tether does not reduce PI4P levels on these organelles. Scale bar: 5 µm (WT) and 2 µm (DKO). (C) Quantification of the results shown in (B). WT HeLa (N = 16); VAP-DKO HeLa (N = 17).
-
Figure 4—figure supplement 3—source data 1
Changes of normalized iRFP-P4C (PI4P) fluorescence in the Golgi complex before, during, and after TagRFP-T-eMagB-PHOSBP recruitment to the ER in wild-type and VAP-DKO HeLa cells.
- https://cdn.elifesciences.org/articles/63230/elife-63230-fig4-figsupp3-data1-v2.xlsx
Videos
Video 1
Rapid and reversible recruitment of the cytosolic prey eMagB-TagRFP-T to the mitochondrially associated bait eMagA-EGFP-Mito (HeLa cells).
Whole-cell illumination with 0.5 Hz blue-light pulses for 60 s. Scale bar: 5 μm.
Video 2
Rapid and reversible accumulation of the cytosolic prey eMagB-TagRFP-T on the surface of the endoplasmic reticulum in COS7 cells expressing the ER-associated bait ER-EGFP-eMagA.
Whole-cell illumination experiment. Scale bar: 2 μm.
Video 3
Localized recruitment of the cytosolic prey eMagB-TagRFP-T to the ER-associated bait ER-EGFP-eMagA in a 3 µm x 3 µm ROI (blue square) of the ER.
HeLa cell. Scale bar: 5 μm.
Video 4
Soluble prey (eMagB-TagRFP-T) recruitment to individual lysosomes identified by the lysosomal marker Lamp1-iRFP, in primary hippocampal neurons at 14 DIV, expressing the lysosome-specific bait Lys-eMagA-EGFP.
Scale bar: 5 μm.
Video 5
Rapid cycles of PI(4,5)P2 dephosphorylation and rephosphorylation in primary hippocampal neurons at 7 DIV.
Scale bar: 5 μm.
Video 6
Light-induced contacts between the ER and lysosomes in COS7 cells expressing ER-mCherry-eMagA (green) and Lys-eMagB-iRFP (magenta).
Scale bar: 2 μm.
Video 7
Light-induced contacts between the ER and mitochondria in HeLa cells expressing ER-mCherry-eMagA (green) and eMagB-iRFP-Mito (magenta).
Scale bar: 2 μm.
Video 8
Light-induced contacts between mitochondria and lysosomes in HeLa cells expressing eMagA-mCherry-Mito (green) and Lys-eMagB-iRFP (magenta).
Scale bar: 2 μm.
Video 9
Fission of a mitochondrion caused by a moving lysosome anchored to the mitochondrion upon light-dependent interaction mediated by eMags dimerization.
HeLa cells expressing eMagA-mCherry-Mito (green) and Lys-eMagB-iRFP (magenta). Scale bar: 0.5 μm.
Video 10
Rapid and reversible loss of iRFP-P4C from the Golgi upon light-dependent reconstitution of VAPB on ER membranes in wild-type HeLa cells.
TagRFP-T-VAPB(1-218)-eMagB is shown on the left, iRFP-P4C is shown on the right. Scale bar: 5 μm.
Video 11
Rapid and reversible loss of iRFP-P4C from Golgi/endosome hybrid organelles in VAP-DKO HeLa cells upon light-dependent reconstitution of VAPB on ER membranes.
TagRFP-T-VAPB(1-218)-eMagB is shown on the left, iRFP-P4C is shown on the right. Scale bar: 5 μm.
Tables
Key resources table
| Reagent type (species) or resource | Designation | Source or reference | Identifiers | Additional information |
|---|---|---|---|---|
| Sequence-based reagent | eMagAF ATGGGACACACTCTTTACGCCCCTGGAGGATACGACATTATGGGATATTTGGATCAGATTGCGAACCGCCCAAACCCTCAGGTCGAACTGGGGCCTGTGGACCTGTCATGTGCCCTGATCCTGTGCGATCTGAAGCAAAAGGACACTCCGATCGTCTACGCCTCGGAAGCCTTCTTGGAGATGACCGGATACAACAGACATGAGGTGCTCGGCAGGAACTGCAGATTCCTGCAGTCCCCCGACGGGATGGTGAAACCAAAGTCGACTCGCAAATATGTGGACTCGAACACGATCTTCACCATCAAGAAGGCCATCGACCGGAACGCCGAGGTCCAGGTGGAGGTGGTCAACTTTAAGAAGAACGGCCAGCGGTTCGTGAACTTTCTGACCATCATTCCGGTCCGGGATGAAACCGGAGAGTACAGATACTCCATCGGATTCCAGTGCGAAACCGAA | This paper | GenBank accession number: MW203024 | See Main Text, Materials and methods and Supplementary file 3 |
| Sequence-based reagent | eMagBF ATGGGACATACCCTCTACGCGCCGGGGGGTTATGACATCATGGGTTACCTCAGACAGATCAGAAACCGGCCGAACCCACAAGTGGAGCTGGGACCCGTCGACCTCTCCTGCGCCCTCGTGCTGTGTGACCTTAAGCAGAAGGACACCCCTGTGGTGTACGCCTCCGAAGCATTCCTGGAGATGACCGGGTACAACAGACACGAAGTGCTGGGACGGAACTGCCGCTTCCTGCAATCCCCGGATGGAATGGTGAAGCCTAAGTCAACCCGCAAATACGTGGACTCCAACACTATCTTCACCATGAAGAAGGCCATTGACCGCAATGCTGAGGTGCAAGTGGAAGTGGTGAACTTCAAGAAGAACGGACAGCGCTTCGTCAACTTCCTGACTATGATTCCCGTGCGGGACGAAACCGGCGAATACCGGTACAGCATCGGGTTTCAGTGCGAGACTGAG | This paper | GenBank accession number: MW203025 | See Main Text, Materials and methods and Supplementary file 3 |
| Sequence-based reagent | eMagA ATGGGACACACTCTTTACGCCCCTGGAGGATACGACATTATGGGATATTTGGATCAGATTGCGAACCGCCCAAACCCTCAGGTCGAACTGGGGCCTGTGGACCTGTCATGTGCCCTGATCCTGTGCGATCTGAAGCAAAAGGACACTCCGATCGTCTACGCCTCGGAAGCCTTCTTGGAGATGACCGGATACAACAGACATGAGGTGCTCGGCAGGAACTGCAGATTCCTGCAGTCCCCCGACGGGATGGTGAAACCAAAGTCGACTCGCAAATATGTGGACTCGAACACGATCTACACCATCAAGAAGGCCATCGACCGGAACGCCGAGGTCCAGGTGGAGGTGGTCAACTTTAAGAAGAACGGCCAGCGGTTCGTGAACTTTCTGACCATCATTCCGGTCCGGGATGAAACCGGAGAGTACAGATACTCCATCGGATTCCAGTGCGAAACCGAA | This paper | GenBank accession number: MW203026 | See Main Text, Materials and methods and Supplementary file 3 |
| Sequence-based reagent | eMagB ATGGGACATACCCTCTACGCGCCGGGGGGTTATGACATCATGGGTTACCTCAGACAGATCAGAAACCGGCCGAACCCACAAGTGGAGCTGGGACCCGTCGACCTCTCCTGCGCCCTCGTGCTGTGTGACCTTAAGCAGAAGGACACCCCTGTGGTGTACGCCTCCGAAGCATTCCTGGAGATGACCGGGTACAACAGACACGAAGTGCTGGGACGGAACTGCCGCTTCCTGCAATCCCCGGATGGAATGGTGAAGCCTAAGTCAACCCGCAAATACGTGGACTCCAACACTATCTACACCATGAAGAAGGCCATTGACCGCAATGCTGAGGTGCAAGTGGAAGTGGTGAACTTCAAGAAGAACGGACAGCGCTTCGTCAACTTCCTGACTATGATTCCCGTGCGGGACGAAACCGGCGAATACCGGTACAGCATCGGGTTTCAGTGCGAGACTGAG | This paper | GenBank accession number: MW203027 | See Main Text, Materials and methods and Supplementary file 3 |
| Recombinant DNA reagent | nMagHigh1-EGFP-CAAX | Kawano et al., 2015 PMID:25708714 | RRID:addgene_67300 | |
| Recombinant DNA reagent | pMagFast2(3x)-iRFP | Kawano et al., 2015 PMID:25708714 | RRID:addgene_67297 | |
| Recombinant DNA reagent | iSH2-pMag(3x)-iRFP | Kawano et al., 2015 PMID:25708714 | RRID:addgene_67298 | |
| Recombinant DNA reagent | nMagHigh1-EGFP-Mito | This paper | See Materials and methods PCR primers: Primer Fw: 5’ CGTCAGATCCGCTAGCATGGGACACACTCTTTACG Primer Rw: 5’ TGCACCTGCACTCGAGCCCCCTTGTACAGCTCGTC 3 | |
| Recombinant DNA reagent | pGFP-OMP25 | Nemoto and De Camilli, 1999 PMID:10357812 | ||
| Recombinant DNA reagent | pMagFast2(1x)-TagRFP-T | This paper | See Main Text, Materials and methods and Supplementary file 2 InFusion PCR primers: Primer Fw: 5’ GTTTAAACTTAAGCTTgccaccatgggaCATACCCTCTACGCGCCG Primer Rw: 5’ AAACGGGCCCTCTAGATCACTTGTACAGCTCGTCC | |
| Recombinant DNA reagent | pMagFast2(3x) -TagRFP-T | Benedetti et al., 2018 PMID:29463750 | ||
| Recombinant DNA reagent | eMagAF-EGFP-Mito | This paper | RRID:addgene_162243 | See Main Text, Materials and methods and Supplementary file 1 |
| Recombinant DNA reagent | eMagA-EGFP-Mito | This paper | RRID:addgene_162244 | See Main Text, Materials and methods and Supplementary file 1 |
| Recombinant DNA reagent | eMagB-TagRFP-T | This paper | RRID:addgene_162252 | See Main Text, Materials and methods and Supplementary file 2 |
| Recombinant DNA reagent | eMagBF-TagRFP-T | This paper | RRID:addgene_162253 | See Main Text, Materials and methods and Supplementary file 2 |
| Recombinant DNA reagent | ER-EGFP-eMagA | This paper | RRID:addgene_162245 | See Main Text, Materials and methods and Supplementary file 1 |
| Recombinant DNA reagent | ER-mCherry-eMagA | This paper | RRID:addgene_162248 | See Main Text, Materials and methods and Supplementary file 1 |
| Recombinant DNA reagent | eMagA-mCherry-Mito | This paper | RRID:addgene_162251 | See Main Text, Materials and methods and Supplementary file 1 |
| Recombinant DNA reagent | eMagB-iRFP-Mito | This paper | RRID:addgene_162250 | See Main Text, Materials and methods and Supplementary file 1 |
| Recombinant DNA reagent | Lys-eMagB-iRFP | This paper | RRID:addgene_162249 | See Main Text, Materials and methods and Supplementary file 1 |
| Recombinant DNA reagent | TagRFP-T-VAPB(1-218)-eMagB | This paper | RRID:addgene_162255 | See Main Text, Materials and methods and Supplementary file 2 |
| Recombinant DNA reagent | Lys-eMagA-EGFP | This paper | RRID:addgene_162246 | See Main Text, Materials and methods and Supplementary file 1 |
| Recombinant DNA reagent | Lys-nMagHigh1-EGFP | Benedetti et al., 2018 PMID:29463750 | ||
| Recombinant DNA reagent | Lamp1-iRFP | This paper | See Materials and methods. InFusion PCR primers: Primer Fw: 5’ CTCAAGCTTCGAATTCATGGCGGCCCCCGGCAGC Primer Rw: 5’ GGCGACCGGTGGATCCGGGATAGTCTGGTAGCCTGC | |
| Recombinant DNA reagent | piRFP670-N1 | Shcherbakova and Verkhusha, 2013 PMID:23770755 | RRID:addgene_45457 | |
| Recombinant DNA reagent | eMagAF-EGFP-PM | This paper | RRID:addgene_162247 | See Main Text, Materials and methods and Supplementary file 1 |
| Recombinant DNA reagent | mCherry- eMagBF−5ptaseOCRL | This paper | RRID:addgene_162254 | See Main Text, Materials and methods and Supplementary file 2 InFusion PCR primers: Primer Fw: 5’ TCTCGAAGCGCGGCCGCGATGGGACATACCCTCTACGCG Primer Rw: 5’ GAATGTTGACATACGATCGGGTACCTCCGCTGCCTCC |
| Recombinant DNA reagent | mCherry-pMagFast2(3x)−5ptaseOCRL | Benedetti et al., 2018 PMID:29463750 | ||
| Recombinant DNA reagent | iRFP-PHPLCδ | Idevall-Hagren et al., 2012 PMID:22847441 | ||
| Recombinant DNA reagent | TagRFP-T-eMagB-PHOSBP | This paper | See Main Text, Materials and methods and Supplementary file 2 InFusion PCR primers: Primer Fw: 5’ CACCTGCATGCGGCCGCGCCACCATGGTGTCTAAGGG Primer Rw: 5’ CGGGACCTCGAGGTTAACTCATTTCTGCCTTGATCTGTAGTAG | |
| Recombinant DNA reagent | GFP-PHOSBP | Dr. Tim Levine, UCL Institute of Ophthalmology | ||
| Recombinant DNA reagent | iRFP-P4C | This paper | See Materials and methods InFusion PCR primers: Primer Fw: 5’ CGCTAGCGCTACCGGTATGGCGCGTAAGGTCGATCTCACC Primer Rw: 5’ AGTCCGGACTTGTACAtGCGTTGGTGGTGGGCGGC | |
| Recombinant DNA reagent | GFP-P4CSidC | Dr. Yuxin Mao, Cornell | ||
| Commercial assay or kit | In-Fusion HD Cloning Kit | Takara Bio | Cat. No. 638910 | |
| Cell line (Homo sapiens) | HeLa | ATCC | CCL-2 | |
| Cell line (Cercopithecus aethiops) | COS-7 | ATCC | CRL-1651 | |
| Cell line (Homo sapiens) | HeLa VAPDKO | Dong et al., 2016 | Cell line generated in the De Camilli Lab | |
| Biological sample (Mus musculus) | Primary hippocampal neurons | Charles River | C57BL/6 | |
| Chemical compound, drug | Itraconazole | Tocris | Cat. No. 5981 | |
| Software, algorithm | TBLASTN | NCBI | (TBLASTN, RRID:SCR_011822) | |
| Software, algorithm | PyMOL | Schrödinger, Inc | (PyMOL, RRID:SCR_000305) | PyMOL 2.3.5. |
| Software, algorithm | Fiji | NIH | Fiji, RRID:SCR_002285 | ImageJ Version: 2.0.0-rc-69/1.52 p, Wayne Rasband, National Institute of Health, USA, http://fiji.sc/wiki/index.php/Fiji |
| Software, algorithm | MATLAB | MathWorks | (MATLAB, RRID:SCR_001622) | MATLAB 2019a |
| Software, algorithm | Graph Pad | Graph Pad Software | (GraphPad Prism, RRID:SCR_002798) | GraphPad Prism 8.2.1 |
Additional files
-
Supplementary file 1
Constructs used to express wild-type or mutant Magnets on different subcellular compartments.
The organelle‐targeting sequences (OTS) used and their position, the fluorescent tag, and the original or mutant Magnets used in each construct are indicated.
- https://cdn.elifesciences.org/articles/63230/elife-63230-supp1-v2.docx
-
Supplementary file 2
Constructs encoding the soluble prey proteins used in this study.
- https://cdn.elifesciences.org/articles/63230/elife-63230-supp2-v2.docx
-
Supplementary file 3
Mutants tested.
- https://cdn.elifesciences.org/articles/63230/elife-63230-supp3-v2.docx
-
Supplementary file 4
Primers for optimization of the Magnets heterodimer interface.
- https://cdn.elifesciences.org/articles/63230/elife-63230-supp4-v2.docx
-
Supplementary file 5
Primers for thermostabilization of the Magnets proteins.
- https://cdn.elifesciences.org/articles/63230/elife-63230-supp5-v2.docx
-
Supplementary file 6
Fit parameters.
- https://cdn.elifesciences.org/articles/63230/elife-63230-supp6-v2.docx
-
Transparent reporting form
- https://cdn.elifesciences.org/articles/63230/elife-63230-transrepform-v2.docx
Download links
A two-part list of links to download the article, or parts of the article, in various formats.
Downloads (link to download the article as PDF)
Open citations (links to open the citations from this article in various online reference manager services)
Cite this article (links to download the citations from this article in formats compatible with various reference manager tools)
Optimized Vivid-derived Magnets photodimerizers for subcellular optogenetics in mammalian cells
eLife 9:e63230.
https://doi.org/10.7554/eLife.63230


