Cellular birthdate predicts laminar and regional cholinergic projection topography in the forebrain
- Neuroscience Institute, New York University, United States
- Department of Neurobiology, Harvard Medical School, United States
- Stanley Center for Psychiatric Research, Broad Institute, United States
- Department of Neurosurgery, Massachusetts General Hospital and Harvard Medical School, United States
- Northeastern University, United States
Figures
Figure 1 with 3 supplements
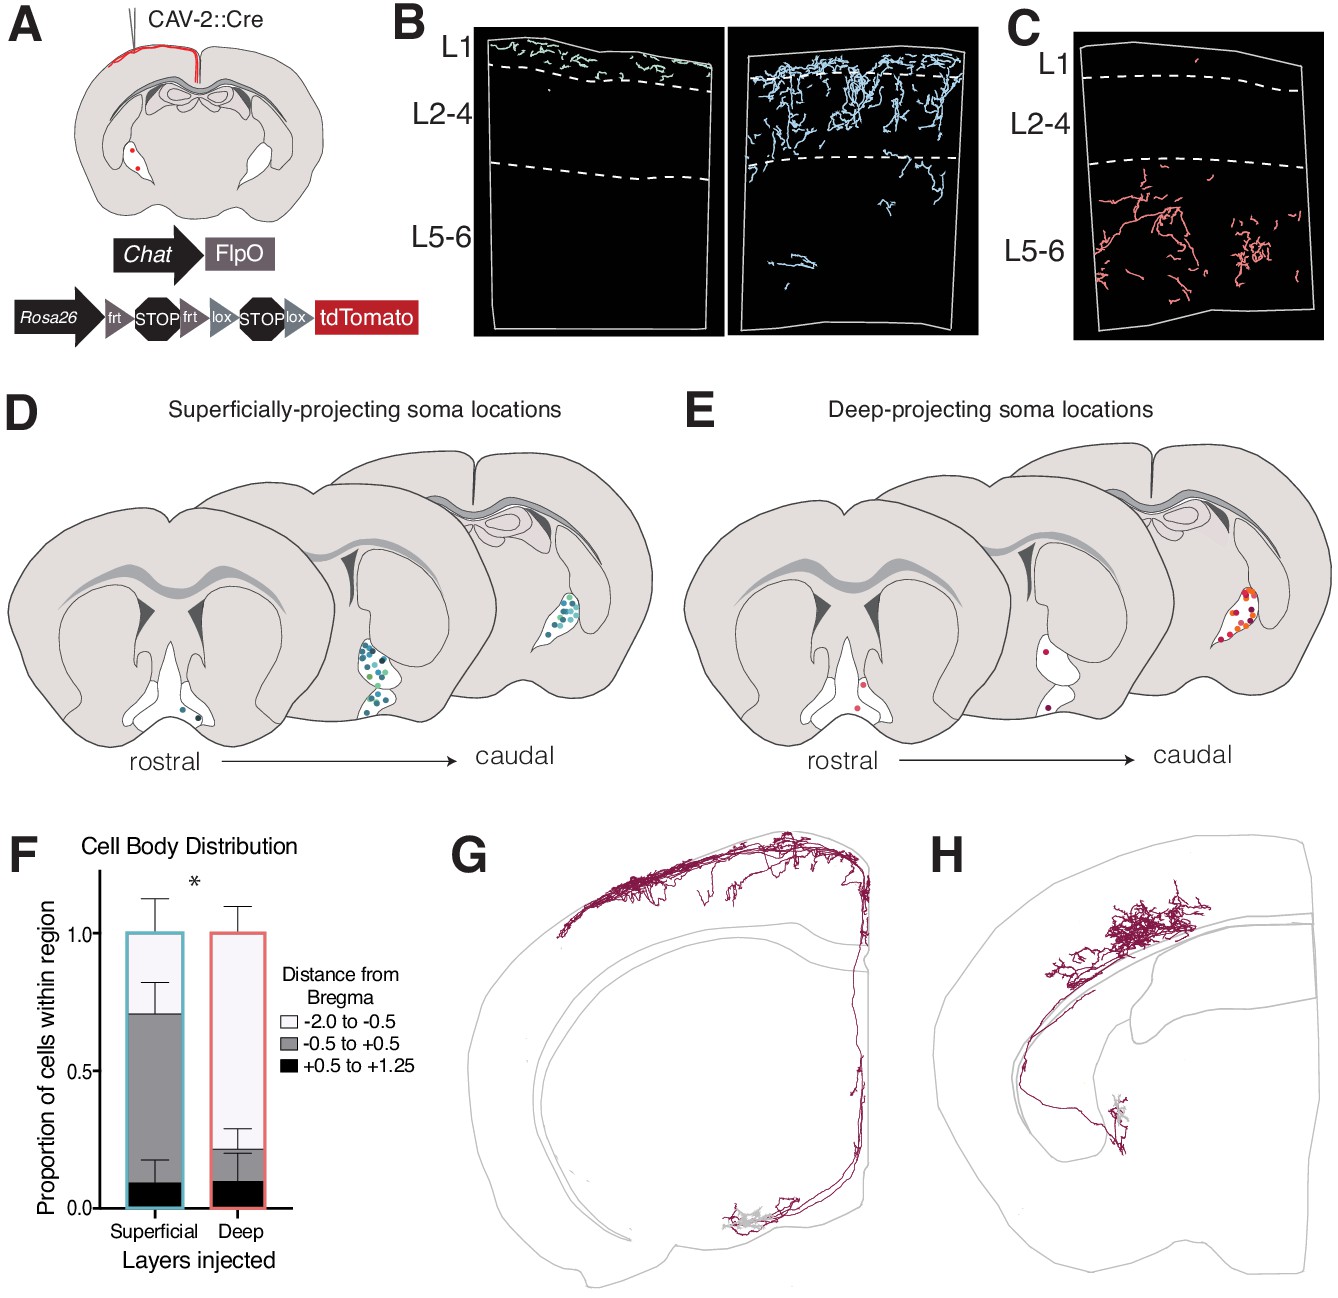
Retrograde labeling of layer-specific cholinergic projections in the somatosensory cortex.
See also Figure 1—figure supplements 1, 2 and 3. (A) Genetic and viral strategy for specific labeling of cholinergic efferents to superficial or deep layers of the somatosensory cortex. (B) Reconstructed fibers within representative sections of the somatosensory cortex from superficial layer injections, some of which were remarkably L1-specific (left) and some which exhibited fibers in L1-4 (right). (C) Reconstructed fibers within representative sections from a deep layer injection. (D and E) Cell body locations within the basal forebrain of cholinergic neurons labeled in superficial- (D) or deep- (E) layer injections. Shades of colors within (D) and (E) represent individual animals (superficial injections n = 6, deep injections n = 5). (F) Proportions of labeled cell bodies located across the rostral to caudal axis in the basal forebrain. Proportions were calculated for each injection individually then averaged, error bars show SEM. Two-way ANOVA F(2,18) = 13.63, p=0.0037; Sidak’s multiple comparisons test shows the proportion of cells located between Bregma −0.5 and +0.5 is significantly different between groups (p=0.0466). (G) Complete reconstruction of a cholinergic neuron with the majority of its axonal arborizations in L1. (H) Complete reconstruction of a cholinergic neuron with restricted projections in L5-6. Reconstructions are shown on a representative hemisphere from a coronal section. Red fibers indicate axonal projections, gray fibers indicate dendrites.
Figure 1—figure supplement 1

Precise and efficient recombination mediated by the Chat-ires-Flpo driver.
(A–D) Anti-ChAT immunohistochemistry (IHC; green) performed on coronal tissue sections (20 μm thick) from P17 ChatFlpO; Dlx6aCre (pan-ventral forebrain driver); Rosa26Ai65 brains. ChAT+ cells labeled by the ChatFlpo driver express tdTomato (red) in this cross. (A) Striatum: 95% of ChAT+ neurons identified by anti-ChAT IHC co-express tdTomato (527/555 cells counted). (B) Medial septum/diagonal band: 99% (576/580 cells counted). (C–D) Diagonal band/substantia innominata/nucleus basalis: 97% (437/449 cells counted). Scale bars in all panels represent 300 μm.
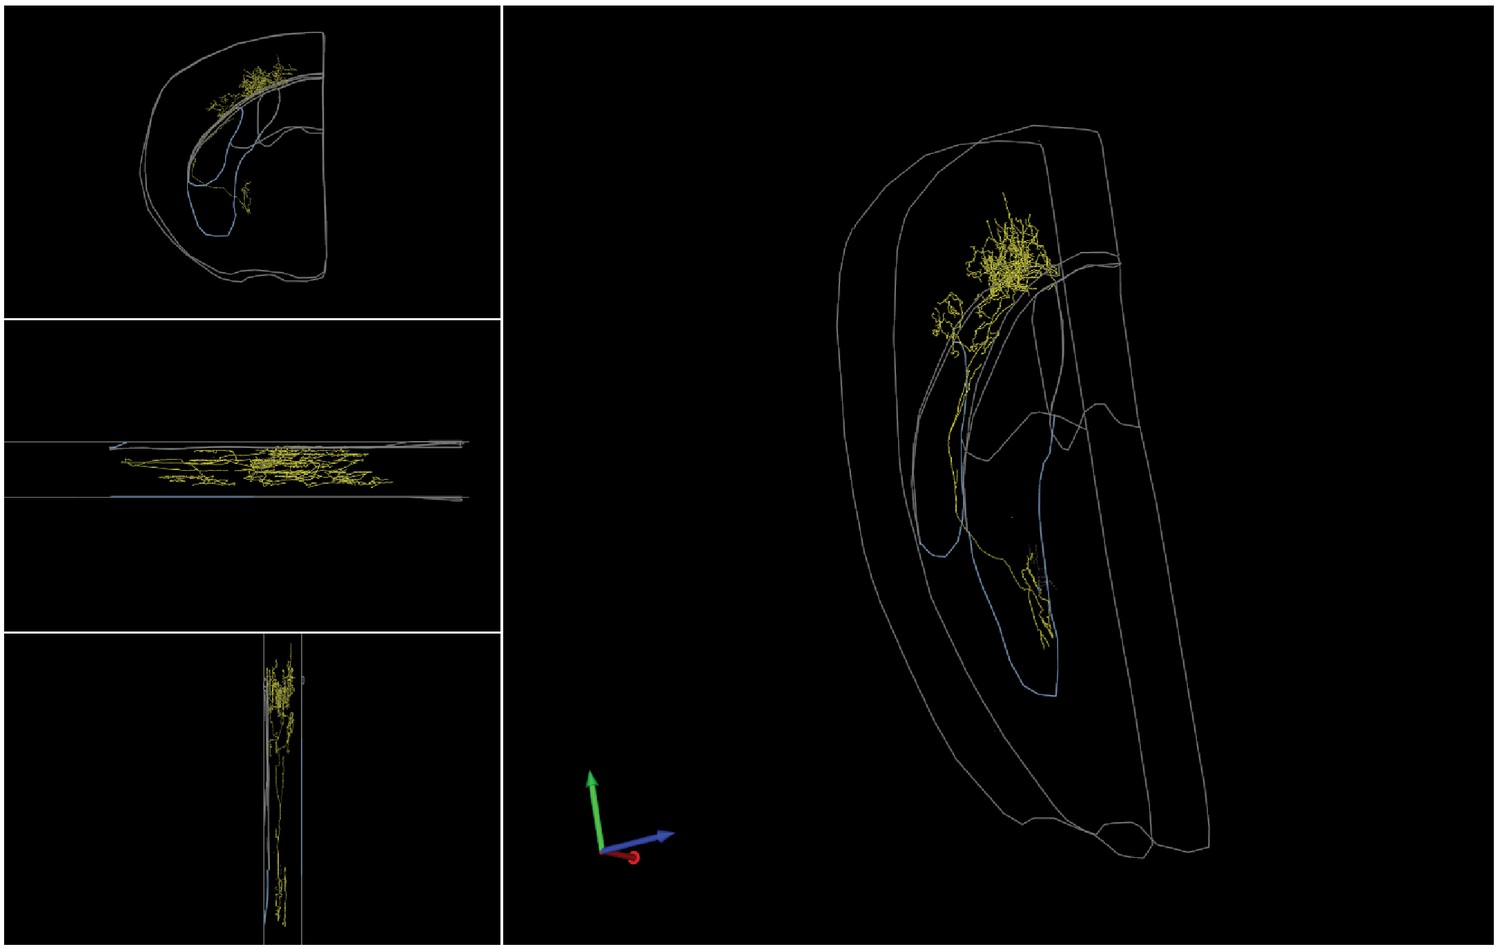
Figure 1—figure supplement 2
Complete reconstruction of a L1-targeting cholinergic projection neuron.
Left top, front view. Left middle, top view. Left bottom, side view. Right, 3D view.
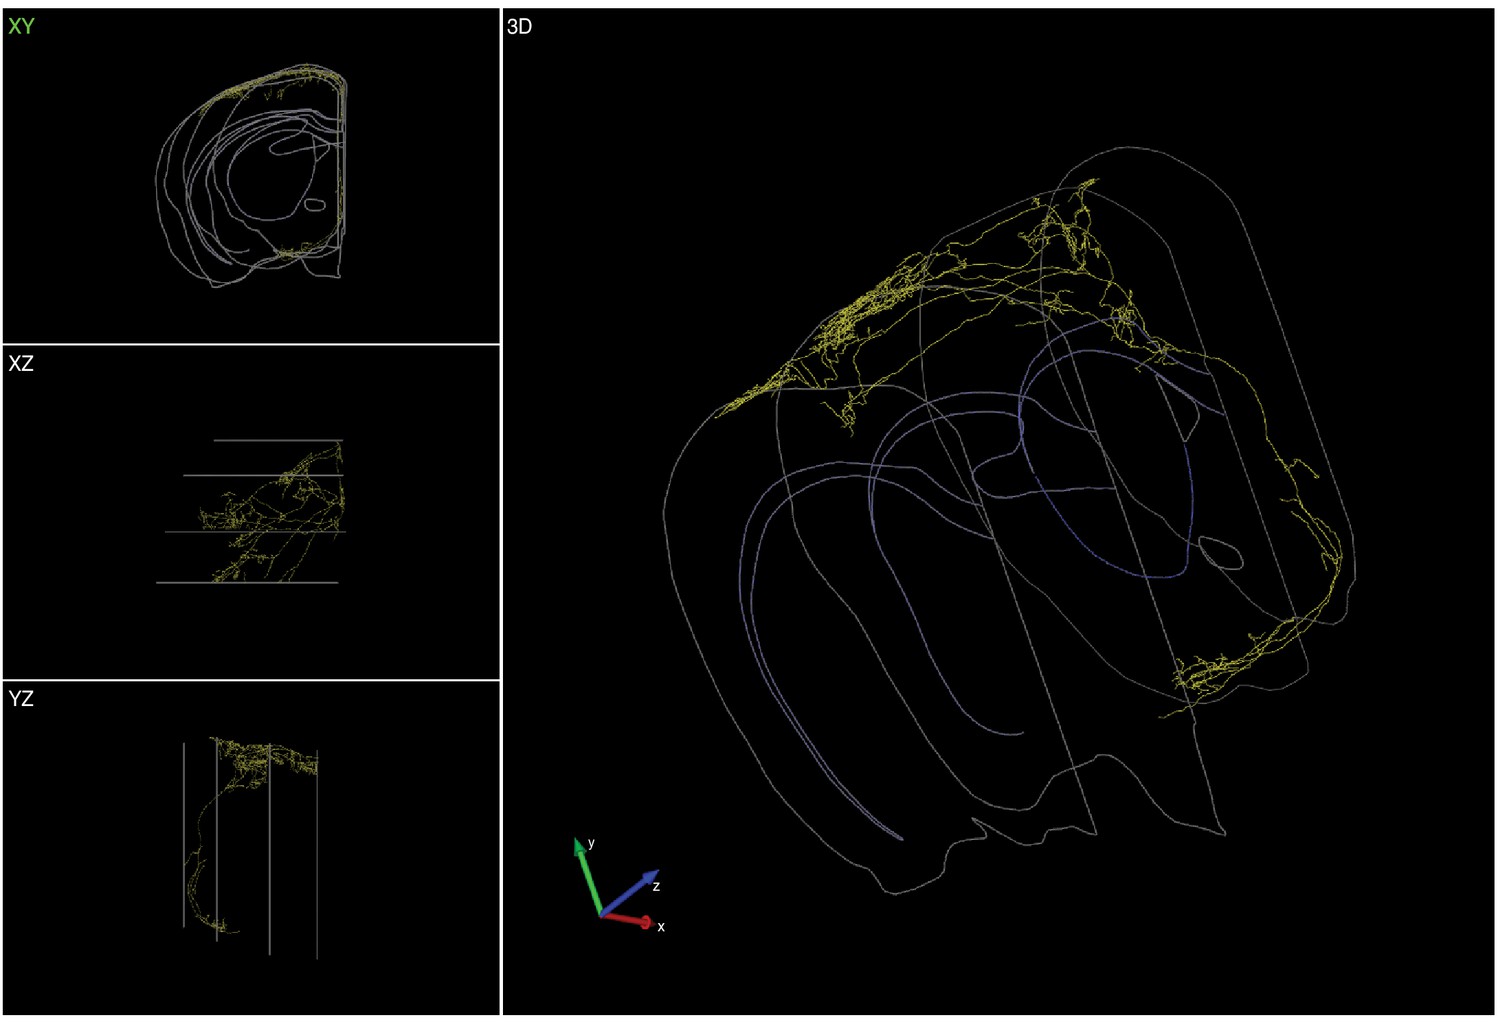
Figure 1—figure supplement 3
Complete reconstruction of a L5/6-targeting cholinergic projection neuron.
Left top, front view. Left middle, top view. Left bottom, side view. Right, 3D view.
Figure 2
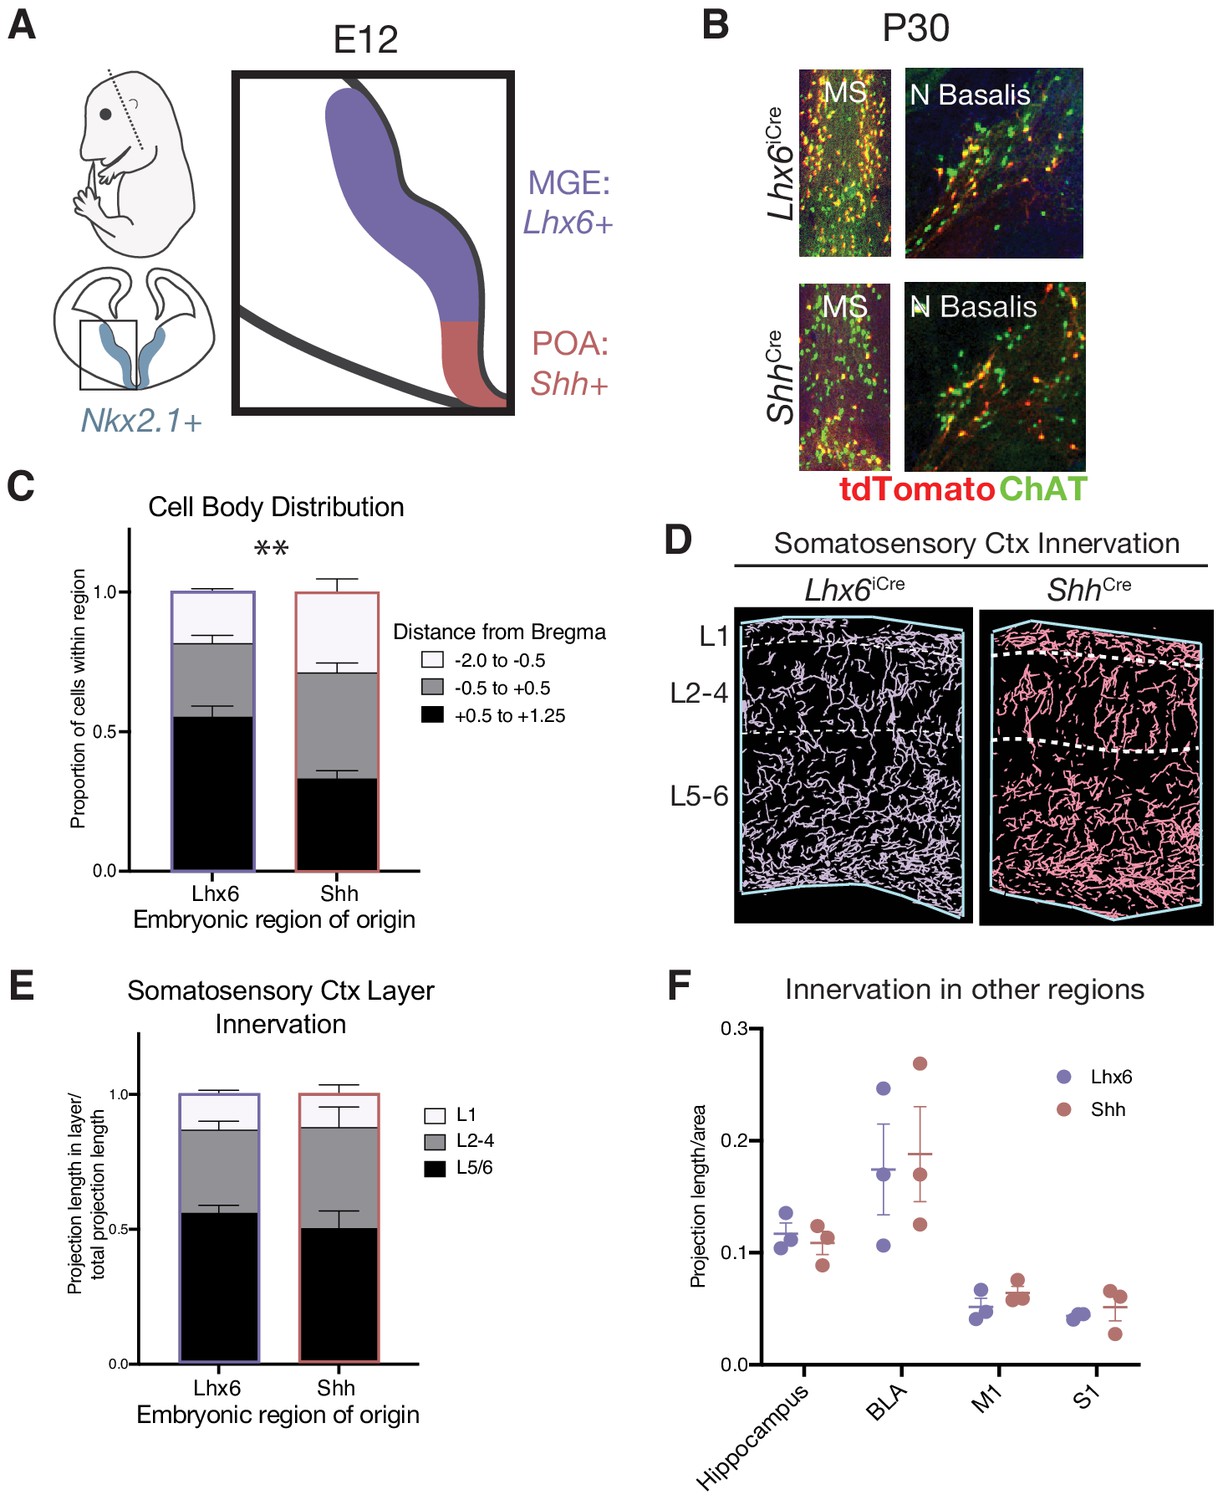
Spatial embryonic origin does not predict projection topography of cholinergic neurons.
(A) Genetic strategy for fate mapping cells from the medial ganglionic eminence (MGE) or preoptic area (POA) based on differential gene expression. (B) Fate mapped cells in the P30 medial septum (MS) and nucleus basalis (N Basalis) from ChatFlpO;Lhx6iCre;Rosa26Ai65 or ChatFlpO;ShhCre;Rosa26Ai65 animals stained with an anti-ChAT antibody. (C) Quantification of cell body distribution in the adult brain of cells originating in the MGE (Lhx6, n = 3 animals) or POA (Shh, n = 4 animals) (two-way ANOVA, F(2, 10)=9.25, p<0.0053). (D) Reconstructions of axonal projections within a representative section of the P30 somatosensory cortex from fate-mapped brains. (E) Quantification of projection density within cortical layers for spatial fate mapped brains. Two-way ANOVA revealed no significant difference between groups (F(2, 6)=0.9034, p=0.4311) (Lhx6 n = 3 animals, Shh n = 3 animals). (F) Quantification of projection density within other cholinergic target regions revealed no significant differences between groups (two-way ANOVA, F(2, 6)=0.1064, p=0.9552). Each dot represents quantification for that region from an individual animal.
Figure 3 with 1 supplement
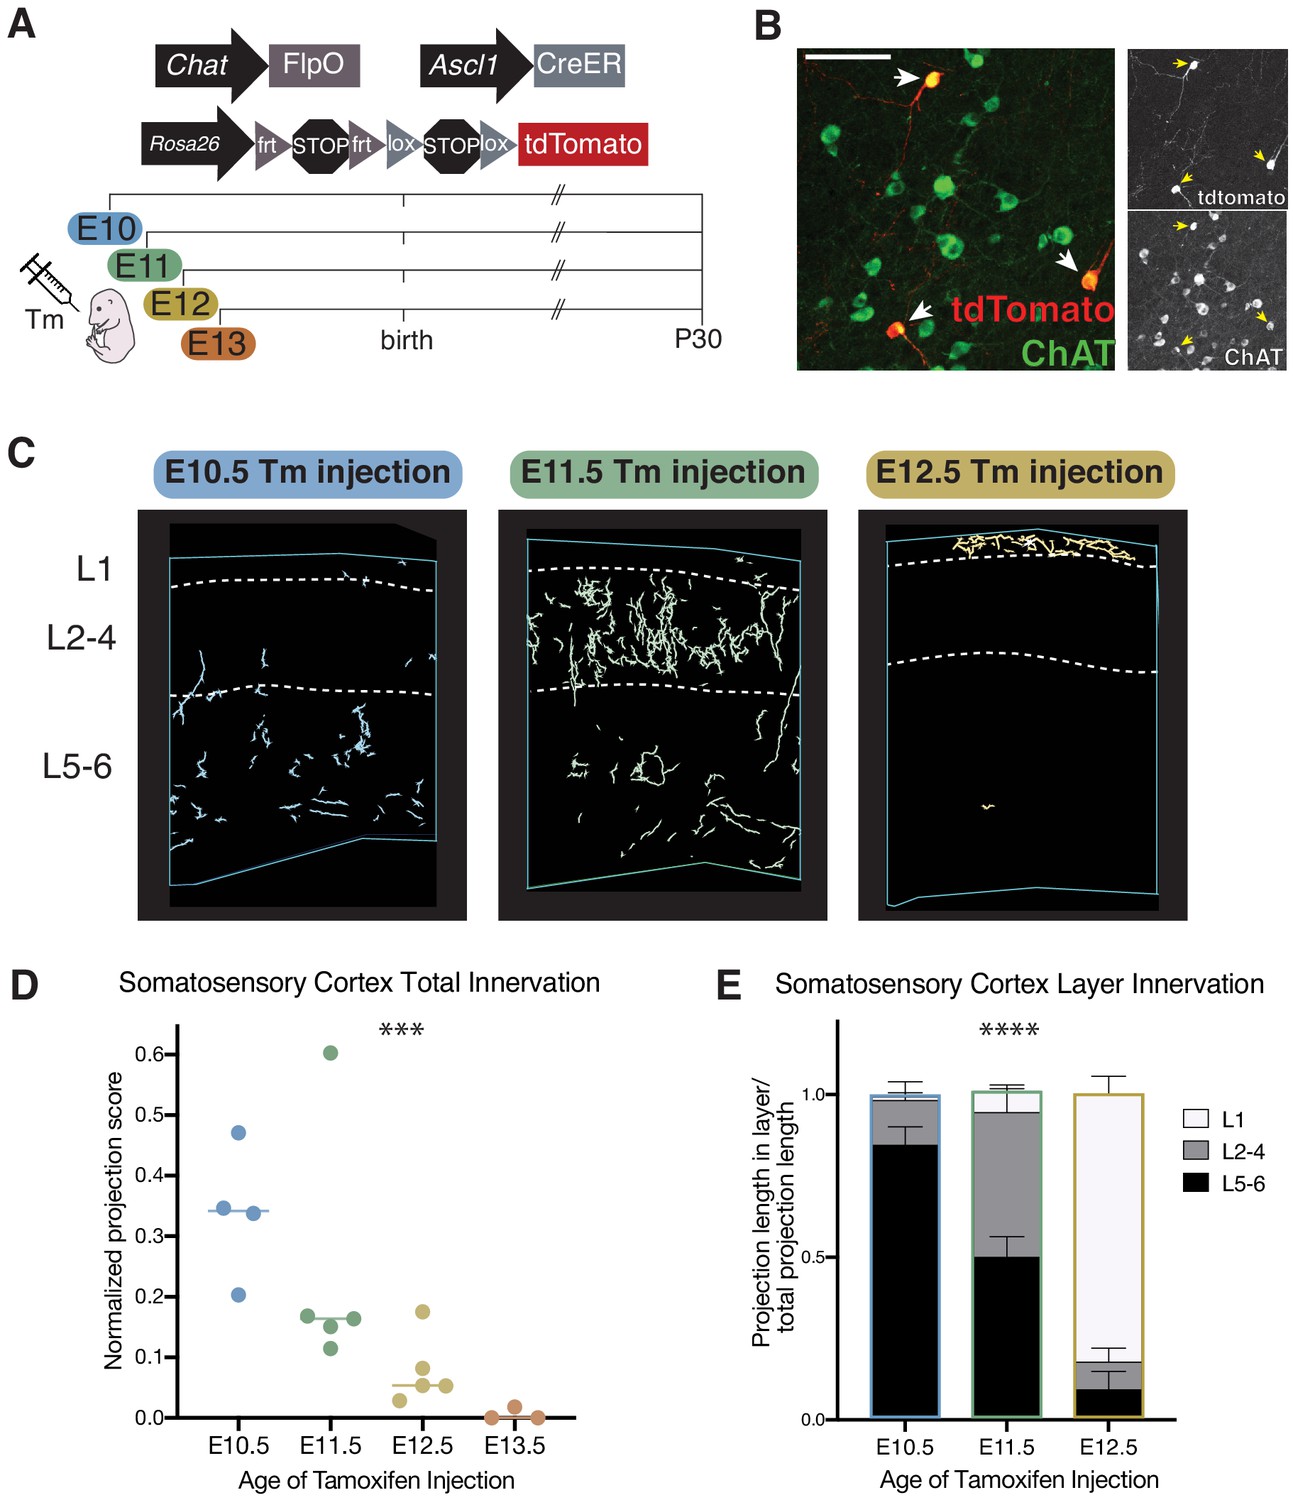
Cellular birthdate predicts layer-specific cholinergic projection topography in the primary somatosensory cortex.
See also Figure 3—figure supplement 1. (A) Experimental design for tamoxifen (Tm) induction of CreER activity for neuronal birthdating. (B) Example of E11 tamoxifen-birthdated cholinergic neurons at P30 in the substantia innominata. Scale bar = 100 μm. (C) Reconstructions of birthdated cholinergic projections within representative sections of the P30 somatosensory cortex. E13 brains have little to no axonal projections within this region. (D) Quantification of overall somatosensory cortex innervation at P30 for cholinergic neurons born at each timepoint (one-way ANOVA (F(3,13) = 10.86, p=0.0008)). Each dot represents an individual animal. (E) Quantification of innervation to specific cortical layers for each birthdated cohort (two-way ANOVA (F(4, 22)=48.20, p<0.0001)).
Figure 3—figure supplement 1
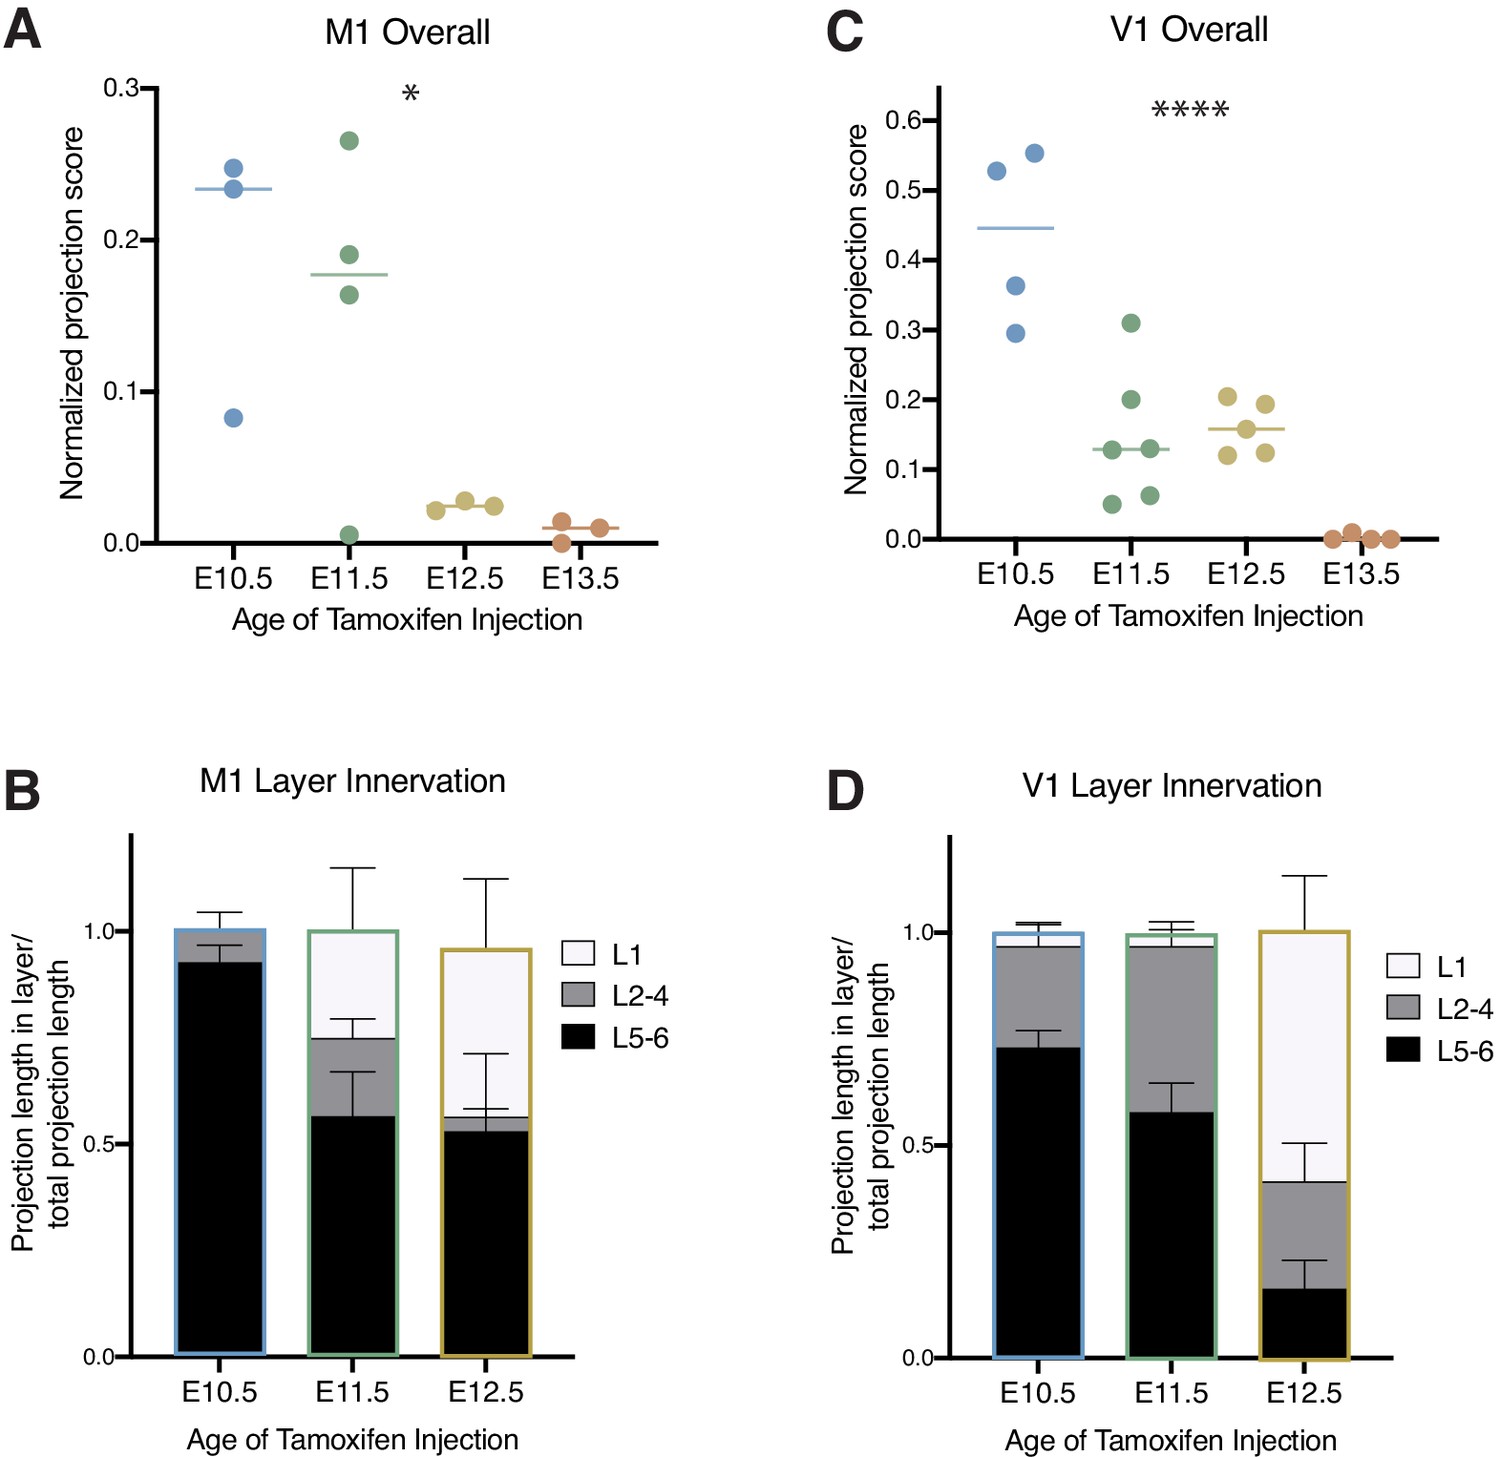
Birthdated cholinergic neuron projections to the primary motor and primary visual cortices.
(A) Quantification of overall primary motor cortex (M1) innervation at P30 for cholinergic neurons born at each timepoint (one-way ANOVA (F(3,9) = 4.458), p=0.0352). (B) Quantification of innervation to specific layers of M1 for each birthdated cohort (two-way ANOVA (F(4, 14)=2.514, p=0.0888)). (C) Quantification of overall primary visual cortex (V1) innervation at P30 for cholinergic neurons born at each timepoint (one-way ANOVA (F(3,15) = 19.77, p<0.0001)). (D) Quantification of innervation to specific layers of V1 for each birthdated cohort (two-way ANOVA (F(4, 24)=12.95, p<0.0001)).
Figure 4
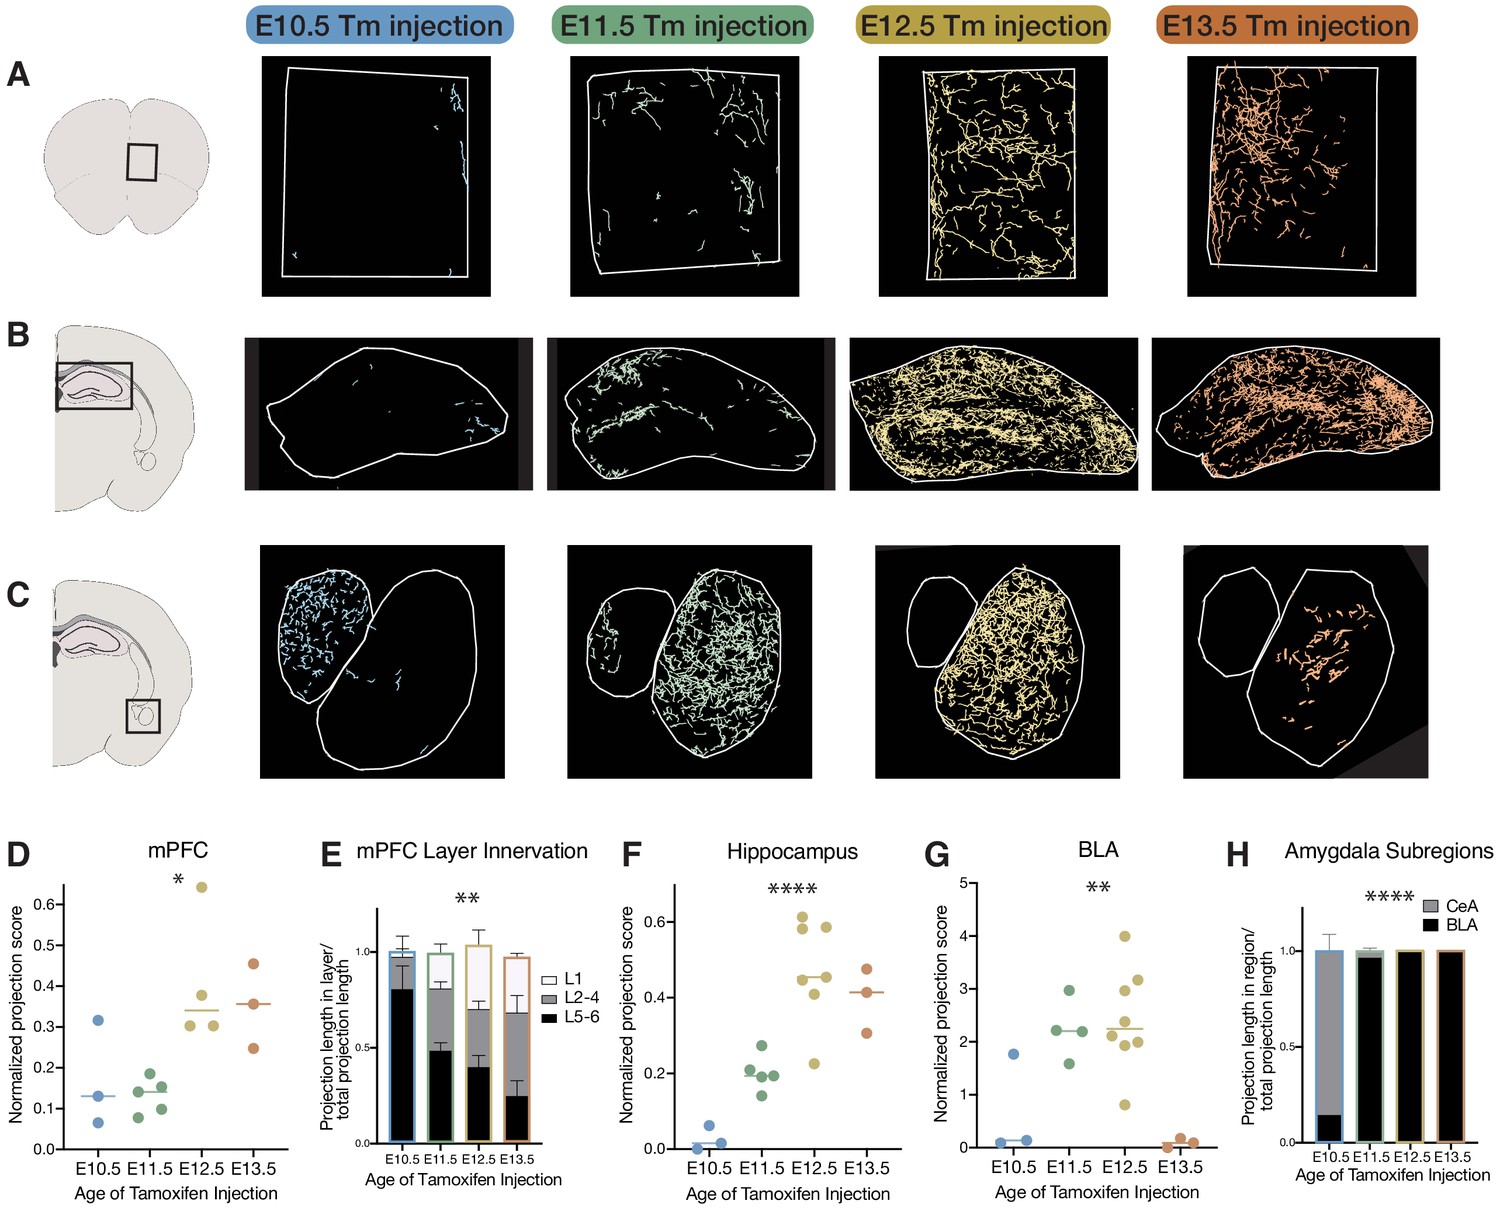
Birthdate predicts cholinergic topography in the hippocampus, amygdala, and mPFC.
(A) Examples of birthdated cholinergic neuron projections to the medial prefrontal cortex (mPFC). (B) Examples of birthdated cholinergic neuron projections to the hippocampus at P30. (C) Examples of birthdated cholinergic neuron projections to the amygdala. Right, smaller outline represents central amygdala (CeA) and left, larger outline represents basolateral amygdala (BLA). (D) Quantification of total projections to the mPFC from birthdated cohorts of cholinergic neurons (one-way ANOVA, F(3,11) = 5.691, p=0.0133). (E) Quantification of innervation to specific layers of mPFC for each birthdated cohort (two-way ANOVA (F(6, 22)=5.678), p=0.0011). (F) Quantification of total projections to the hippocampus from birthdated cohorts of cholinergic neurons (one-way ANOVA, F(3,14) = 17.51, p<0.0001). (G) Quantification of total projections to the amgydala from birthdated cohorts of cholinergic neurons (one-way ANOVA, F(3,14) = 8.219, p=0.0021). (H) Quantification of projections to the CeA versus BLA for each birthdated timepoint (two-way ANOVA, F(3, 25)=308.5, p<0.0001). Each dot in D, F, and G represents an individual animal.
Figure 5
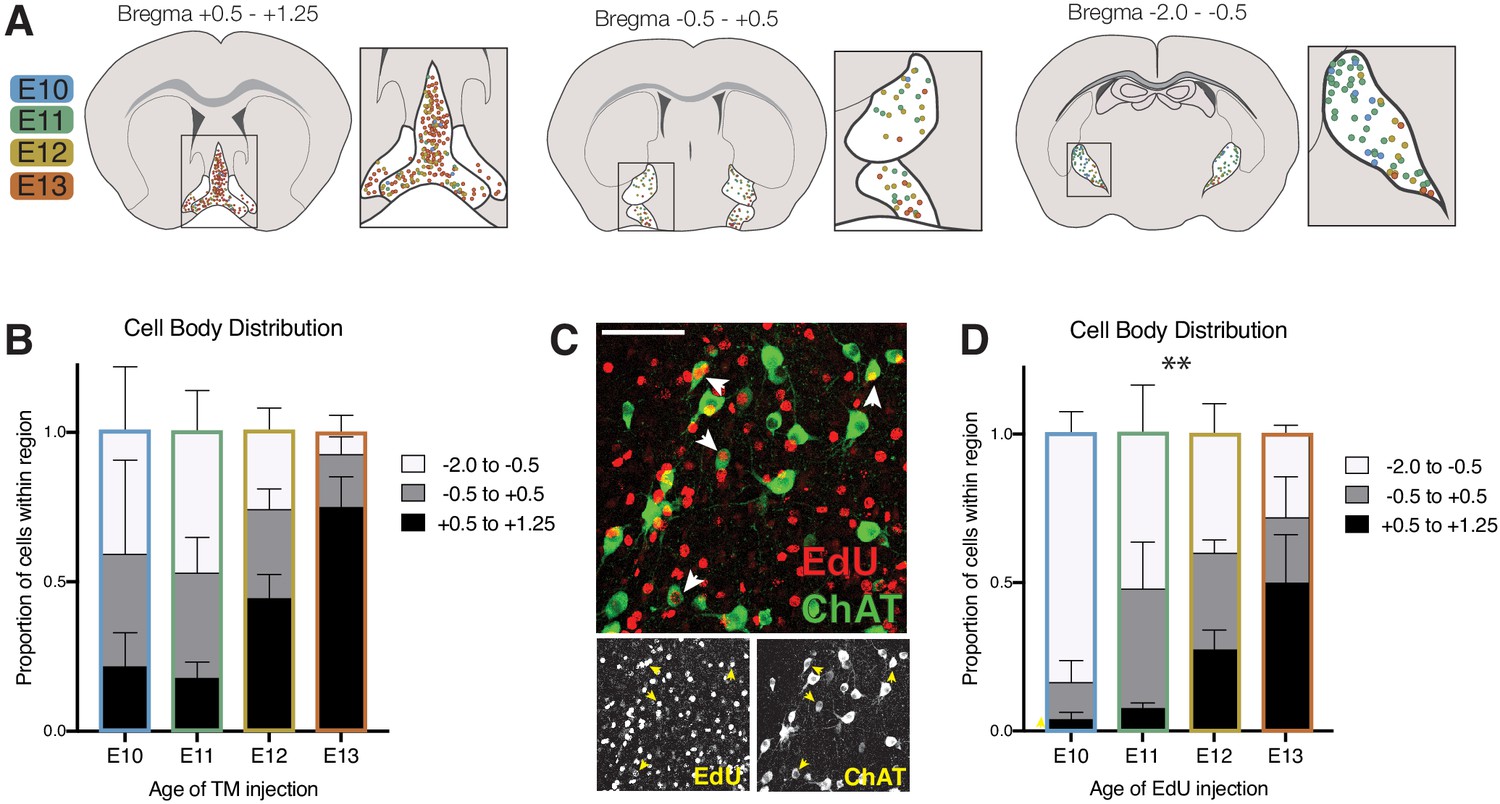
Cell body distribution of birthdated cholinergic neurons.
(A) Cell body locations in the basal forebrain at P30 for cholinergic neurons born at each timepoint labeled by tamoxifen induction of CreER. (B) Quantification of cell body distribution (not significant by two-way ANOVA, F (6, 30)=2.103, p<0.0825) (E10 n = 3; E11 n = 5; E12 n = 8; E13 n = 3). (C) Birthdating using the alternative 5-Ethynyl-2’-deoxyuridine (EdU) method. Example image of P30 brain in which EdU was injected at E11, with an anti-ChAT antibody stain to quantify cholinergic neurons. (D) Quantification of cell body distribution at P30 for cholinergic neurons birthdated with EdU (two-way ANOVA, F (6, 24)=3.705, p=0.0092) (n = 4 for each timepoint).
Figure 6
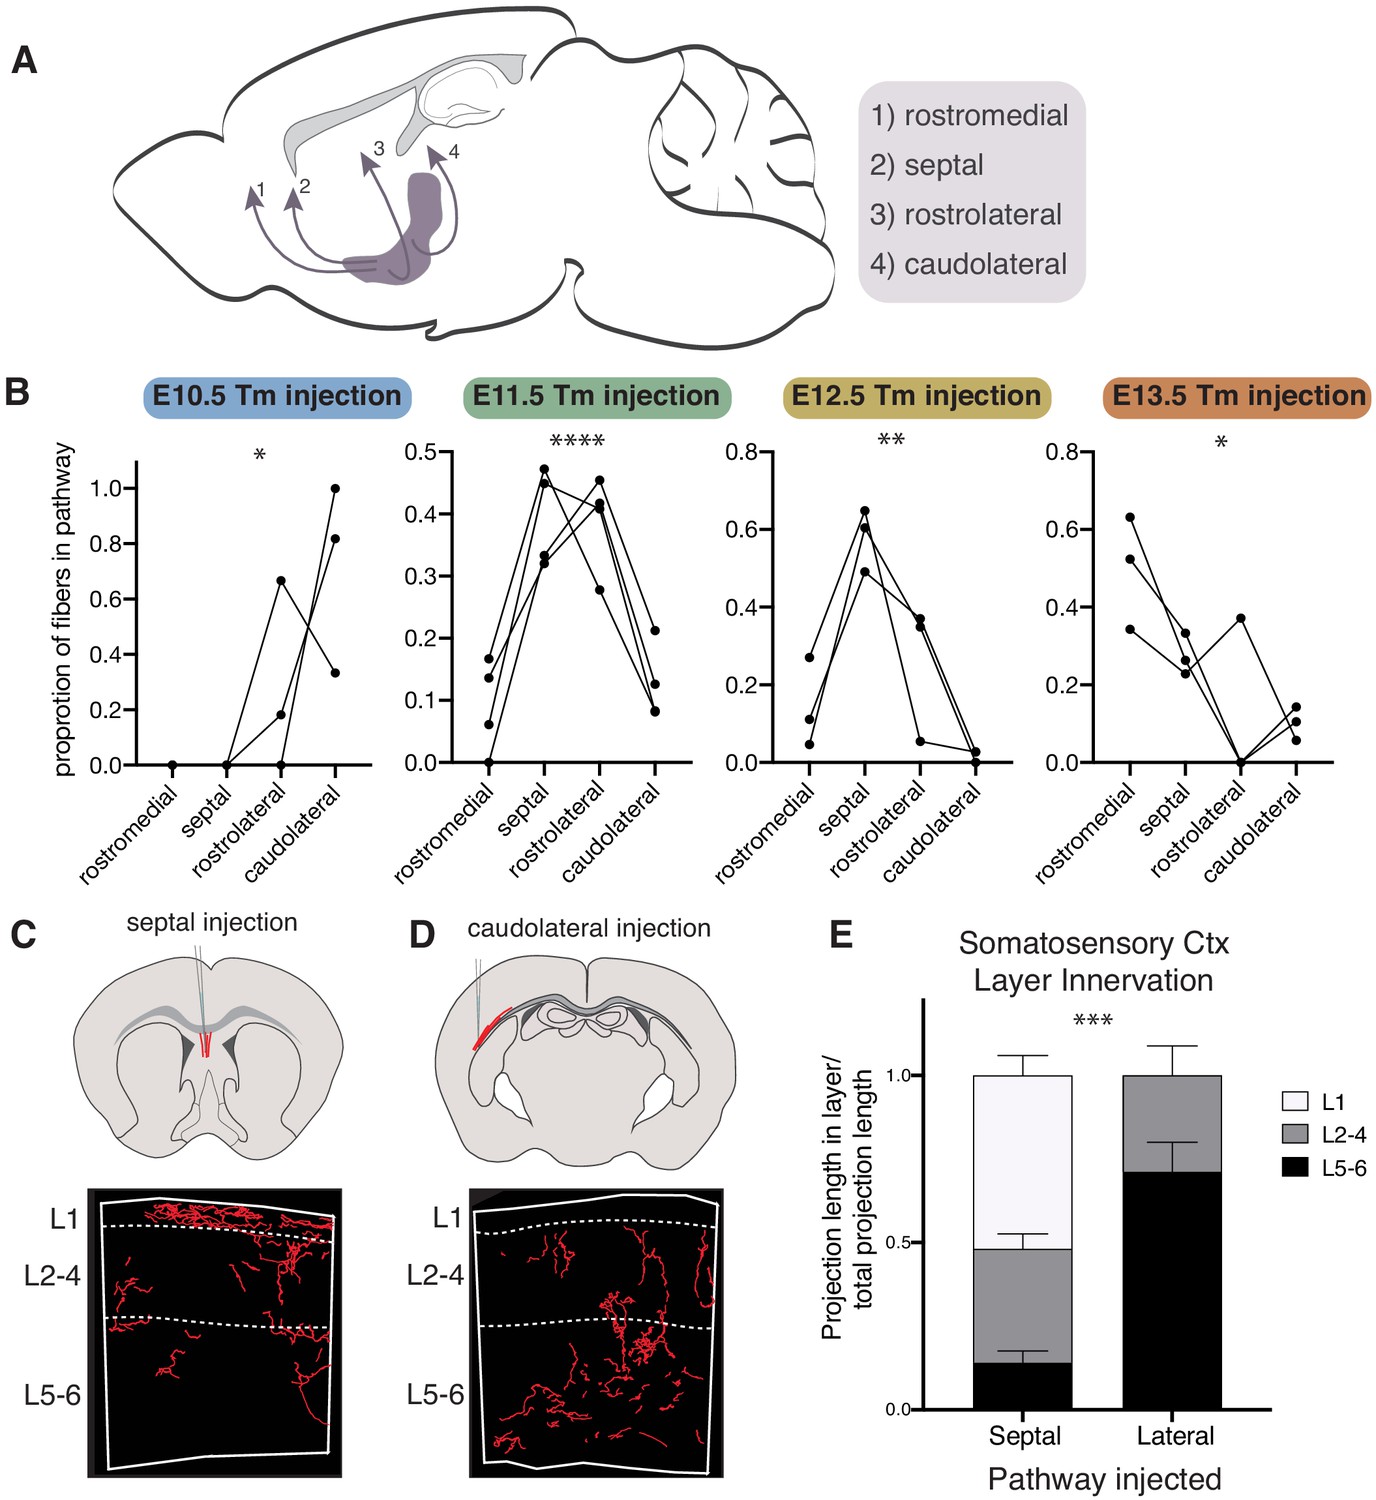
Cholinergic axons traverse distinct routes to their projection targets based on birthdate.
(A) Routes cholinergic axons take to the cortex from the basal forebrain. (B) Proportion of fibers in each pathway for brains with birthdated cholinergic neurons at P30. Connected lines represent a single animal. One-way ANOVAs: E10 - F(3,8) = 5.799, p=0.0209; E11 - F(3,12) = 20.14, p<0.0001; E12 - F(3,8) = 13.63, p=0.0016; E13 - F(3,8) = 5.599, p=0.0230. (C) Septal injection schematic (top) and example of fiber reconstruction in the somatosensory cortex (bottom). (D) Caudolateral injection schematic (top) and example of fiber reconstruction in the somatosensory cortex (bottom). (E) Quantification of innervation to specific layers in septal or caudolateral pathway injected brains (n = 3 for each) (two-way ANOVA, F(2, 8)=28.87, p=0.0003).
Tables
Key resources table
| Reagent type (species) or resource | Designation | Source or reference | Identifiers | Additional information |
|---|---|---|---|---|
| Strain, strain background (canine adenovirus) | Cav-2::Cre | Plateforme de Vectorologie de Montpellier | CAV Cre | |
| Genetic reagent (Mus musculus) | ChatFlpo | This paper | N/A | Submitted to Jax, further information about generation of this line in Materials and methods below. |
| Genetic reagent (Mus musculus) | CMVCre | Jax | RRID:IMSR_JAX:006054 | |
| Genetic reagent (Mus musculus) | Ascl1CreER | Jax | RRID:IMSR_JAX:012882 | |
| Genetic reagent (Mus musculus) | Lhx6iCre | Jax | RRID:IMSR_JAX026555 | |
| Genetic reagent (Mus musculus) | ShheGFP-Cre | Jax | RRID:IMSR_JAX005622 | |
| Genetic reagent (Mus musculus) | Rosa26Ai65 | Jax | RRID:IMSR_JAX021875 | |
| Antibody | Anti-DsRed (rabbit polyclonal) | Clontech | RRID:AB_10013483 | (1:1000) |
| Antibody | Anti-ChAT (goat polyclonal) | Millipore | RRID:AB_2079751 | (1:250) |
| Antibody | Anti-rabbit IgG Alexa Fluor 594 (donkey polyclonal) | Thermo Fisher | RRID:AB_141637 | (1:1000) |
| Antibody | Anti-goat IgG Alexa Fluor 594 (donkey polyclonal) | Thermo Fisher | RRID:AB_2534105 | (1:1000) |
| Commercial assay or kit | Click-iT EdU kit for imaging Alexa Fluor 488 | Thermo Fisher | C10337 | |
| Chemical compound, drug | 5-Ethynyl-2´- deoxyuridine (EdU) | Invitrogen | A10044 | (50 μg per 1 g body weight) |
| Software, algorithm | Neurolucida 360 | MBF Biosciences | Neurolucida 360 2019 and 2020 | |
| Other | DAPI stain | Invitrogen | D1306 | (1 µg/mL) |
Additional files
-
Supplementary file 1
ANOVA summary tables and post-hoc test information.
- https://cdn.elifesciences.org/articles/63249/elife-63249-supp1-v1.xlsx
-
Transparent reporting form
- https://cdn.elifesciences.org/articles/63249/elife-63249-transrepform-v1.pdf
Download links
A two-part list of links to download the article, or parts of the article, in various formats.
Downloads (link to download the article as PDF)
Open citations (links to open the citations from this article in various online reference manager services)
Cite this article (links to download the citations from this article in formats compatible with various reference manager tools)
Cellular birthdate predicts laminar and regional cholinergic projection topography in the forebrain
eLife 9:e63249.
https://doi.org/10.7554/eLife.63249


