BAP1/ASXL complex modulation regulates epithelial-mesenchymal transition during trophoblast differentiation and invasion
- Epigenetics Programme, The Babraham Institute, Babraham Research Campus, United Kingdom
- Centre for Trophoblast Research, Department of Physiology, Development and Neurosicence, University of Cambridge, United Kingdom
- Centro de Investigación Príncipe Felipe, Eduardo Primo Yúfera, Spain
- Department of Pathology, University of Cambridge, United Kingdom
- Biology Department, Universidad Autonoma de Madrid, Spain
- Department of Biochemistry and Molecular Biology, Cumming School of Medicine, University of Calgary, Canada
- Alberta Children’s Hospital Research Institute, University of Calgary, Canada
Figures
Figure 1 with 1 supplement
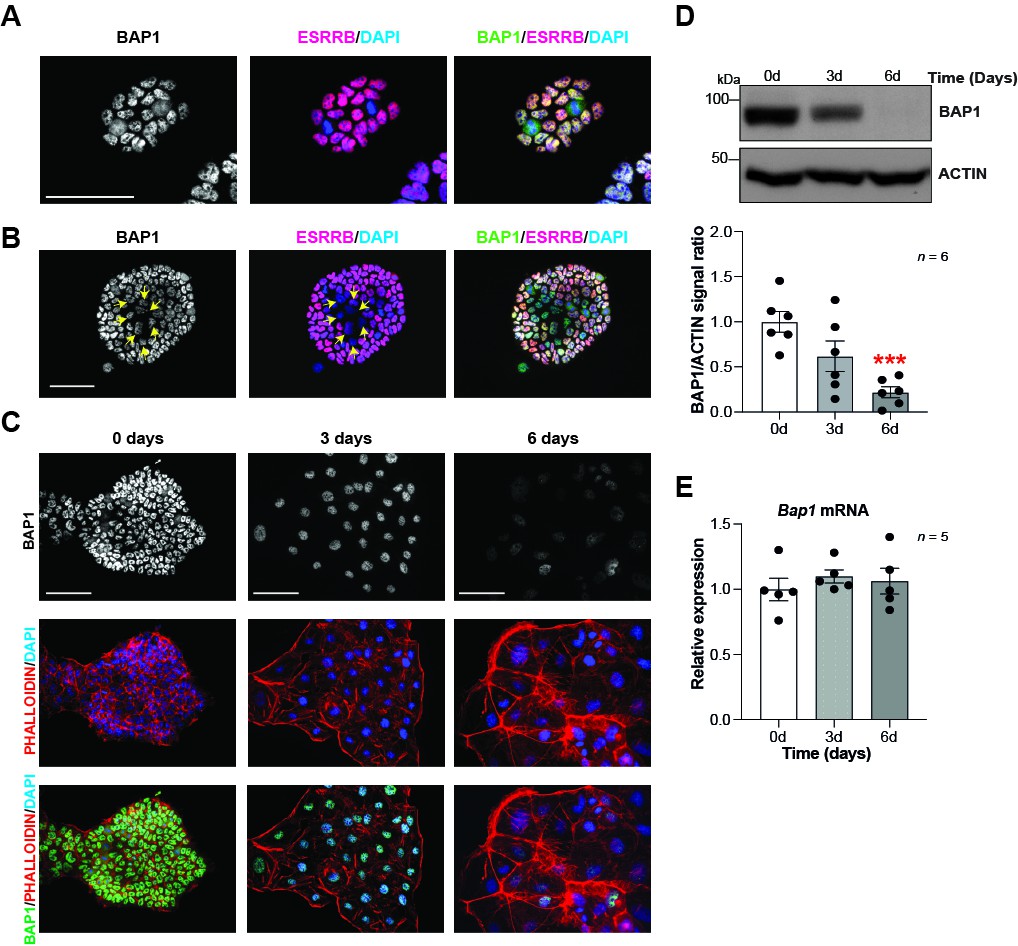
BAP1 protein levels are modulated during trophoblast differentiation.
(A, B) Immunofluorescence staining of mouse trophoblast stem cells (mTSCs) in the stem cell state for BAP1 and the stem cell marker ESRRB. The strong nuclear BAP1 staining observed in mTSCs is slightly reduced in partially differentiated, ESRRB-low cells (arrows). Representative images of four replicates. Scale bar: 100 µm. (C) Immunofluorescence staining for BAP1 and F-actin with phalloidin of mTSCs, and of mTSCs differentiated for 3 and 6 days. BAP1 is downregulated as cells reorganize their cytoskeleton during trophoblast differentiation. Representative images of three replicates. Scale bar: 100 µm. (D) Western blot for BAP1 on mTSCs in the stem cell state and upon 3 days (3d) and 6 days (6d) of differentiation, confirming the downregulation of BAP1. Quantification of band intensities of six independent experiments is shown in the graph below. Data are normalized against ACTIN and represented relative to stem cell conditions (0d); mean ± SEM; ***p<0.001 (one-way ANOVA with Dunnett’s multiple comparisons test). (E) RT-qPCR analysis of Bap1 expression during a 6-day time course of mTSC differentiation shows that Bap1 mRNA levels remain stable throughout the differentiation process. Expression is normalized to Sdha and displayed relative to stem cell conditions (0d). Data are mean of five replicates ± SEM (one-way ANOVA with Dunnett’s multiple comparisons test).
Figure 1—figure supplement 1
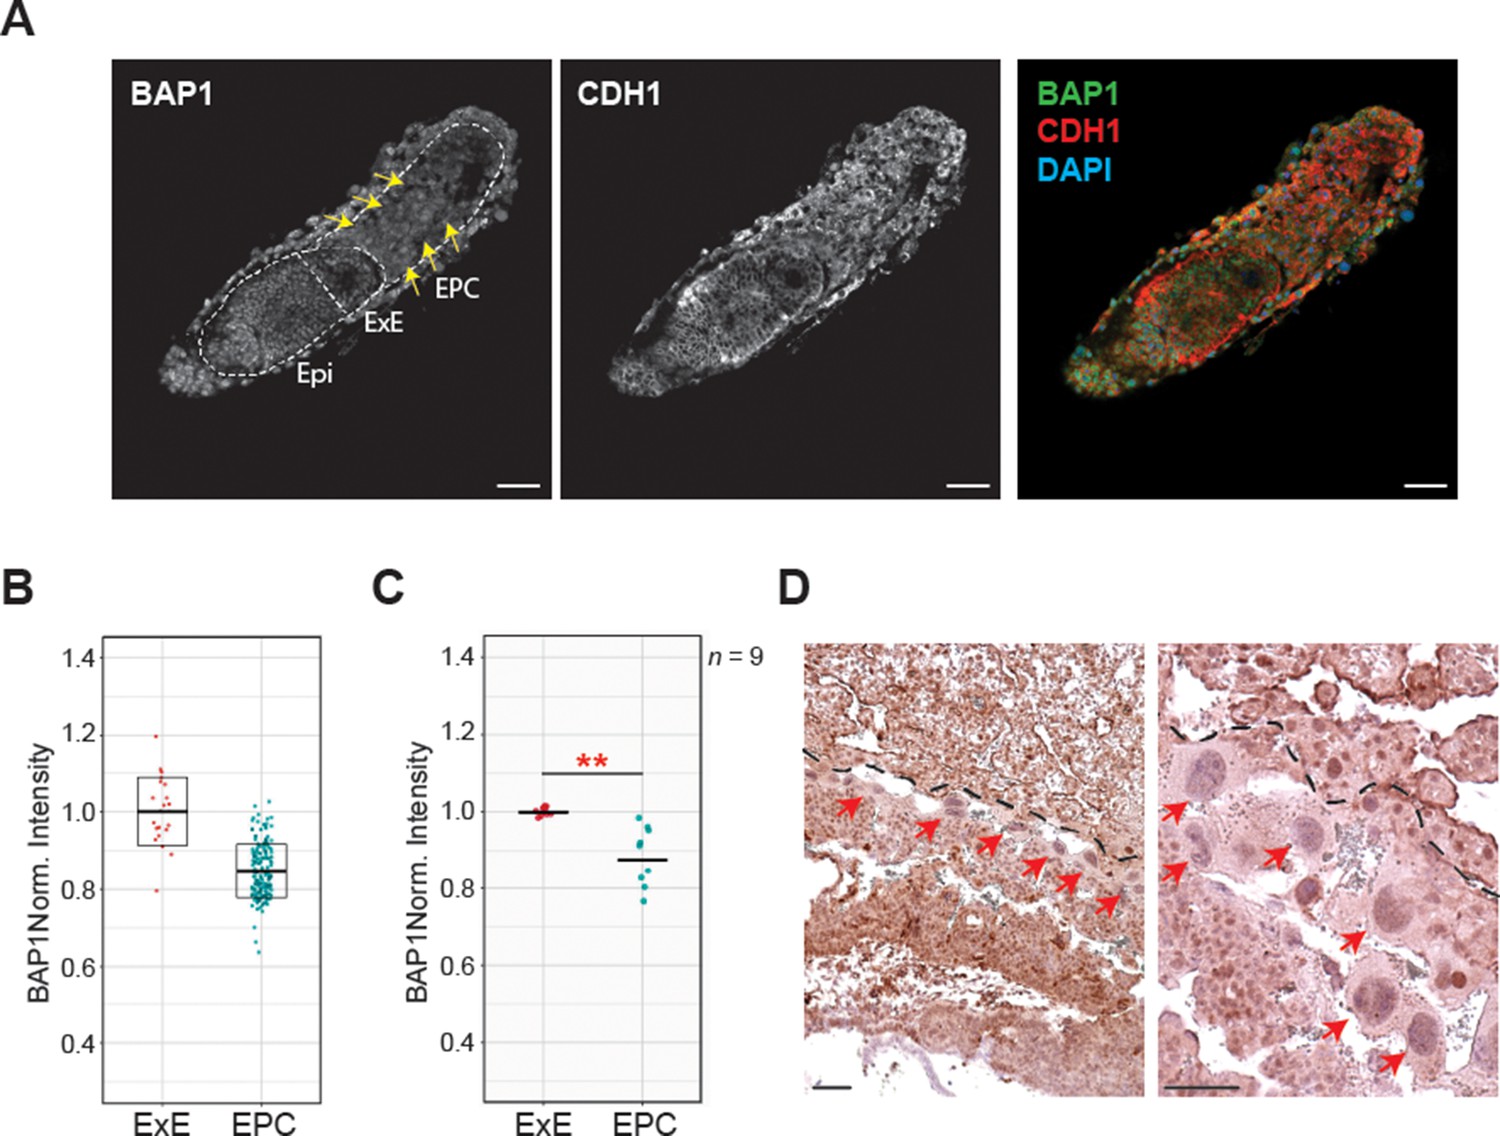
Bap1 expression in early mouse placentation.
(A) Whole-mount immunostaining of E6.5 conceptuses for BAP1 and CDH1. Bap1 is highly expressed in the epiblast (Epi) and extraembryonic ectoderm (ExE). The ectoplacental cone (EPC) shows a reduced and diffuse staining (highlighted by arrows) as differentiation progresses. Representative images of n = 9 embryos. Scale bar: 100 µm. (B) Scatter plot showing BAP1 fluorescence intensity per cell in the EPC compared to ExE of the embryo shown in A. (C) Quantification graph representing the average BAP1 fluorescence intensity in the ExE and EPC of each embryo. Data are mean of nine biological replicates ± SD; **p<0.001 (Student’s t-test). (D) Immunohistochemistry analysis of E9.5 placenta for BAP1. Red arrows highlight trophoblast giant cells. The dotted lines separate the decidual tissue (upper part) from the fetal portion of the placenta. Image is representative of three biological replicates. Scale bar: 100 µm.
Figure 2 with 1 supplement
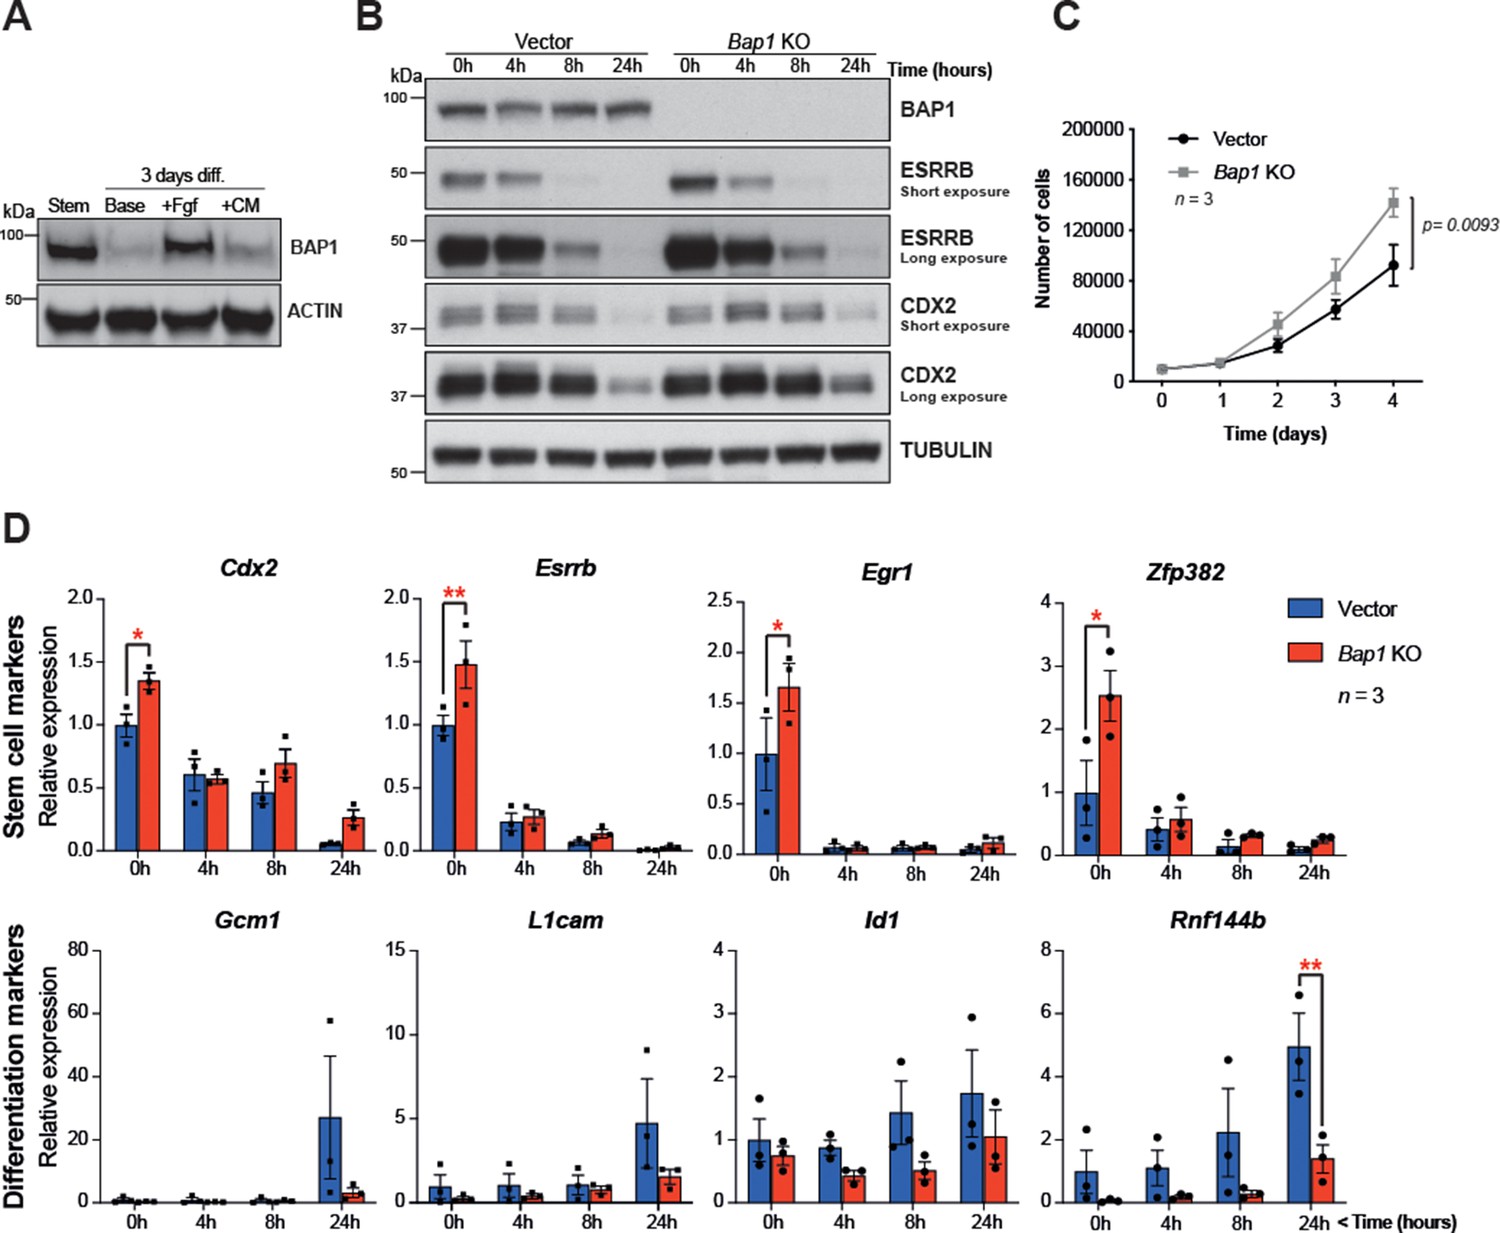
Bap1 ablation does not negatively affect stemness.
(A) Western blot analysis of mouse trophoblast stem cells (mTSCs) grown in stem cell conditions (Stem) and upon 3 day differentiation in standard base medium (Base), or in base medium supplemented with FGF or conditioned medium (CM). (B) Western blot analysis assessing the dynamic changes in the stem cell markers CDX2 and ESRRB across a short-term differentiation time course in vector control compared to Bap1-mutant mTSCs (stem cell conditions = 0 h, and differentiation at 4, 8, and 24 hours (h)). Blots are representative of two independent replicates. (C) Proliferation assay of control and Bap1-/- mTSCs over 4 consecutive days. Bap1-/- mTSCs exhibit a significant increase in the proliferation rate compared to vector control cells (mean ± SEM; n = 3). p=0.0093; two-way ANOVA with Holm-Sidak’s multiple comparisons test. (D) RT-qPCR analysis of control and Bap1-/- mTSCs for stem cell and early differentiation marker genes. Stem cell markers are increased and the upregulation of differentiation markers delayed in Bap1-mutant mTSCs. Data are normalized to Sdha and displayed as mean of three biological replicates (i.e. independent clones) ± SEM; *p<0.05, **p<0.01 (two-way ANOVA with Sidak’s multiple comparisons test).
Figure 2—figure supplement 1
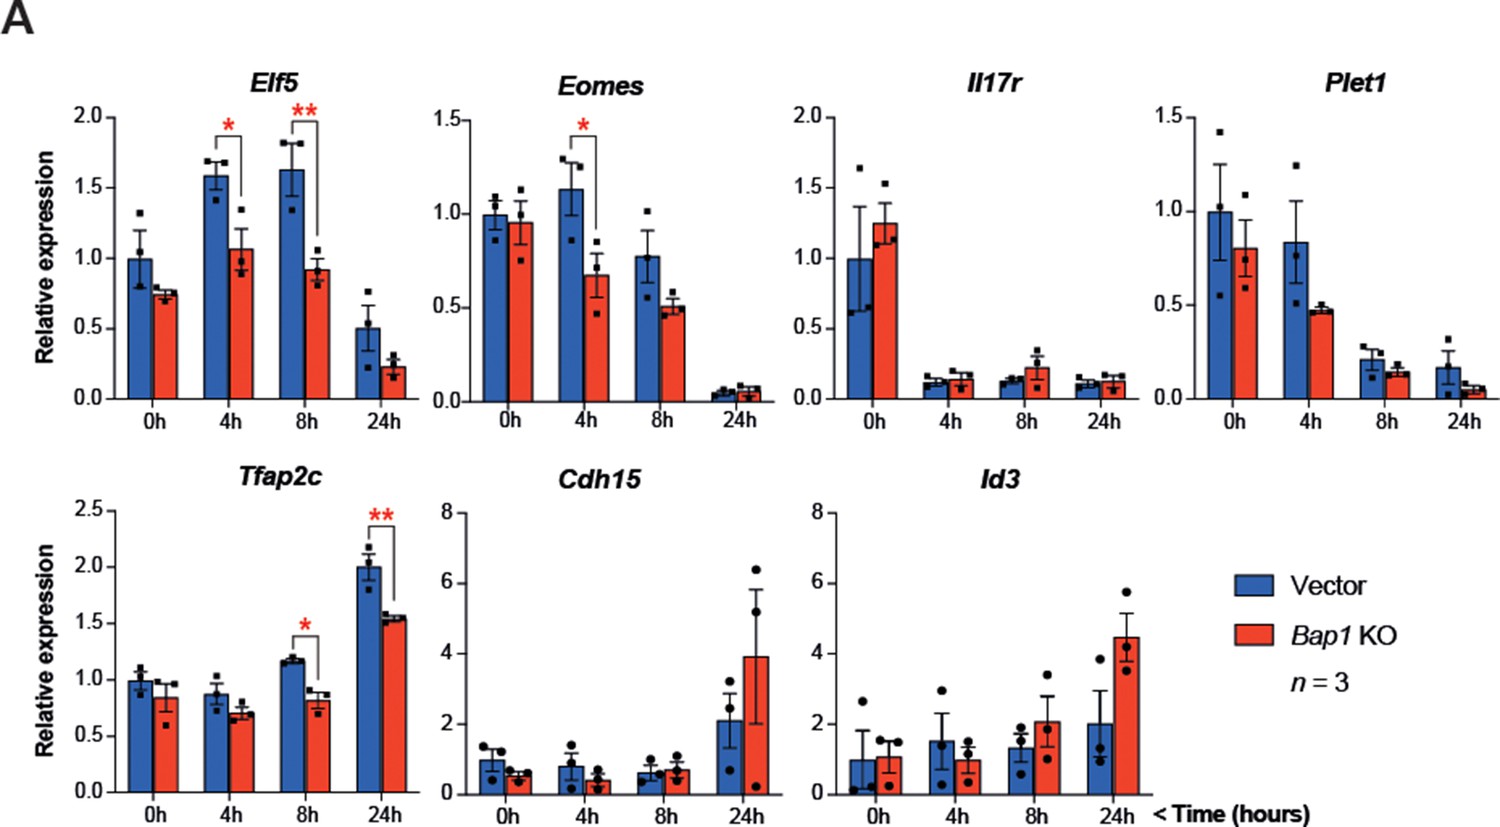
Bap1 ablation does not negatively affect stemness.
(A) RT-qPCR analysis to assess the effect of Bap1 ablation on the stem cell state and early differentiation of mouse trophoblast stem cells (mTSCs). Data are normalized to Sdha and are displayed as mean of three biological replicates (i.e. independent clones) ± SEM; *p<0.05, **p<0.01 (two-way ANOVA with Sidak’s multiple comparisons test).
Figure 3 with 1 supplement
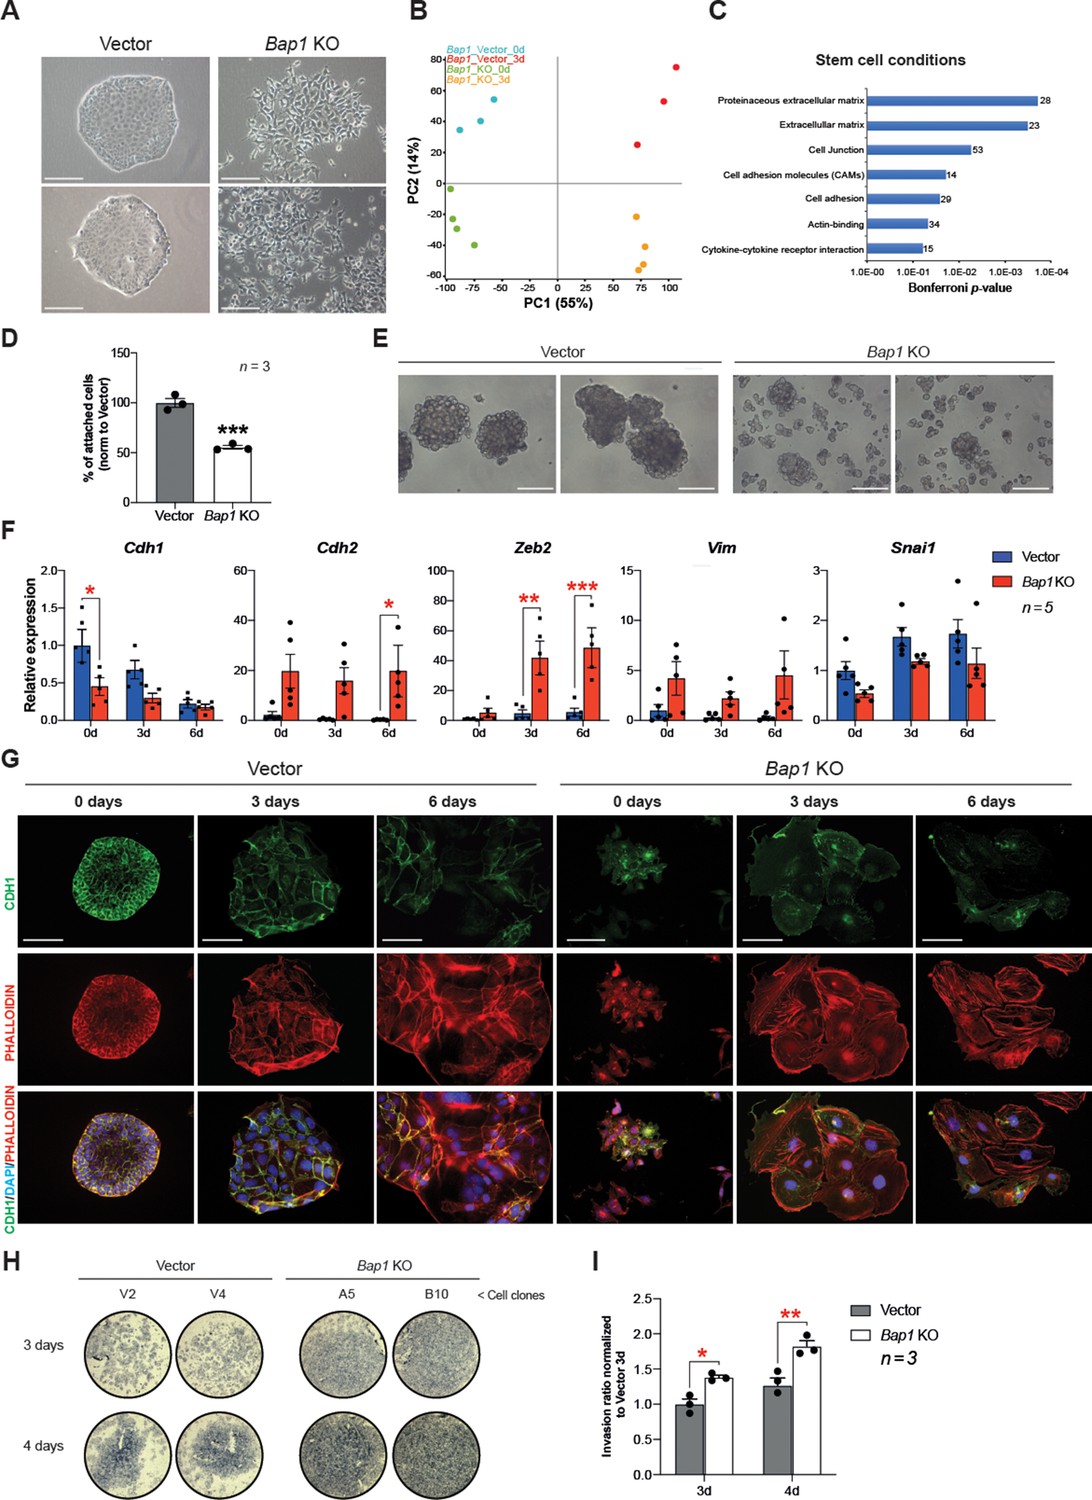
Bap1 deficiency promotes epithelial-mesenchymal transition (EMT).
(A) Colony morphology of wild-type (vector) and Bap1-mutant mouse trophoblast stem cells (mTSCs). Bap1-/- mTSCs show a fibroblast-like morphology with loss of cell-cell attachment compared to vector control mTSCs. Images are representative of five independent TSC clones each. Scale bar: 100 µm. (B) Principal component analysis of global transcriptomes of independent vector control (n = 3) and Bap1 knockout (KO) (n = 4) clones grown in stem cell conditions (0d) and after 3 days of differentiation (3d). (C) Gene ontology analyses of genes differentially expressed between vector and Bap1-mutant mTSCs in stem cell conditions. (D) Cell adhesion assay showing that Bap1-mutant mTSCs are less well attached to cell culture plastic compared to vector control cells. Data are mean of three independent replicates with three biological replicates ( = independent clones) per experiment. ***p<0.001 (Student’s t-test). (E) Morphology of 3D-trophospheres after 8 days of differentiation in low attachment conditions. Representative images of 2 independent vector control and Bap1 KO cell clones. Scale bar: 200 µm. (F) RT-qPCR analysis of EMT marker expression during a 6-day differentiation time course. Data are normalized to Sdha and displayed relative to vector in stem cell conditions (0d). Data are mean of five biological replicates (i.e. independent clones) ± SEM; *p<0.05, **p<0.01, ***p<0.001 (two-way ANOVA with Sidak’s multiple comparisons test). (G) Immunofluorescence analysis for CDH1 and F-actin (phalloidin) of vector control and Bap1-mutant mTSCs over 6 days of differentiation. Lack of BAP1 reduces cell-cell junctions (CDH1 staining) with a profound reorganization of the cytoskeleton (increased actin stress fibres). Data are representative of five independent vector control and Bap1 KO clones each. Scale bar: 100 µm. (H) Transwell invasion assay of vector control (V2, V4) and Bap1-mutant (clones A5, B10) mTSCs after 3 and 4 days of differentiation. Photographs of invasion filters show haematoxylin-stained cells that reached the bottom side of the filter after removal of the reconstituted basement membrane matrix (Matrigel). (I) Quantification of invaded cells, measured by colour intensity, normalized to 3-day controls. Data are mean of three independent replicates (three biological clones in each replicate) ± SEM; *p<0.05, **p<0.01** (two-way ANOVA with Sidak’s multiple comparisons test).
Figure 3—figure supplement 1
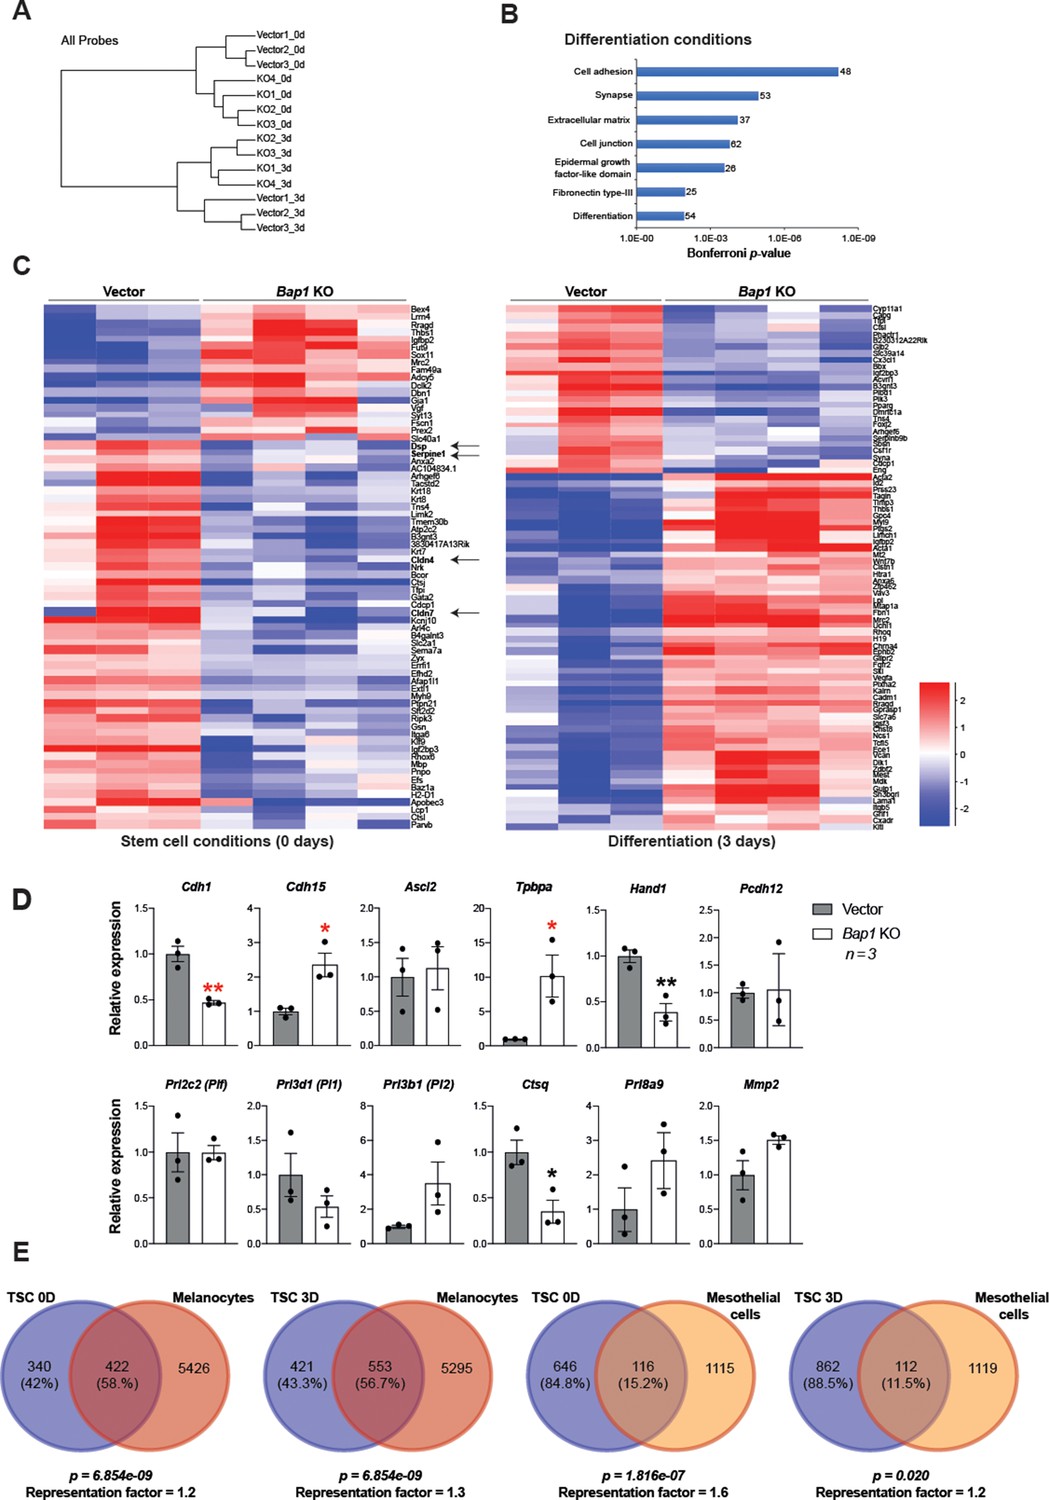
Bap1 deficicency induces precocious epithelial-mesenchymal transition (EMT) with features of malignant transformation.
(A) Hierarchical clustering of global transcriptomes generated by RNA-seq from three independent vector control and four Bap1 knockout (KO) mouse trophoblast stem cell (mTSC) clones grown in stem cell conditions (0d) and after 3 days of differentiation (3d). (B) Gene ontology analysis of genes differentially expressed between 3-day differentiated vector-control and Bap1-mutant mTSCs. (C) Heatmap of mean row-centred log2 FPKM values of differentially expressed genes (DESeq2 and intensity difference). Arrows highlight deregulated genes essential for the stabilization of cell-cell contacts and epithelial integrity. (D) RT-qPCR analysis of 3D-trophospheres generated from vector control and Bap1-mutant mTSCs after 8 days of differentiation. Data are normalized to Sdha and are displayed as mean of three replicates ± SEM; *p<0.05, **p<0.01 (Student’s t-test). (E) Venn diagrams of genes deregulated in common in Bap1-mutant mTSCs (0 and 3 days) and Bap1-null melanocytes and mesothelial cells (He et al., 2019).
Figure 4 with 1 supplement
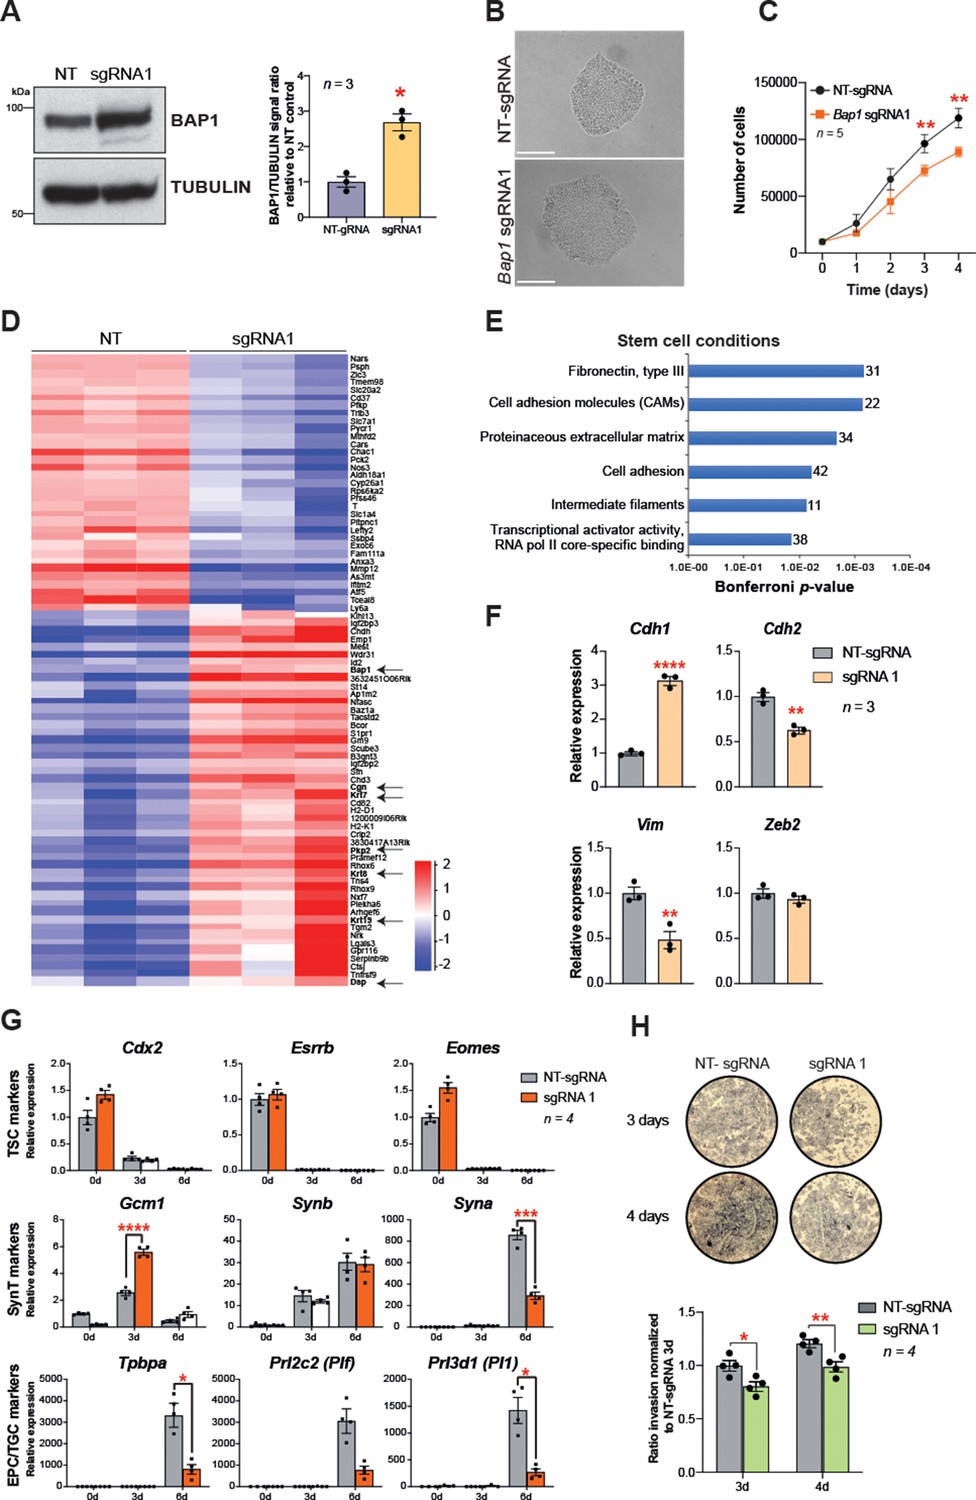
Bap1 overexpression enhances epithelial features and reduces invasiveness.
(A) Western blot analysis to confirm the overexpression of Bap1 in mouse trophoblast stem cells (mTSCs) induced by transduction of the gene-activating single guide RNA one (sgRNA1) compared to non-targeting sgRNA (NT-sgRNA). TUBULIN was used as loading control. Graph shows the quantification of three independent replicates. Data are mean ± SEM; *p<0.05 (Student’s t-test). (B) Colony morphology of NT-sgRNA and sgRNA1-transduced mTSCs. Overexpression of BAP1 in sgRNA1 mTSCs increases epithelioid features of the cell colonies. (C) Proliferation assay of control NT-sgRNA and sgRNA1 Bap1-overexpressing mTSCs over 4 consecutive days. sgRNA1 mTSCs exhibit a significant decrease in the proliferation rate compared to NT-sgRNA control cells (mean ± SEM; n = 5 each). **p<0.01; two-way ANOVA with Holm-Sidak’s multiple comparisons test. (D) Heatmap of mean row-centred log2 RPKM values of differentially expressed genes (DESeq2 and intensity difference) in mTSCs transduced with NT-sgRNA compared to sgRNA1. Arrows point to Bap1 itself and to genes associated with the reinforcement of epithelial integrity. Three independent biological replicates per genotype were sequenced. (E) Gene ontology analysis of genes differentially expressed between sgRNA1 and NT-sgRNA mTSCs grown in stem cell conditions. (F) RT-qPCR analysis of epithelial and mesenchymal markers in NT-sgRNA control cells compared to sgRNA1 Bap1-overexpressing mTSCs. Data are normalized to Sdha and are displayed as mean of three replicates ± SEM; **p<0.01, ****p<0.0001 (Student’s t-test). (G) Analysis of NT-sgRNA and sgRNA1 mTSCs grown in self-renewal conditions (0d) or after differentiation for 3 and 6 days (d) assessed by RT-qPCR. Data are mean ± SEM of n = 4 independent replicates. *p<0.05, **p<0.01, ***p<0.001, ****p<0.0001 (two-way ANOVA with Sidak’s multiple comparisons test). (H) Transwell invasion assays of NT-sgRNA control and Bap1-overexpressing mTSCs. Representative images are shown. Quantification of invaded cells, measured by the colour intensity, normalized to 3-day NT-sgRNA. Data are mean of four independent replicates ± SEM; *p<0.05, **p<0.01 (two-way ANOVA with Sidak’s multiple comparisons test).
Figure 4—figure supplement 1
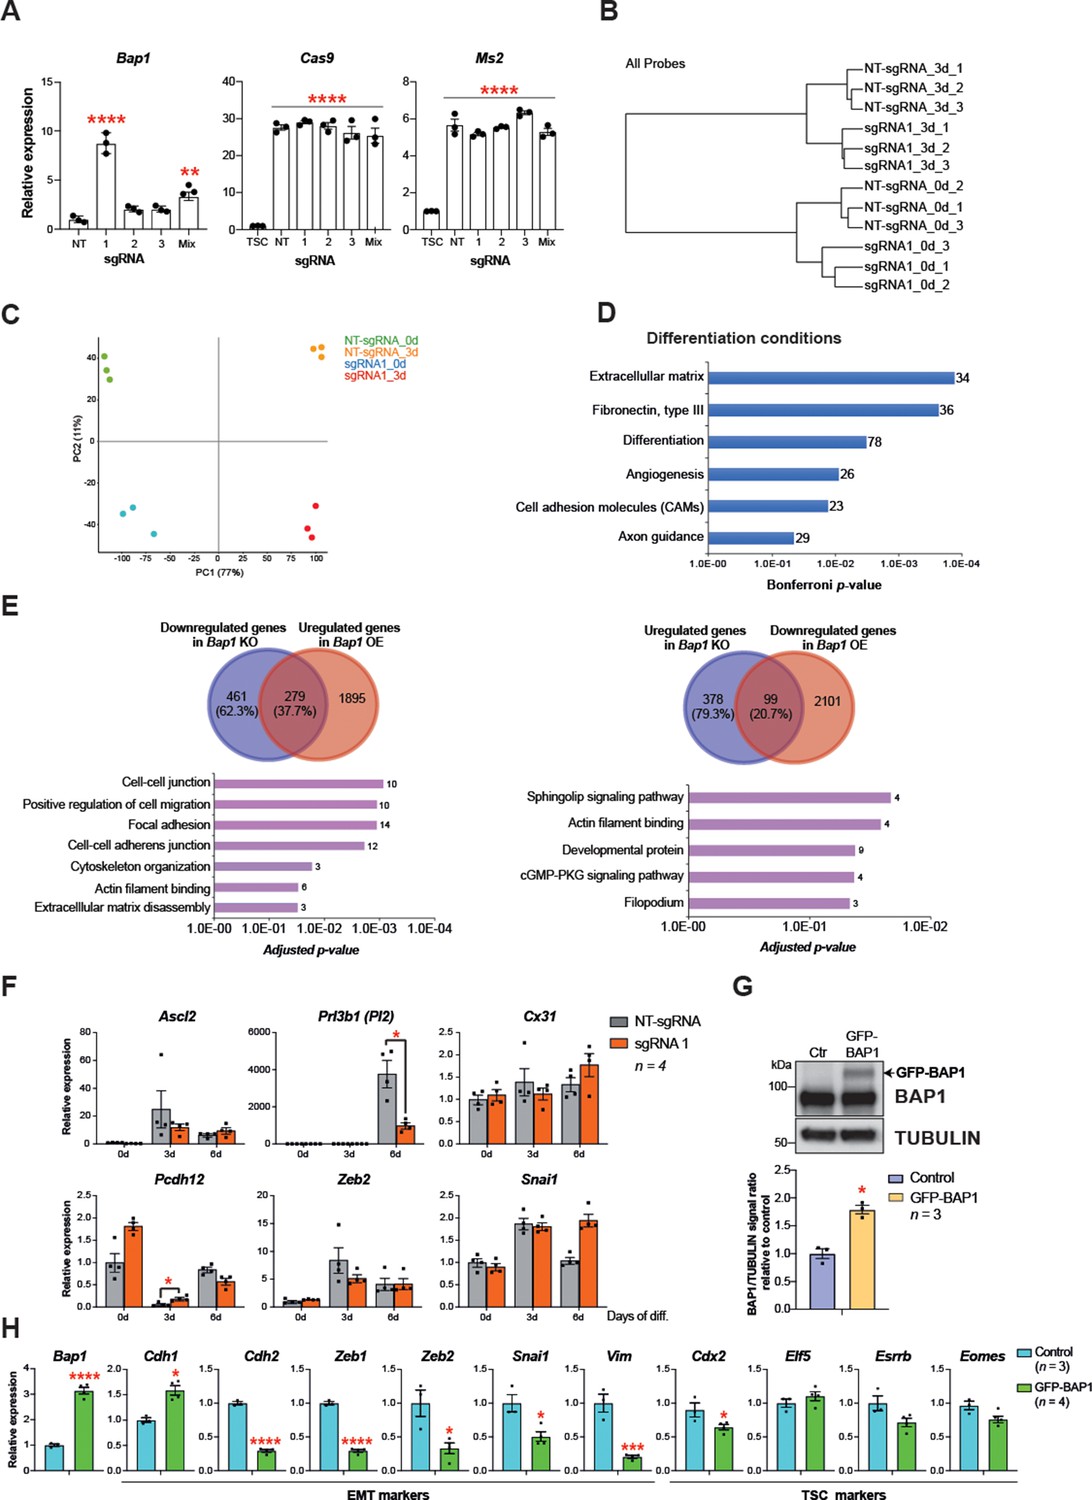
Bap1 overexpression increases epithelial features of mouse trophoblast stem cells (mTSCs).
(A) RT-qPCR analysis to determine the overexpression of Bap1 in mTSCs induced by the transduction of each single guide RNAs (sgRNAs) or in combination (Mix) compared to non-targeting sgRNA (NT-sgRNA). Stable overexpression of the Cas9 and Ms2 SAM components is also shown for each cell line generated compared to non-transduced mTSCs. Data are normalized to Sdha and are displayed as mean of three replicates ± SEM; **p<0.01, ****p<0.0001 (one-way ANOVA with Dunnett’s multiple comparisons test). (B) Hierarchical clustering analysis of global transcriptomes generated by RNA-seq from NT-gRNA and sgRNA1 mTSCs grown in stem cells conditions (0d) and after 3 days of differentiation (3d). Samples cluster according to the amount of BAP1 and day of differentiation. Three independent replicates were sequenced in each condition. (C) Principal component analysis of global transcriptomes. (D) Gene ontology analyses of genes differentially expressed between sgRNA1 and NT-sgRNA mTSCs differentiated for 3 days. (E) Venn diagrams of genes commonly downregulated in Bap1 knockout (KO) and upregulated in Bap1-overexpressing (OE) mTSCs, and conversely of genes commonly upregulated in Bap1 KO and downregulated in Bap1 OE mTSCs, as identified by DESeq2. Gene ontology analyses of genes in common are shown for each comparison. (F) Analysis of NT-sgRNA and sgRNA1 mTSCs grown in self-renewal conditions (0d) or after differentiation for 3 and 6 days (d) assessed by RT-qPCR. Data are mean ± SEM of n = 4 independent replicates. *p<0.05, **p<0.01, ***p<0.001, ****p<0.0001 (two-way ANOVA with Sidak’s multiple comparisons test). (G) mTSCs transduced with GFP-empty control or GFP-BAP1 lentiviral particles were isolated by using fluorescence activated cell sorting (FACS), grown in stem cell conditions and examined by Western blot. TUBULIN was used as loading control. Graph shows the quantification of three independent replicates. Data are mean ± SEM; *p<0.05 (Student’s t-test). (H) RT-qPCR analysis of epithelial-mesenchymal transition (EMT) markers and trophoblast stem cell (TSC) markers in mTSCs as in G. Data are normalized to Sdha and are displayed as mean of three replicates ± SEM; **p<0.01, ****p<0.0001 (Student’s t-test).
Figure 5 with 1 supplement
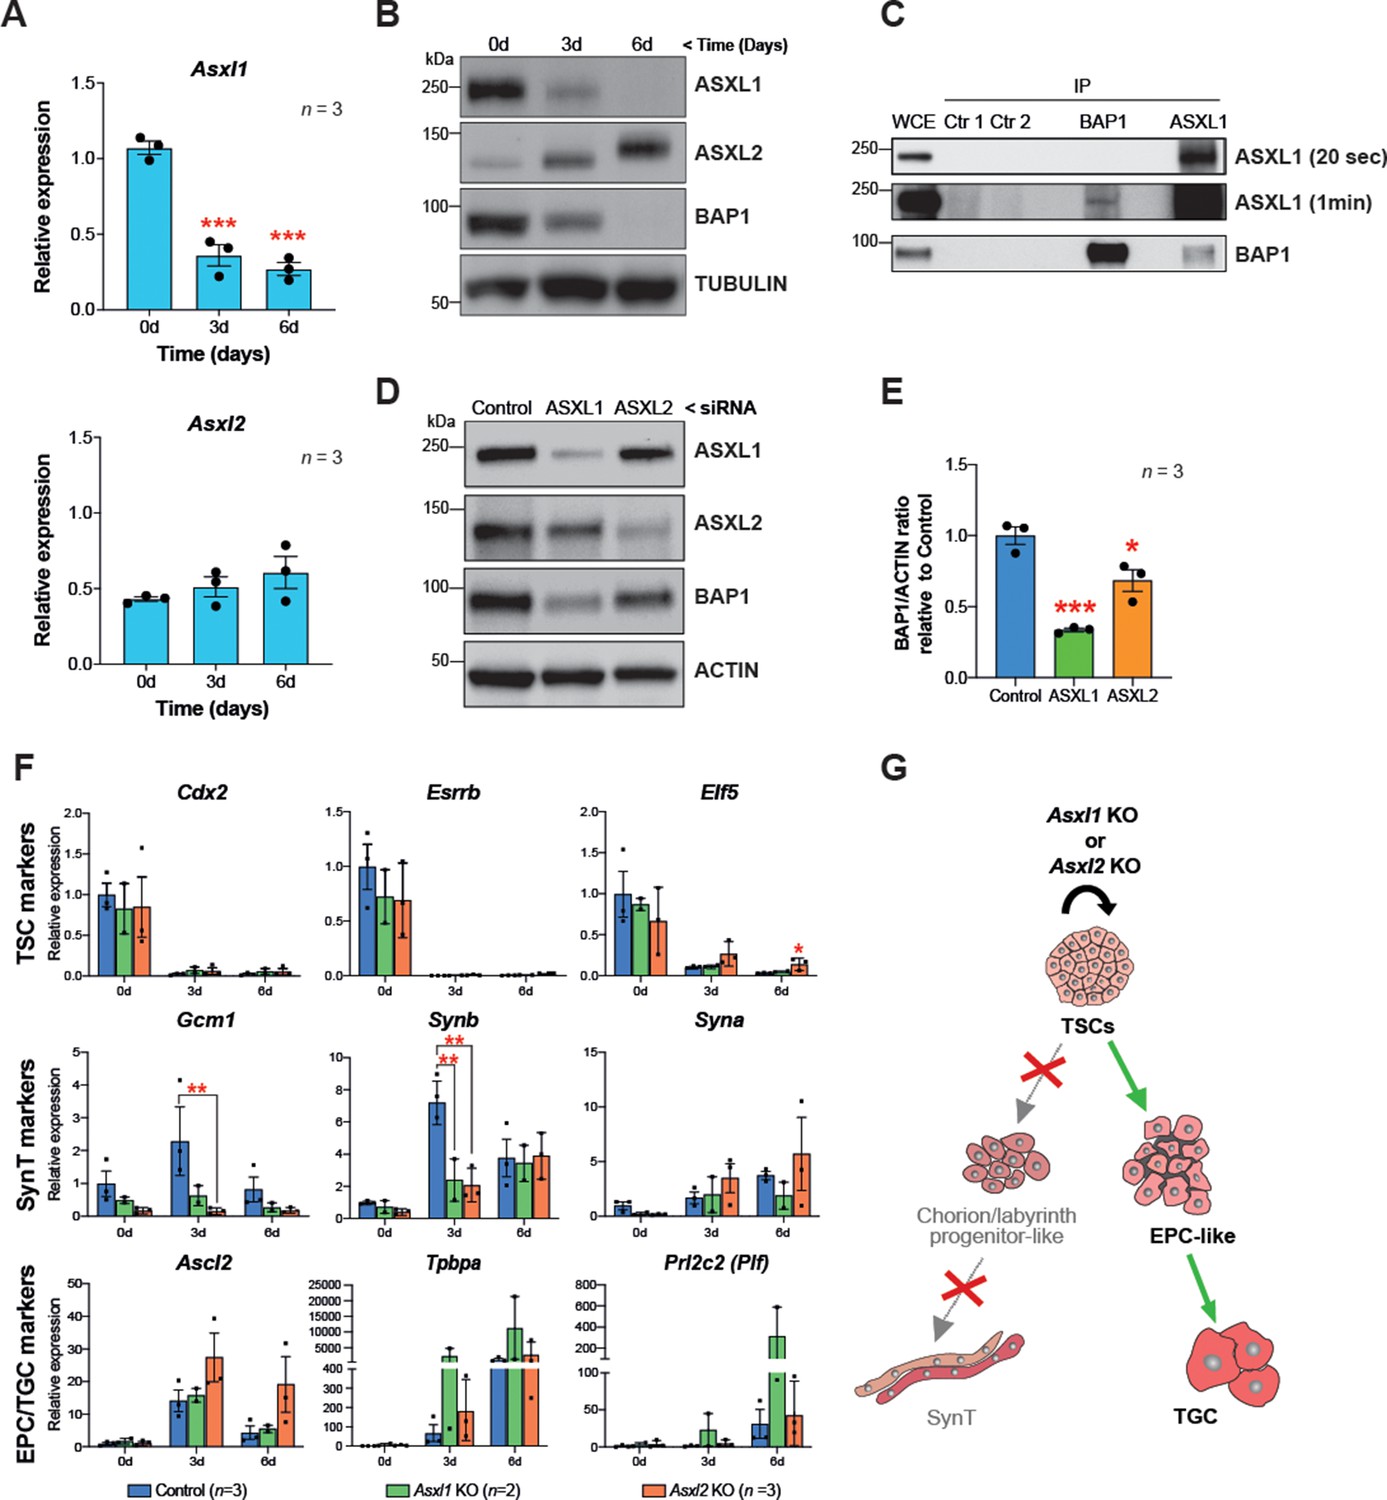
BAP1 and ASXL1/2 complexes are co-regulated during trophoblast differentiation.
(A) RT-qPCR analysis of Asxl1 and Asxl2 expression during a 6-day differentiation time course of mouse trophoblast stem cells (mTSCs). Data are normalized to Sdha and are displayed as mean of three replicates ± SEM; ***p<0.001 (one-way ANOVA with Dunnett’s multiple comparisons test). (B) Western blot analysis of ASXL1 and ASXL2 protein levels in mTSCs differentiating over 6 days (d). Blots shown are representative of three independent replicates. (C) Co-immunoprecipitation of endogenous BAP1 or ASXL1 proteins from mTSC whole cell extracts (WCE) (1 mg). WCE (20 μg) and immunoprecipitates (IP) were analysed by Western blot. Negative controls included protein A plus WCE (Ctr 1) and WCE plus protein A and isotype control Ab (Ctr 2). (D) siRNA-mediated knockdown of ASXL1 or ASXL2 followed by immunoblotting for the factors indicated. (E) Quantification of BAP1 levels (shown in D) normalized to ACTIN, displayed relative to the amounts in transfected control cells. Data are means ± SEM; n = 3. *p<0.05, ***p<0.001 (one-way ANOVA with Dunnett’s multiple comparisons test). (F) Analysis of Asxl1-/- and Asxl2-/- mTSCs grown in self-renewal conditions (0d) or after 3d and 6d of differentiation assessed by RT-qPCR. Data are mean ± SEM of n = 3 (control, scramble), n = 2 (Asxl1 KO), and n = 3 (Asxl2 KO) individual clones as independent replicates. **p<0.01 (two-way ANOVA with Sidak’s multiple comparisons test). (G) Schematic diagram of the differentiation defects observed in Asxl1-/- and Asxl2-/- mTSCs.
Figure 5—figure supplement 1
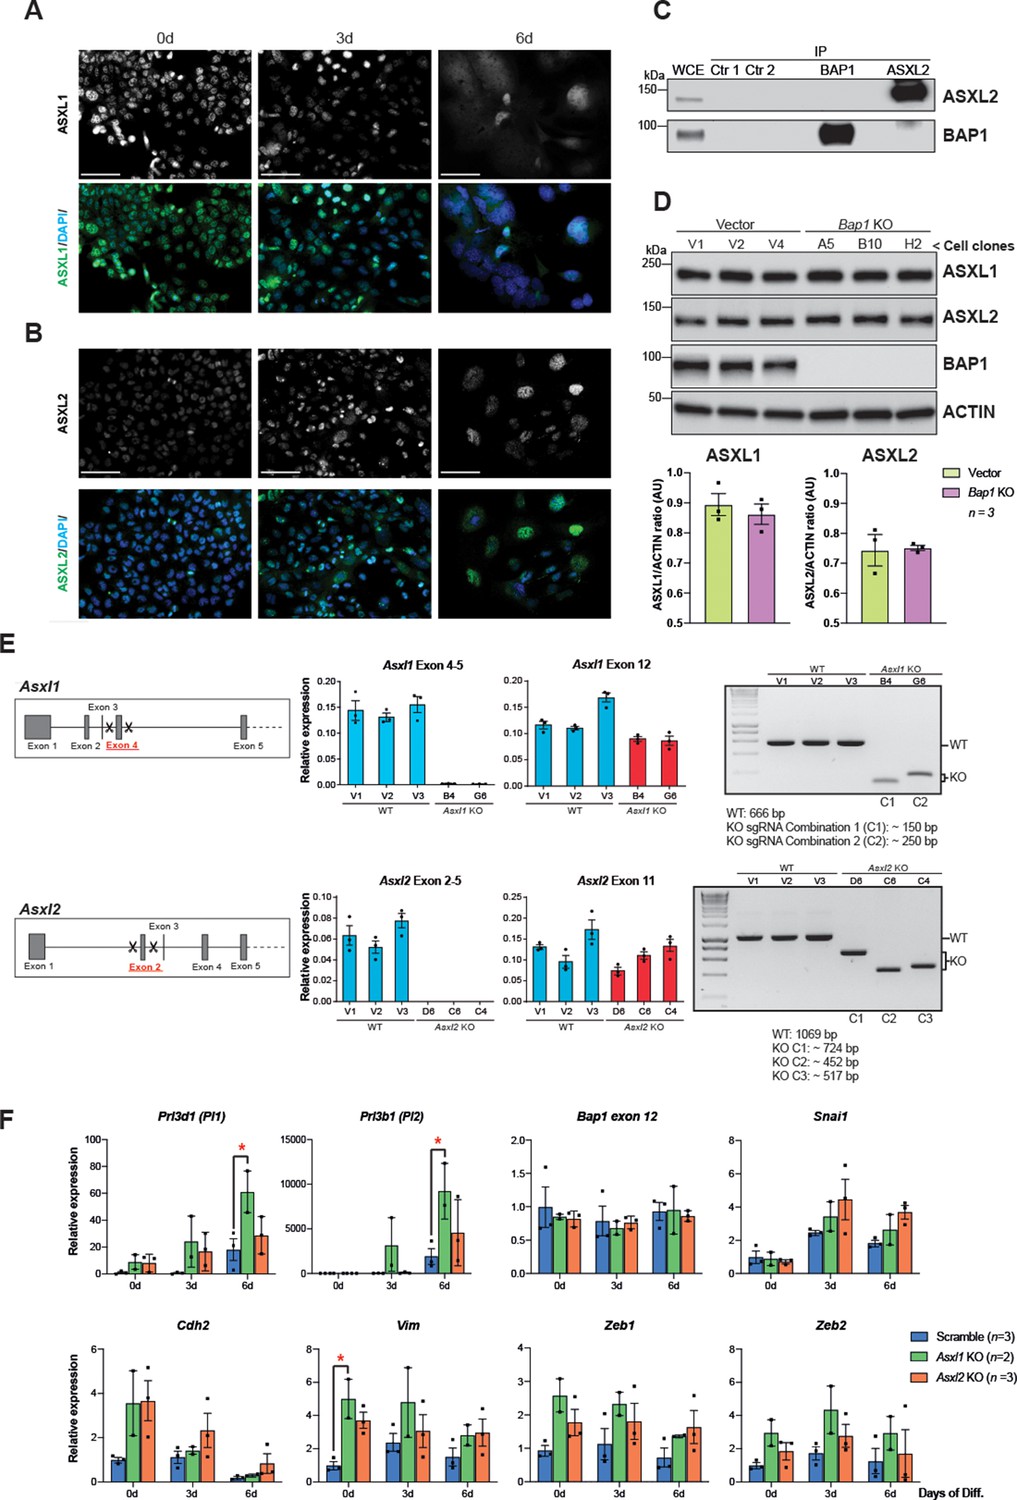
CRISPR-mediated knockout (KO) of Asxl1 and Asxl2 in mouse trophoblast stem cells (mTSCs).
(A) Immunofluorescence analysis for additional sex combs-like-1 (ASXL1) on mTSCs in stem cell conditions (0d) and after 3 and 6 days (d) of differentiation. Data confirm that ASXL1 is downregulated during trophoblast differentiation. Scale bar: 100 µm. (B) ASXL2 immunostaining as in (A) shows that the levels of ASXL2 increase as mTSCs differentiate. Scale bar: 100 µm. Representative images of three replicates. (C) Co-immunoprecipitation of endogenous BAP1 or ASXL2 from mTSC whole cell extracts (WCE) (1 mg). WCE (20 μg) and immunoprecipitates (IP) were analysed by Western blot. Negative controls included protein A plus WCE (Ctr 1) and WCE plus protein A and isotype control Ab (Ctr 2). (D) Western blot analysis of ASXL1 and ASXL2 protein levels in vector control and Bap1-/- mTSCs grown in stem cell conditions. ACTIN was used as loading control. The graphs show the quantification of three independent biological (cell clones) replicates. Data are mean ± SEM; *p<0.05 (Student’s t-test). (E) Details of the CRISPR/Cas9 KO strategy for ablating Asxl1 and Asxl2 genes. RT–qPCR and genomic genotyping PCR analyses were performed on single-cell expanded mTSC clones to confirm homozygous KOs. Data are mean ± SEM of n = 3 technical replicates. (F) Additional RT-qPCR analyses of Asxl1 and Asxl2 KO mTSCs clones as in Figure 5. Data are mean ± SEM of n = 3 (wild-type, scramble), n = 2 (Asxl1 KO) and n = 3 (Asxl2 KO) individual clones as independent replicates; *p<0.05 (two-way ANOVA with Sidak’s multiple comparisons test).
Figure 6 with 1 supplement
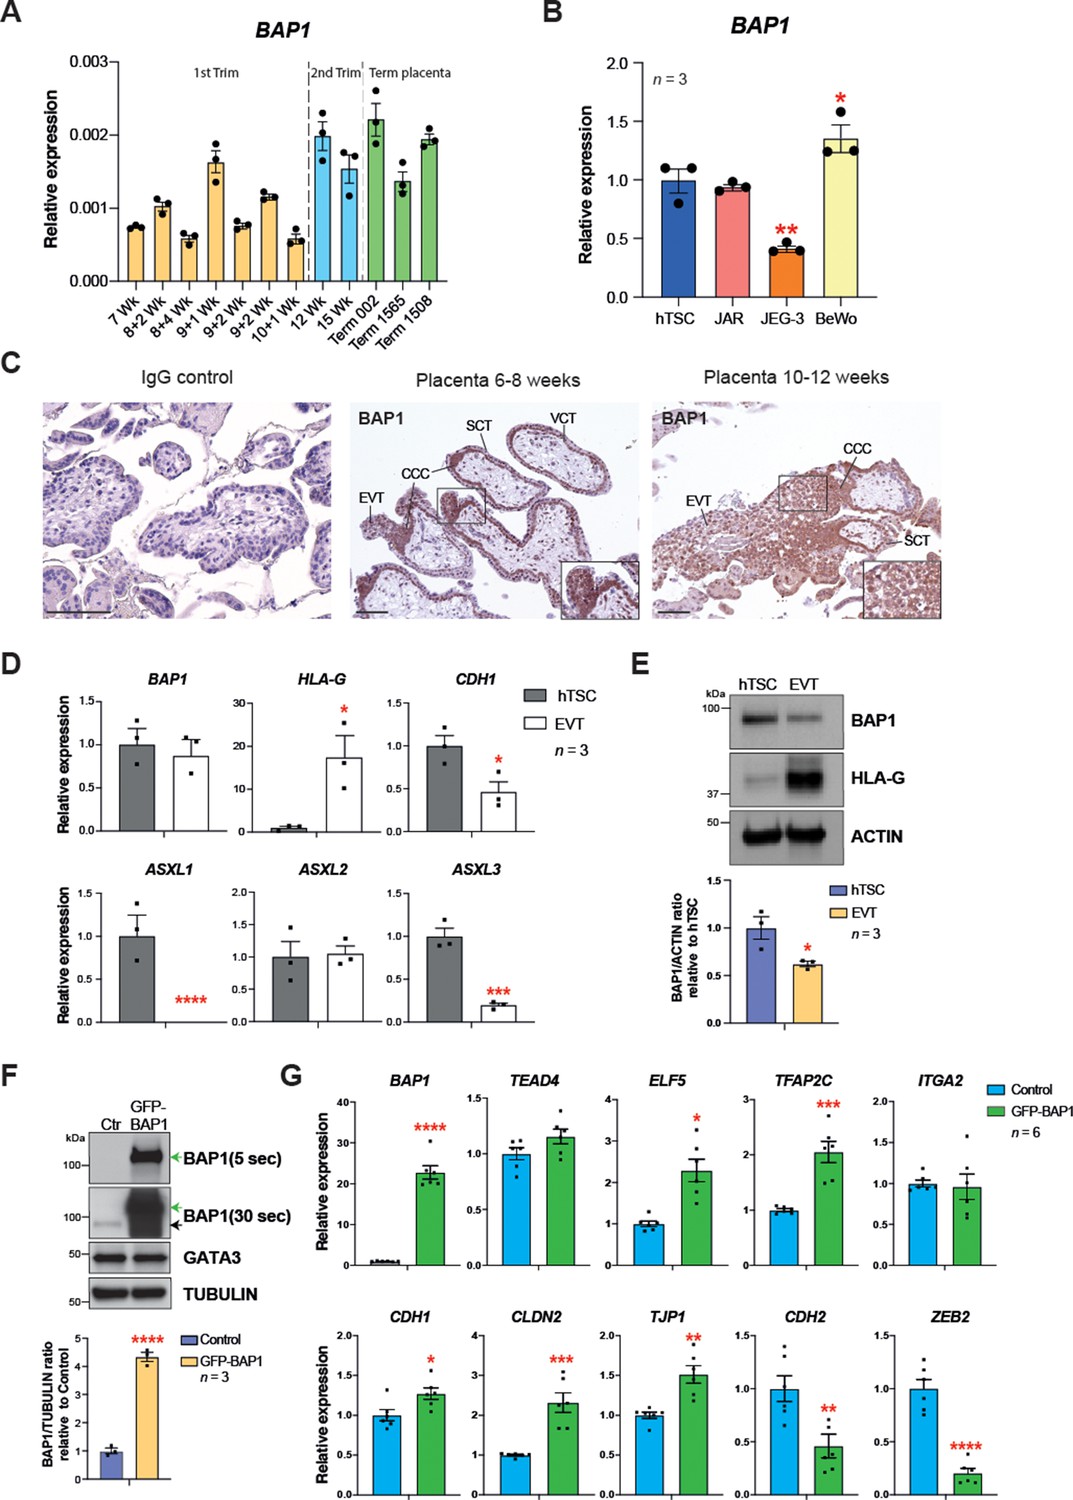
BRCA1-associated protein 1 (BAP1) polycomb repressive deubiquitinase (PR-DUB) modulation is also observed in human placentation.
(A) RT–qPCR analysis of BAP1 expression on human placental villous samples ranging from 7 weeks of gestation to term. Three independent term placental samples were investigated. An overall increase of BAP1 expression was observed over gestation. Expression is normalized to YWHAZ housekeeping gene. Data are mean of three replicates ± SEM. (B) RT-qPCR analysis of BAP1 expression in human trophoblast stem cells (hTSCs) and the choriocarcinoma cell lines JAR, JEG-3, and BeWo. Expression is normalized to GAPDH. Data are mean of three replicates ± SEM; *p<0.05, **p<0.01 (one-way ANOVA with Dunnett’s multiple comparisons test). (C) Immunohistochemistry for BAP1 on early (6–8 weeks [wk] of gestation) and late first trimester placentae (10–12 weeks of gestation). BAP1 staining is strong in proliferative villous cytotrophoblast (VCT) and cytotrophoblast cell columns (CCC) compared to syncytiotrophoblast (SCT). Notably, invasive extravillous trophoblast (EVT) shows a diffuse and weak staining as cells undergo EMT. Representative images of three biological replicates. Scale bar: 100 μm. (D) RT-qPCR analysis of BAP1, HLA-G, CDH1, and ASXL1-3 gene expression on hTSCs and in vitro-differentiated EVT cells after 8 days of differentiation. Expression is normalized to GAPDH. Data are mean of three independent replicates ± SEM; *p<0.05, ***p<0.001, ****p<0.0001 (Student’s t-test). (E) Western blot analysis of BAP1 protein levels in EVT compared to hTSCs. As in the mouse, BAP1 is strongly downregulated during trophoblast differentiation towards the invasive EVT lineage. Graph shows the quantification of three independent replicates. Data are mean ± SEM; *p<0.05 (Student’s t-test). (F) hTSCs transduced with GFP-empty control or GFP-BAP1 lentiviral particles were isolated by using fluorescence activated cell sorting (FACS), grown in stem cell conditions and examined by Western blotting. TUBULIN was used as loading control. Green arrows point to the exogenous GFP-BAP1 band after 5 and 30 seconds (sec) of film exposure. Black arrow points to endogenous BAP1. Graph shows the quantification of three independent replicates. Data are mean ± SEM; ****p<0.0001 (Student’s t-test). (G) RT-qPCR analysis of control and GFP-BAP1-transduced hTSCs grown in stem cell conditions. Expression is normalized to TBP housekeeping gene expression. Data are mean of six independent replicates ± SEM; *p<0.05, **p<0.01, ***p<0.001, ****p<0.0001 (Student’s t-test).
Figure 6—figure supplement 1
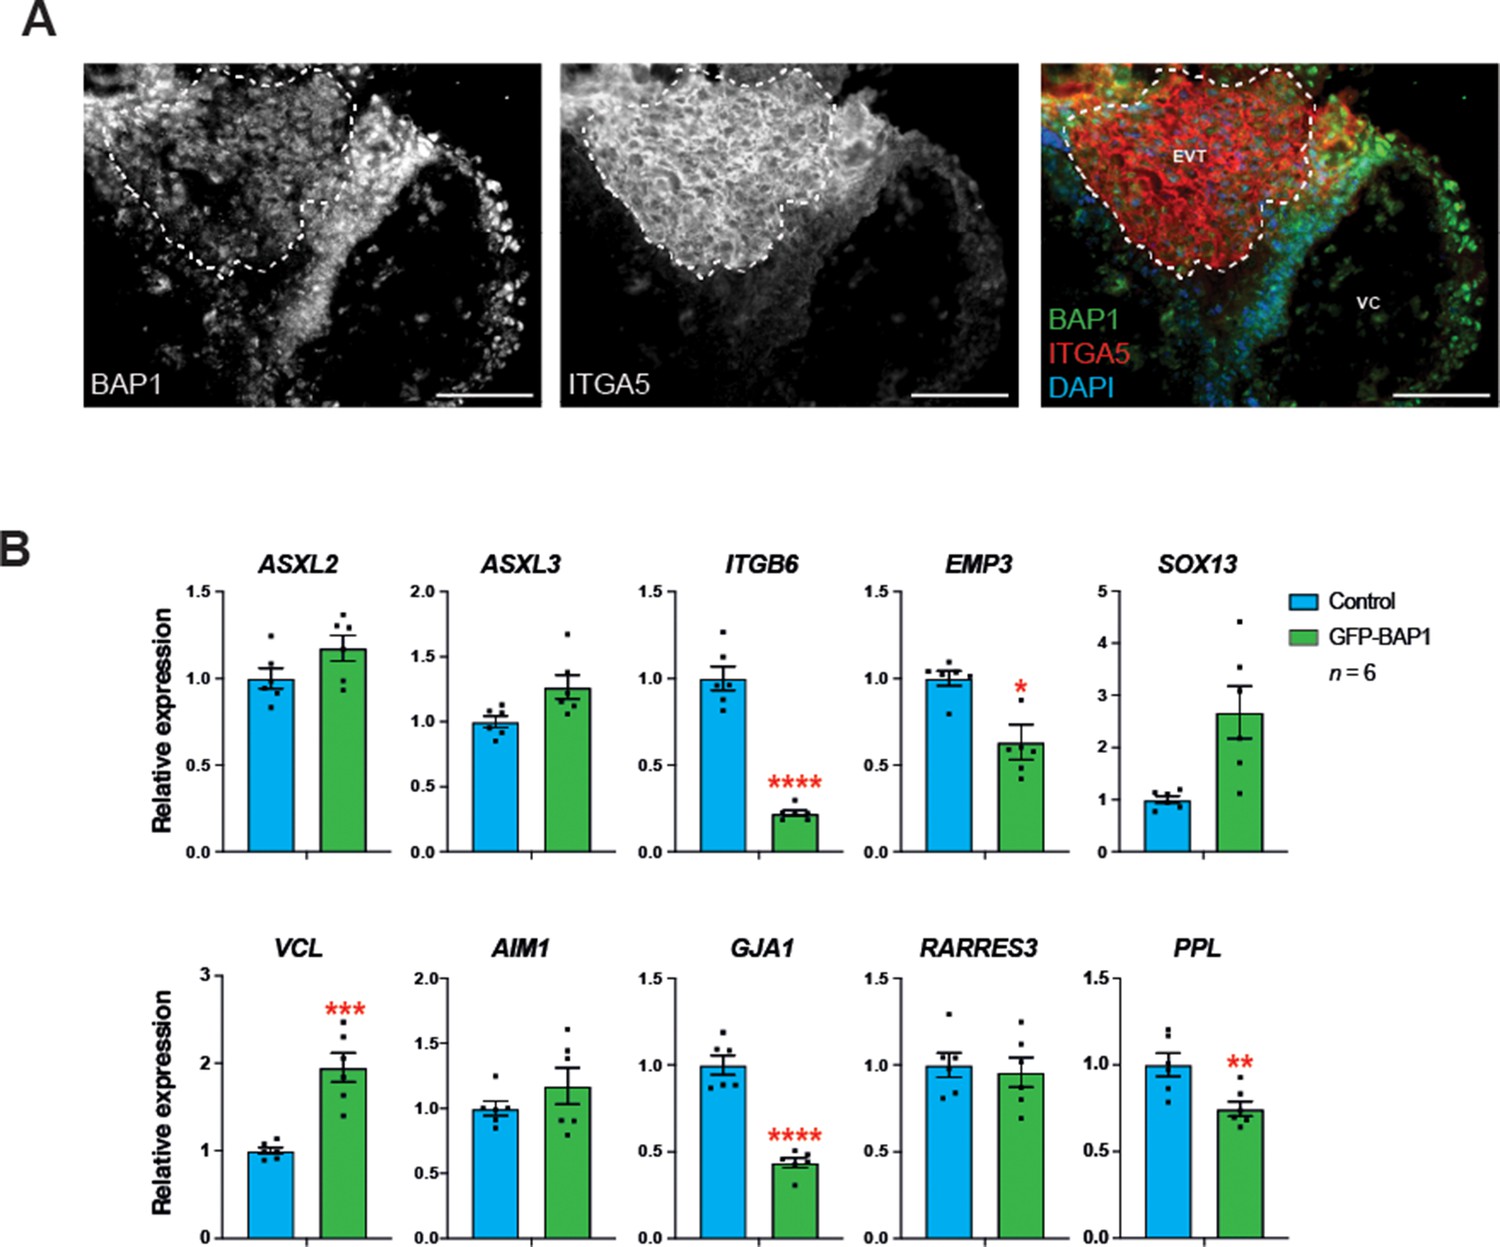
BAP1 immunofluorescence staining of first trimester human placenta.
(A) Immunostaining of first trimester placenta for BAP1 combined with integrin alpha-5 (ITGA5). Dotted lines outline the area of extravillous trophoblast (EVT) demarcated by high expression of ITGA5. VC: villous core. Representative images of three biological replicates. Scale bar: 100 µm. (B) RT-qPCR analysis of control and GFP-BAP1-transduced human trophoblast stem cells (hTSCs) grown in stem cell conditions. Expression is normalized to TBP housekeeping gene expression. Data are mean of six independent replicates ± SEM; *p<0.05, **p<0.01, ***p<0.001, ****p<0.0001 (Student’s t-test).
Author response image 1
Tables
Key resources table
| Reagent type (species) or resource | Designation | Source or reference | Identifiers | Additional information |
|---|---|---|---|---|
| Gene (Mus musculus) | Bap1 | GenBank | MGI:1206586 | |
| Gene (Mus musculus) | Asxl1 | GenBank | MGI:2684063 | |
| Gene (Mus musculus) | Asxl2 | GenBank | MGI:1922552 | |
| Gene (Homo sapiens) | BAP1 | GenBank | HGNC:950 | |
| Cell line (Mus musculus) | Mouse trophoblast stem cell line | Prof. Rossant lab | TS-Rs26 | |
| Cell line (Homo sapiens) | Human trophoblast stem cell line | Prof. Arima lab | BTS5 | |
| Cell line (Homo sapiens) | HEK293T: Human embryonic kidney cells | ATCC CRL-3216 | HEK293T | |
| Cell line (Homo sapiens) | Choriocarcinoma cell line | ATCC HTB-36 | JEG-3 | |
| Cell line (Homo sapiens) | Choriocarcinoma cell line | ATCC HTB-144 | JAR | |
| Cell line (Homo sapiens) | Choriocarcinoma cell line | ATCC CCL-98 | BeWo | |
| Antibody | Anti-ACTIN (mouse monoclonal) | Abcam | ab6276 | WB (1:5000) |
| Antibody | Anti-ASXL1 (rabbit monoclonal) | Cell Signaling | #52519 | WB (1:1000), IF (1:100) |
| Antibody | Anti-ASXL1 (mouse monoclonal) | Abnova | H00171023-M05 | WB (1:1000), IP (1:100) |
| Antibody | Anti-ASXL2 (rabbit polyclonal) | Abcam | ab106540 | WB (1:1000), IF (1:100) |
| Antibody | Anti-ASXL2 (rabbit polyclonal) | Bethyl Laboratories | A302-037A | WB (1:1000), IP (1:250) |
| Antibody | Anti-BAP1 (rabbit monoclonal) | Cell Signaling | #13187 | IF (1:200), WB (1:1000), IHC (1:100), IP (1:250) |
| Antibody | Anti-E-Cadherin (CDH1) (mouse monoclonal) | BD Biosciences | 610181 | IF (1:200) |
| Antibody | Anti-CDX2 (mouse monoclonal) | Biogenex | MU392A-UC | WB (1:1000) |
| Antibody | Anti-ESRRB (mouse monoclonal) | R&D Systems | H6707 | WB (1:1000), IF (1:200) |
| Antibody | Anti-GATA3 (mouse monoclonal) | Invitrogen | MA5-15387 | WB (1:1000) |
| Antibody | Anti-HLAG (mouse monoclonal) | Bio-Rad | MCA2043 | WB (1:1000) |
| Antibody | Anti-ITGA5 (mouse monoclonal) | Santa Cruz Biotechnology | sc-376199 | IF (1:100) |
| Antibody | Anti-TUBULIN (rat monoclonal) | Abcam | ab6160 | WB (1:5000) |
| Antibody | Anti-Rabbit IgG (H + L)-HRP (goat polyclonal) | Bio-Rad | 170–6515 | WB (1:5000) |
| Antibody | Anti-Mouse IgG (H + L)-HRP (goat polyclonal) | Bio-Rad | 170–6516 | WB (1:5000) |
| Antibody | Anti-Rabbit IgG (H + L), Alexa Fluor 488 (goat polyclonal) | Thermo Fisher Scientific | A-11034 | IF (1:500) |
| Antibody | Anti-Mouse IgG (H + L), Alexa Fluor 568 (donkey polyclonal) | Thermo Fisher Scientific | A-10037 | IF (1:500) |
| Recombinant DNA reagent | Lenti dCas9-VP64-Blast (plasmid) | Addgene | RRID:Addgene_61425 | Lentiviral plasmid to transfect HEK293T cells and package dCas9-VP64 viral particles |
| Recombinant DNA reagent | Lenti MS2-p65-HSF1-Hygro (plasmid) | Addgene | RRID:Addgene_61426 | Lentiviral plasmid to transfect HEK293T cells and package MS2-p65-HSF1 viral particles |
| Recombinant DNA reagent | Lenti sgRNA (MS2)-puro (plasmid) | Addgene | RRID:Addgene_73795 | Lentiviral plasmid to transfect HEK293T cells and package sgRNA viral particles |
| Recombinant DNA reagent | psPAX2 (plasmid) | Addgene | RRID:Addgene_12260 | Lentiviral packaging plasmid |
| Recombinant DNA reagent | pMD2.G (plasmid) | Addgene | RRID:Addgene_12259 | VSV-G envelope expressing plasmid |
| Recombinant DNA reagent | pSpCas9(BB)−2A-GFP (PX458) (plasmid) | Addgene | RRID:Addgene_48138 | Plasmid to express Cas9 from Streptococcus pyogenes with 2A-EGFP, and cloning backbone for CRISPR-knockout sgRNA |
| Recombinant DNA reagent | pLV [Exp]-Puro- CMV > EGFP: mBap1[NM_027088.2] (lentiviral particles) | VectorBuilder | Calves(VB210106-1179qkj)-C | Lentiviral particles to transduce and express mouse GFP-BAP1 |
| Recombinant DNA reagent | pLV [Exp]-Puro- CMV > EGFP: hBAP1[NM_004656.4] (lentiviral particles) | VectorBuilder | Cat#LVS(VB210106-1177amh)-C | Lentiviral particles to transduce and express human GFP-BAP1 |
| Sequence-based reagent | Stealth small interfering RNA (siRNA) | Thermo Fisher Scientific | 1320003_MS23-25 | |
| Sequence-based reagent | Stealth small interfering RNA (siRNA) | Thermo Fisher Scientific | 1320003_MS36-38 | |
| Sequence-based reagent | Stealth RNAi siRNA Negative Control Kit | Thermo Fisher Scientific | 12935100 | |
| Peptide, recombinant protein | Alexa Fluor 568 Phalloidin | Thermo Fisher Scientific | A12380 | IF (1:500) |
| Chemical compound, drug | Lipofectamine RNAiMAX Transfection Reagent | Thermo Fisher Scientific | 13778 | |
| Chemical compound, drug | Lipofectamine 2000 Transfection Reagent | Thermo Fisher Scientific | 11668019 | |
| Commercial assay or kit | Vybrant cell adhesion assay kit | Thermo Fisher Scientific | V13181 | |
| Software, algorithm | Fiji | Schindelin et al., 2012 | ||
| Software, algorithm | StarDist | Schmidt et al., 2018 | ||
| Software, algorithm | TrackMate | Tinevez et al., 2017 | ||
| Software, algorithm | MorphoLibJ | Legland et al., 2016 | ||
| Software, algorithm | R studio | R studio software | http://www.rstudio.com | |
| Software, algorithm | GraphPad Prism 8 | GraphPad software | http://www.graphpad.com |
Additional files
-
Supplementary file 1
Genes dysregulated in Bap1 knockout (KO) mouse trophoblast stem cell (mTSC) in stem cell conditions (0 day) and during differentiation (3 days).
- https://cdn.elifesciences.org/articles/63254/elife-63254-supp1-v1.xls
-
Supplementary file 2
Gene ontology analyses of genes differentially expressed between vector and Bap1-mutant mouse trophoblast stem cells (mTSCs) in stem cell conditions (0 day) and during differentiation (3 days).
- https://cdn.elifesciences.org/articles/63254/elife-63254-supp2-v1.xlsx
-
Supplementary file 3
Genes dysregulated in Bap1 overexpressing mouse trophoblast stem cell (mTSC) in stem cell conditions (0 day) and during differentiation (3 days).
- https://cdn.elifesciences.org/articles/63254/elife-63254-supp3-v1.xls
-
Supplementary file 4
Gene ontology analyses of genes differentially expressed between Bap1 overexpressing and control mouse trophoblast stem cells (mTSCs) in stem cell conditions (0 day) and during differentiation (3 days).
- https://cdn.elifesciences.org/articles/63254/elife-63254-supp4-v1.xlsx
-
Supplementary file 5
List of genes commonly deregulated in the absence or excess of BRCA1-associated protein 1 (BAP1) in mouse trophoblast stem cells (mTSCs) growing in stem cell conditions and its gene ontology analyses.
- https://cdn.elifesciences.org/articles/63254/elife-63254-supp5-v1.xlsx
-
Supplementary file 6
Primer sequences for RT-qPCR and CRISPR gRNAs target sequences.
- https://cdn.elifesciences.org/articles/63254/elife-63254-supp6-v1.docx
-
Transparent reporting form
- https://cdn.elifesciences.org/articles/63254/elife-63254-transrepform-v1.docx
Download links
A two-part list of links to download the article, or parts of the article, in various formats.
Downloads (link to download the article as PDF)
Open citations (links to open the citations from this article in various online reference manager services)
Cite this article (links to download the citations from this article in formats compatible with various reference manager tools)
BAP1/ASXL complex modulation regulates epithelial-mesenchymal transition during trophoblast differentiation and invasion
eLife 10:e63254.
https://doi.org/10.7554/eLife.63254


