Extracellular matrix in multicellular aggregates acts as a pressure sensor controlling cell proliferation and motility
- Université Grenoble Alpes, Laboratoire Interdisciplinaire de Physique, CNRS, France
- Université de Lyon, Université Claude Bernard Lyon 1, CNRS, Institut Lumière Matière, France
- Collège de France, PSL Research University, France
Figures
Figure 1
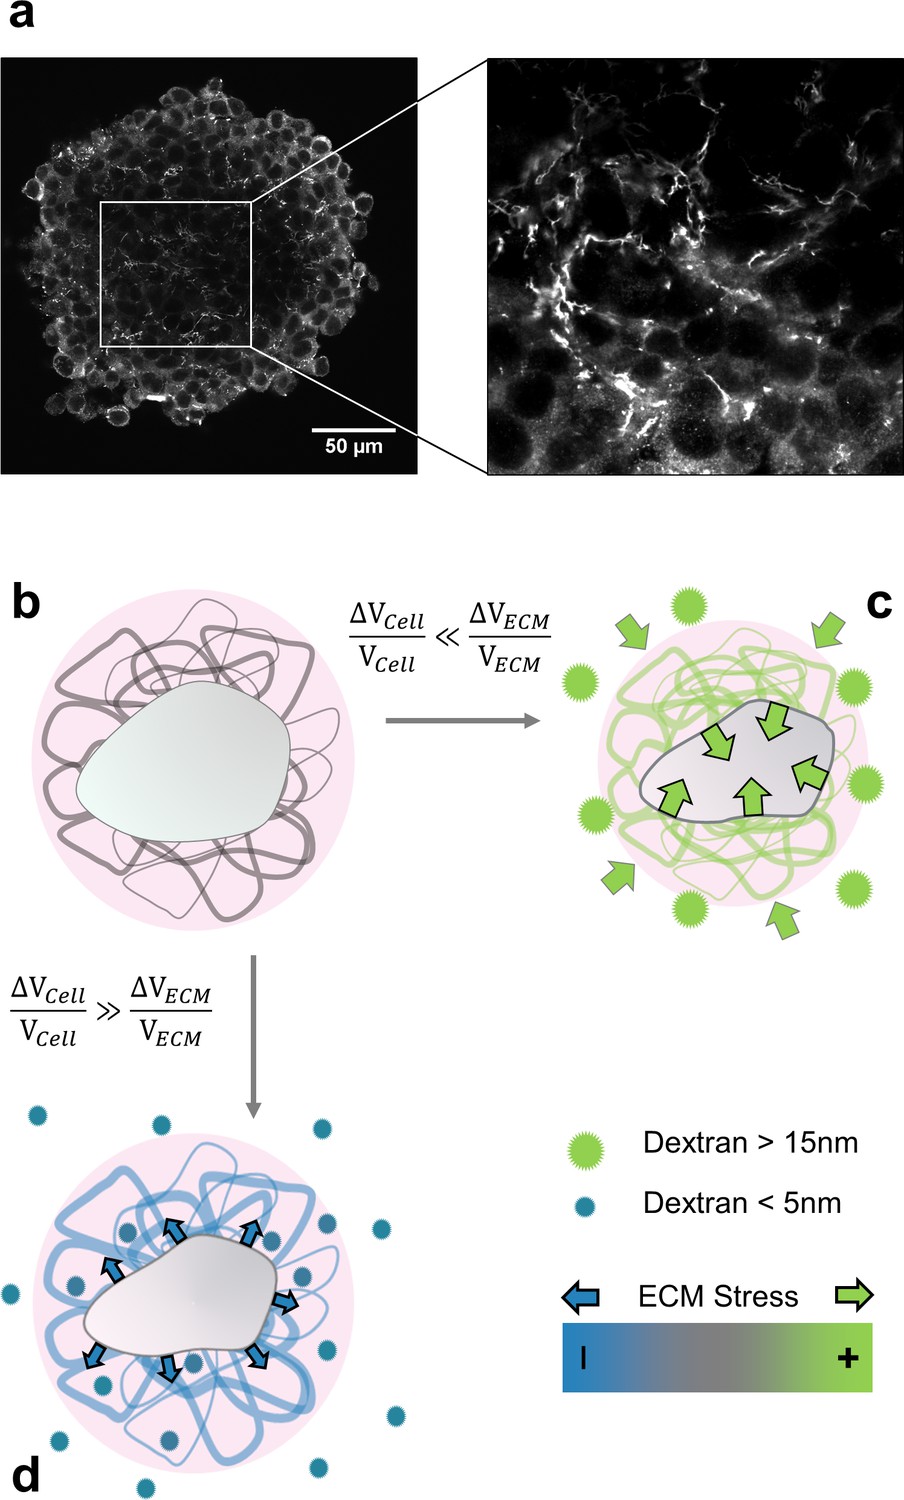
Selective compression method.
(a) Immunofluorescent staining of fibronectin in the interstitial space of a multicellular spheroid made of CT26 cells (b) Schematic view of a cell (gray) embedded in extracellular matrix (filaments), permeated by interstitial fluid (light pink). (c) Big osmolytes (green) do not penetrate through the ECM and induce a global compression. Being much more compressible than the cells, the extracellular matrix absorbs most of the deformation and exert a positive stress on the cell. (d) Small osmolytes (blue) enter the ECM without exerting any osmotic pressure on it. Conversely, they compress the cell which, in turn, exerts a tension on the ECM.
Figure 2
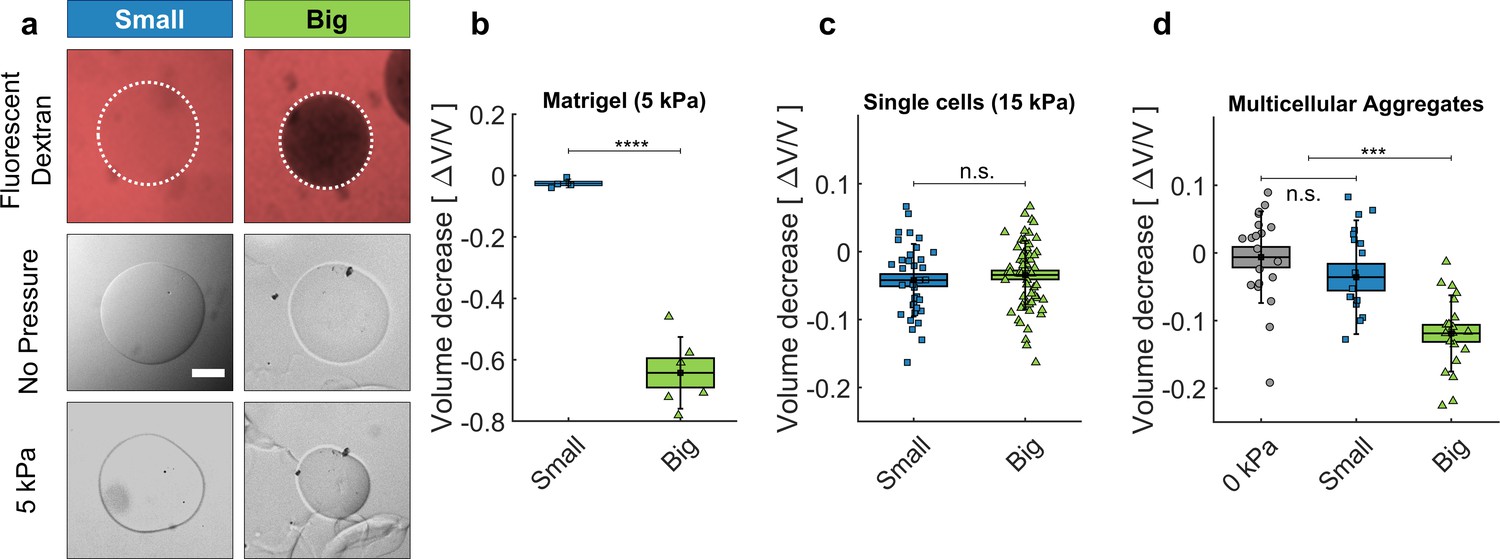
Cell and matrigel compression.
(a) Fluorescently labeled dextran molecules only permeate the beads (top-left panel) if their gyration radius is smaller than 5 nm. Otherwise (top-right panel) they are larger than the exclusion size of the matrigel network and are excluded from the bead. Compression of MG beads, occasioned by dextran molecules of two different sizes (Small: 70 kDa; Big: 500 kDa). Phase contrast images taken before and after the addition of pressure. (b) Beads lose 63 ± 5% of their initial volume when compressed using big dextran, and 2.5 ± 0.7% with small Dextran. N = 10. (c) Compression of individual cells using dextran of different sizes, with 15 kPa. At 5 kPa the compressibility of individual cells is not measurable. Cell compressibility is thus negligible in comparison to that of Matrigel. (d) MCS compression under 5 kPa, exerted using small (blue) and big (green) dextran molecules. In control experiments (0 kPa), the culture medium is replaced by fresh medium without dextran. (box : ±SEOM; error bars: ± SD • : single realizations).
-
Figure 2—source data 1
Data for Figure 2b,c,d.
- https://cdn.elifesciences.org/articles/63258/elife-63258-fig2-data1-v2.xlsx
Figure 3
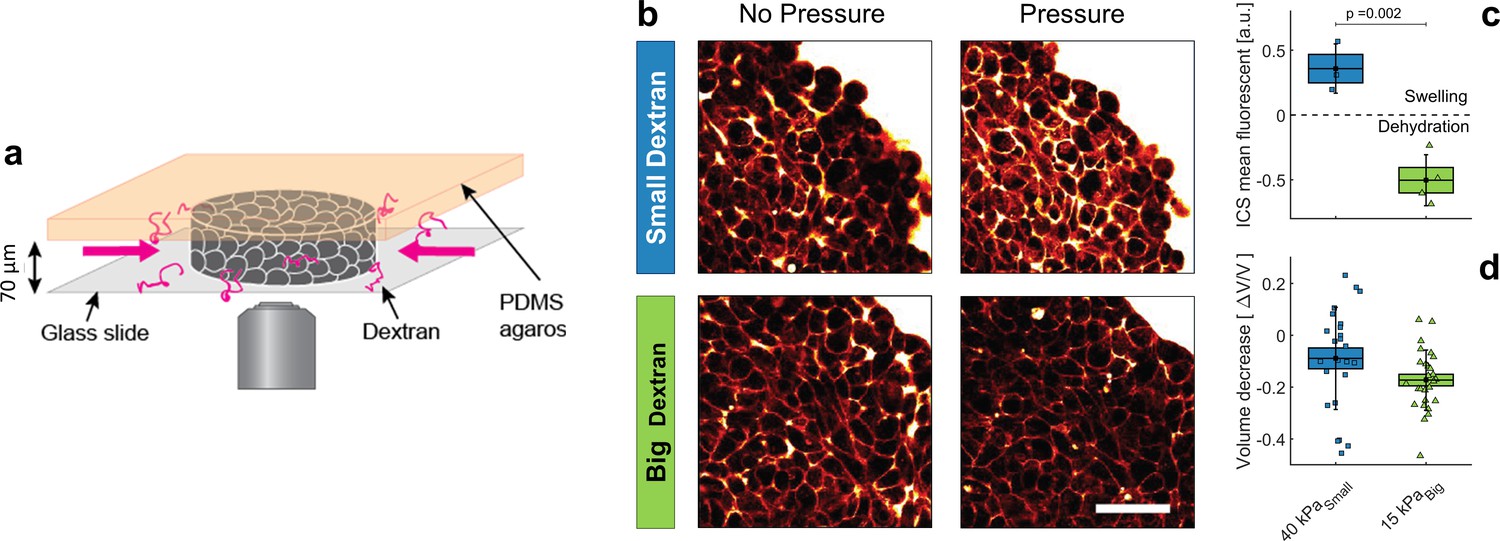
Effect of small versus big dextran on tissue intercellular space.
(a) Schematic of the 2D confiner micro-device. The tissue is confined between the glass coverslip and the PDMS and does not move during medium exchange. (b) Two-photon images of the tissue before and after (20 min) osmotic shocks for dextran chains of 6 kDa (small) and 2MDa (big), for a given mass concentration of 100 g/L. Images were taken in the equatorial plane of the tissue, meaning 35 μm above the glass slide. Scale Bar: 50 μm (c) Mean fluorescence of the intercellular space averaged over the whole aggregate shown in panel b. (d) volume loss of spheroids submitted to = 40 kPa (small dextran) and = 15 kPa (big dextran).
-
Figure 3—source data 1
Data for Figure 3c,d.
- https://cdn.elifesciences.org/articles/63258/elife-63258-fig3-data1-v2.xlsx
Figure 4
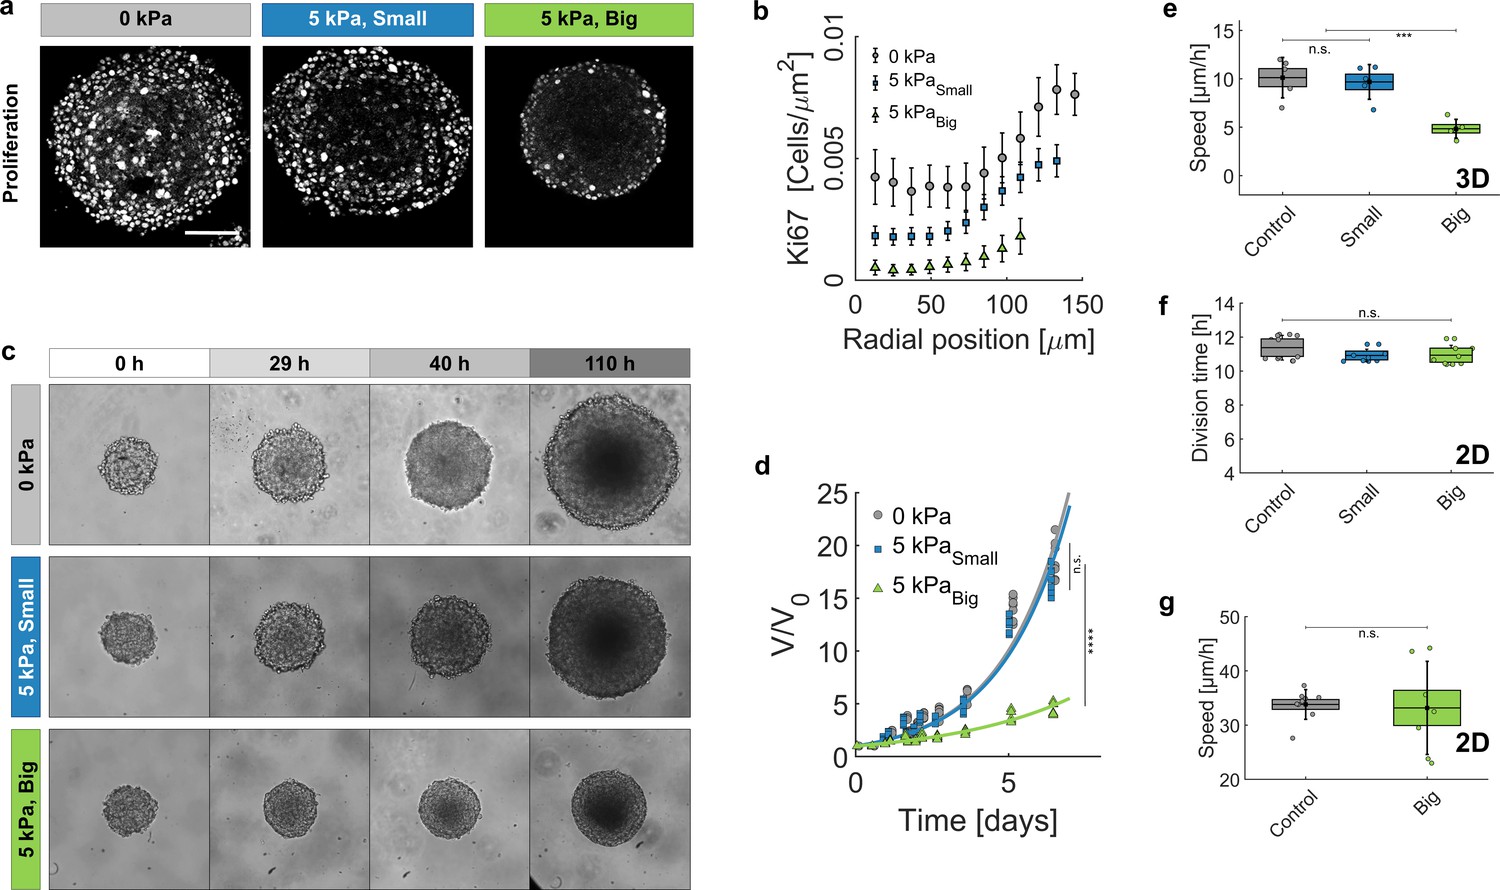
Growth of spheroids under pressure.
(a) Proliferating cells inside MCS revealed by immunostaining of KI67 with no pressure, under global compression of kPa (big dextran) and under selective compression of the cells by the same amount (small dextran). Scale bar: 100 (b) Density of Ki67-positive cells with respect to the distance from the center of the aggregate. Three conditions: No pressure (9 MCS), kPa with small dextran (26 MCS) and kPa with big dextran (19 MCS). Error bars = standard error of the mean. (c) Time evolution of the spheroid sizes (Full images are 700 × 700 μm) and (d) quantification of the volume increase, in the three reference conditions. (e) Cell migration speed within MCS also significantly depends on ECM compression. N = 5 independent experiments per condition. Error bars represent ± SEM. Experiments were repeated at least on three independent samples. (f) Division time of CT26 cells in 2D (Petri dish), respectively with no pressure (11.4 ± 0.5 hr), with kPa/small dextran (11.0 ± 0.3 hr) and with kPa/big dextran (10.9 ± 0.4 hr). (g) Mean velocity of individual cells on a Petri dish, before (N = 9) and after compression (N = 7).
-
Figure 4—source data 1
Data for Figure 4b.
- https://cdn.elifesciences.org/articles/63258/elife-63258-fig4-data1-v2.mat
-
Figure 4—source data 2
Data for Figure 4d.
- https://cdn.elifesciences.org/articles/63258/elife-63258-fig4-data2-v2.mat
-
Figure 4—source data 3
Data for Figure 4e.
- https://cdn.elifesciences.org/articles/63258/elife-63258-fig4-data3-v2.mat
-
Figure 4—source data 4
Data for Figure 4f,g.
- https://cdn.elifesciences.org/articles/63258/elife-63258-fig4-data4-v2.xlsx
Figure 5
Individual cells in Matrigel.
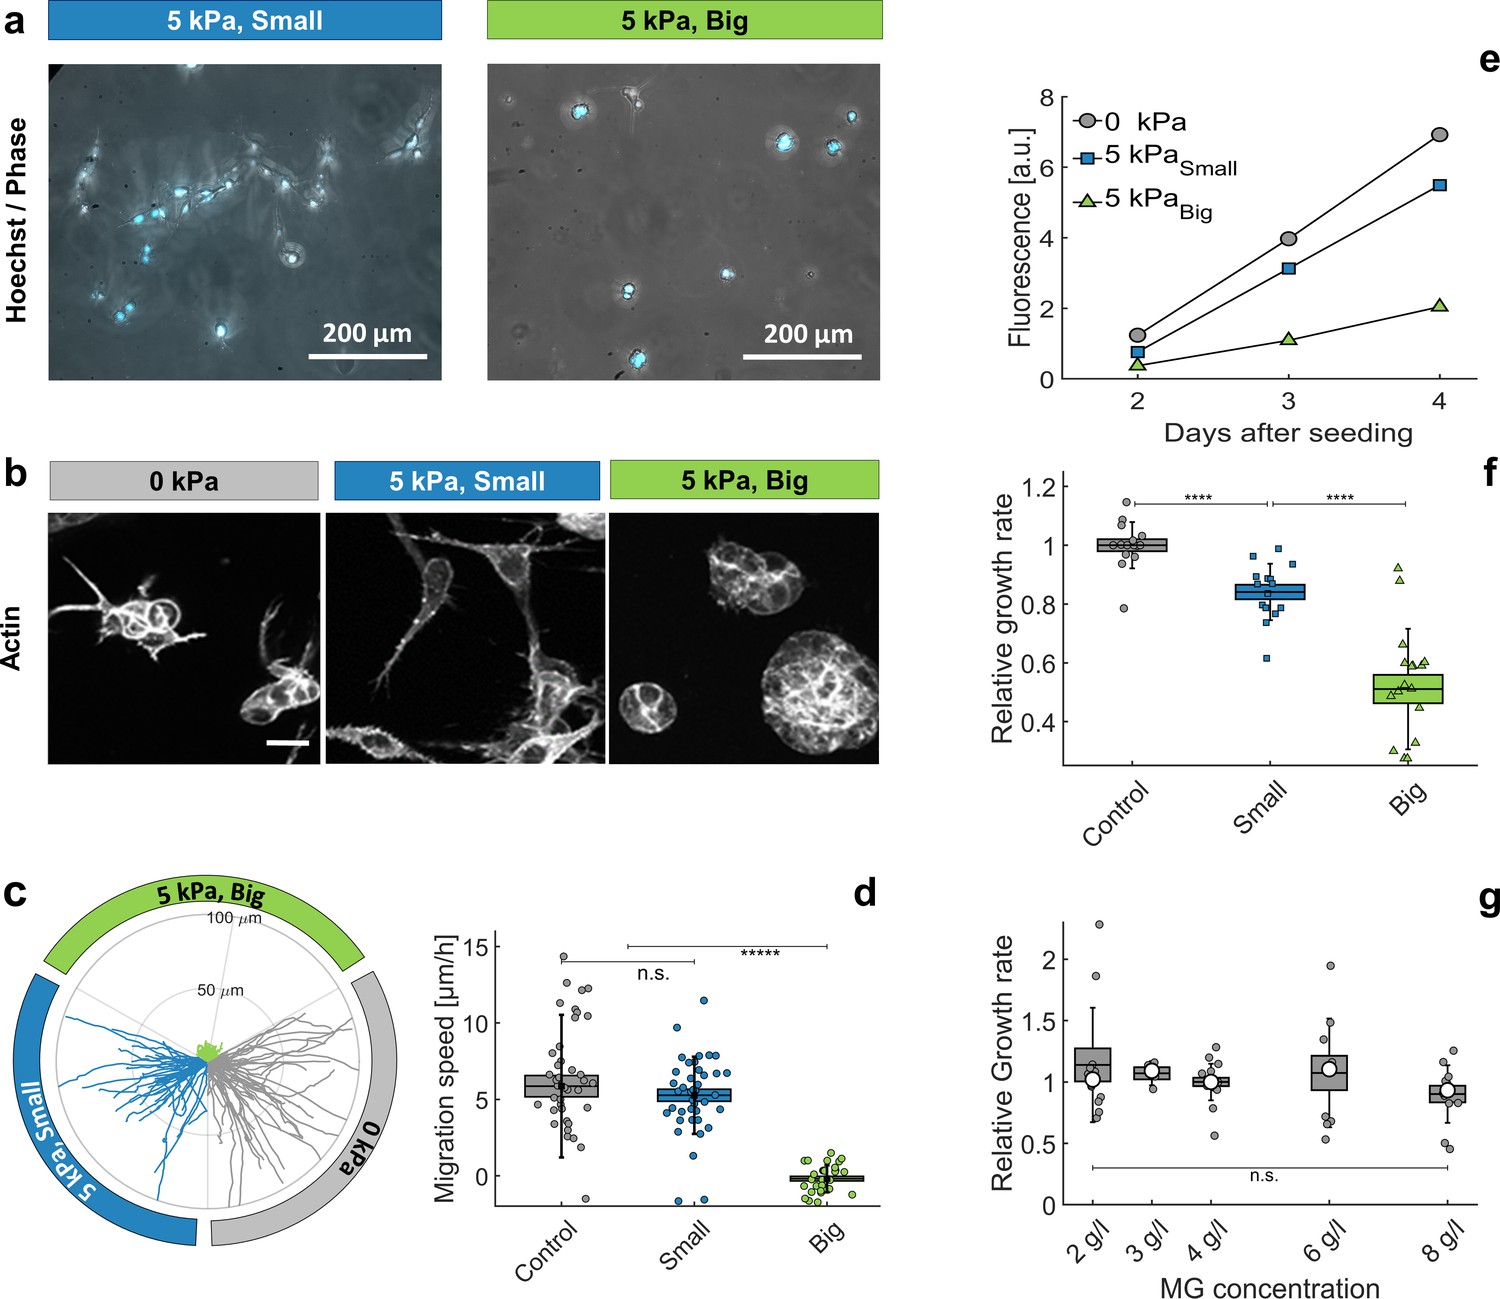
(a) Hoechst-labeled cell nuclei superimposed to phase image. Images are taken after 2 days of proliferation in MG, either with small (left panel) or big (right panel) dextran molecules. Maximal projection from epifluorescence stacks. (b) Cell morphology and anisotropy revealed by labeling of cytoplasmic actin. Maximal projection of 50 μ m confocal Z-stack. In relaxed MG, the cells appear more elongated and with long protrusions. (c) Cell motility in MG under different compression states. Starting points of trajectories are translated to the origin, to highlight the typical distance over which cells move in the three compressive states. (d) Quantification of in-plane velocity extracted from mean square displacements, under different compression conditions. With no pressure or with small dextran (5 kPa), the average velocities are respectively 5.8 ± 0.8 / hr and 5.2 ± 0.5 / hr. Under 5 kPa exerted by big dextran, the cells are immobile (v = 0.5 ± 0.4 ), where the error is due to tracking uncertainties. (e) Temporal evolution of nuclear fluorescence intergrated over the whole sample. No pressure (ο), 5 kPa with small dextran () and 5 kPa with big dextran (). (f) Cell proliferation rate in the three conditions. n = 15, from eight independent experiments. (g) Cell proliferation rate at different initial matrigel concentration, with no pressure. Boxes represent the mean values ± SEM, error bars correspond to the standard deviation, small markers are individual experiments and large markers the median.
-
Figure 5—source data 1
Data for Figure 5c,d.
- https://cdn.elifesciences.org/articles/63258/elife-63258-fig5-data1-v2.mat
-
Figure 5—source data 2
Data for Figure 5e,f,g.
- https://cdn.elifesciences.org/articles/63258/elife-63258-fig5-data2-v2.xlsx
Appendix 1—figure 1
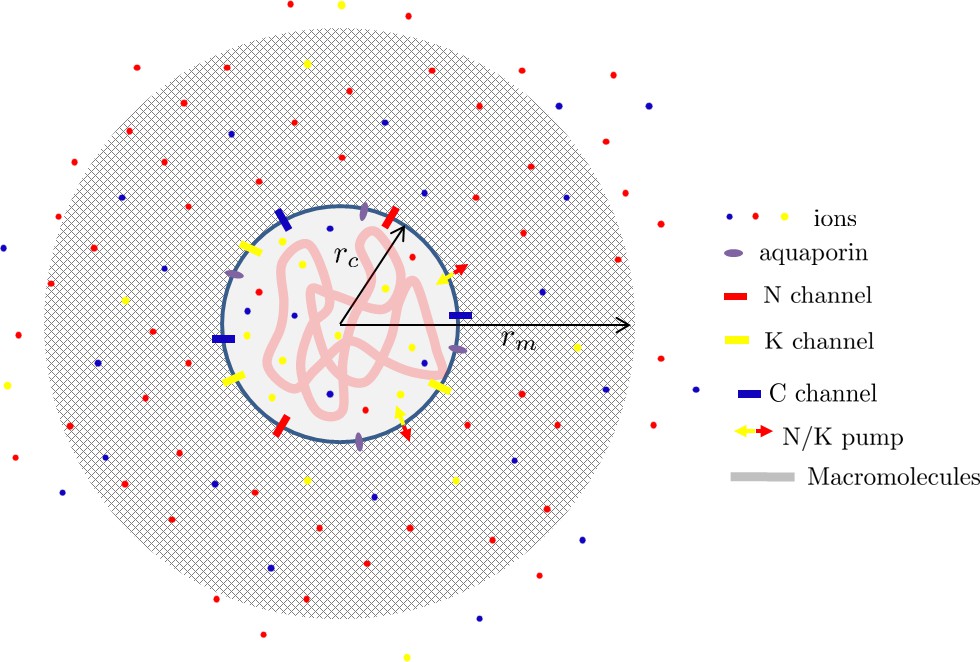
Scheme of a cell nested in a porous matrix.
Appendix 1—figure 2
Compression of polyacrylamide beads embedded in Matrigel.
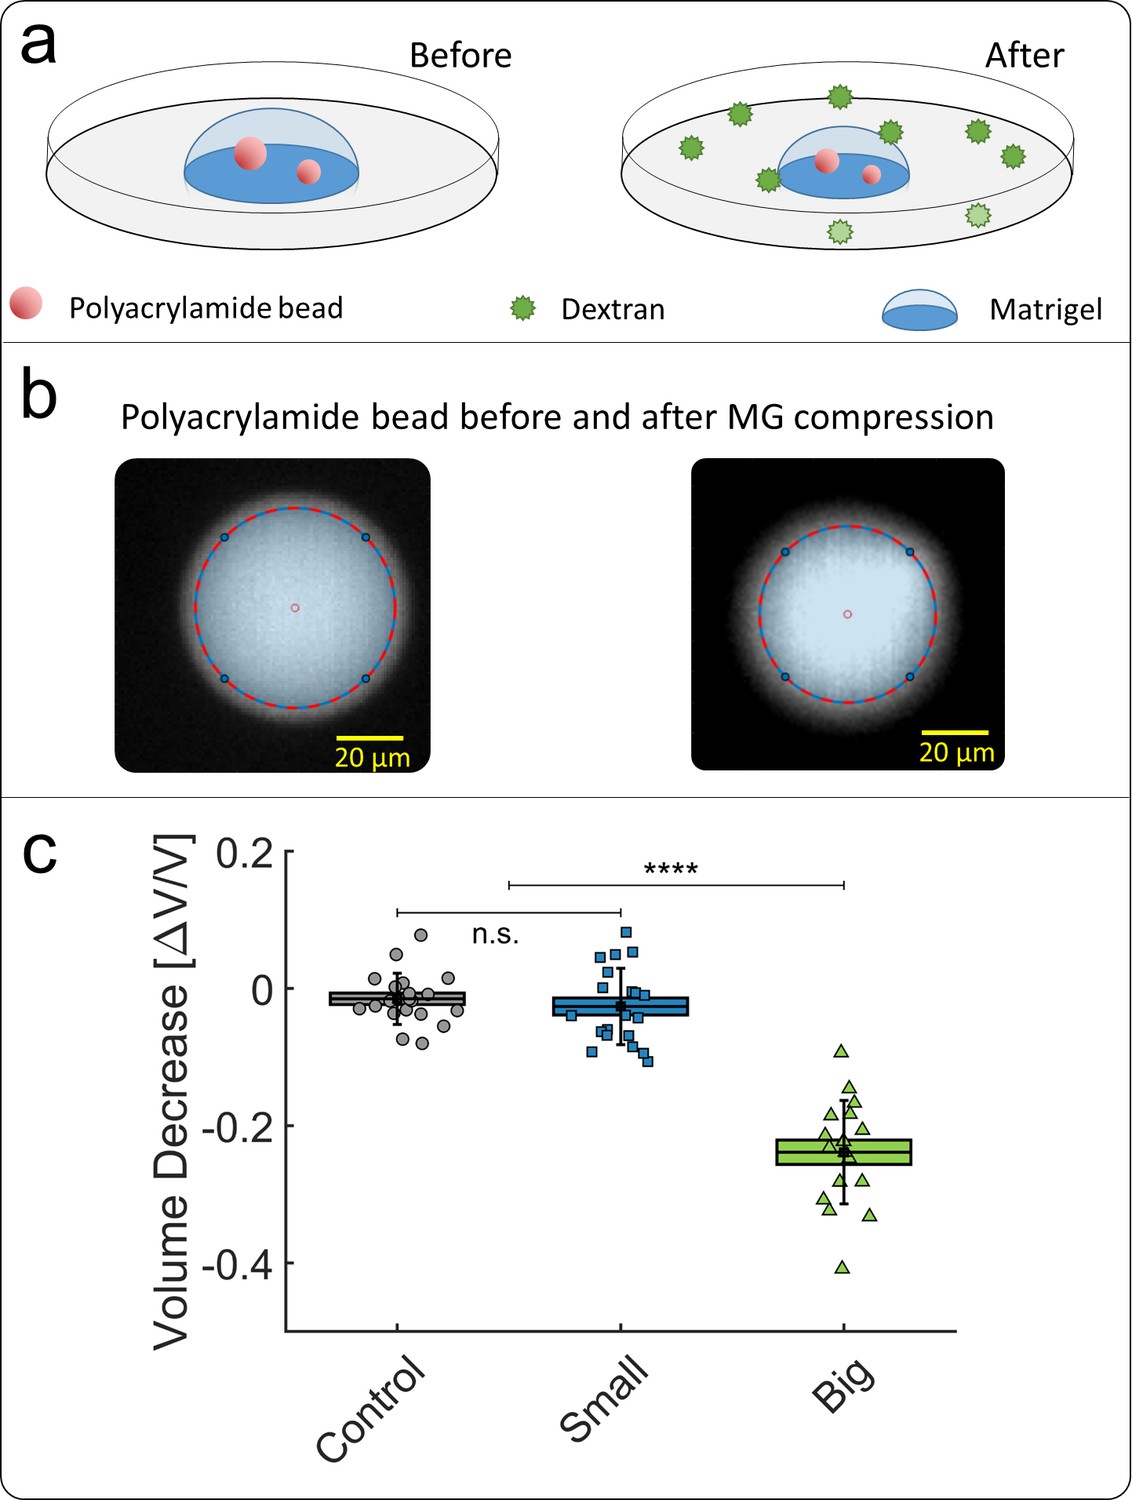
(a) Schematic view of the experiment: compressible polyacrylamide beads (in red) are embedded in a matrigel drop and imaged before and after the addition of Dextran at = 5 kPa. (b) Images of a fluorescent bead, respectively before and after compression. The bead volume is deduced from its equatorial section, assuming that the beads remain spherical after compression. (c) Volume decrease of polyacrylamide beads under compression occasioned by small (blue) and big (green) dextran.
Appendix 1—figure 3
Volume fraction estimation.
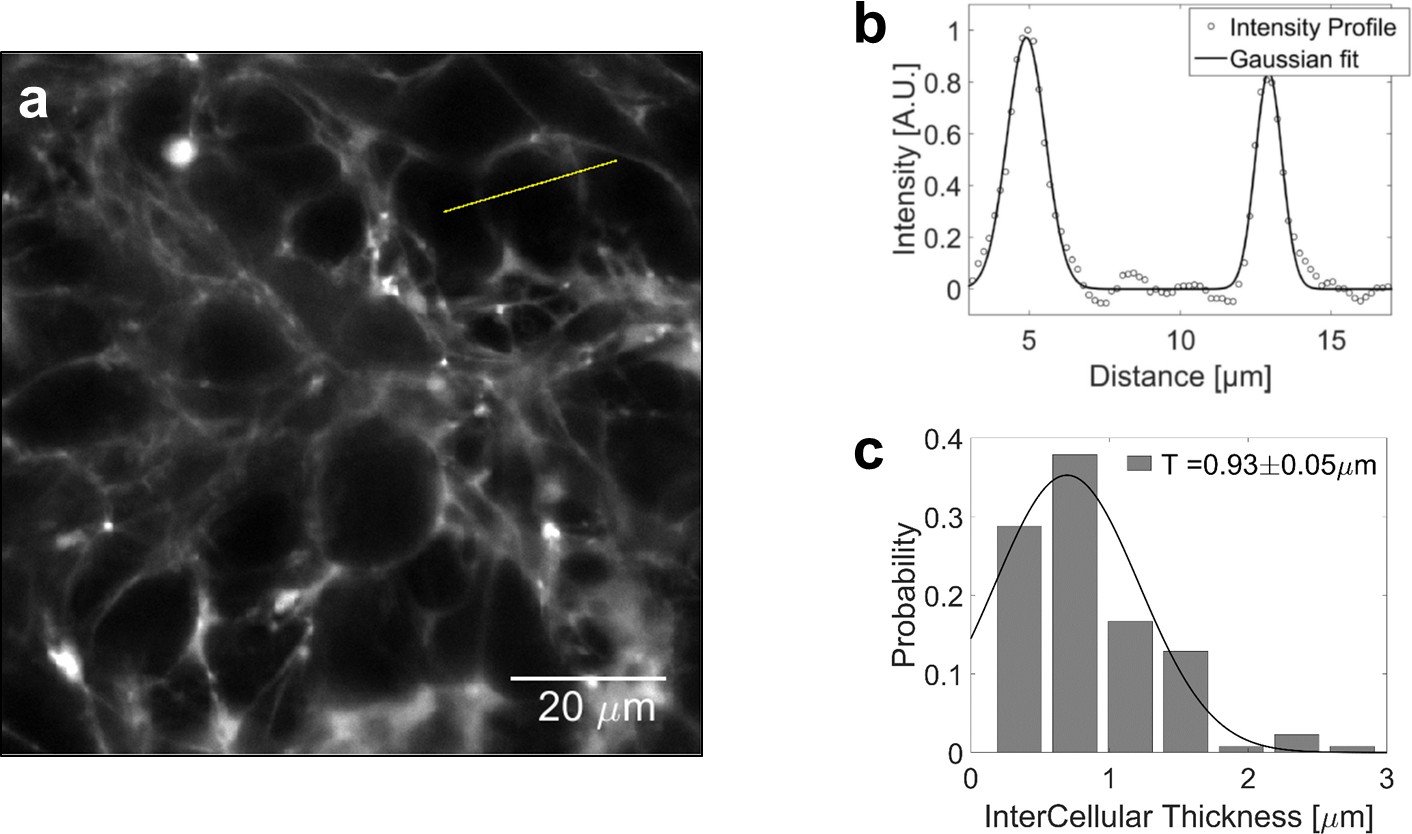
(a) Confocal section of a MCS, the extracellular space of which is filled with sulforhodamine-B. (b) Intensity profile across two extracellular layers. The width of intercellular space is computed by fitting the intensity to a gaussian profile. (c) Distribution of the intercellular layer thicknesses.
Appendix 1—figure 4
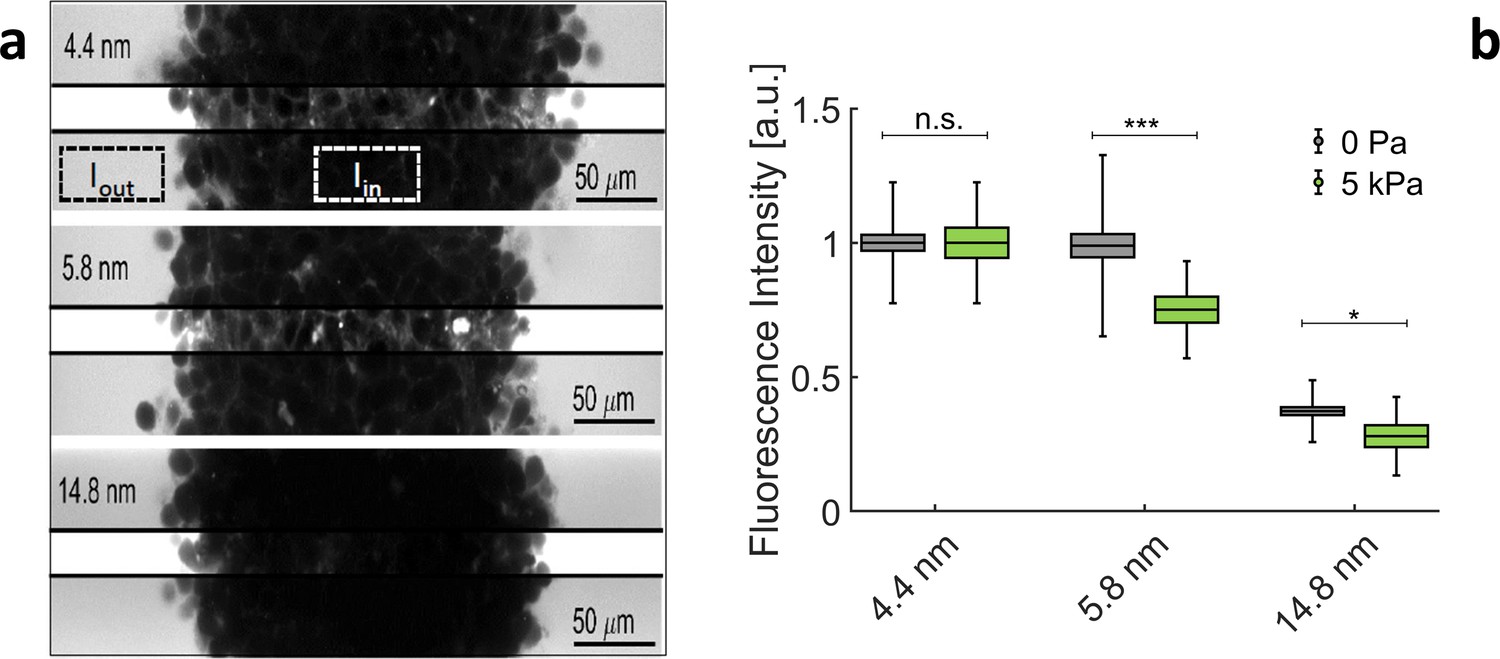
Exclusion size of the ECM in MCS.
(a) Confocal sections of three MCS dipped in culture media supplemented with Dextran of increasing molecular weights.To avoid saturation of , photomultiplier gain is kept low. This reduces the visibility of extracellular space inside the MCS. In the middle stripe of each image, the brightness is increased of the same amount to make the fluorescence of Dextran visible in the extracellular space. (b) Relative intensity / for different Dextran sizes, respectively, without pressure (gray boxes) and with 5 kPa (green boxes). Box sizes and error bars represent respectively the standard error of the mean and the standard deviation. Controls results (no pressure) are obtained from 58 MCS per condition. Experiments under pressure are averaged over 16 (for 4.4 nm), 14 (for 5.8 nm), and 13 (for 14.8 nm) MCS.
Appendix 1—figure 5
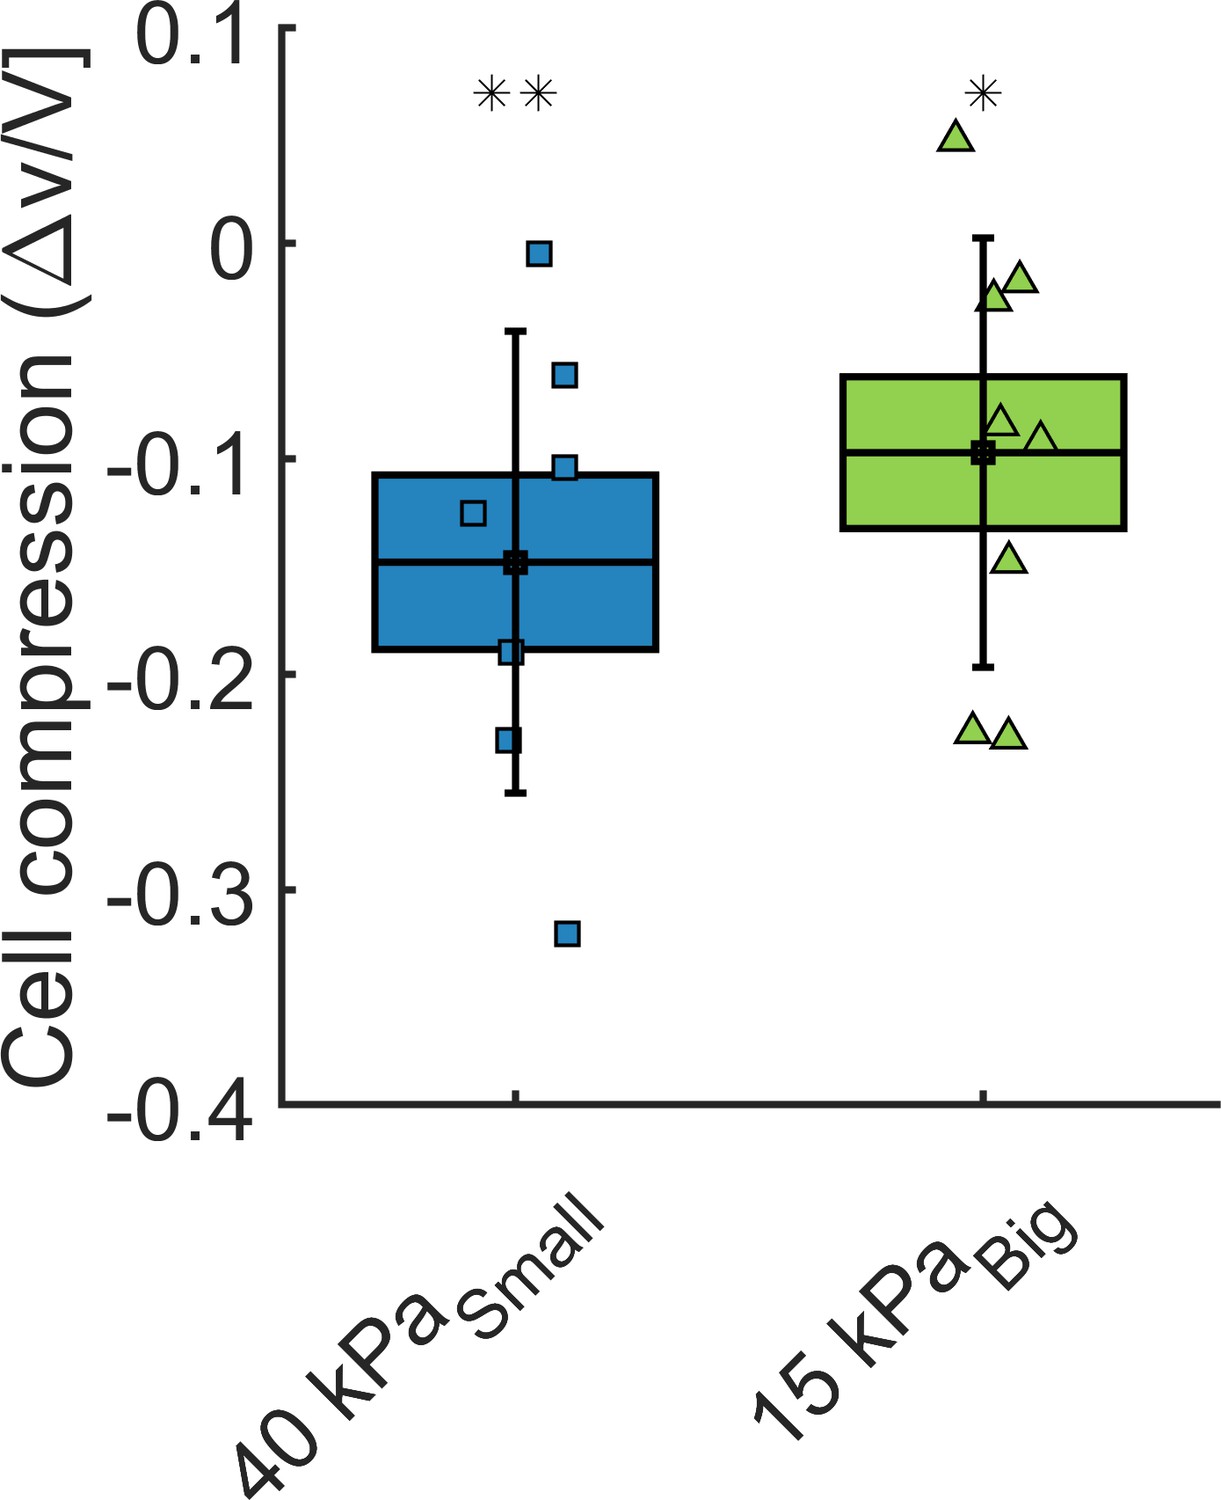
Cell volume change.
Volume loss of cells inside the spheroids, under = 40 kPa and = 15 kPa, respectively.
Appendix 1—figure 6
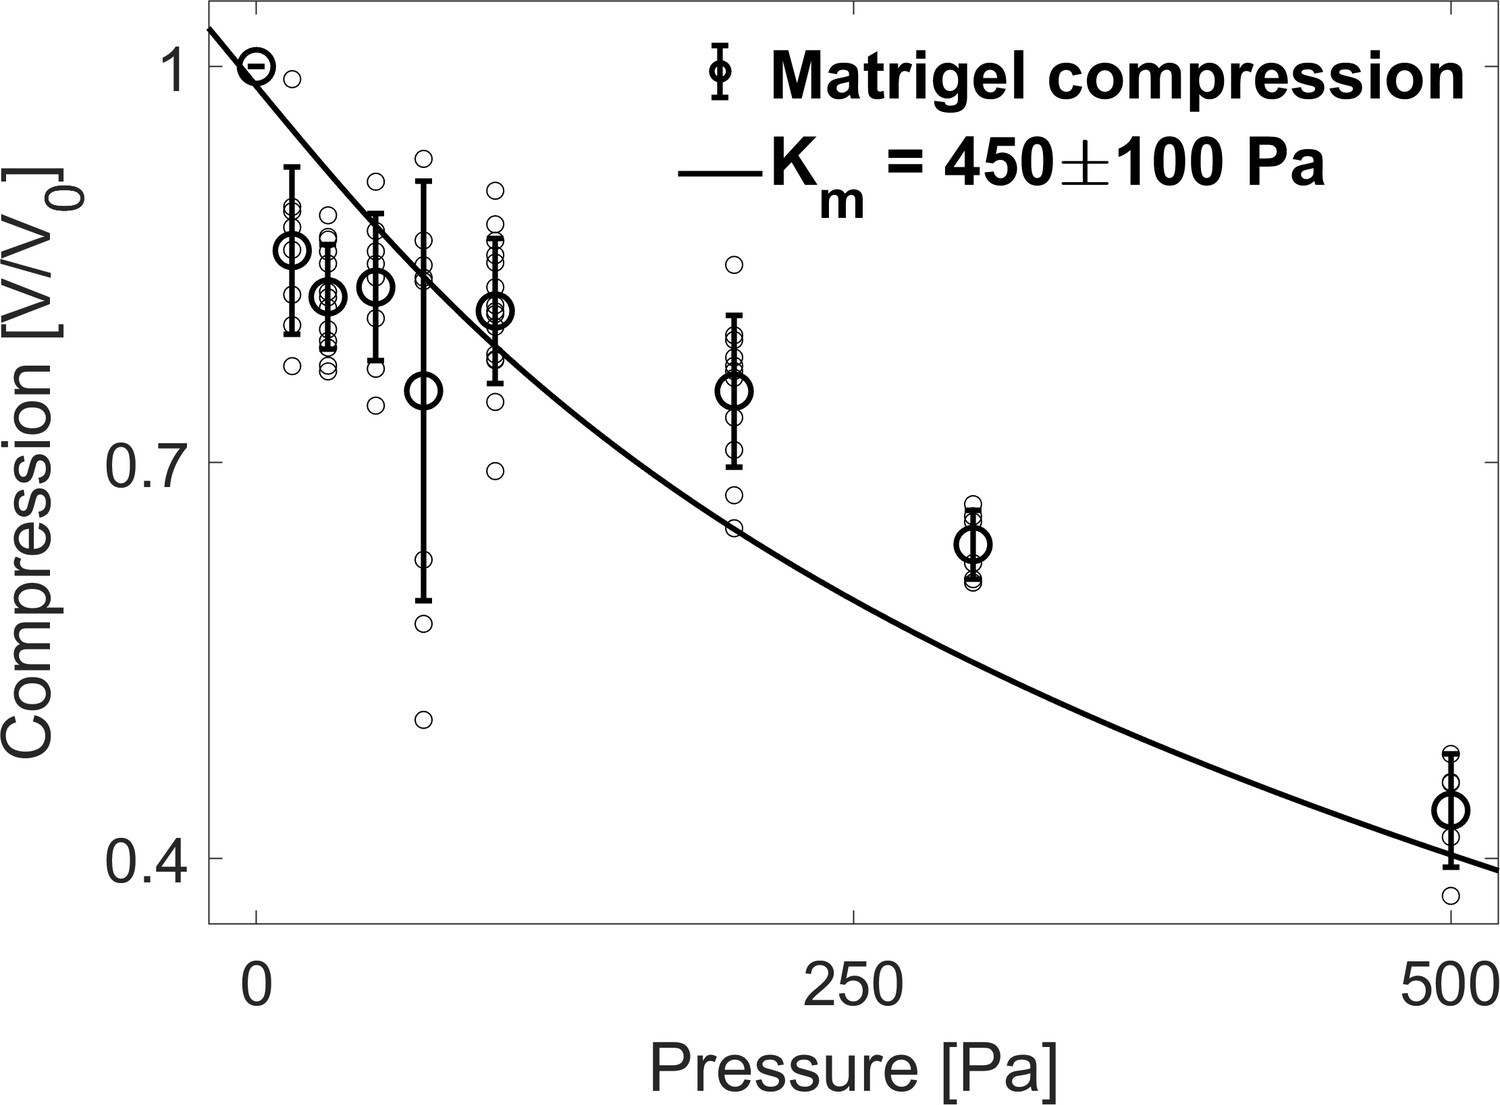
Matrigel bulk modulus.
Compression of the Matrigel beads as a function of the osmotic pressure. Small circles correspond to individual measurements on different MG beads, large circles to the mean value at a given pressure and error bars to the standard deviation. Data are fitted to a hyperelastic model to determine the bulk modulus of matrigel (continuous line).
Appendix 1—figure 7
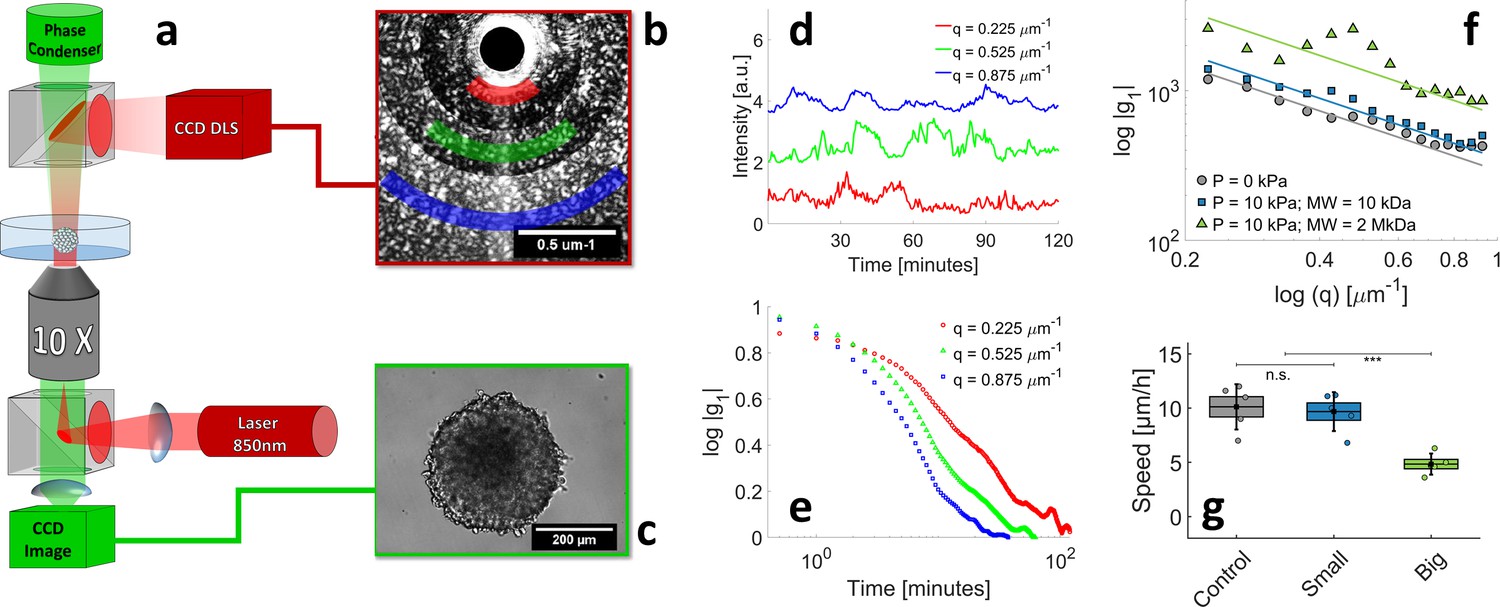
Motile activity measured by Dynamic Light Scattering (DLS) under different pressure conditions.
(a) The experimental setup combines two counter-propagating optical pathways, with two different wavelengths. This allows us to observe the MCS simultaneously by DLS ( = 850 nm, dark red in the sketch) and by phase contrast ( = 530 nm, green). The DLS signal and phase contrast image are illustrated respectively in panels (b) and (c). DLS signals are acquired at different scattering vectors q and averaged over rings of equal q=|q| (colored sectors in panel (b)). (d) Time evolution of diffraction intensity at three different q; colors correspond to that of sectors in panel (b). (e) Intensity-Intensity autocorrelation functions for the three different scattering vectors. In the single-scattering regime, the intensity signal decorrelates in a typical timescale , where is the mean cell velocity inside the MCS. (f–g) respectively the decorrelation time as a function of q and the resulting mean cell velocity, measured in three different conditions: with no pressure, = 10 ± 1 μm/hr (magenta), with 5 kPa exerted by small Dextran, = 9.8 ± 0.8 μm/hr (cyan), and with kPa exerted by large Dextran, = 4.8 ± 0.5 μm/hr (blue). Box sizes correspond to the standard error of the mean (N = 5 MCS) and the error bars to the standard deviation.
Appendix 1—figure 8
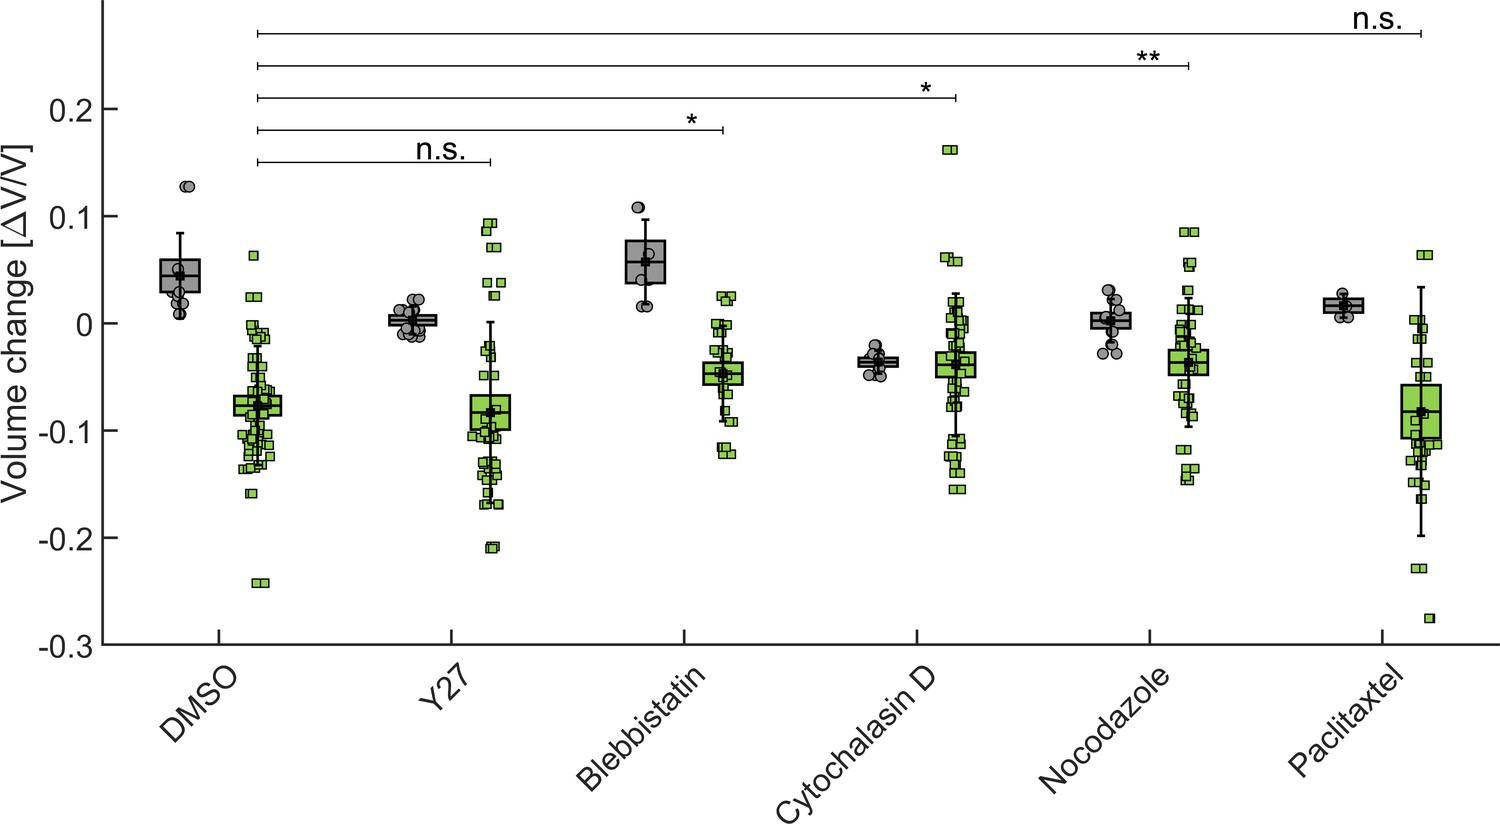
Influence of cytoskeleton structure and contractility on MCS compressibility.
In gray, the relative change of the MCS volume after injection of drug (or DMSO alone in control experiments). In green, the vovlume change after addition of drug+dextran at 5 kPa. BoxPlot represent the standard error of the mean, error bars the standard deviation, and circles/squares the volume change of individual spheroiods.
Author response image 1
Tables
Key resources table
| Reagent type (species) or resource | Designation | Source or reference | Identifiers | Additional information |
|---|---|---|---|---|
| Cell Line (mouse) | CT26 | ATCC CRL-2638 | RRID:CVCL_7256 | |
| Chemical compound,drug | Matrigel/MG | Corning; 354234 | ||
| Chemical compound, drug | Small Dextran | Sigma Aldrich; D9260 | ||
| Chemical compound, drug | Big Dextran | Sigma-Aldrich; D5376 | ||
| Antibody | Anti-Fibronectin (Monoclonal mouse) | Sigma Aldrich; F7387 | RRID:AB_476988 | (1:200) |
| Antibody | Anti-Ki-67 (Polyclonal rabbit) | Sigma Aldrich; AB9260 | RRID:AB_2142366 | (1:200) |
Additional files
Download links
A two-part list of links to download the article, or parts of the article, in various formats.
Downloads (link to download the article as PDF)
Open citations (links to open the citations from this article in various online reference manager services)
Cite this article (links to download the citations from this article in formats compatible with various reference manager tools)
Extracellular matrix in multicellular aggregates acts as a pressure sensor controlling cell proliferation and motility
eLife 10:e63258.
https://doi.org/10.7554/eLife.63258


