Efficient chromatin accessibility mapping in situ by nucleosome-tethered tagmentation
- Basic Sciences Division Fred Hutchinson Cancer Research Center, United States
- Howard Hughes Medical Institute, United States
Figures
Figure 1 with 1 supplement
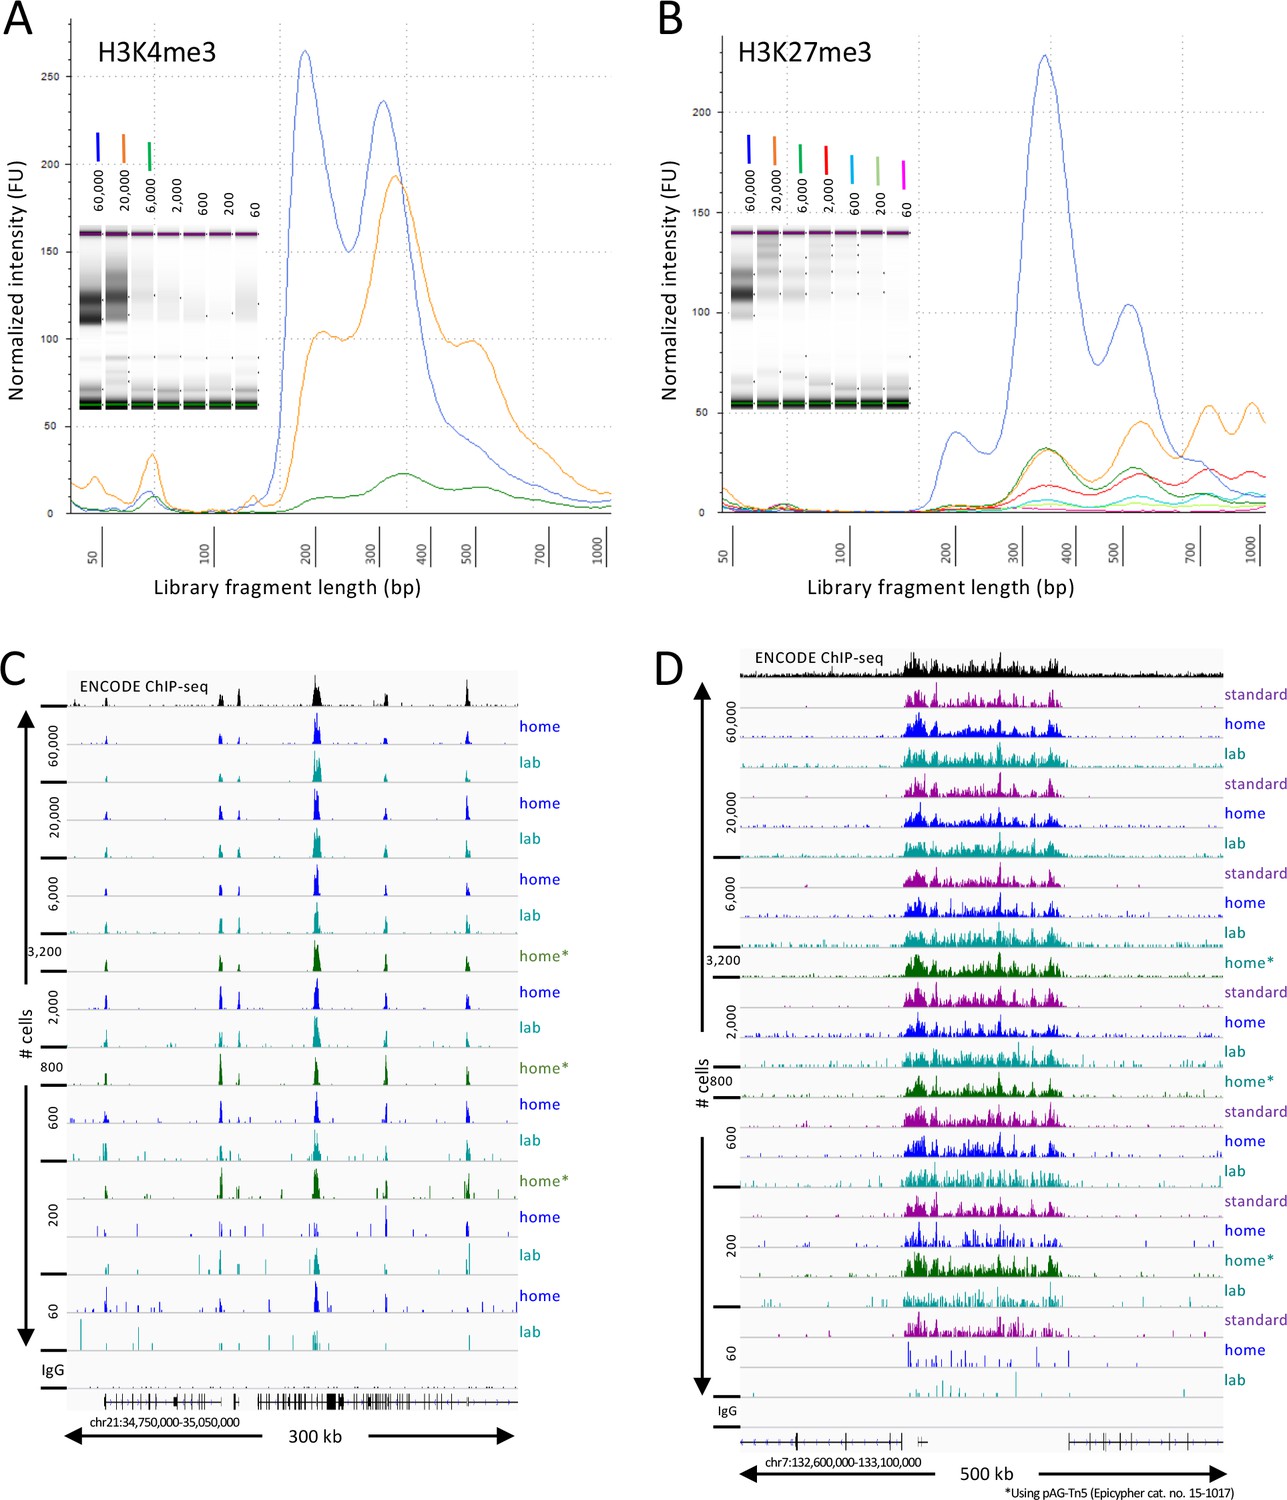
CUT&Tag-direct produces high-quality datasets on the benchtop and at home.
Starting with a frozen human K562 cell aliquot, CUT&Tag-direct with amplification for 12 cycles yields detectable nucleosomal ladders for intermediate and low numbers of cells for both (A) H3K4me3 and (B) H3K27me3. The higher yield of smaller fragments with decreasing cell number suggests that reducing the total available binding sites increases the binding of antibody and/or pAG-Tn5 in limiting amounts. (C) Comparison of H3K4me3 CUT&Tag-direct results produced in the laboratory to those produced at home and to an ENCODE dataset (GSM733680). (D) Same as (C) for H3K27me3 comparing CUT&Tag-direct results to CUT&Tag datasets using the standard protocol (Kaya-Okur et al., 2019), and to an ENCODE dataset (GSM788088). pA-Tn5 was used except as indicated by asterisks for datasets produced at home using commercial pAG-Tn5 (Epicypher cat. no. 15–1017).
Figure 1—figure supplement 1
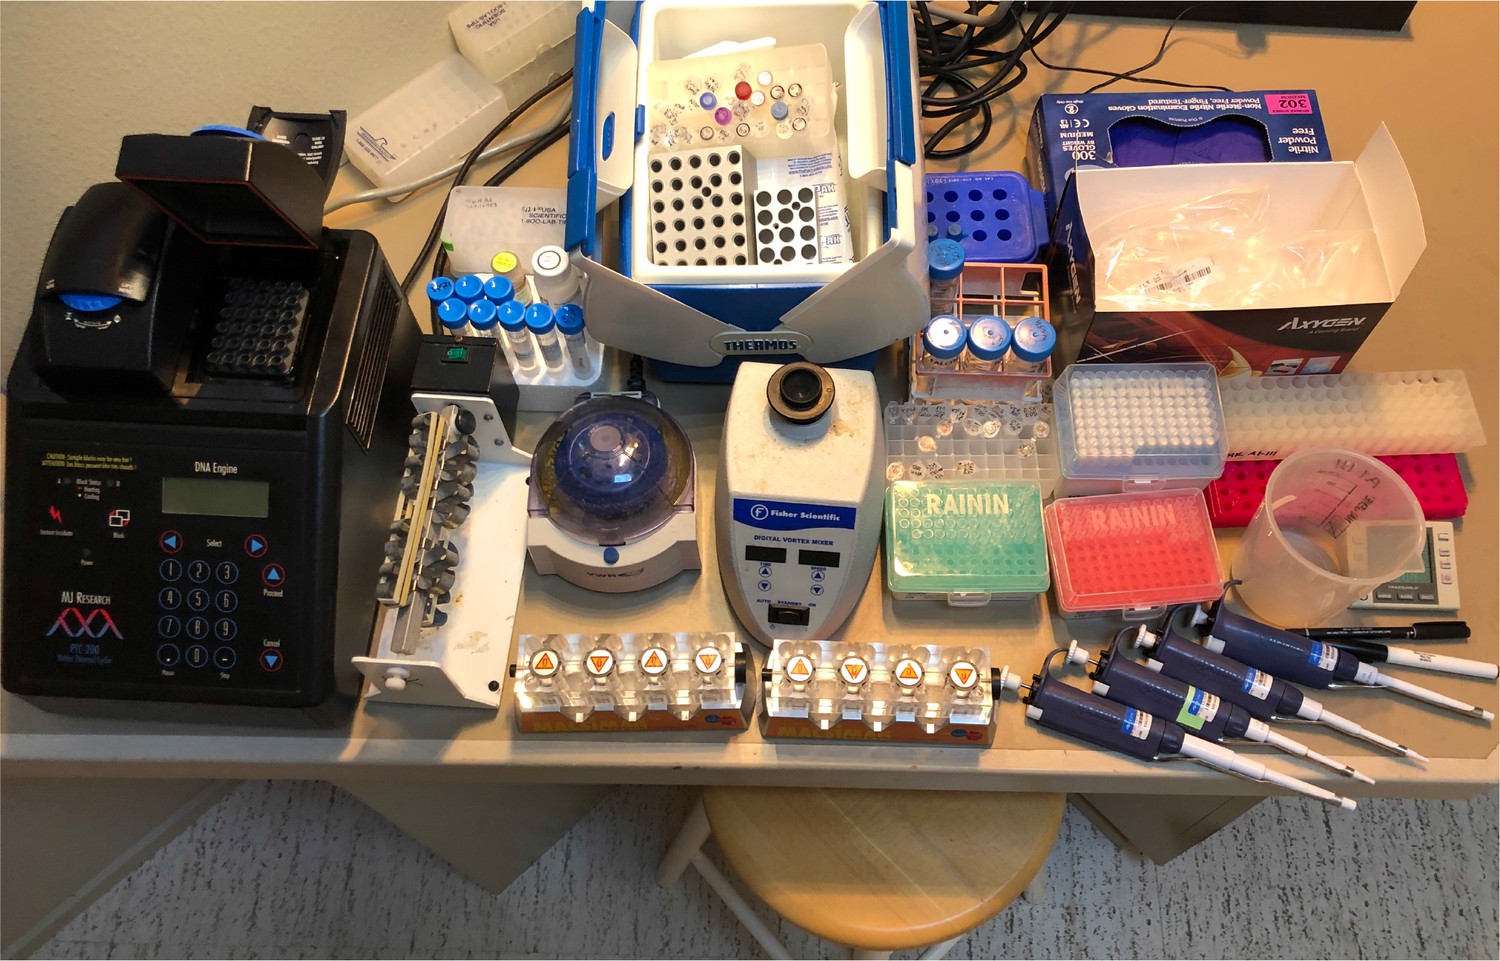
Equipment, supplies, reagents, and solutions for CUT&Tag on a home workbench.
All experiments starting with nuclei frozen in 10% DMSO in Mr. Frosty containers down to –80°C and held at –20°C were performed on a counter in a home laundry/utility room using stock solutions previously prepared in the lab. Following SPRI bead clean-up and liquid removal from the starting PCR tubes to fresh tubes, samples were brought into the lab for TapeStation analysis and equimolar mixing of barcoded samples followed by an SPRI clean-up of the pool and dilution for submission to the Fred Hutch Genomics Shared Resource for Illumina PE25 DNA sequencing. There are no hazardous materials or dangerous equipment used in the at-home protocol, however appropriate lab safety training is recommended.
Figure 2
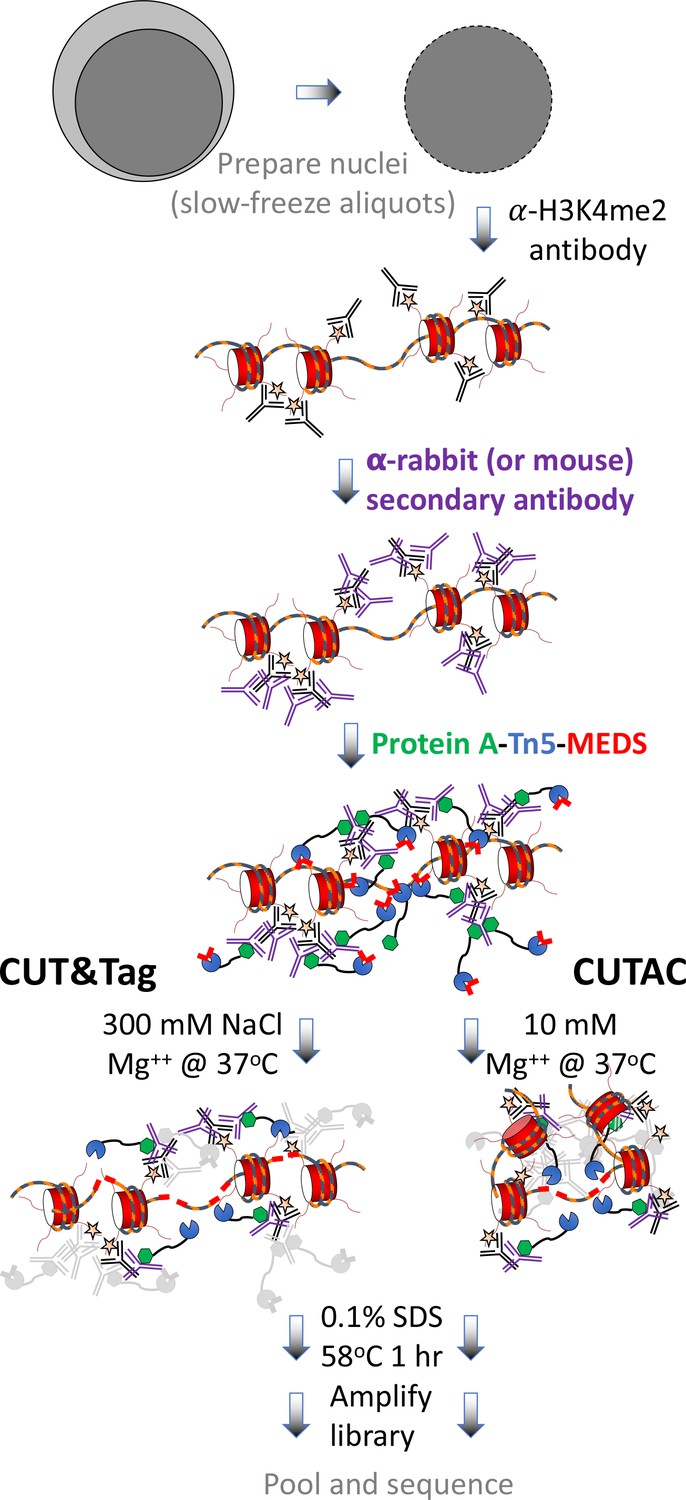
CUT&Tag with low-salt tagmentation (CUTAC).
Steps in gray are lab-based and other steps were performed at home. Tagmentation can be performed by dilution, removal or post-wash. MEDS (mosaic end double-stranded annealed oligonucleotides).
Figure 3 with 4 supplements
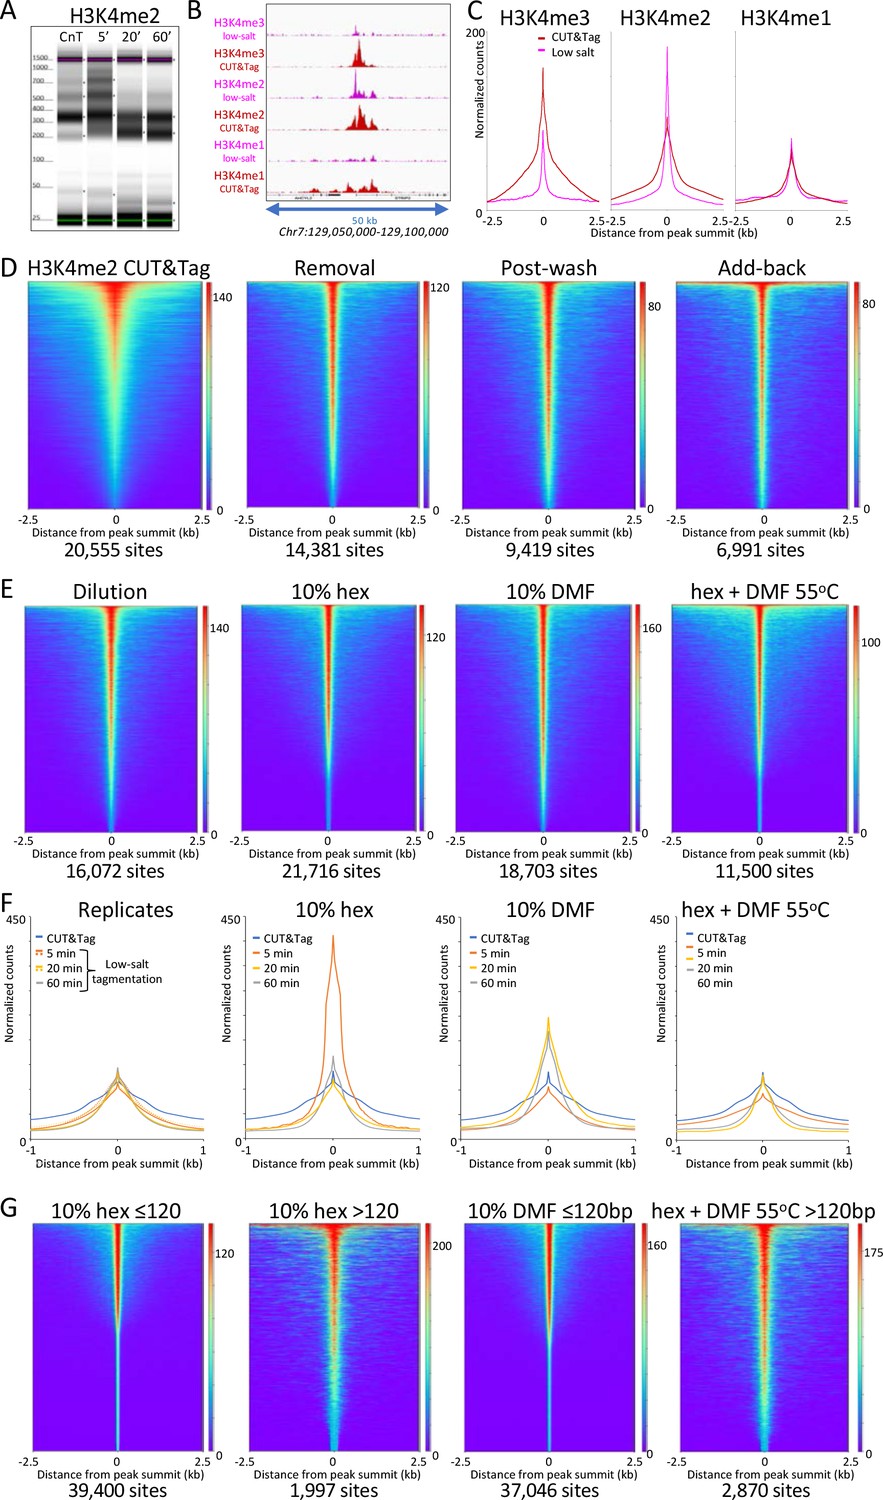
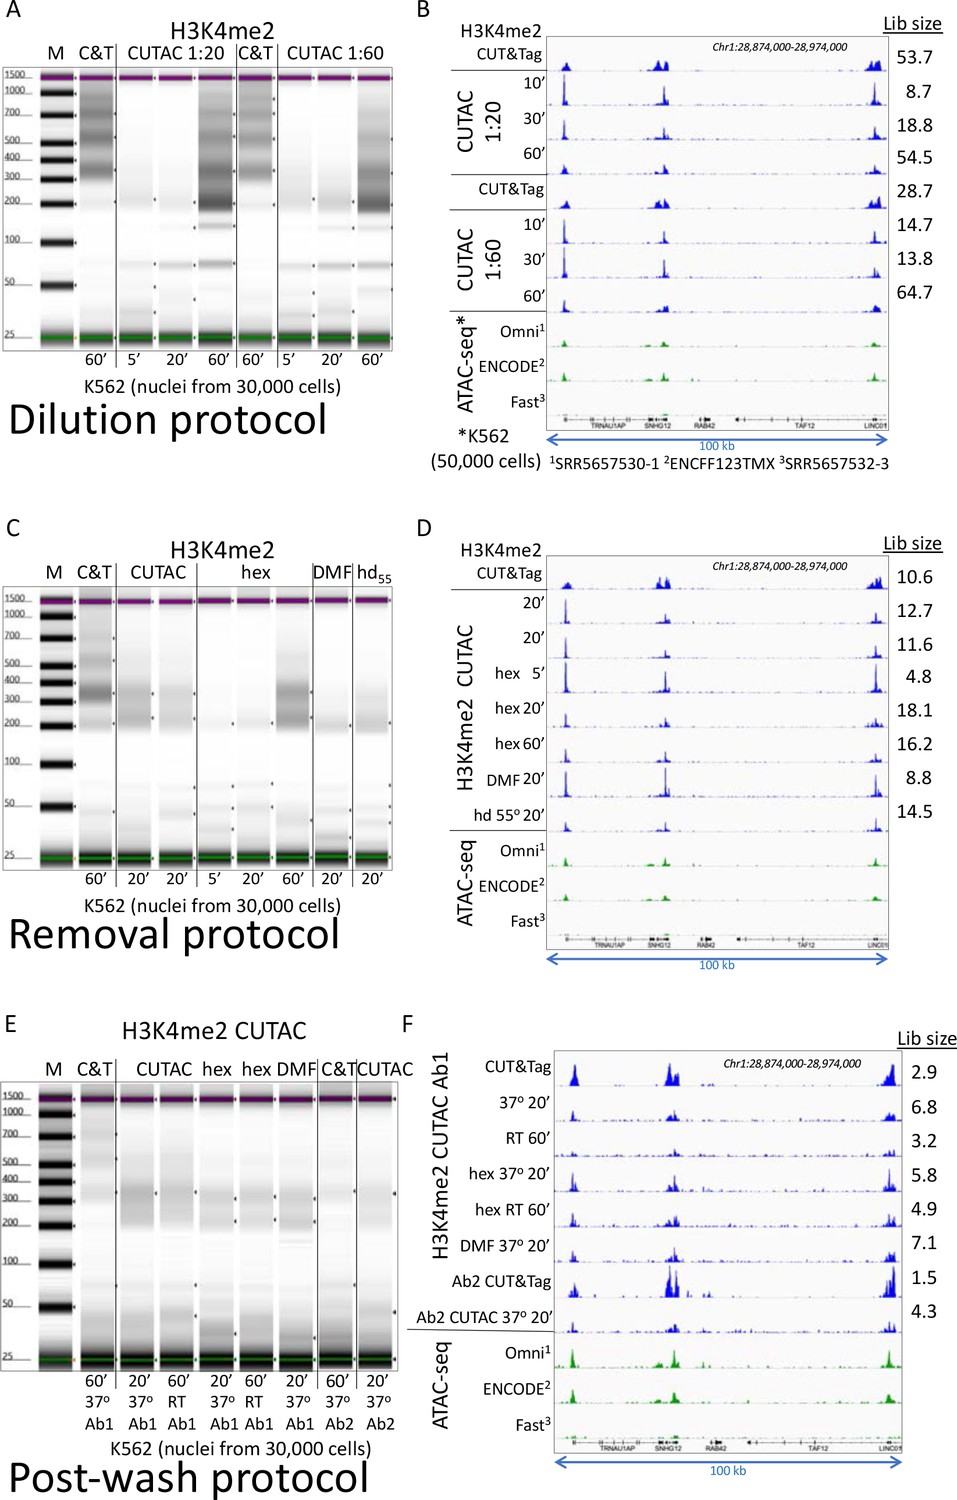
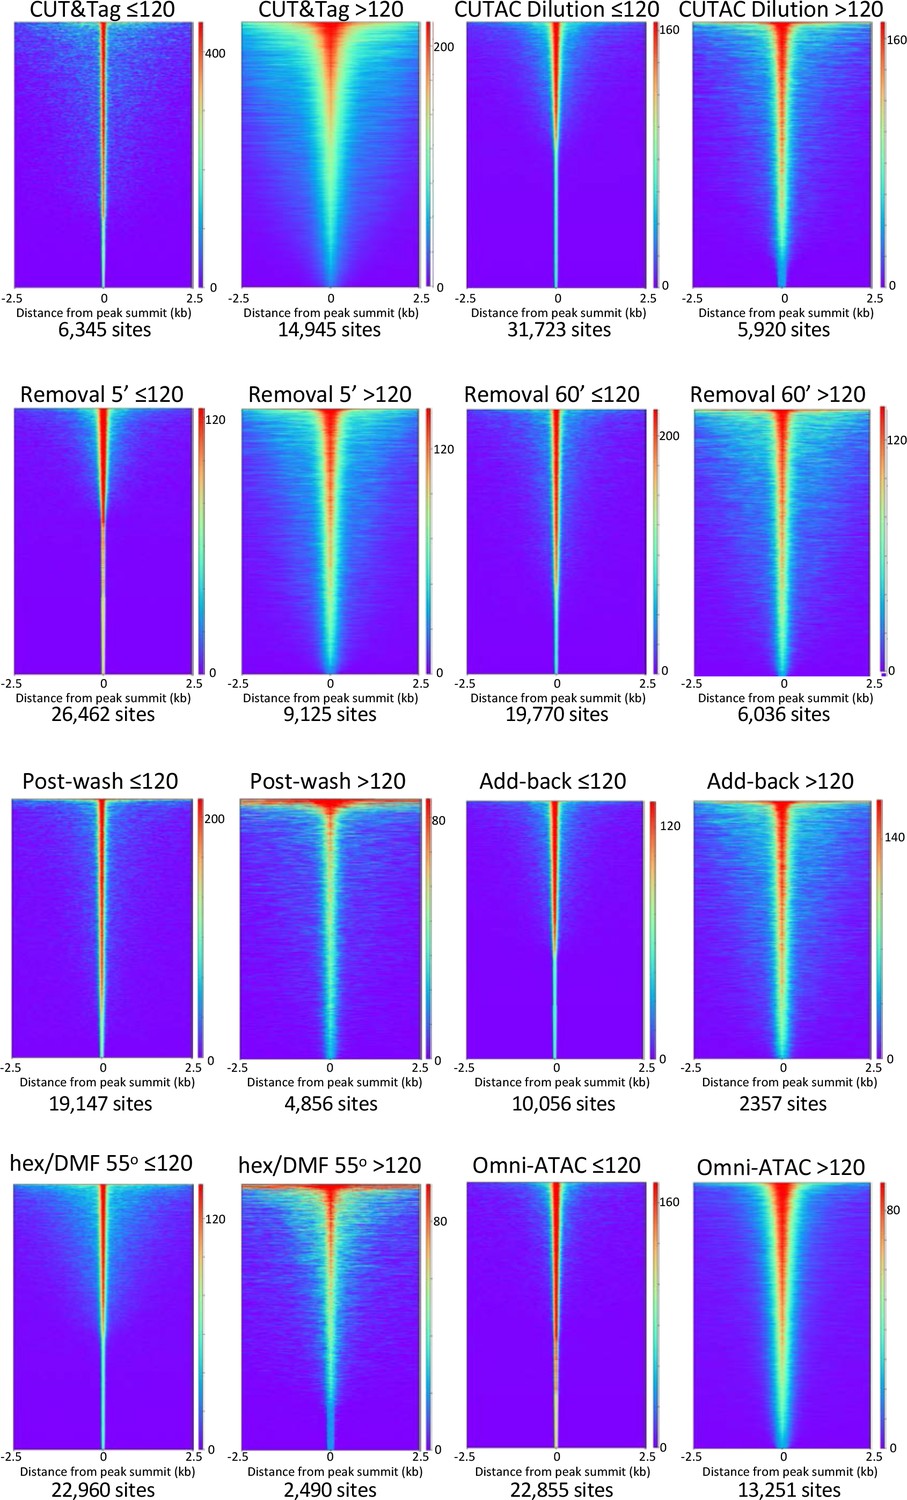
Low-salt tagmentation of H3K4me2/3 CUT&Tag samples sharpen peaks.
(A) Tapestation gel image showing the change in size distribution from standard CUT&Tag (CnT), tagmented in the presence of 300 mM NaCl with low-salt tagmentation using the dilution protocol. (B) Representative tracks showing the shift observed with low-salt dilution tagmentation. (C) Average plots showing the narrowing of peak distributions upon low-salt tagmentation using the dilution protocol. (D) Heatmaps showing narrowing of H3K4me2 peaks after removing pAG-Tn5 (removal), after a stringent wash (post-wash), and after a stringent wash with low-salt tagmentation including a 1% pAG-Tn5 spike-in (Add-back). MACS2 was used to call peaks and heatmaps were ordered by density over the peak summits (sites). (E) Heatmaps showing dilution tagmentation and further narrowing of H3K4me2 peak distributions upon low-salt tagmentation (after removal) for 20 min at 37°C in the presence of 10% 1,6-hexanediol (hex) and 10% dimethylformamide (DMF) or both for 1 hr at 55°C. (F) Average plots showing effects of tagmentation with hex and/or DMF over time of low-salt tagmentation (after removal). (G) Smaller fragments (≤120 bp) dominate NDRs. Comparisons of small (≤120 bp) and large (>120 bp) fragments from CUTAC hex and DMF datasets show narrowing for small fragments around their summits. For each dataset a 3.2 million fragment random sample was split into small and large fragment groups.Removal of large fragments increases the number of peaks called (sites).
Figure 3—figure supplement 1
Three low-salt tagmentation protocols map chromatin hyperaccessibility.
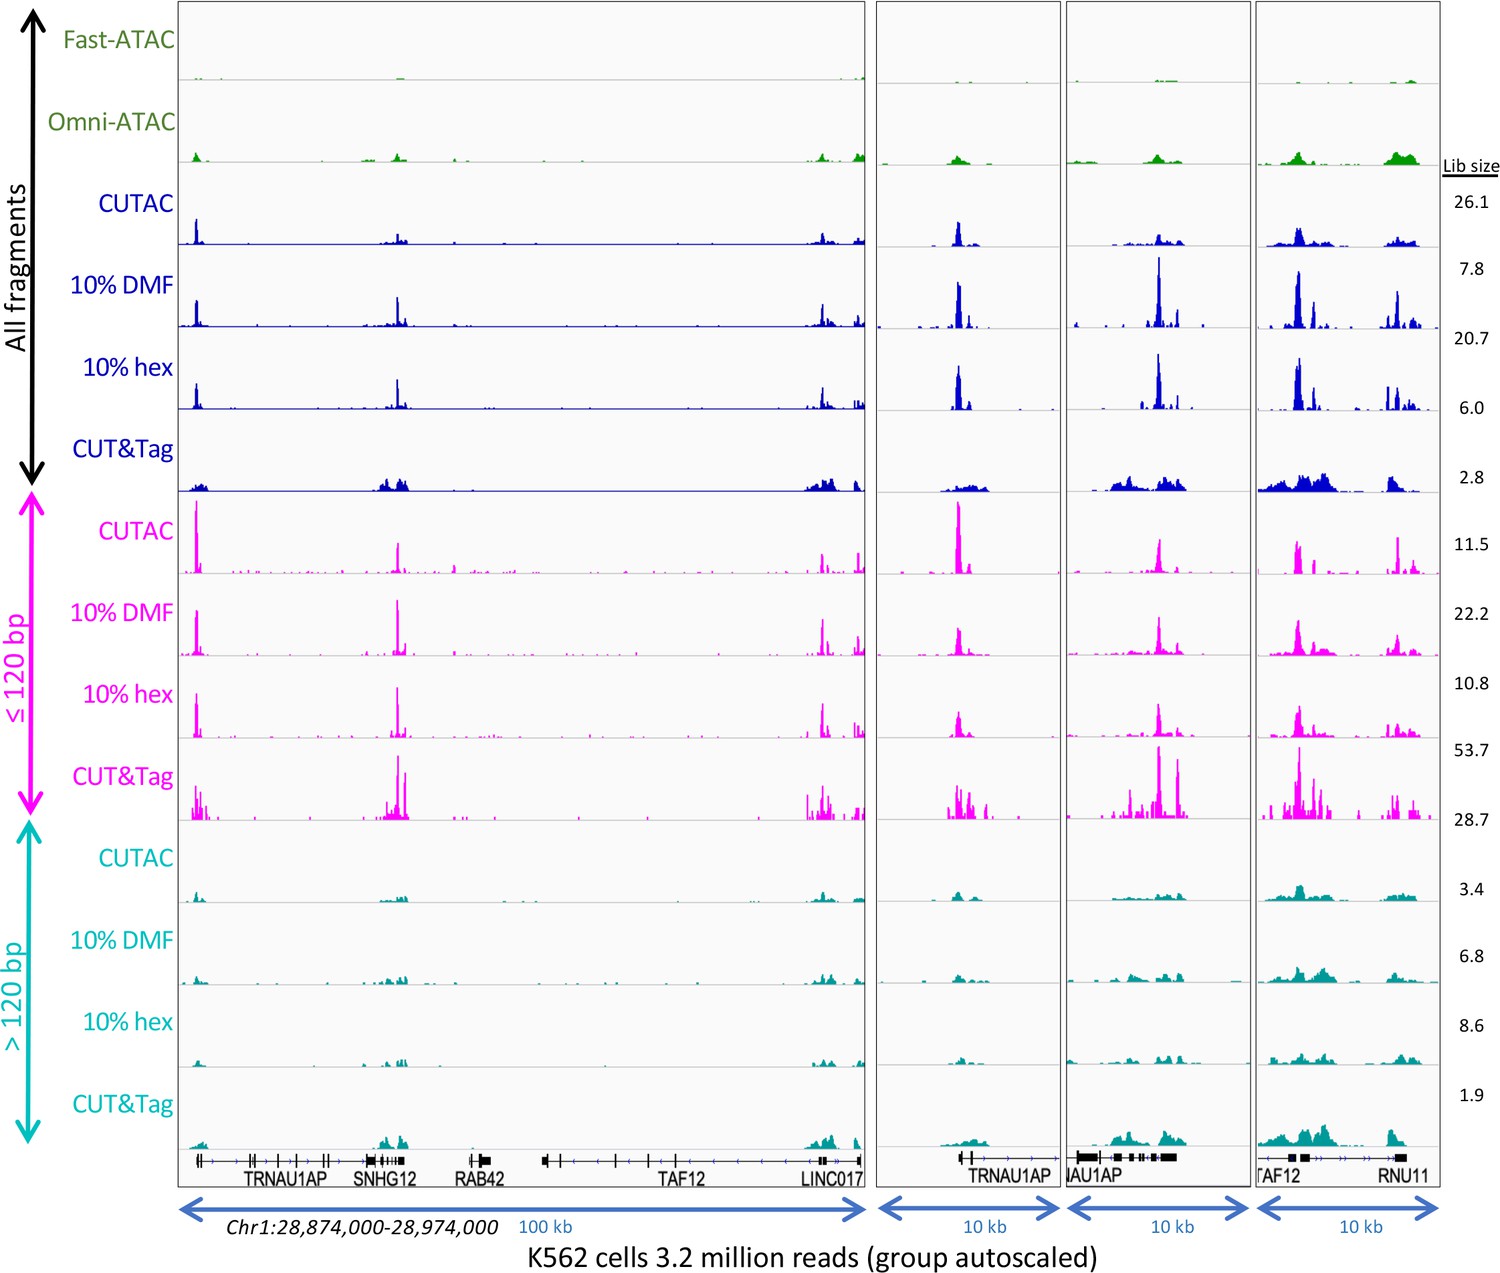
(A-B) H3K4me2 CUT&Tag (CnT) and low-salt tagmentations using the Dilution protocol were performed at 37°C using Epicypher 13–0027 antibody and Epicypher 15–1117 pAG-Tn5 for the times indicated using pAG-Tn5 at either 1:20 (Manufacturer’s recommendation) or 1:60 showing a bigger effect of tagmentation time than amount of pAG-Tn5, and improvement in yield but reduction in signal-to-noise with longer tagmentations. (A) Tapestation gel images showing time of tagmentation and yields based on loading 2 µL of each 20 µL sample and integrating over the 175–1000 bp range. M = markers, C&T = CUT&Tag; (B) Group-autoscaled tracks showing fragment normalized count densities for sequenced libraries using 30,000 cells resolved in (A) and for published ATAC-seq data using 50,000 cells. All datasets were mapped to hg19 and 3.2 million mapped fragments were sampled. A representative 100-kb region was group-autoscaled using IGV. (C–D) Same as A-B using the Removal protocol with no additive (CUTAC), 10% 1,6-hexanediol (hex), 10% N,N-dimethylformamide (DMF) or 10% of both at 55°C (hd55) for the times indicated. (E–F) Same as A-B using the Post-wash protocol with no additive, hex and DMF at 37°C or room temperature (21–22°C) as indicated. Ab1 is Epicypher 13–0027 and Ab2 is Millipore 07–030. Post-wash gel image was adjusted to visualize faint bands, and the lower yields are reflected in reduced estimated library size (Lib size, millions of fragments), calculated by the Mark Duplicates program in Picard tools.
Figure 3—figure supplement 2
Low-salt tagmentation using various antibodies.
Two H3K4me2 antibodies were used: Millipore 07–030 (Mi) and Epicypher 13–0027 (Ep) and provided similar results. CUTAC was done using the Removal protocol and incubated 10 min 37°C.
Figure 3—figure supplement 3
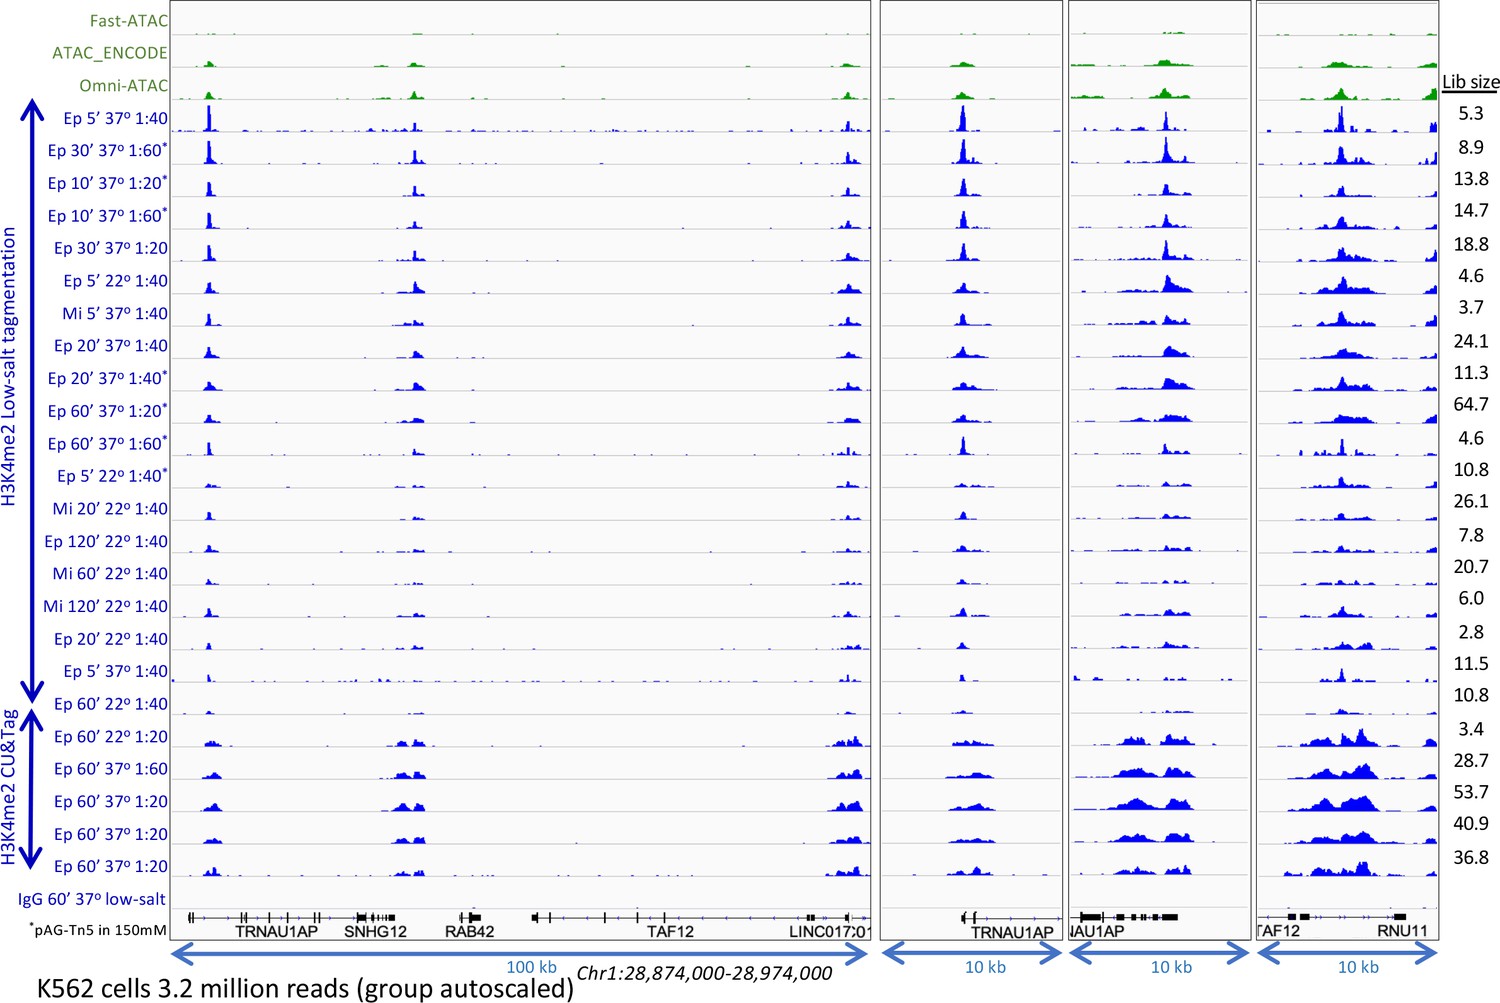
Optimization of low-salt tagmentation conditions.
H3K4me2 CUT&Tag and low-salt tagmentation were performed using either a rabbit monoclonal [Epicypher 13–0027 (Ep)] or a rabbit polyclonal [Millipore 07–030 (Mi)] antibody with pAG-Tn5 (Epicypher 15–1117) at the indicated dilutions. Dilution tagmentation in 2 mM MgCl2 was used at either 22°C or 37°C. Raw paired-end reads were mapped to hg19. A representative 100-kb region is shown (left) and expanded (right) around active promoters and group-autoscaled using IGV. Estimated library size (Lib size) was calculated by the Mark Duplicates program in Picard tools.
Figure 3—figure supplement 4
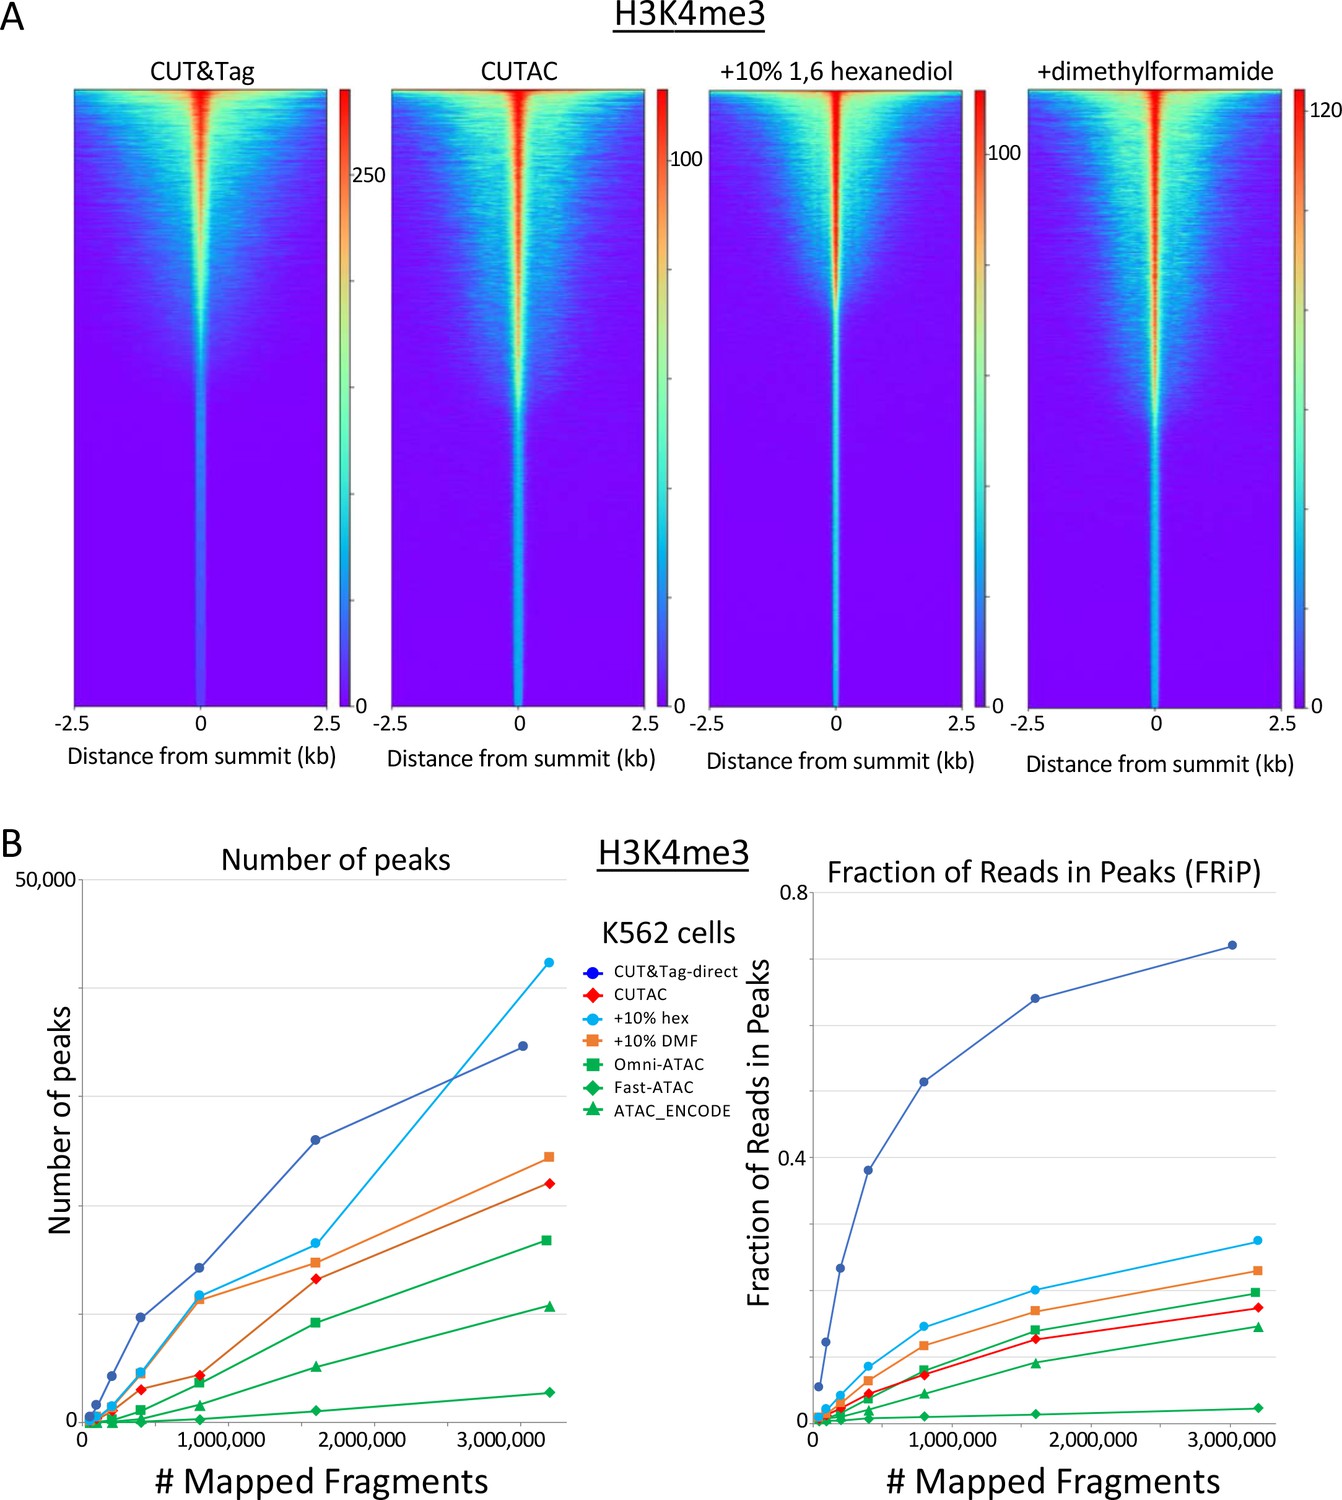
H3K4me3 CUTAC shows peak narrowing and improved peak-calling with addition of 1,6-hexanediol.
(A) Peak narrowing is observed with addition of 10% 1,6-hexanediol although not with N,N-dimethylformamide. (B) Addition of 10% 1,6-hexanediol increases the number of peaks called and improves FRiP, with possible slight improvements seen with addition of N,N-dimethylformamide.
Figure 4 with 2 supplements
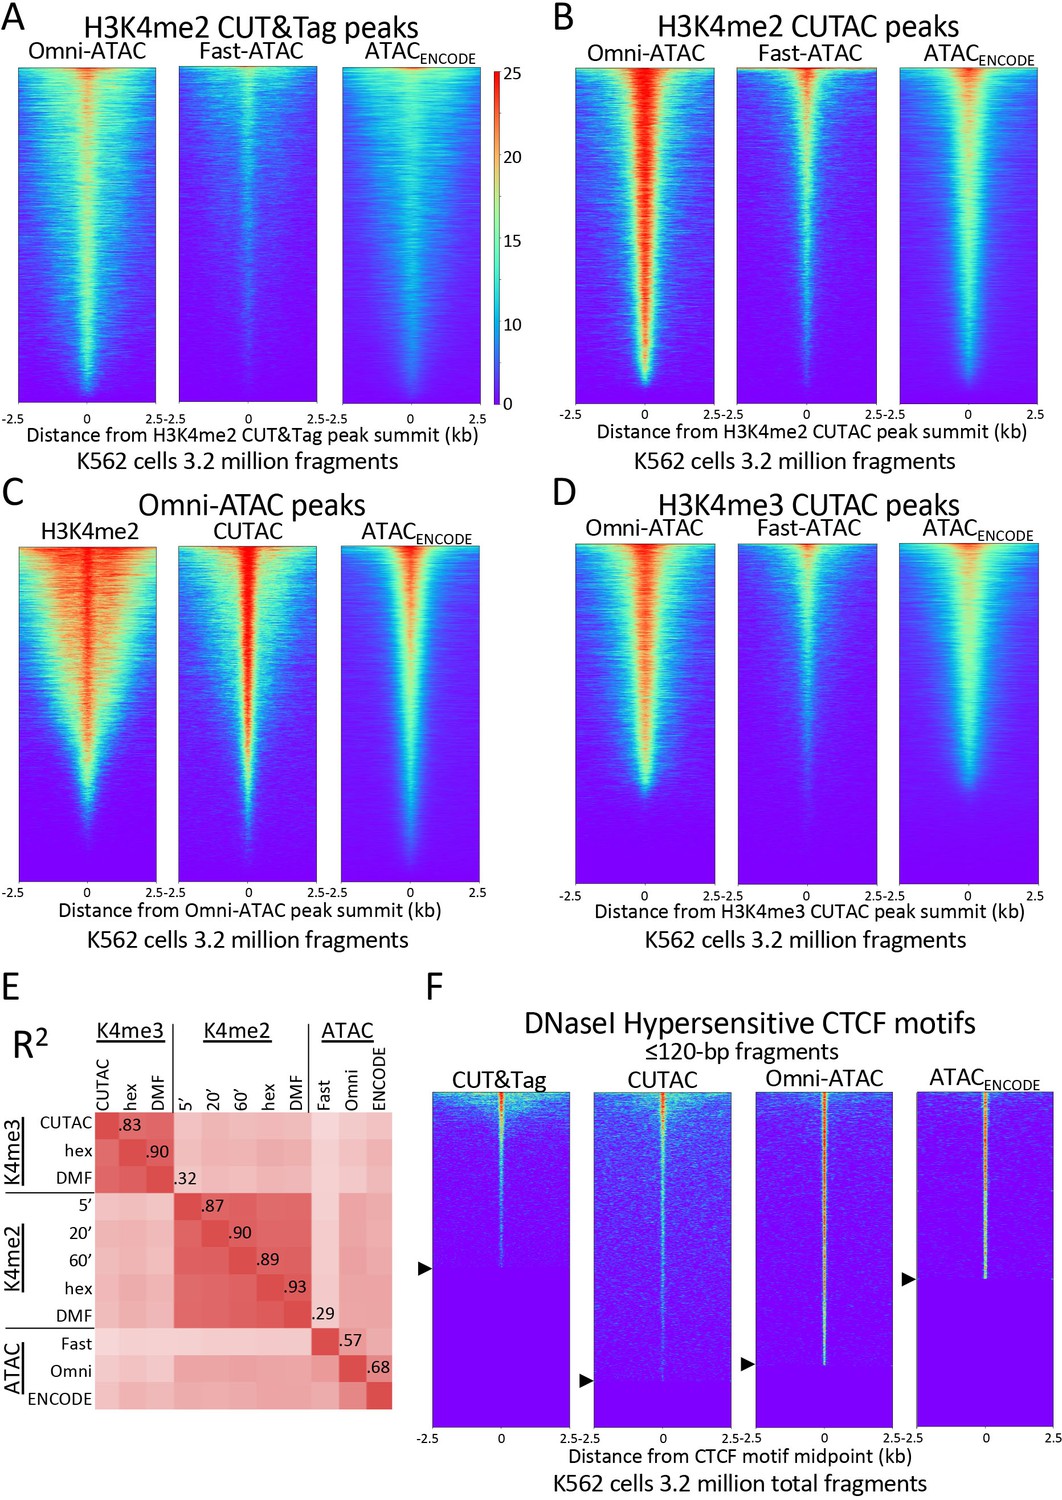
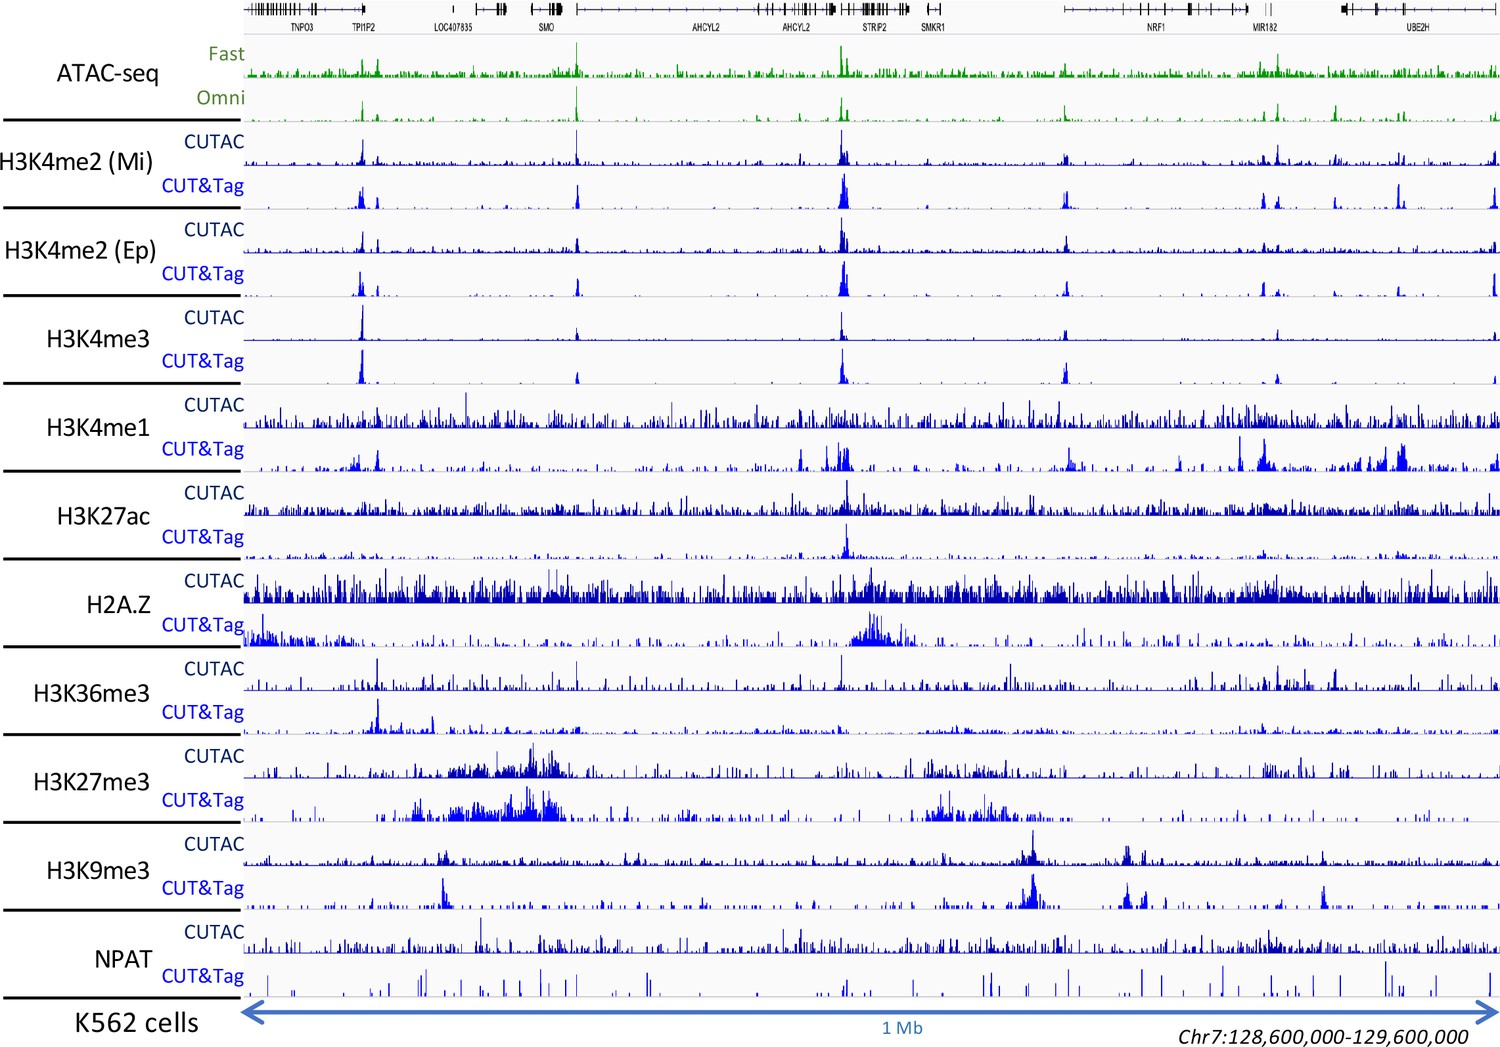
H3K4me2 CUTAC peaks correspond to ATAC-seq and DNaseI hypersensitivity peaks.
(A–D) Heatmaps showing the correspondence between H3K4me2 CUTAC and ATAC-seq sites. Headings over each heatmap denote the source of fragments mapping to the indicated set of MACS2 peak summits, ordered by occupancy over the 5-kb interval centered over each site. CUT&Tag and CUTAC sites are from samples processed in parallel, where CUTAC tagmentation was performed by 20-fold dilution and 20 min 37°C incubation following pAG-Tn5 binding. (E) Correlation matrix of H3K4me2 and H3K4me3 CUTAC and ATAC-seq data for K562 cells. (F) Heatmaps showing ≤120 bp signals for H3K4me2 CUT&Tag, CUTAC and ATAC-seq at CTCF DNaseI hypersensitive sites. Arrowheads on left indicate CTCF site cutoffs.
Figure 4—figure supplement 1
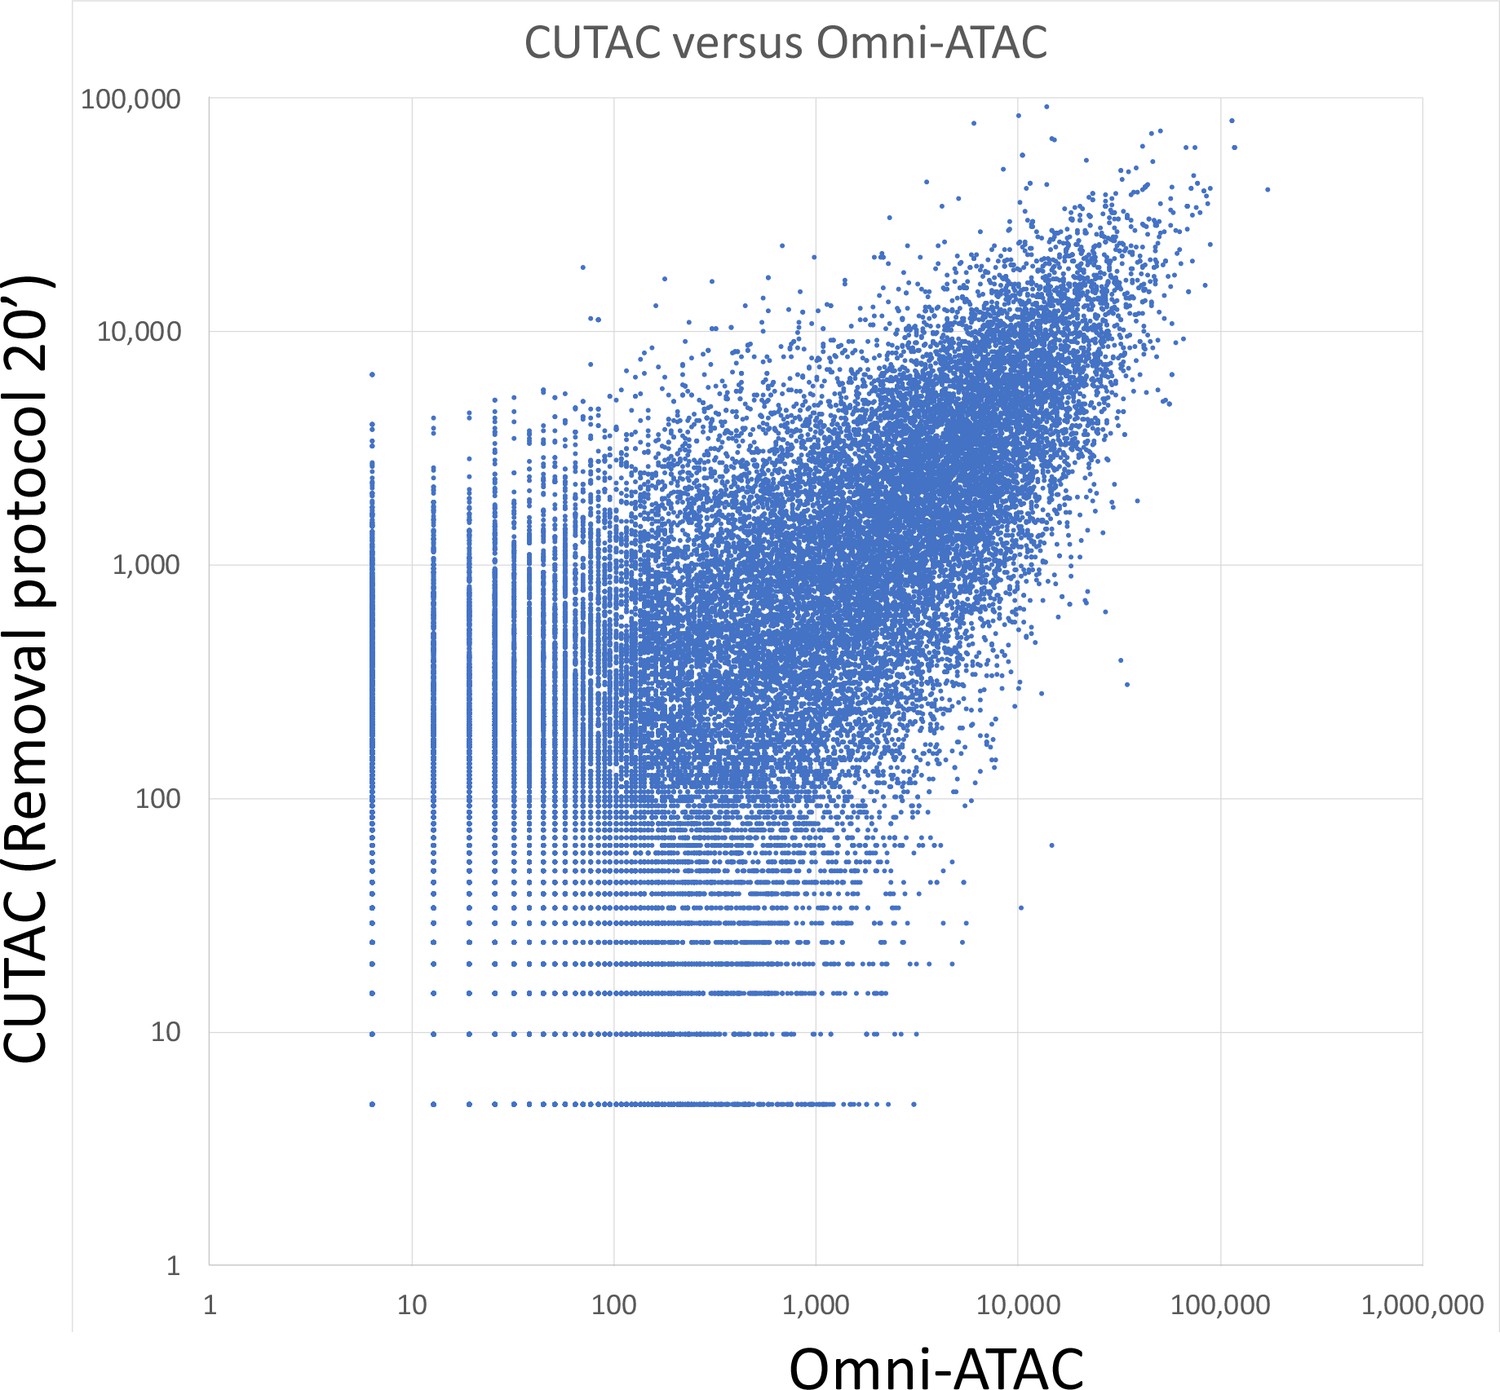
Log10 scatterplot of CUTAC versus Omni-ATAC (R2 = 0.53).
Samples of 3.2 million fragments were pooled as for Figure 4E and MACS2 was used to call peaks. The sums of normalized counts spanning each peak for the two datasets were plotted.
Figure 4—figure supplement 2
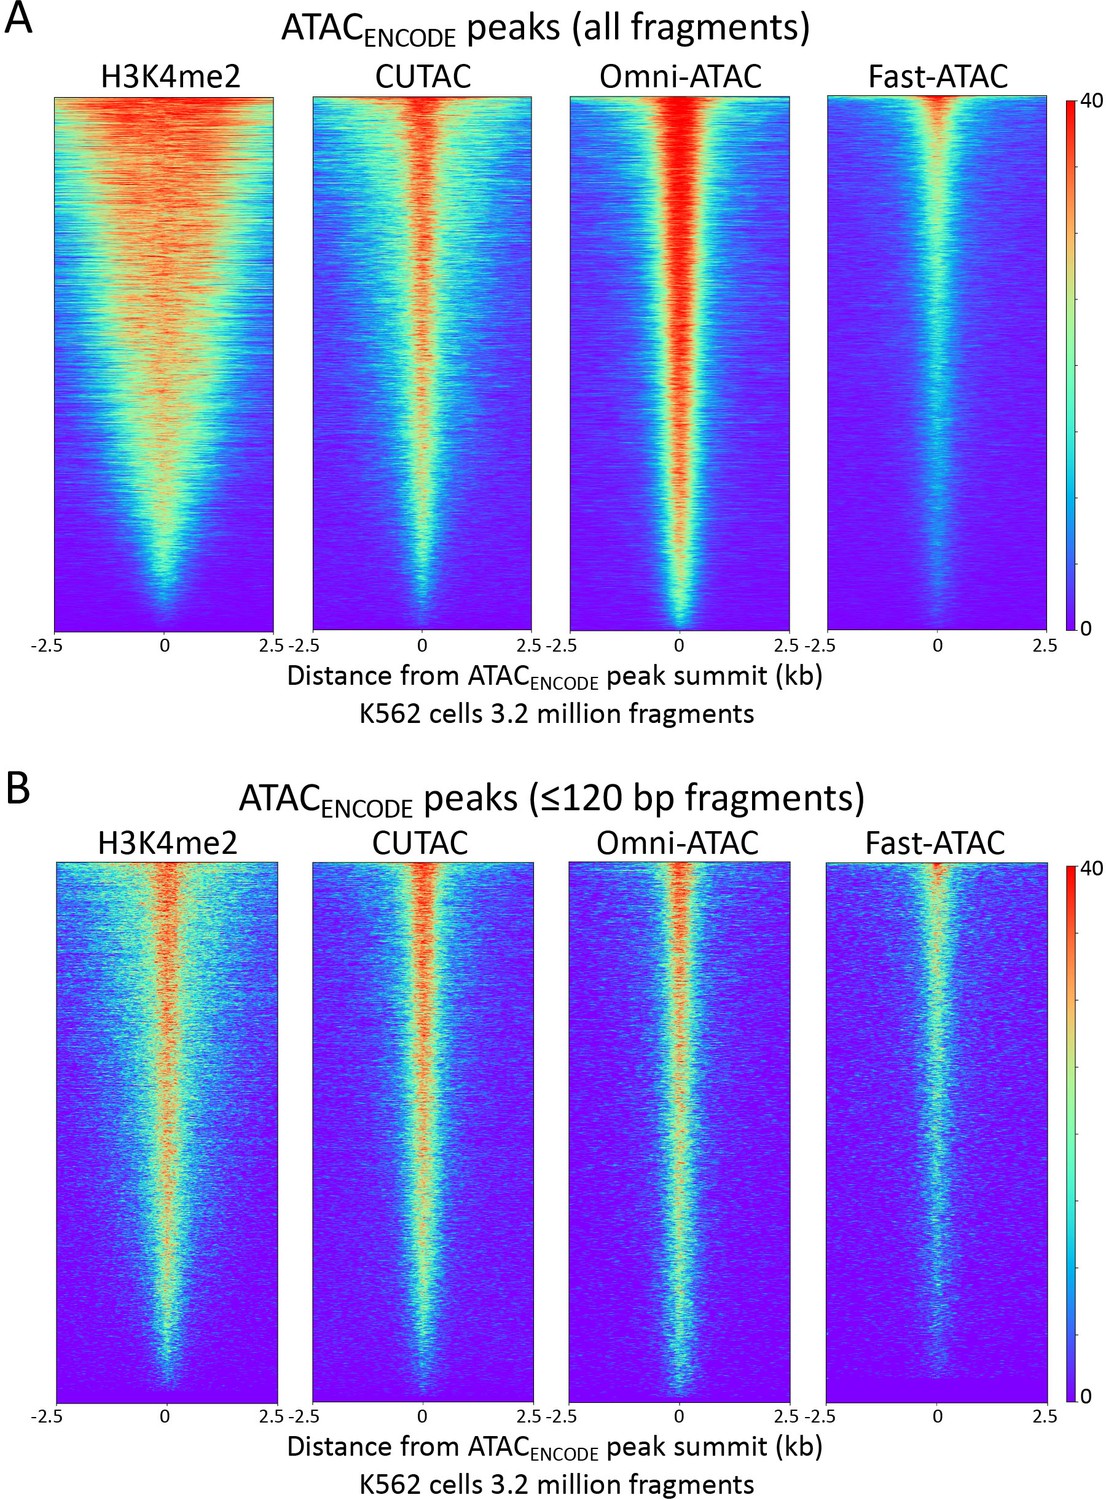
H3K4me2 CUTAC peaks correspond to ATAC-seq peaks.
Heatmaps showing the correspondences between H3K4me2 CUT&Tag, CUTAC and ATAC-seq using ATACENCODE sites. See legend to Figure 4 for details. (A) There is ~50% overlap for MACS2 peaks called from either Omni-ATAC (50.0%) or CUTAC (51.3%) data. (B) Same as (A) for ≤120 bp fragments.
Figure 5 with 3 supplements
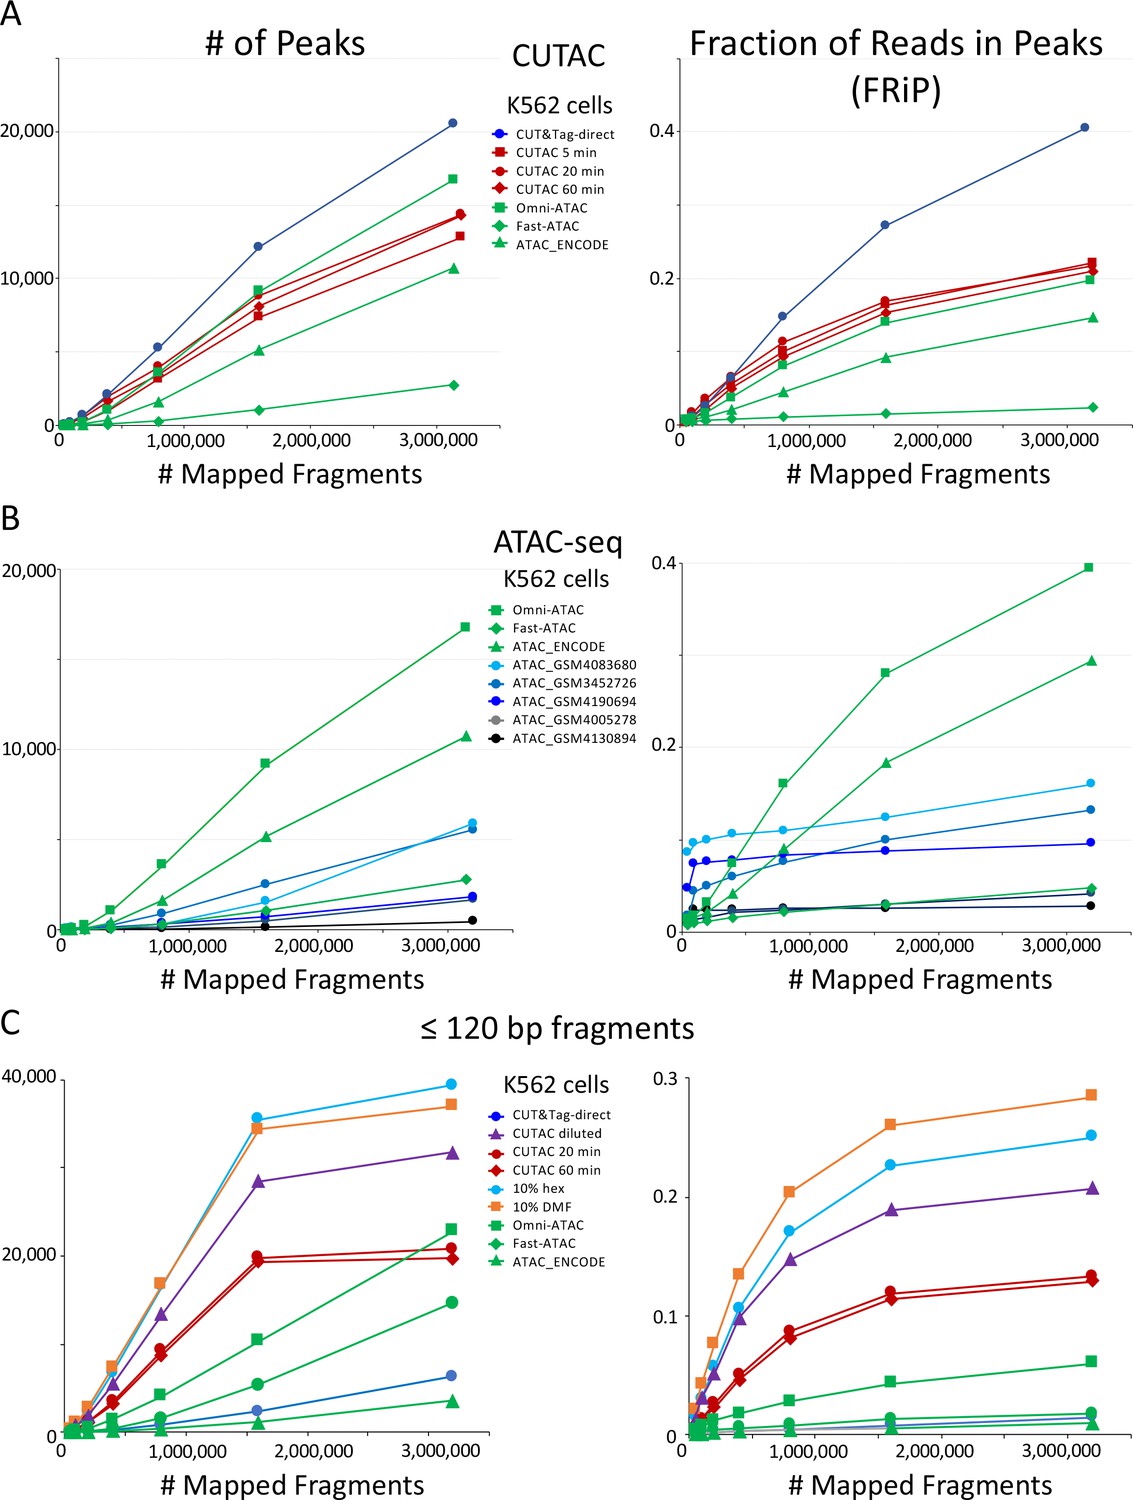
CUTAC data quality is similar to the best available ATAC-seq K562 cell data.
Mapped fragments from the indicated datasets were sampled and peaks were called using MACS2. (A) Number of peaks (left) and fraction of reads in peaks for CUT&Tag (blue), H3K4me2 CUTAC (red) and ATAC-seq (green). Fast-ATAC is an improved version of ATAC-seq that reduces mitochondrial reads (Corces et al., 2016), and Omni-ATAC is an improved version that additionally improves signal-to-noise (Corces et al., 2017). ATAC_ENCODE is the current ENCODE standard (Moore et al., 2020). (B) Five other K562 ATAC-seq datasets from different laboratories were identified in GEO and mapped to hg19. MACS2 was used to call peaks. Peak numbers and FRiP values indicate a wide range of data quality found in recent ATAC-seq datasets. (C) Small H3K4me2 CUTAC fragments improve peak-calling. Hex = 1,6 hexanediol, DMF = N,N-dimethylformamide.
Figure 5—figure supplement 1
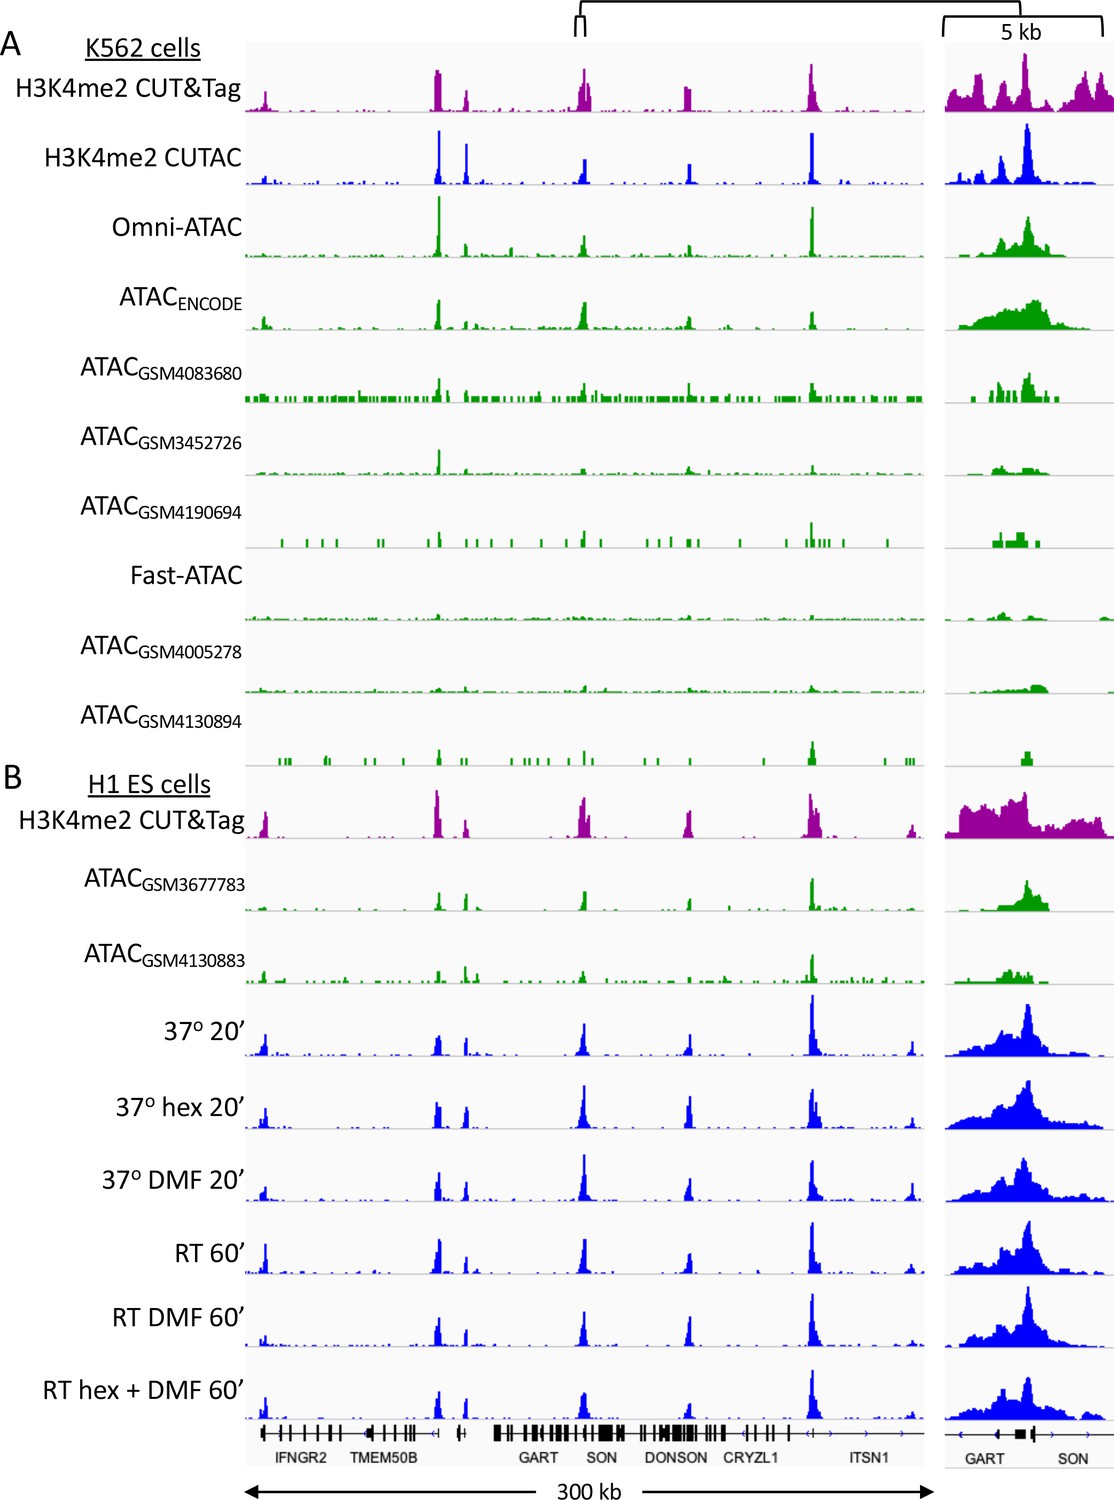
CUTAC data quality is similar to that of the best ATAC-seq datasets.
Tracks over a representative region for K562 datasets listed in Supplementary file 1. Samples are ordered by decreasing FRiP. (A) K562 cells (B) H1 ES cells (Post-wash protocol).
Figure 5—figure supplement 2
Smaller fragments (≤120 bp) dominate NDRs.
See Figure 2E. Additional comparisons of small (≤120 bp) and large (>120 bp) fragments from diverse H3K4me2 CUTAC datasets used in this study show consistent narrowing for small fragments around their summits. For each dataset a 3.2 million fragment random sample was split into small and large fragment groups, MAC2 was used to call peaks and heatmaps were ordered by density over the peak summits (sites).
Figure 5—figure supplement 3
Small CUTAC fragments improve peak resolution.
The representative region shown in Figure 3—figure supplements 3–4 is shown for all 3.2 million fragments and for ≤120 bp and >120 bp groups.
Figure 6 with 1 supplement
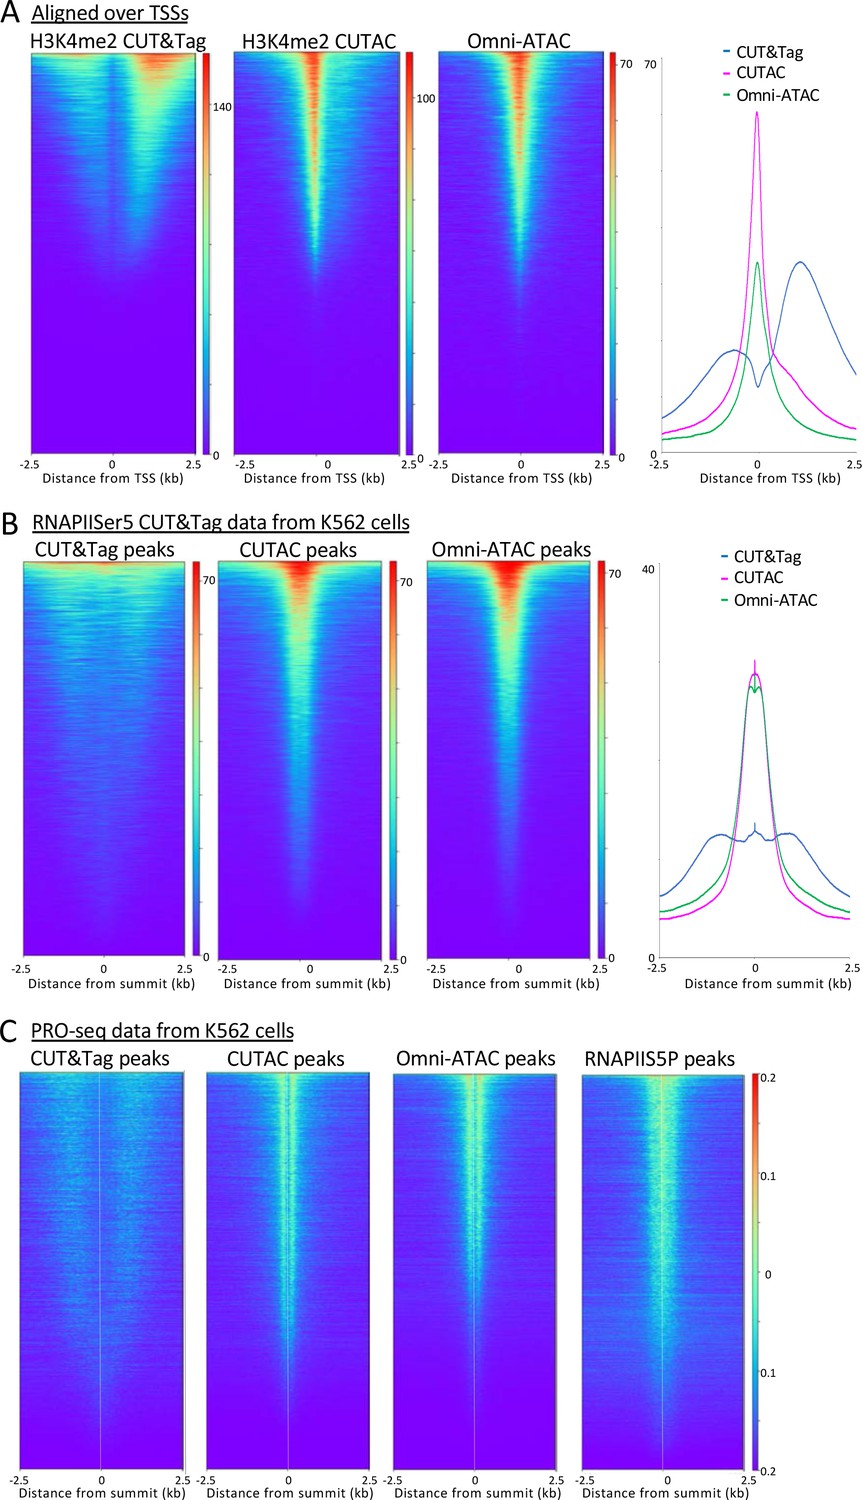
H3K4me2 CUTAC sites are coupled to transcription.
(A) H3K4me2 fragments shift from flanking nucleosomes to the NDR upon low-salt tagmentation, corresponding closely to ATAC-seq sites. (B) The Serine-5 phosphate-marked initiation form of RNAPII is highly abundant over most H3K4me2 CUT&Tag, CUTAC and ATAC-seq peaks. (C) Run-on transcription initiates from most sites corresponding to CUTAC and ATAC-seq peaks. Both plus and minus strand PRO-seq datasets downloaded from GEO (GSM3452725) were pooled and aligned over peaks called using 3.2 million fragments sampled from H3K4me2 CUT&Tag, CUTAC and Omni-ATAC datasets, and also from pooled CUT&Tag replicate datasets for K562 RNA Polymerase II Serine-5 phosphate.
Figure 6—figure supplement 1
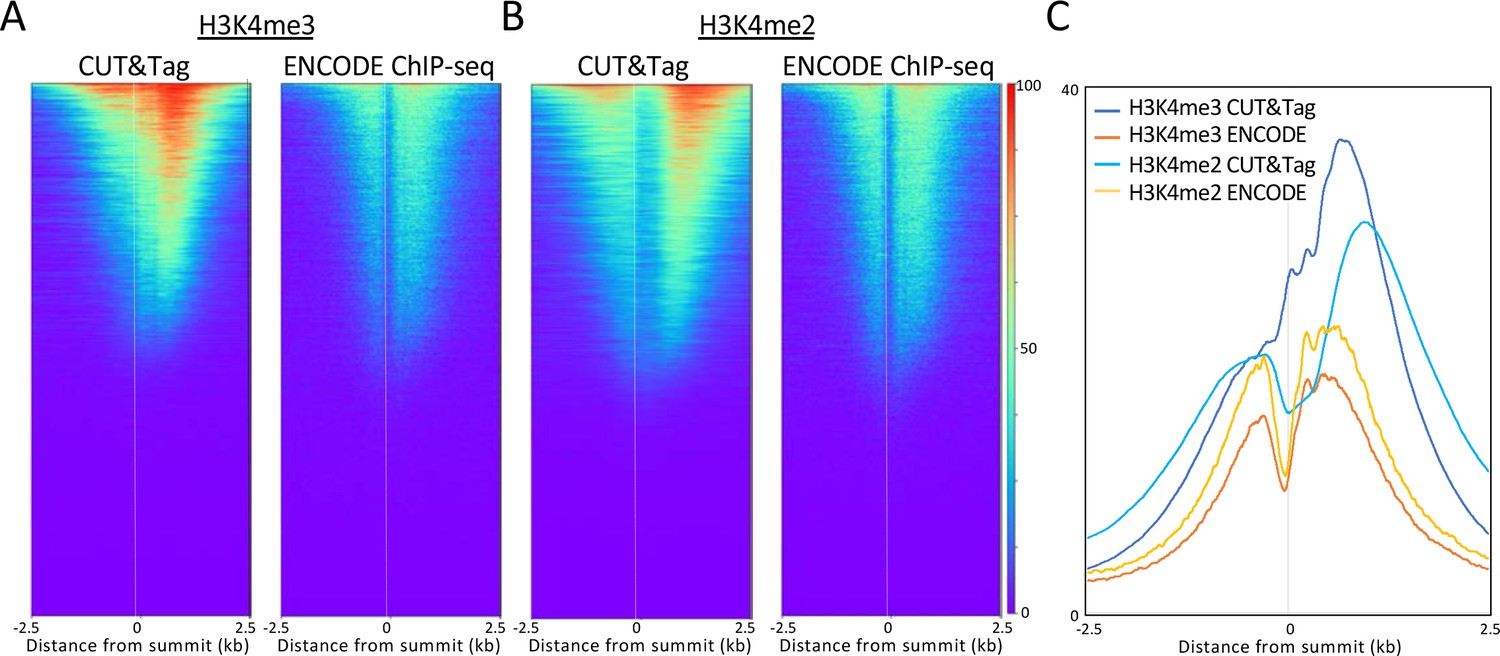
ChIP-seq confirms CUT&Tag localization for H3K4me2/3 flanking active promoters.
(A) Comparison of H3K4me3 CUT&Tag to ENCODE ChIP-seq. (B) Same as (A) for H3K4me2. (C) CUT&Tag shows that H3K4me2 is centered farther from the NDR than is H3K4me3.
Tables
Table 1
CUTAC data quality is similar to that of the best ATAC-seq datasets.
Human K562 and H1 ES cell ATAC-seq datasets were downloaded from GEO, and Bowtie2 was used to map fragments to hg19. A sample of 3.2 million mapped fragments without Chr M was used for peak-calling by MACS2 to calculate FRiP values. Year of submission to GEO or SRA databanks is shown. % Chr M is percent of hg19-mapped fragments mapped to mitochondrial DNA.
| Sample | Source | Year | Read_type | Raw_reads | hg19-mapped | % Chr M | # Peaks | FRiP % |
|---|---|---|---|---|---|---|---|---|
| CUT&Tag-direct H1 | This study | 2020 | PE25 | 4,832,184 | 4,525,525 | 0.2 | 23,051 | 53 |
| CUT&Tag-direct K562 | This study | 2020 | PE25 | 3,252,490 | 3,144,253 | 2 | 20,555 | 41 |
| CUTAC H1 | This study | 2020 | PE25 | 2,770,901 | 2,734,092 | 1 | 16,848 | 25 |
| CUTAC K562 | This study | 2020 | PE25 | 5,973,063 | 4,785,931 | 3 | 14,381 | 22 |
| Omni-ATAC K562 SRR5657531-2 | Stanford | 2017 | PE75 | 4,407,706 | 3,181,110 | 13 | 16,737 | 20 |
| ATAC H1 GSM3677783 | Fred Hutch | 2019 | PE25 | 4,504,812 | 4,157,800 | 13 | 19,517 | 16 |
| ATAC K562 ENCFF123TMX | Stanford (ENCODE) | 2020 | PE100 | 43,473,266 | 23,942,024 | 9 | 14,369 | 11 |
| ATAC K562 GSM4083680 | U. Texas-Southwestern | 2019 | SE74 | 29,193,873 | 17,612,609 | 43 | 5894 | 8 |
| ATAC K562 GSM3452726 | Cornell U. | 2018 | PE36 | 86,907,625 | 83,038,866 | 24 | 1555 | 6.2 |
| ATAC K562 GSM4190694 | Keio U. | 2020 | PE60 | 15,363,855 | 14,067,803 | 79 | 1837 | 4.8 |
| ATAC H1 GSM4130883 | Stanford | 2020 | PE100 | 43,784,188 | 19,562,219 | 60 | 4289 | 3.2 |
| Fast-ATAC K562 SRR5657533-4 | Stanford | 2017 | PE75 | 6,702,558 | 4,677,843 | 8 | 2780 | 2.4 |
| ATAC K562 GSM4005278 | Penn State Hershey | 2020 | PE100 | 12,772,997 | 8,541,005 | 25 | 1691 | 2.1 |
| ATAC K562 GSM4130894 | Stanford | 2020 | PE100 | 45,122,834 | 19,021,462 | 86 | 449 | 1.4 |
Key resources table
| Reagent type (species) or resource | Designation | Source or reference | Identifiers | Additional information |
|---|---|---|---|---|
| Cell line (Human) | K562 | ATCC | Cat#CCL-243; RRID:CVCL_0004 | |
| Cell line (Human) | H1 embryonic stem cells | WiCell | Cat#WA01-lot#WB35186; RRID:CVCL_9771 | |
| Antibody | rabbit polyclonal anti-NPAT | Thermo Fisher Scientific | PA5-66839; RRID:AB_2663287 | Concentration: 1:100 |
| Antibody | guinea pig polyclonal anti-rabbit IgG | Antibodies Online | Cat#ABIN101961; RRID:AB_10775589 | Concentration: 1:100 |
| Antibody | rabbit polyclonal anti-mouse IgG | Abcam | Cat#46540; RRID:AB_2614925 | Concentration: 1:100 |
| Antibody | rabbit monoclonal anti-H3K27me3 | Cell Signaling | Cat#9733; RRID:AB_2616029 | Concentration: 1:100 |
| Antibody | rabbit polyclonal anti-H3K4me2 | Upstate | Cat#07–730- lot#3229364; RRID:AB_11213050 | Concentration: 1:100 |
| Antibody | rabbit monoclonal anti-H3K27ac | Millipore | Cat#MABE647 | Concentration: 1:100 |
| Antibody | rabbit polyclonal anti-H3K4me3 | Active Motif | Cat#39159; RRID:AB_2561020 | Concentration: 1:100 |
| Antibody | rabbit monoclonal anti-H3K4me2 | Epicypher | Cat#13–0027 | Concentration: 1:100 |
| Antibody | rabbit monoclonal anti-H3K4me1 | Epicypher | Cat#13–0026 | Concentration: 1:100 |
| Antibody | rabbit polyclonal anti-H3K9me3 | Abcam | Cat#ab8898; RRID:AB_306848 | Concentration: 1:100 |
| Antibody | rabbit monoclonal anti-H3K36me3 | Epicypher | Cat#13–0031 | Concentration: 1:100 |
| Peptide, recombinant protein | Protein A-Tn5 | Henikoff lab | doi:10.17504/protocols.io.8yrhxv6 | Concentration: 1:200 |
| Peptide, recombinant protein | Protein AG-Tn5 | Epicypher | 1 Cat#5–1117 | Concentration: 1:20-1:60 |
Additional files
-
Supplementary file 1
MSExcel spreadsheets of metadata information for each figure panel and track (Tab 1), for each dataset in GEO (Tab 2), and for other GEO/SRA database files (Tab 3) used in the study.
- https://cdn.elifesciences.org/articles/63274/elife-63274-supp1-v2.xlsx
-
Transparent reporting form
- https://cdn.elifesciences.org/articles/63274/elife-63274-transrepform-v2.docx
Download links
A two-part list of links to download the article, or parts of the article, in various formats.
Downloads (link to download the article as PDF)
Open citations (links to open the citations from this article in various online reference manager services)
Cite this article (links to download the citations from this article in formats compatible with various reference manager tools)
Efficient chromatin accessibility mapping in situ by nucleosome-tethered tagmentation
eLife 9:e63274.
https://doi.org/10.7554/eLife.63274


