Membrane transporter dimerization driven by differential lipid solvation energetics of dissociated and associated states
- Biochemistry and Molecular Biophysics, Washington University School of Medicine, United States
- Theoretical Molecular Biophysics Laboratory, National Heart, Lung and Blood Institute, National Institutes of Health, United States
- NIST Center for Neutron Research, National Institute for Standards and Technology, United States
- Center for Neutron Science, Chemical and Biomolecular Engineering, University of Delaware, United States
- Molecular Physiology and Biophysics, Carver College of Medicine, The University of Iowa, United States
Figures
Figure 1
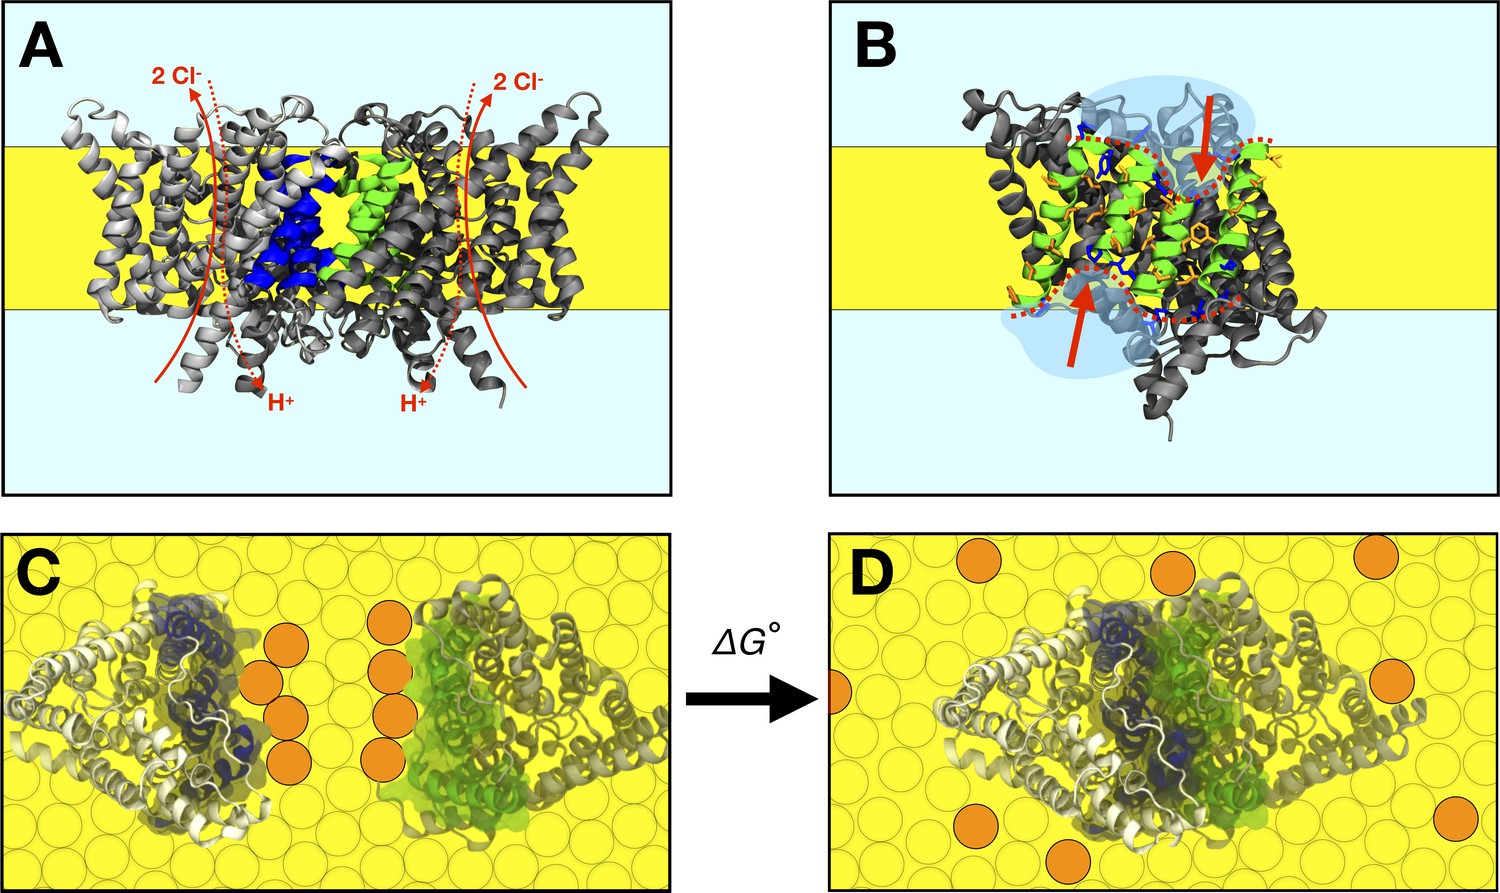
The CLC-ec1 dimerization reaction in lipid bilayers.
(A) Side view of the CLC-ec1 homodimer in the lipid bilayer. Two subunits are shown in silver and gray, with helices forming the dimerization interface highlighted blue and green. The hydrophobic core of the membrane is depicted in yellow. Approximate pathways for Cl- and H+ transport is shown with red arrows. (B) The dimerization interface of the monomer. The four helices forming the interface (Q, P, H, and I) are shown in green, with non-polar side-chains in orange and interfacial polar/charged side-chains in blue. The red dotted line and arrows highlights the shorter H and P helices at the center of the interface. (C,D) Top view of dissociated and associated end-points of the CLC-ec1 dimerization reaction, with the free energy of dimerization defined as , defined relative to the 1 subunit/lipid mole fraction standard state. Circles represent lipids, with orange circles highlighting an example set of lipids that exchange between the dimerization interface and the bulk upon dimerization.
Figure 2 with 3 supplements

Membrane morphology around CLC-ec1 monomer and dimer from molecular dynamics simulations.
Results are shown for 2:1 POPE/POPG membranes, averaging eight independent trajectories of ≈ 7.5 μs each for the monomer, and 10 trajectories of ≈ 10 μs each for the dimer (Figure 2—source data 1). All simulations are based on the coarse-grained MARTINI force field. (A, B) 3D density maps for the ester layers (red) or acyl chains (blue) in the vicinity (≤10 Å) of the protein (white surface), for (A) the monomer and (B) the dimer. In (A), three different views of the lipid first-shell are depicted; the four helices at dimerization interface are highlighted (yellow). (C–E) Spatially resolved grid-based analysis of different descriptors of the lipid bilayer structure. See Figure 2—figure supplement 2 for details. (C) 2D maps of the local bilayer thickness across the simulation system. The proteins occupy the central area (white mask). Note monomer and dimer are oriented differently relative to the periodic boundaries of the simulation system. To facilitate this comparison, an axis perpendicular to the dimerization interface (white arrow) is drawn in both cases. (D) Variation in the mean lipid tilt-angle across the membrane plane, relative to the bilayer perpendicular, for both the outer and inner leaflets. (E) Time-averages of the instantaneous 3D conformation of lipid molecules residing at different positions across the membrane plane. Acyl chains (gray scale), ester linkages (red), and headgroups (orange/purple) are shown as spheres. Note perfectly isotropic dynamics, when time-averaged, results in a linear structure for the entire molecule, perpendicular to the membrane mid-plane, and with both acyl chains superposed. These structures are therefore non-physical, but they reveal the mean tilt of the lipid molecules across the membrane as well as the degree of contacts between leaflets. Data is shown for the monomer only (transparent surface), viewed from two sides. The four helices at the dimerization interface are highlighted (yellow). See Figure 2—figure supplements 1–3, Figure 2—source data 1 for additional details.
-
Figure 2—source data 1
CGMD simulation specifications.
A total of 0.7 ms total simulation time was carried out for this study.
- https://cdn.elifesciences.org/articles/63288/elife-63288-fig2-data1-v2.docx
-
Figure 2—source data 2
Simulation files for CLC-ec1 in 2:1 POPE:POPG.
This folder contains initial/final configurations (PDB files) for GROMACS coarse-grained simulations of CLC-ec1 monomers and dimers in mixtures of 2:1 POPE/POPG alongside the corresponding parameter files (MDP/TPR format).
- https://cdn.elifesciences.org/articles/63288/elife-63288-fig2-data2-v2.zip
Figure 2—figure supplement 1
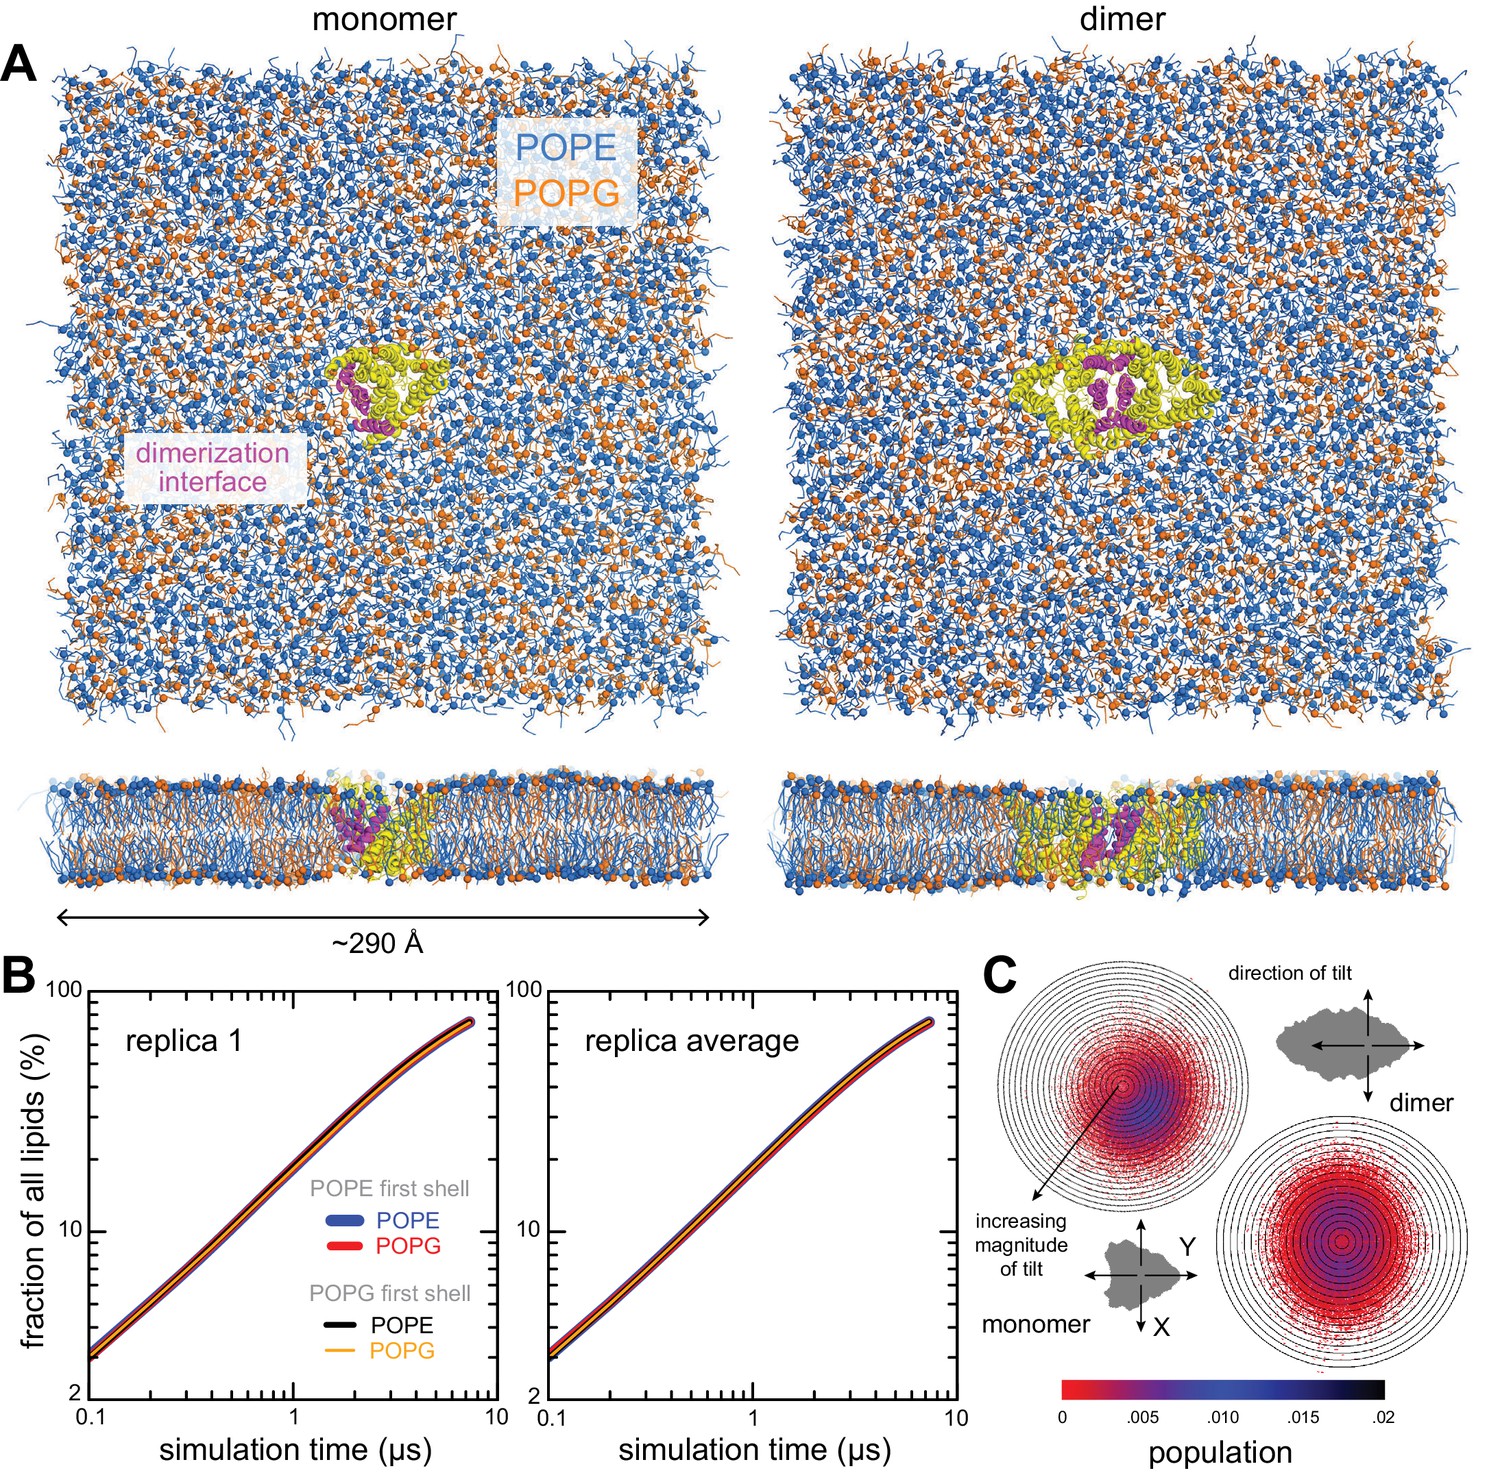
Simulation systems and quantification of configurational lipid and protein sampling.
(A) Simulation systems for the CLC-ec1 monomer (left) and dimer (right) in 2:1 POPE (blue)/POPG (orange) lipid bilayer. The protein is shown as yellow helices, with the dimerization interface highlighted in magenta. The systems include a total of 2784 and 2773 lipid molecules, respectively. (B) Evaluation of the degree of lipid mixing for the monomer system. For any lipid i, we quantify, as a function of simulation time, the percentage of all other lipids j in the same leaflet that reside for at least three ns in a 10 Å shell around lipid i. Results are shown for a single trajectory (left), and for the average of all trajectories (right). At any given time, the number of lipids j in these shells is, on average, about 6. (C) Evaluation of the protein tilt, relative to the membrane perpendicular (Z-axis). Data for the isolated monomer is compared with the monomer in the context of the dimer. The polar plots describe the magnitude of the tilt in the radial coordinate, contoured in 1° increments; and the XY direction of tilt in the angular coordinate, as indicated. These descriptors were evaluated as a function of simulation time for all trajectories and represented here as probability distributions (color bar). The direction and magnitude of tilt derive from evaluation of a vector connecting two centers within the protein, C1 and C2, each defined by a set of backbone beads (324, 327, 332, 361, 370, 413 for C1; and residues 202, 267, 272, 363, 402, 446 for C2), identical for the monomer and dimer systems. In the context of the dimer, the monomer fluctuates around the membrane perpendicular, as can be expected for a symmetric dimer, preferring a tilt of ≈ 4°; when isolated, the preferred tilt increases slightly, ≈ 7°, and the fluctuations are no longer centered on the membrane perpendicular. In both cases, the probability distributions appear to be fully defined, indicating near complete sampling of the accessible orientation space.
Figure 2—figure supplement 2
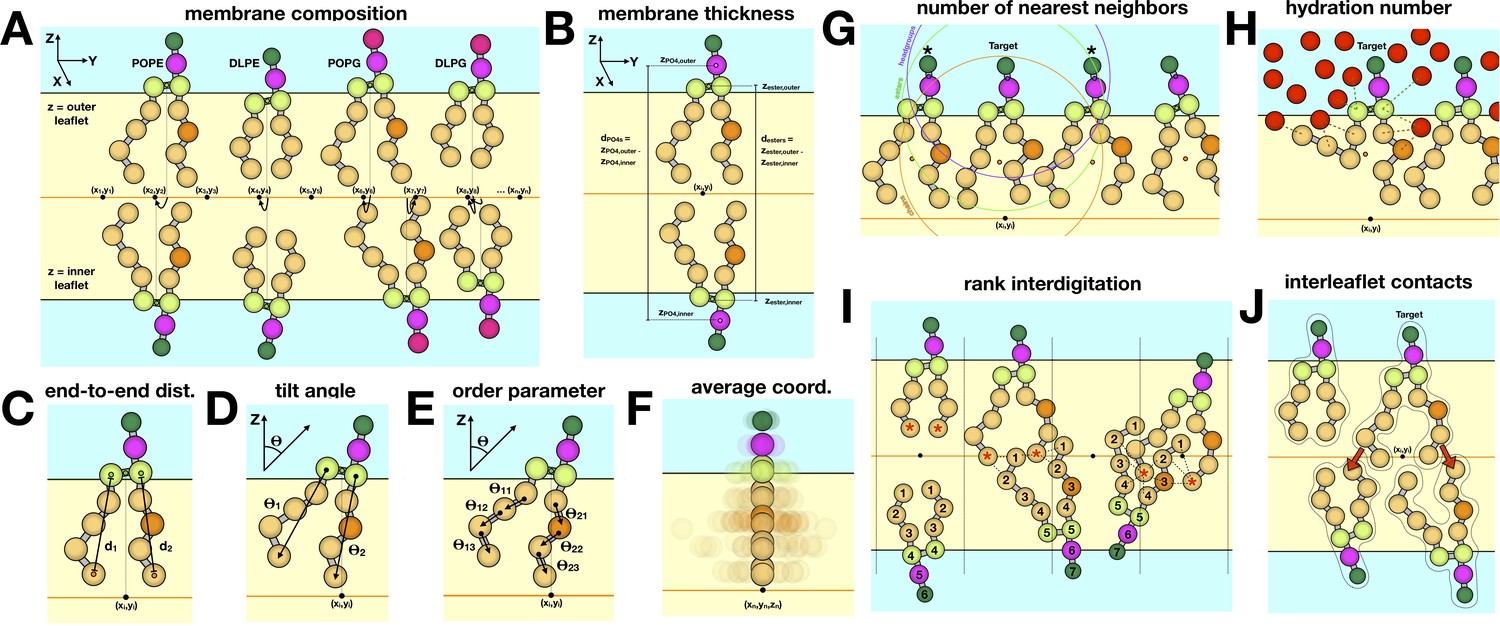
Schematic of different descriptors of lipid-bilayer structure.
(A) Composition of membranes simulated in this study. All simulations maintain a 2:1 PE/PG ratio for the lipid headgroups, while varying the DL/PO acyl chain composition. The coarse-grained particles or beads used to represent each lipid molecule are shown as spheres. Analysis is typically performed for each leaflet (outer vs. inner) unless otherwise noted. For each simulation snapshot and each trajectory, a one-to-one assignment of each lipid molecule (or specific groups therein) to a point in a two-dimensional grid on the membrane XY plane is made. For each lipid, the descriptor of interest is calculated on the basis of the 3D coordinates of the system in that snapshot/trajectory, and assigned to the corresponding grid-point. Finally, all values mapped onto each grid point are averaged for all snapshots/trajectories, and represented as a color-coded 2D map. (B) To calculate the membrane thickness, the mean Z-coordinate of either the phosphate or the ester layer is calculated for each leaflet, and mapped onto 2D grids as mentioned above; the mean Z-coordinate map for the inner leaflet is then subtracted from that of the outer leaflet, in the regions of the grid where both are defined. (C) Acyl chain end-to-end distance, dester-Cn, where n represents the last bead in the acyl chain (n = 4 for PO lipids). (D) Lipid tilt angle, θi, for each chain i relative to the membrane normal (Z-axis). (E) Mean order parameter calculated along all acyl chain bond angles, θij, across chain i and bond j. (F) The average lipid structure for a point on the 2D grid is calculated by averaging the 3D coordinates of the lipid molecules assigned to that point. (G) To evaluate the number of nearest neighbors j for a given lipid i, a set of geometric centers are defined for either the headgroup, ester groups, or acyl chains in both i and j. Lipid j is considered to be a neighbor of i if the distance between the respective centers is 15 Å or less. (H) The degree of hydration is quantified for each lipid molecule, either for the ester layer or the acyl chains, as the total number of lipid-water contacts where a contact is counted if the CG water is within 8 Å of a bead in the selected group. (I) To rank the degree of interdigitation of a given acyl chain i with all other lipids j in the opposing leaflet, the beads in j are indexed as indicated, and those within 6 Å of the last bead in i (marked by asterisk) are identified; the rank averaged over these contacts and time is reported. (J) Interleaflet contacts are the total number of contacts formed between each acyl chain I and beads in any chain j in the opposing leaflet where a contact requires the beads be within 6 Å of each other.
Figure 2—figure supplement 3
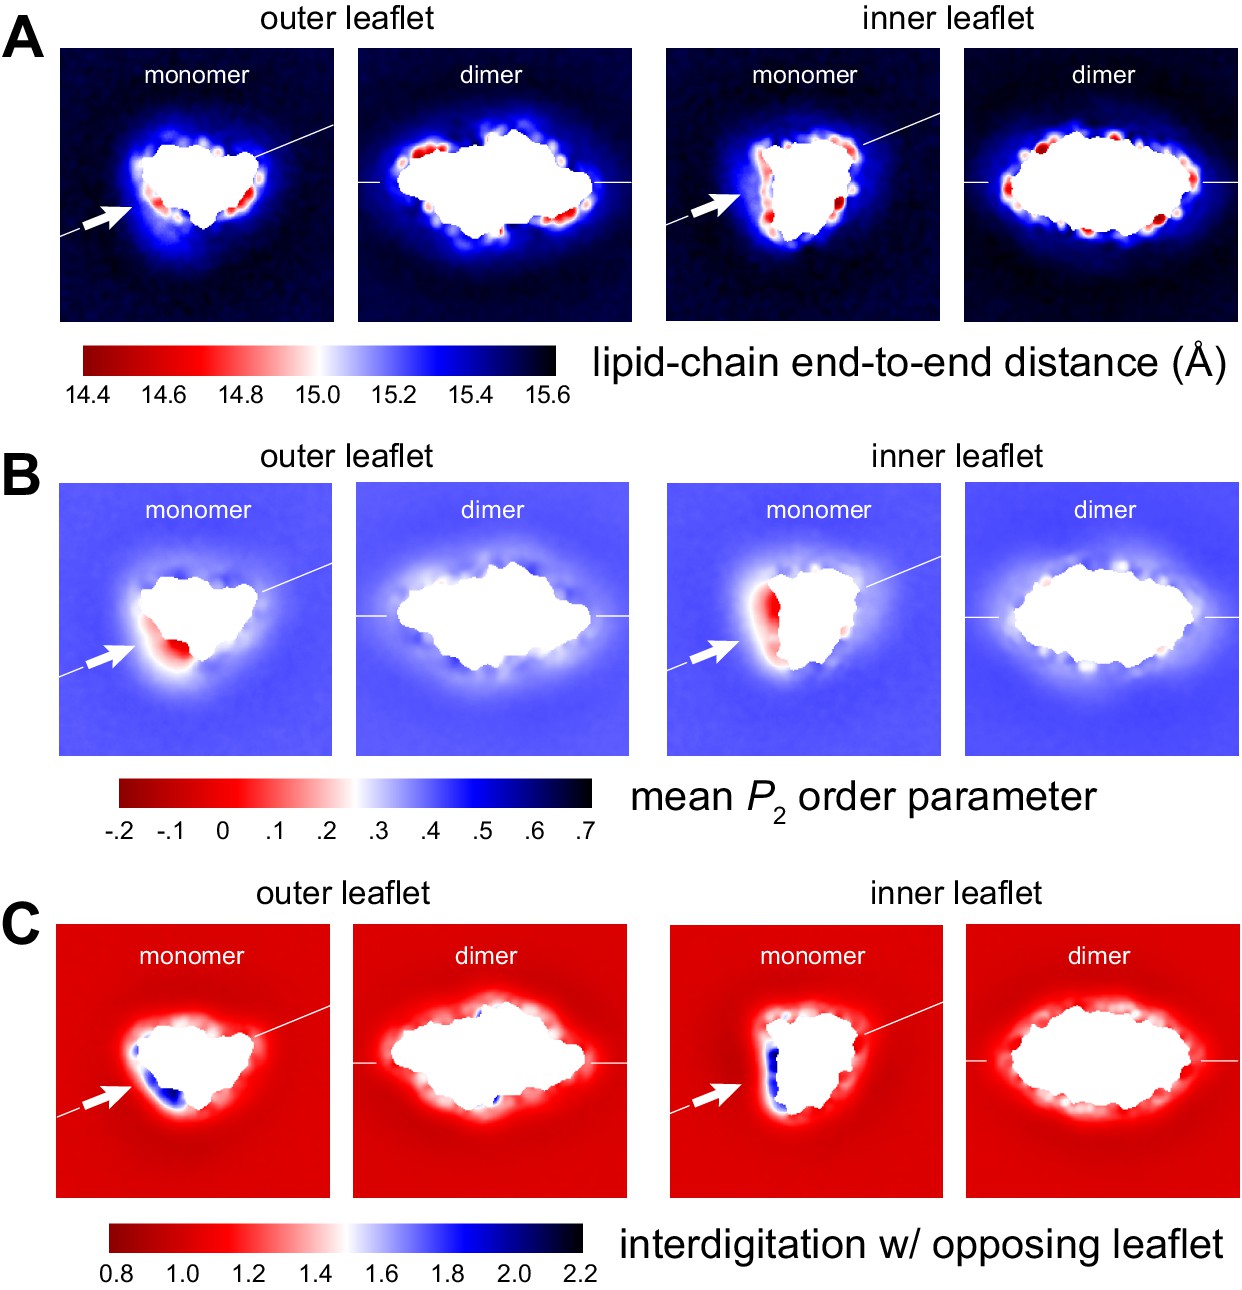
Membrane morphology around CLC-ec1 monomer and dimer from molecular dynamics simulations.
Note monomer and dimer are oriented differently. To facilitate this comparison an axis perpendicular to the dimerization interface (white arrow) is drawn in both cases. (A) Variation in the end-to-end distance in the lipid acyl chains across the simulation system, for both outer and inner leaflets. (B) Variation in the second-rank order parameter, P2, of the coarse-grained C-C bonds in the acyl chains. The P2 parameter of a given C-C bond is defined as 1/2 (3 cos2<θ> − 1), where <θ> denotes the ensemble-average value of the angle formed by the bond and the bilayer perpendicular (Z-axis). The plots show the mean value of P2 for the three C-C bonds in the PO lipids, mapped across the system. (C) Interdigitation rank for the acyl chains in one leaflet with the acyl chains in the opposing leaflet. See Figure 2—figure supplement 2 for further details.
Figure 3
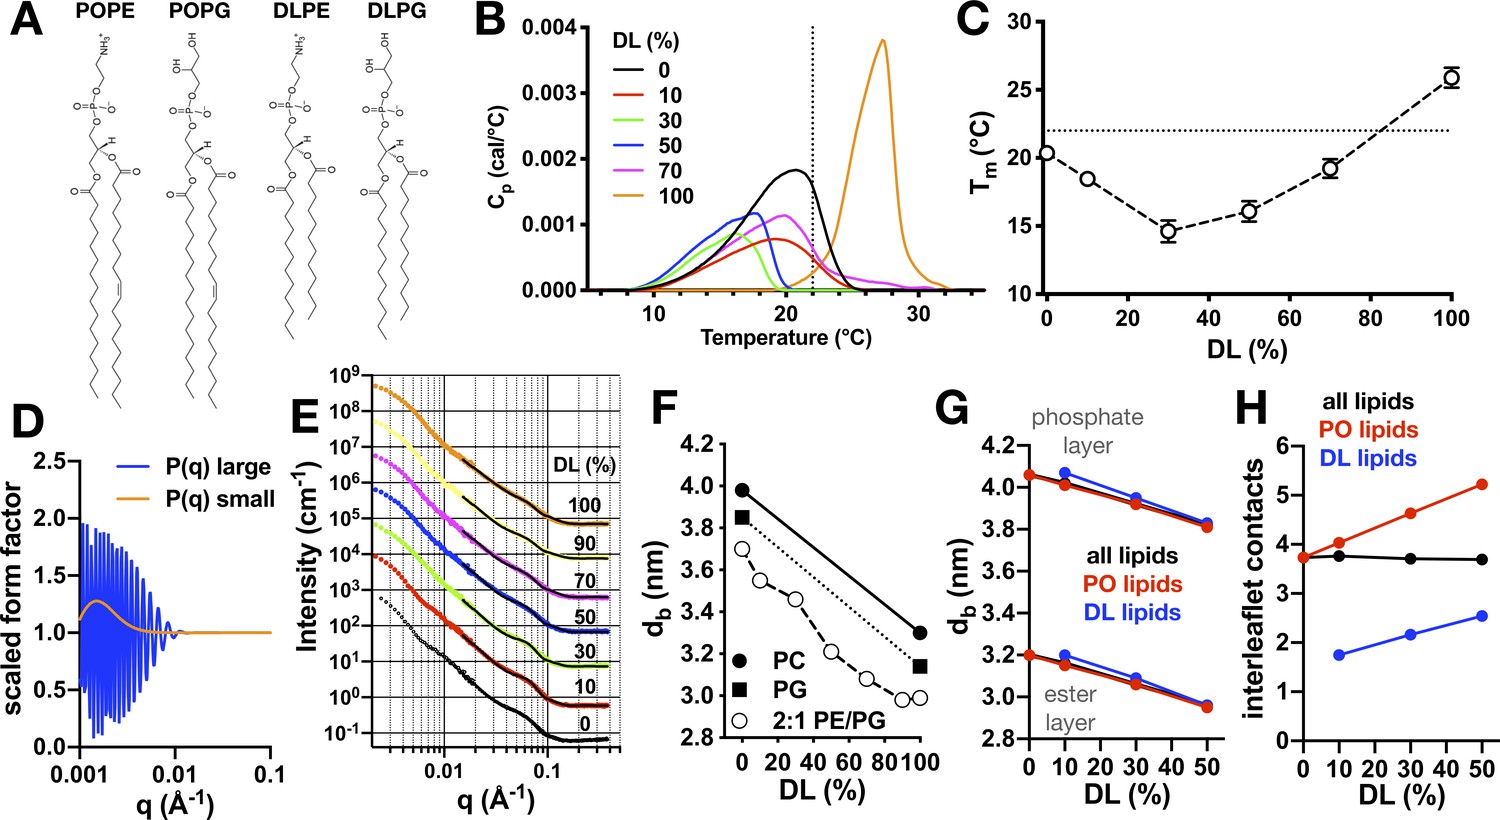
Physical properties of 2:1 PE/PG membranes with mixed PO/DL acyl chains.
(A) Chemical structures of lipids POPE, POPG, DLPE, and DLPG. (B) Differential scanning calorimetry (DSC) thermograms of PO/DL mixed membranes in the multilamellar vesicle state. Dotted line marks approximate ambient room temperature (RT) of 22°C. (C) Peak phase transition temperature, Tm, as a function of DL (%). Dotted line indicates RT. (D) Multilamellar spherical form factors for small (orange) and large (blue) vesicle populations based on size. Both form factors are constant for q > 0.015 Å−1. (E) SANS spectra as a function of DL (%) at 25°C from 100 nm extruded vesicles. Spectra are offset from the 0% condition for visualization. Solid lines represent best fit of the q > 0.015 Å−1 regions using the multilamellar form factor model. The broad shoulder at q ≈ 0.06–0.7 is due to the presence of a small population of multi-lamellar vesicles. (F) Bilayer thickness (dB) as a function of DL (%, white circles). Reference SANS data is shown for PC (solid circle, [Kučerka et al., 2011]) and PG (solid square, [Pan et al., 2014]). (G) Change in bilayer thickness as function of DL% from coarse-grained molecular dynamics simulations of pure PO/DL 2:1 PE/PG membranes, calculated as the average separation between either the phosphate layers or the ester layers. Data is shown for a calculation that considers either all lipids (black), or only PO lipids (red), or only DL lipids (blue). (H) Average number of contacts formed between each of the acyl chains of given lipid (either both PO and DL, black; or PO only, red; or DL only, blue) and any other acyl chain in the opposing leaflet, for the same bilayers examined in (G). See Figure 3—source data 1 and 2 for additional information.
-
Figure 3—source data 1
Differential scanning calorimetry for mixed DL/PO 2:1 PE/PG membranes.
Measurement conducted on liposomes post freeze-thaw in the multi-lamellar state. Data represented as mean ± sem. Statistical analysis carried out using a two-tailed unpaired parametric student's t-test compared to the 0% DL samples.
- https://cdn.elifesciences.org/articles/63288/elife-63288-fig3-data1-v2.docx
-
Figure 3—source data 2
SANS bilayer thickness analysis for mixed DL/PO 2:1 PE/PG membranes.
100 nm extruded vesicles, at 25°C. Data represent best-fit ± standard error. A description of the CGMD analysis is in Figure 2—figure supplement 2.
- https://cdn.elifesciences.org/articles/63288/elife-63288-fig3-data2-v2.docx
-
Figure 3—source data 3
Simulation files for DL/PO membranes.
This folder contains initial/final configurations (PDB files) for GROMACS coarse-grained simulations of 2:1 POPE/POPG and 2:1 DLPE/DLPG pure membranes alongside the corresponding parameter files (MDP/TPR format).
- https://cdn.elifesciences.org/articles/63288/elife-63288-fig3-data3-v2.zip
Figure 4 with 1 supplement
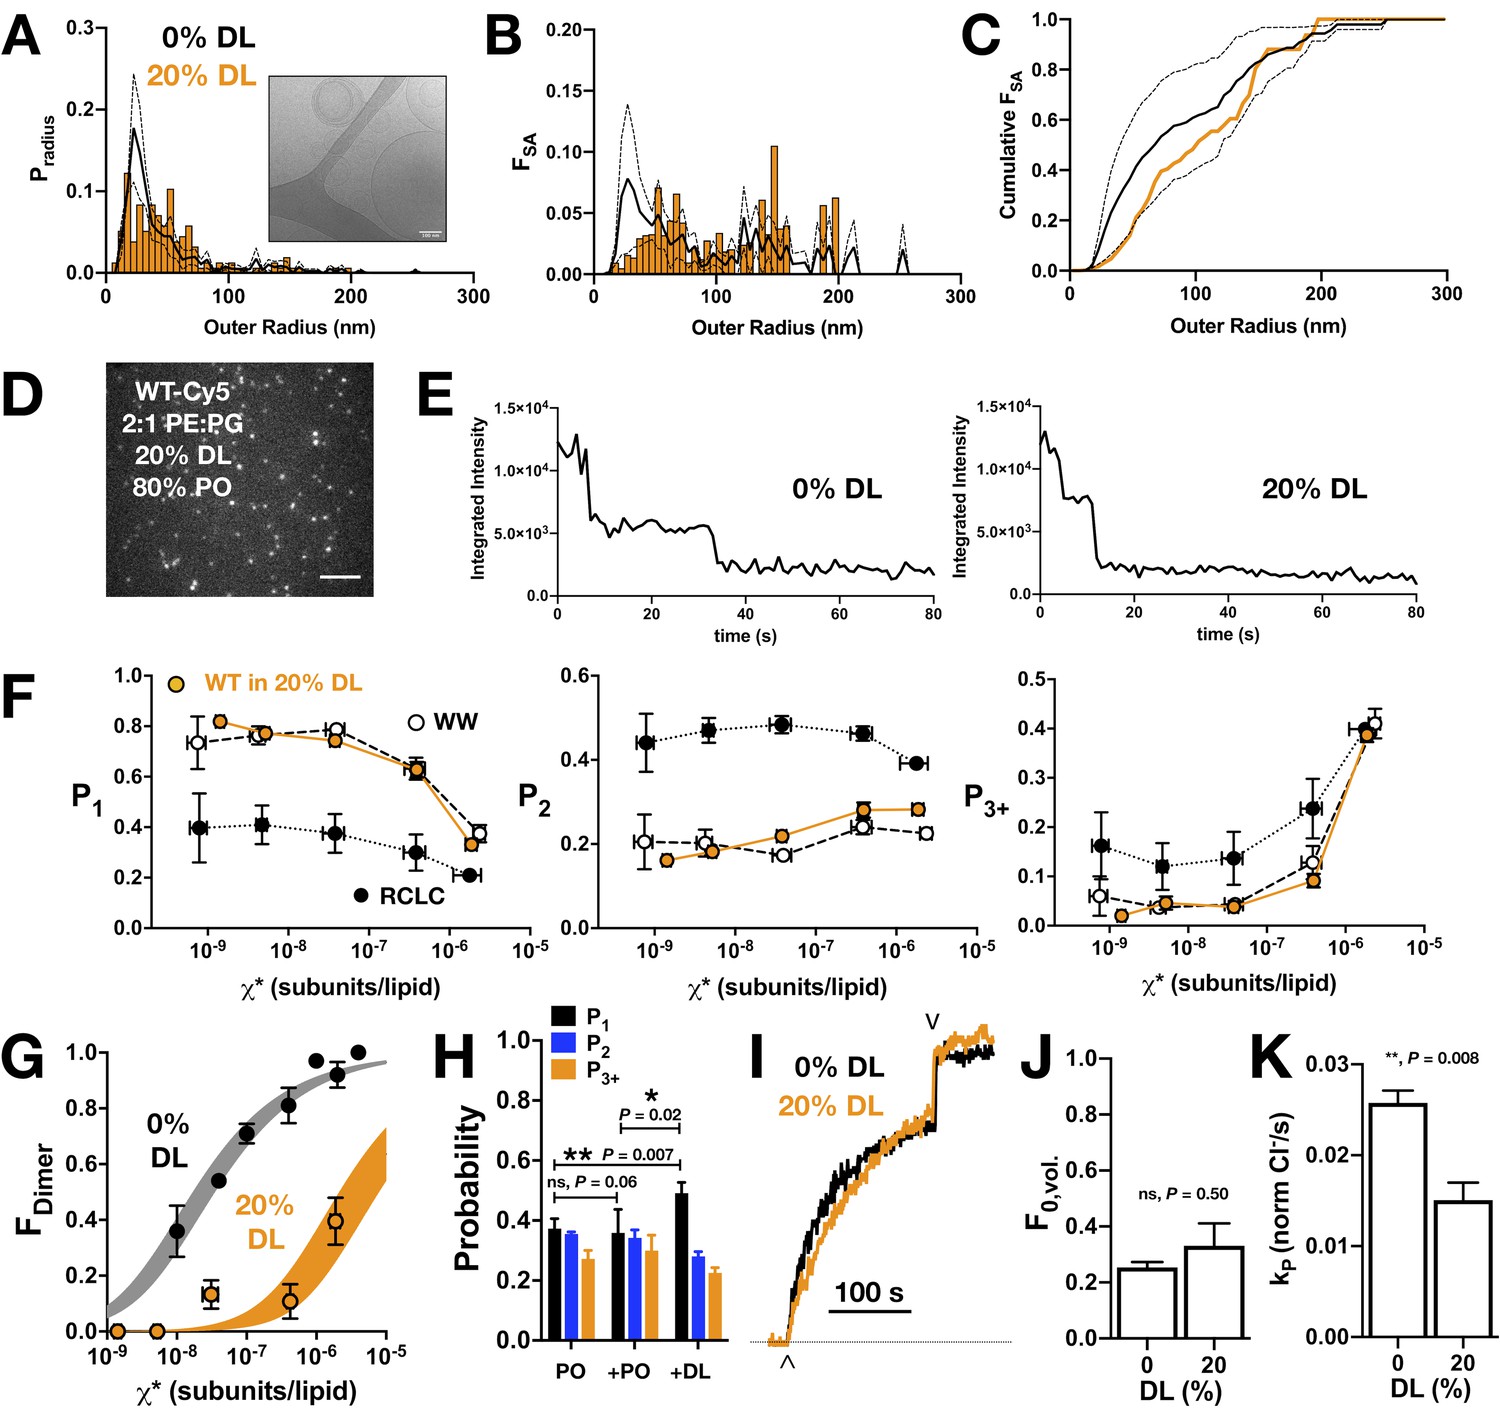
CLC-ec1 dimerization in 2:1 PE/PG membranes with 20% DL and 80% PO acyl chains.
(A) Liposome size distribution of 20% DL liposomes (orange histogram), extruded through 400 nm filters and imaged by cryo-electron microscopy (inset). Black line shows mean ± standard deviation distribution of 400 nm extruded 2:1 POPE/POPG vesicles (Cliff et al., 2020). (B) Distribution of the fractional surface area of each liposome composition. (C) Cumulative fractional surface area distributions show that populations are not significantly different (Kolmogorov-Smirnov test, p = 0.08, D = 0.26). (D) Total internal reflection fluorescence microscopy image of 2:1 PE/PG liposomes with 20% DL containing CLC-ec1-Cy5 reconstituted at χprotein = 1 x 10⁻⁶ subunits/lipid (ρ = 0.1 μg/mg). Scale bar represents 4 μm. (E) Representative integrated intensity photobleaching traces of WT CLC-ec1-Cy5 in 0% and 20% DL membranes. (F) Photobleaching probabilities (P1,P2,P3+) of monomeric control I201W/I422W-Cy5 (WW, white circles, n = 2–3), dimeric control R230C/L249C-Cy5 (RCLC-Cy5, black circles, n = 2–3), and WT CLC-ec1-Cy5 in 20% DL (orange circles, n = 2–5), 400 nm extruded liposomes. Data represent mean ± sem for the reactive protein/lipid mole fraction χ* (x-axis) and photobleaching probabilities (y-axis). (G) CLC-ec1 dimerization isotherm in 20% DL (orange, KD,20%DL > (4.2 ± 1.3) x 10−6 subunits/lipid, ΔG° = −7.4 ± 0.2 kcal/mole, R2 = 0.53, one subunit/lipid standard state) compared to previously published 0% DL (black, KD,0% DL = (2.5 ± 0.4) x 10−8 subunits/lipid, ΔG° = −10.9 ± 0.1 kcal/mole, R2 = 0.92 from Chadda et al., 2018), resulting in ΔΔG >+3.0 ± 0.2 kcal/mole. (H) Fusion experiment showing the change in the photobleaching distribution of χprotein = 2 x 10⁻⁶ subunits/lipid CLC-ec1-Cy5 in 0% DL membranes when diluted 1:1 by fusion with 0% DL or 40% DL, for final 20% DL and χprotein = 1 x 10⁻⁶ subunits/lipid conditions. (I) Chloride transport function for WT-Cy5 CLC-ec1 at χprotein = 1 x 10⁻⁵ subunits/lipid (ρ = 1 μg/mg) in 0% (black) and 20% DL (orange). Efflux is initiated by addition of valinomycin/FCCP (∧) and the remaining trapped chloride is released by addition of β-OG (v). (J) Summary of the fractional volume of inactive vesicles F0,vol. and (K) CLC-dependent chloride efflux rate, kp, over the 0% and 20% DL conditions. For the studies shown here, statistical analysis was calculated using a two-tailed unpaired parametric student's t-test on P1, F0,vol. or kp data (*p≤0.05; **p≤0.01). See Figure 4—figure supplement 1, Figure 4—source data 1–6.
-
Figure 4—source data 1
Cryo-EM radii of 20% DL 2:1 POPE/POPG.
From single preparation of 400 nm extruded vesicles (n = 1).
- https://cdn.elifesciences.org/articles/63288/elife-63288-fig4-data1-v2.docx
-
Figure 4—source data 2
Chloride transport of CLC-ec1-Cy5 in DL/PO proteoliposomes.
Data represent mean ± sem, n independent protein purifications and reconstitutions, with each sample measured as the average of >3 replicate measurements. Statistical analysis was calculated using a two-tailed unpaired parametric student t-test compared to the 0% DL data set (*p<0.05; **p<0.01; ***p<0.001).
- https://cdn.elifesciences.org/articles/63288/elife-63288-fig4-data2-v2.docx
-
Figure 4—source data 3
Photobleaching data for monomeric control CLC-ec1 I201W/I422W, WW-Cy5 in 20% DL, 80% PO, 2:1 PE/PG lipids.
χ* is the reactive molar ratio of protein subunits and lipids, based on the observed mole fraction calculated from the protein and lipid quantification assays, and assuming the reaction occurs between oriented species in the membrane, χ* = χ/2. Data are represented as mean ± standard error. Sample numbers, n, are listed separately for (mole fraction quantification, photobleaching analysis).
- https://cdn.elifesciences.org/articles/63288/elife-63288-fig4-data3-v2.docx
-
Figure 4—source data 4
Photobleaching data for dimeric control CLC-ec1 R230C/L249C, RCLC-Cy5 in 20% DL, 80% PO, 2:1 PE/PG lipids.
χ* is the reactive molar ratio of protein subunits and lipids, based on the observed mole fraction calculated from the protein and lipid quantification assays, and assuming the reaction occurs between oriented species in the membrane, χ* = χ/2. Data are represented as mean ± standard error. Sample numbers, n, are listed separately for (mole fraction quantification, photobleaching analysis).
- https://cdn.elifesciences.org/articles/63288/elife-63288-fig4-data4-v2.docx
-
Figure 4—source data 5
Photobleaching data for monomeric control CLC-ec1 WT-Cy5 in 20% DL, 80% PO, 2:1 PE/PG lipids.
χ* is the reactive molar ratio of protein subunits and lipids, based on the observed mole fraction calculated from the protein and lipid quantification assays, and assuming the reaction occurs between oriented species in the membrane, χ* = χ/2. Fdimer is calculated based on the WW-Cy5 and RCLC-Cy5 in 20% DL. Data are represented as mean ± standard error. Sample numbers, n, are listed separately for (mole fraction quantification, photobleaching analysis).
- https://cdn.elifesciences.org/articles/63288/elife-63288-fig4-data5-v2.docx
-
Figure 4—source data 6
Shift in dimer equilibrium upon fusion with DL containing vesicles.
CLC-ec1-Cy5 proteoliposomes (0.2 μg/mg) in 100% PO, 2:1 PE/PG were either (A) unmodified, (B) fused with 100% PO 2:1 PE/PG liposomes or (C) fused with 40% DL, 60% PO 2:1 PE/PG liposomes by multiple freeze-thaw cycles. Data represented as mean ± sem, n = 3 independent samples. p-Values are calculated using a two-tailed student's t-test on the P1 photobleaching data, and using the χ2 test on the (P1,P2,P3+) photobleaching probability distributions, designated in brackets (*p<0.05; **p<0.01).
- https://cdn.elifesciences.org/articles/63288/elife-63288-fig4-data6-v2.docx
-
Figure 4—source data 7
Cy5 labeling yields.
Total mean Cy5 labeling yields for WT, WW and RCLC protein samples.
- https://cdn.elifesciences.org/articles/63288/elife-63288-fig4-data7-v2.xlsx
Figure 4—figure supplement 1
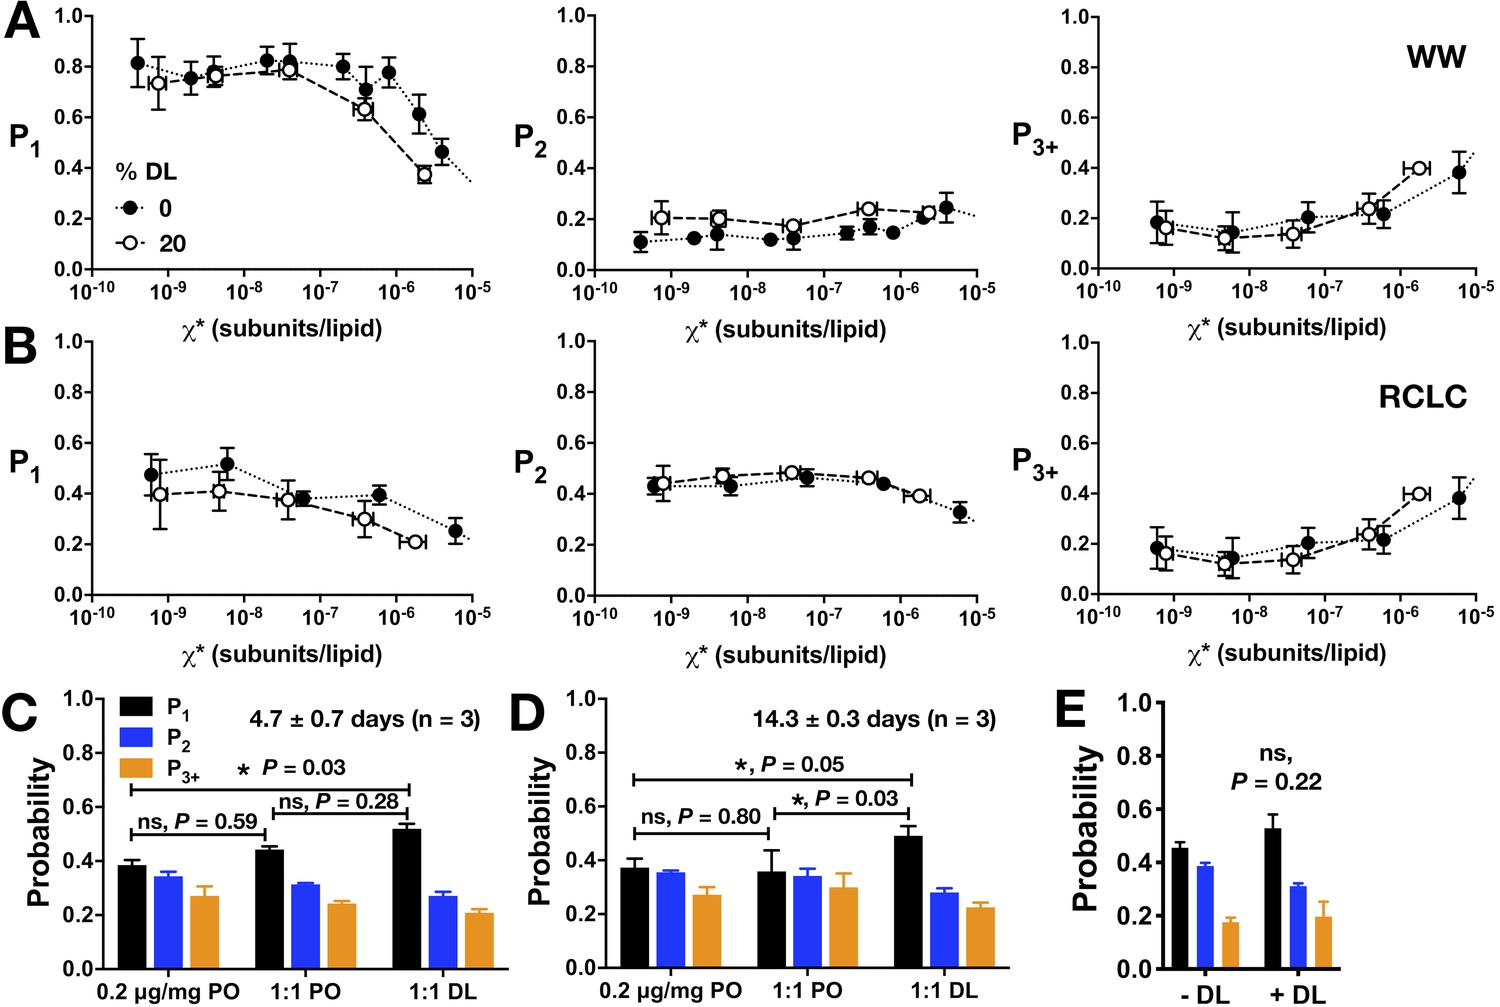
Additional analysis of CLC-ec1 assembly in membranes as a function of DL percentage in 2:1 PE/PG membranes.
Photobleaching probability distributions (P1,P2,P3+) for (A) WW-Cy5 monomeric control and (B) dimeric control RCLC-Cy5 in 2:1 PE/PG, 400 nm extruded liposomes with 0% DL (black circles) vs. 20% DL (white circles). (C,D) Photobleaching probabilities, P1 and P2, for the in-membrane dilution by freeze-thaw fusion of 0.2 μg/mg vesicles in 0% DL membranes (black circles) with either 0% DL (negative control, white circles) or 40% DL membranes for a final DL composition of 20% (orange circles), measured at (C) 4.7 ± 0.7 days and (D) 14.3 ± 0.3 days after freeze/thaw fusion and incubation at room temperature in dark conditions. (E) Comparison of dialyzing 0% DL samples in the absence (- DL) or presence (+DL) of high DL samples (>20% DL) in the same dialysis bucket (mean ± sem, n = 3). Statistical significance calculated using a two-tailed unpaired parametric student's t-test (*p<0.05).
Figure 5 with 1 supplement
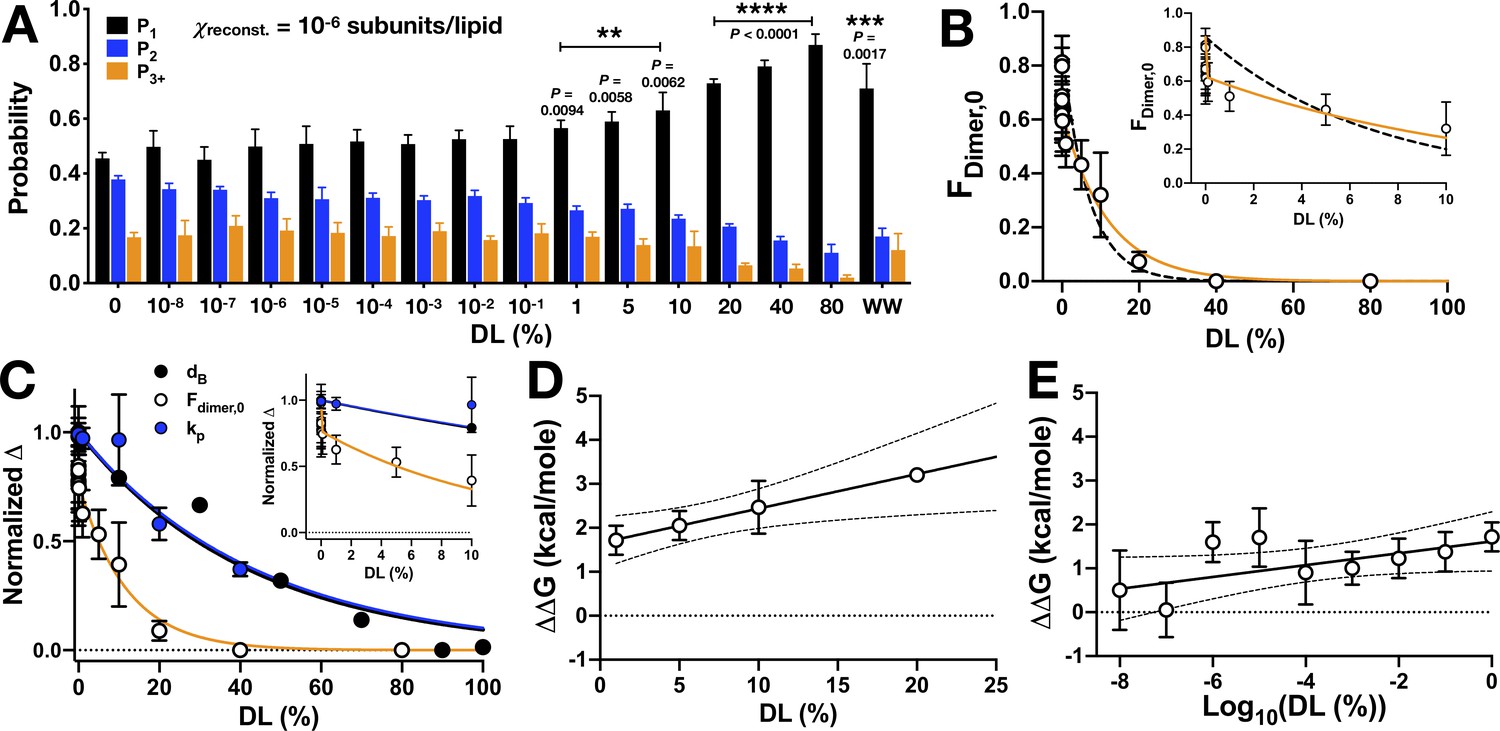
CLC-ec1 dimerization depends on DL in two phases.
(A) Photobleaching probability distributions of χprotein = 1 x 10⁻⁶ subunits CLC-ec1-Cy5 per lipid as a function of % DL (n0% DL = 9; n1E-8 to 80% DL = 3–5; nWW-Cy5, 0% DL = 2 [Chadda et al., 2016]). Data is represented as mean ± sem. Statistical analysis calculated using a two-tailed unpaired parametric student's t-test on P1 data (*p≤0.05; **p≤0.01; ***p≤0.001; ****p≤0.0001). For additional statistical information, see Figure 5—source data 1. (B) Fraction of dimer, Fdimer,0, calculated by least-squares fitting of WT-Cy5 distributions to WW-Cy5 and RCLC-Cy5 monomer and dimer controls. The subscript, ‘0’, indicates that the 0% DL control distributions were used. Data was fit to a single exponential decay, (black, dashed, λ = 0.13 ± 0.04, R2 = 0.48) and two-phase exponential decay, (orange, λ1 = (1.71 ± 2.66) x 106, F1 = 27.23 ± 4.27, λ2 = 0.09 ± 0.03, R2 = 0.64), where F(0) = 0.86, the mean value at 0% DL. The inset shows that the two-phase exponential decay is required for fitting <1% DL data. (C) Normalized change in bilayer thickness (ΔdB, black) from SANS measurements, compared to normalized fraction of dimers (ΔFdimer,0, white) and chloride transport rate (ΔkP, blue) as a function of % DL. Fits are single exponential decays for ΔdB: λ = 0.023 ± 0.003, R2 = 0.94 (black), ΔkP: λ = 0.025 ± 0.005, R2 = 0.59 (blue), and a two-phase exponential decay for ΔFdimer,0 (orange, same fit parameters as above), with the y-intercept set to 1. Complete analysis of functional data is shown in Figure 5—figure supplement 1. (D) ΔΔG vs. % DL for data > 1% DL. Line represents linear regression analysis with 95% confidence intervals (slope = 0.078 ± 0.029, y-intercept = 1.65 ± 0.27, best-fit ± standard error, R2 = 0.38). (E) ΔΔG vs. Log10(DL) for data <1% DL. Line represents linear regression analysis with 95% confidence intervals (slope = 0.135 ± 0.072, y-intercept = 1.61 ± 0.33, best-fit ± standard error, R2 = 0.09). See Figure 5—figure supplement 1, Figure 5—source data 1–3.
-
Figure 5—source data 1
Photobleaching titration of CLC-ec1 WT-Cy5 in 2:1 PE/PG mixed DL/PO membranes.
Data is represented as mean ± sem, with independent sample preparations, n. Statistical tests were calculated using a two-tailed, unpaired parametric student's t-test on P1 data, and a χ2 test for the mean (P1,P2,P3+) distributions, in brackets (*, p ≤. 05; **, p ≤. 01; ***, p ≤. 001; ****, p ≤. 0001,). ΔG° is calculated for each FDimer value where 0 < FDimer < 1, and ΔΔG = ΔG°(x% DL)-mean(ΔG°(0% DL)), n in brackets.
- https://cdn.elifesciences.org/articles/63288/elife-63288-fig5-data1-v2.docx
-
Figure 5—source data 2
Testing for DL contamination during dialysis.
CLC-ec1-Cy5 proteoliposomes (0.1 μg/mg) in 100% PO, 2:1 PE/PG were dialyzed alone (-DL) or in the presence of a cassette containing >20% DL (+DL). The p-value was calculated using a χ2 test on the mean (P1,P2,P3+) photobleaching probability distributions. Data is represented as mean ± standard deviation.
- https://cdn.elifesciences.org/articles/63288/elife-63288-fig5-data2-v2.docx
-
Figure 5—source data 3
DL and PO concentrations, mole fraction and molality in the titrated DL/PO 2:1 POPE/POPG lipid bilayers.
Lipids are prepared at 20 mg/mL total lipid mass, and the % DL mixtures are prepared by combining stock solutions, w/w of total lipid. Note, the headgroup mole fraction remains nearly constant and ranges from χPE = 0.68–0.69 and χPG = 0.31–0.32 across the range of % DL studied. MWPOPE = 717.996 g/mole, MWPOPG = 770.989 g/mole, MWDLPE = 579.746 g/mole, MWDLPG = 632.739 g/mole.
- https://cdn.elifesciences.org/articles/63288/elife-63288-fig5-data3-v2.docx
Figure 5—figure supplement 1
Chloride transport activity as a function of DL titration.
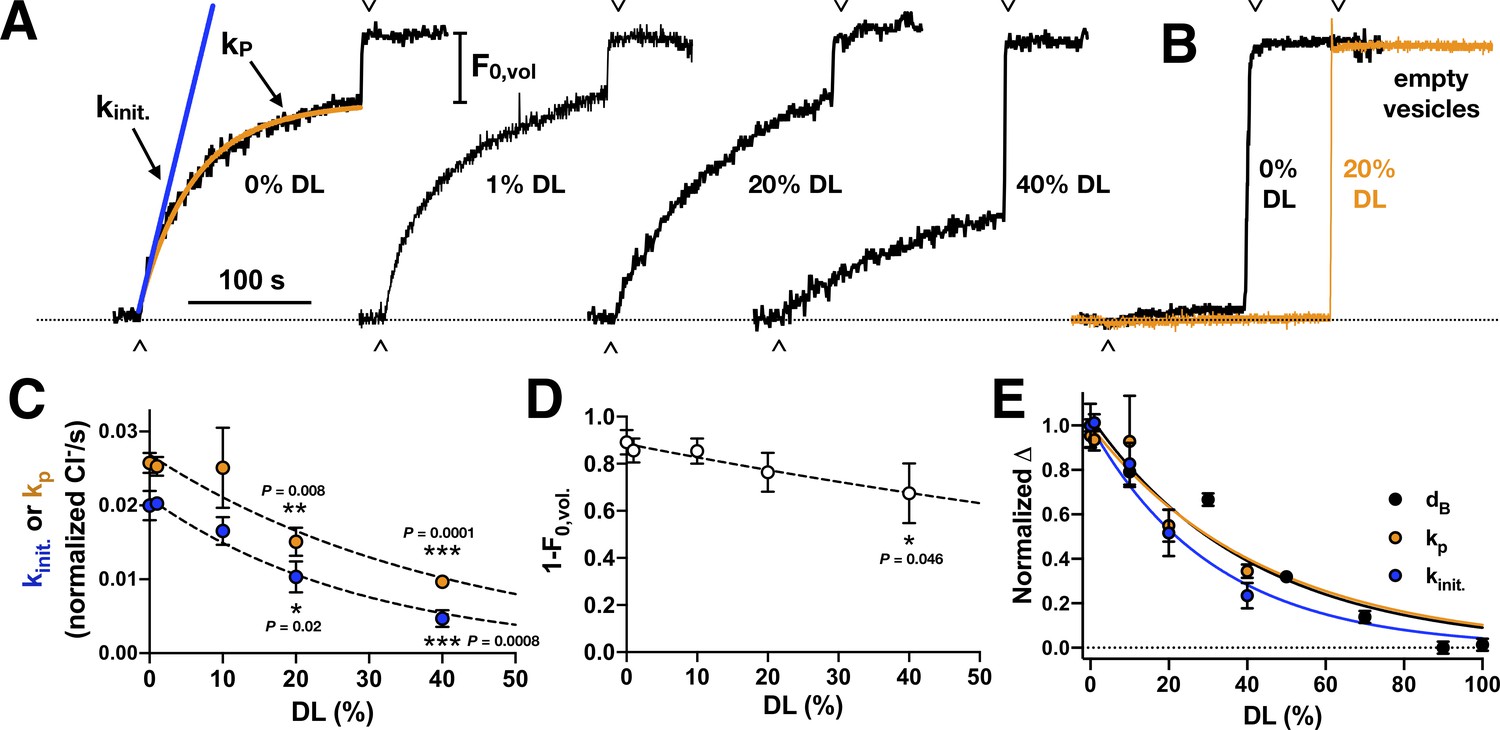
(A) Raw traces of chloride transport function in 2:1 PE/PG vesicles containing different proportions of DL vs. PO. Valinomycin initiated chloride efflux (∧), and addition of β-OG detergent to dissolve inactive vesicles and release the remaining chloride into solution (v) are marked as shown. Protein was reconstituted at χprotein = 1 x 10⁻⁵ subunits/lipid (ρ = 1 μg CLC-ec1 per mg lipids). (B) Representative chloride leak traces from empty vesicles with 0% (black) and 20% DL composition (orange). Leak rates in normalized Cl-/s measured by fitting to exponential association, kleak, or initial slope, kinit.: 0% DL - kleak = 0.0004 ± 0.0002, kinit. = 0.0006 ± 0.0009 (nrep. = 3); 20% DL - kleak = 0.0004 ± 0.0003, kinit. = 0.0005 ± 0.0005 (nrep. = 4); 50% DL: kleak = 0.0012 ± 0.0010, kinit. = 0.0011 ± 0.0010 (nrep. = 4); data represented as mean ± standard deviation, nrep. – measurement replicates from a single sample. (C) Chloride transport rate, kinit. (blue) or kP (orange), in normalized Cl-/second, mean ± sem, n = 3-5 independent samples. Dashed lines represent fits to a single exponential decay, : kinit. – y0 = 0.021 ± 0.001, λ = 0.034 ± 0.024, R2 = 0.78; kp – y0 = 0.027 ± 0.002, λ = 0.024 ± 0.036, R2 = 0.59. Statistical analysis calculated using a two-tailed unpaired parametric student's t-test (*, p ≤ 0.05; **p≤0.01; ***p≤0.001; ****p≤0.0001). (D) Fractional volume of active vesicles, 1-F0,vol. Dashed line represents fits to a single exponential decay, : y0 = 0.88 ± 0.05, λ = 0.007 ± 0.003, R2 = 0.14. (E) Plot of the normalized change in bilayer thickness, ΔdB (black), and transport rates, ΔkP (orange) and Δkinit (blue). Lines represent fits to exponential decays with y0=1: ΔdB: λ = 0.024 ± 0.003, R2 = 0.94; ΔkP: λ = 0.023 ± 0.005, R2 = 0.58; Δkinit: λ = 0.032 ± 0.004, R2 = 0.77.
Figure 6 with 2 supplements
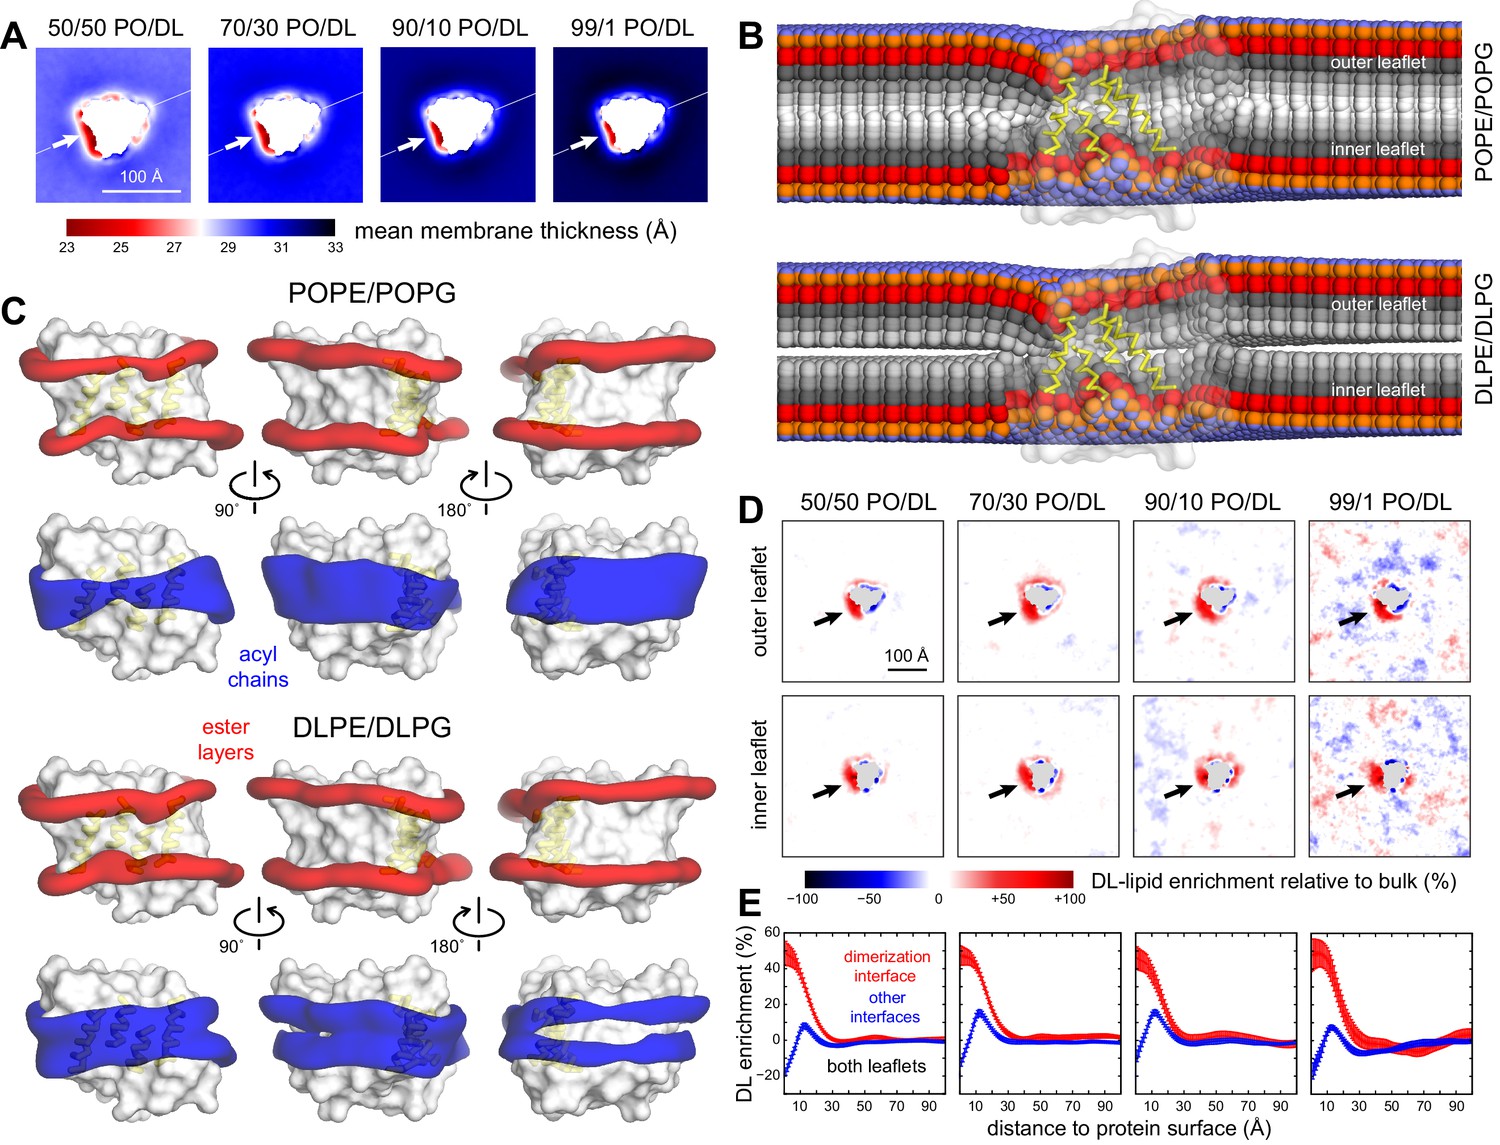
Preferential DL solvation of the CLC-ec1 dimerization interface in mixed PO/DL membranes.
Data are shown for 2:1 POPE/POPG membranes with varied proportions of 2:1 DLPE:DLPG, namely 1%, 10%, 30%, and 50%. For each composition, the results presented are averages of 8 independent trajectories of 6–10 μs each (Figure 2—source data 1) (A) 2D maps of the bilayer thickness analogous to that shown in Figure 2C for a membrane with no DL. (B) For the 50% DL condition, time-averaged lipid conformations, represented identically to Figure 2E. PO and DL lipids are analyzed separately. (C) For the 50% DL condition, 3D density maps for the ester layers (red) or acyl chains (blue) in the vicinity (≤10 Å) of the protein (white surface), represented identically to those in Figure 2A. PO and DL lipids are analyzed separately. (D) Enrichment or depletion of DL lipids across the membrane, relative to the preset proportions of PO and DL lipids, quantified by the percent difference between the observed 2D lipid density ratio (DL/PO) and what would be expected for a uniform distribution and the bulk ratio. Positive values reflect enrichment while negative values reflect depletion. Each leaflet is examined separately. (E) The results shown in panel (D) are summarized by integrating the data over lipid-solvation shells of increasing width and combining the outer and inner leaflets. Independent profiles are calculated for the dimerization interface and for the other two protein-lipid interfaces. Error bars reflect the standard deviation of the data across independent trajectories.
-
Figure 6—source data 1
Simulation files for CLC-ec1 in DL/PO membranes.
This folder contains initial/final configurations (PDB files) for GROMACS coarse-grained simulations of CLC-ec1 monomers and dimers in mixtures of 2:1 DLPE/DLPG and 2:1 POPE/POPG, alongside the corresponding parameter files (MDP/TPR format).
- https://cdn.elifesciences.org/articles/63288/elife-63288-fig6-data1-v2.zip
Figure 6—figure supplement 1
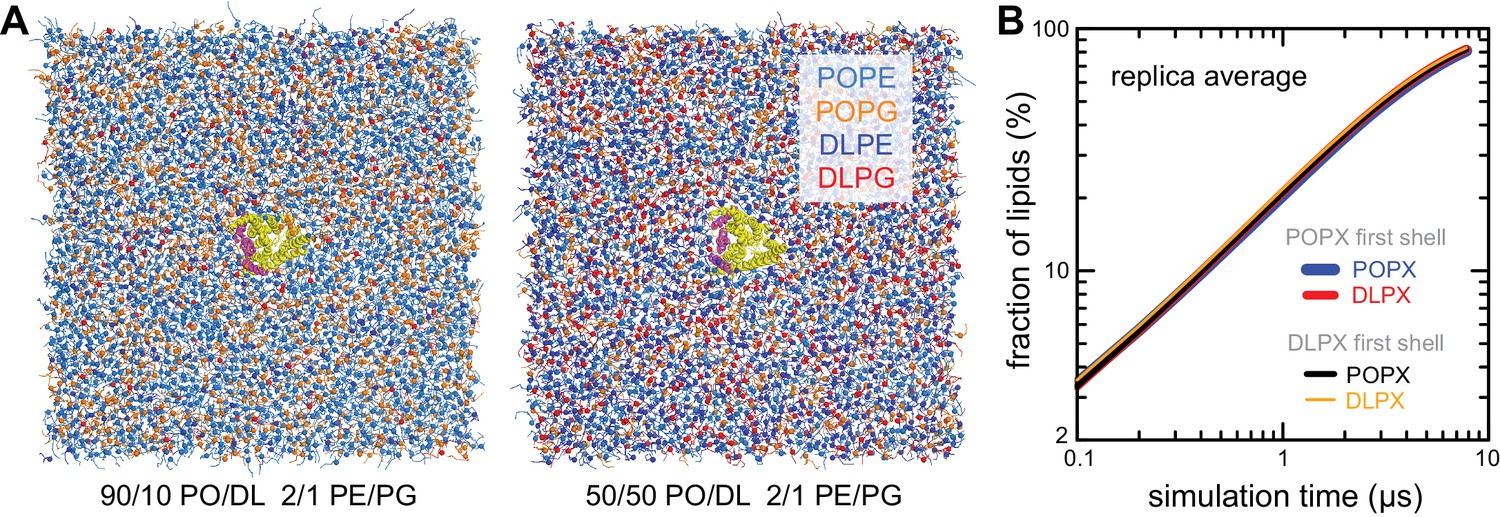
Lipid-solvation of the CLC-ec1 monomer in CGMD simulations with PO/DL membranes.
(A) Snapshots of simulation systems used to examine the 10% DL (left) and 50% DL conditions. The molecular systems are represented as in Figure 2—figure supplement 1A. We also examined the 1% and 30% conditions (see Figure 2—source data 1 for details). (B) Quantification of the degree of lipid mixing observed for the 50% DL condition, evaluated and represented as in Figure 2—figure supplement 1B.
Figure 6—figure supplement 2
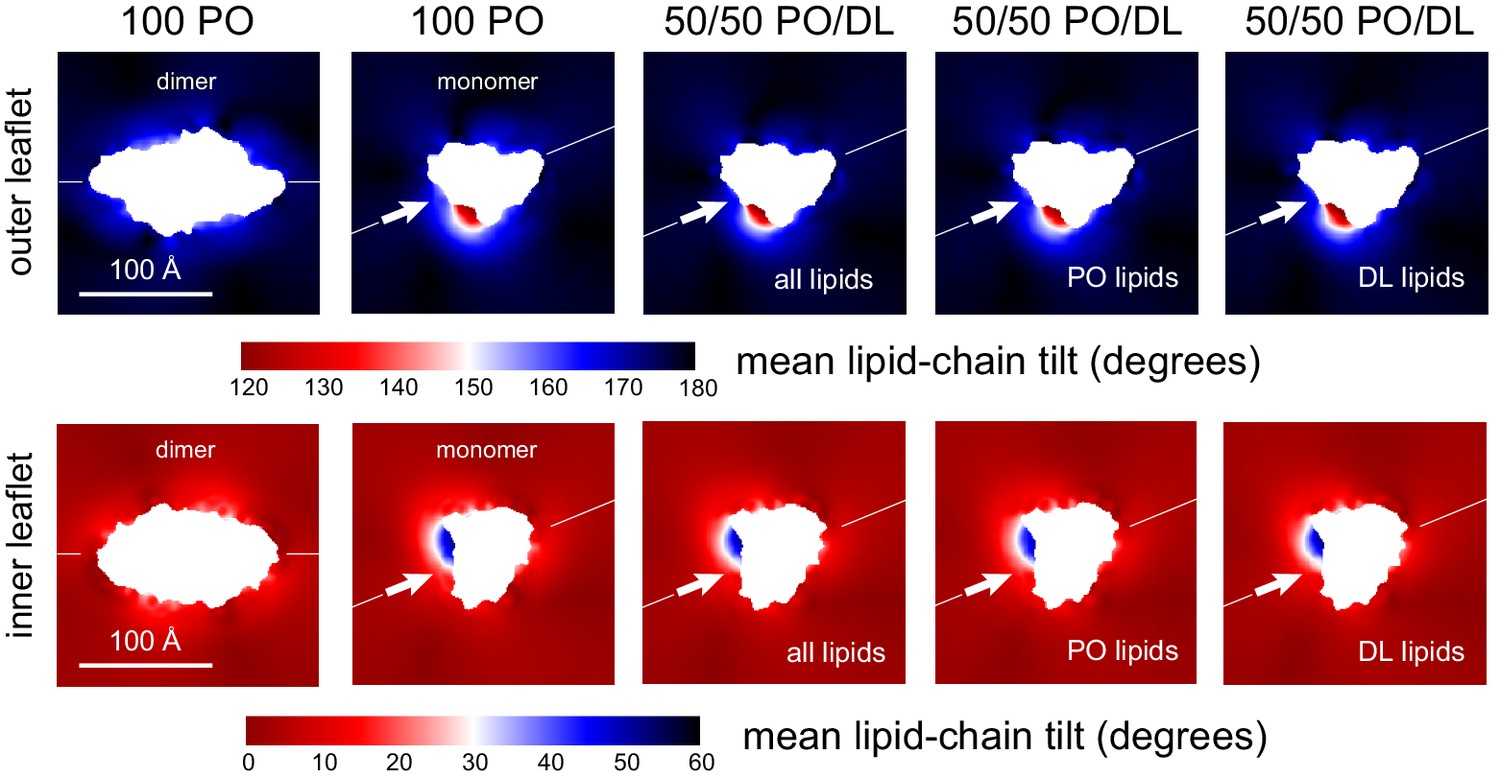
Lipid tilt around the CLC-ec1 monomer and dimer from molecular dynamics simulations.
Note monomer and dimer are oriented differently. To facilitate this comparison an axis perpendicular to the dimerization interface (white arrow) is drawn in both cases. Variation in the mean lipid tilt angle across the membrane, relative to its perpendicular, for both the CLC-ec1 dimer and monomer in 2:1 POPE/POPG, that is, 100% PO; and for the monomer in 50% DL/50% PO membranes. Data are shown for each of the bilayer leaflets. For the PO/DL membrane, the mean tilt analysis evaluates either both lipid types, PO lipids only, or DL lipids only.
Figure 7
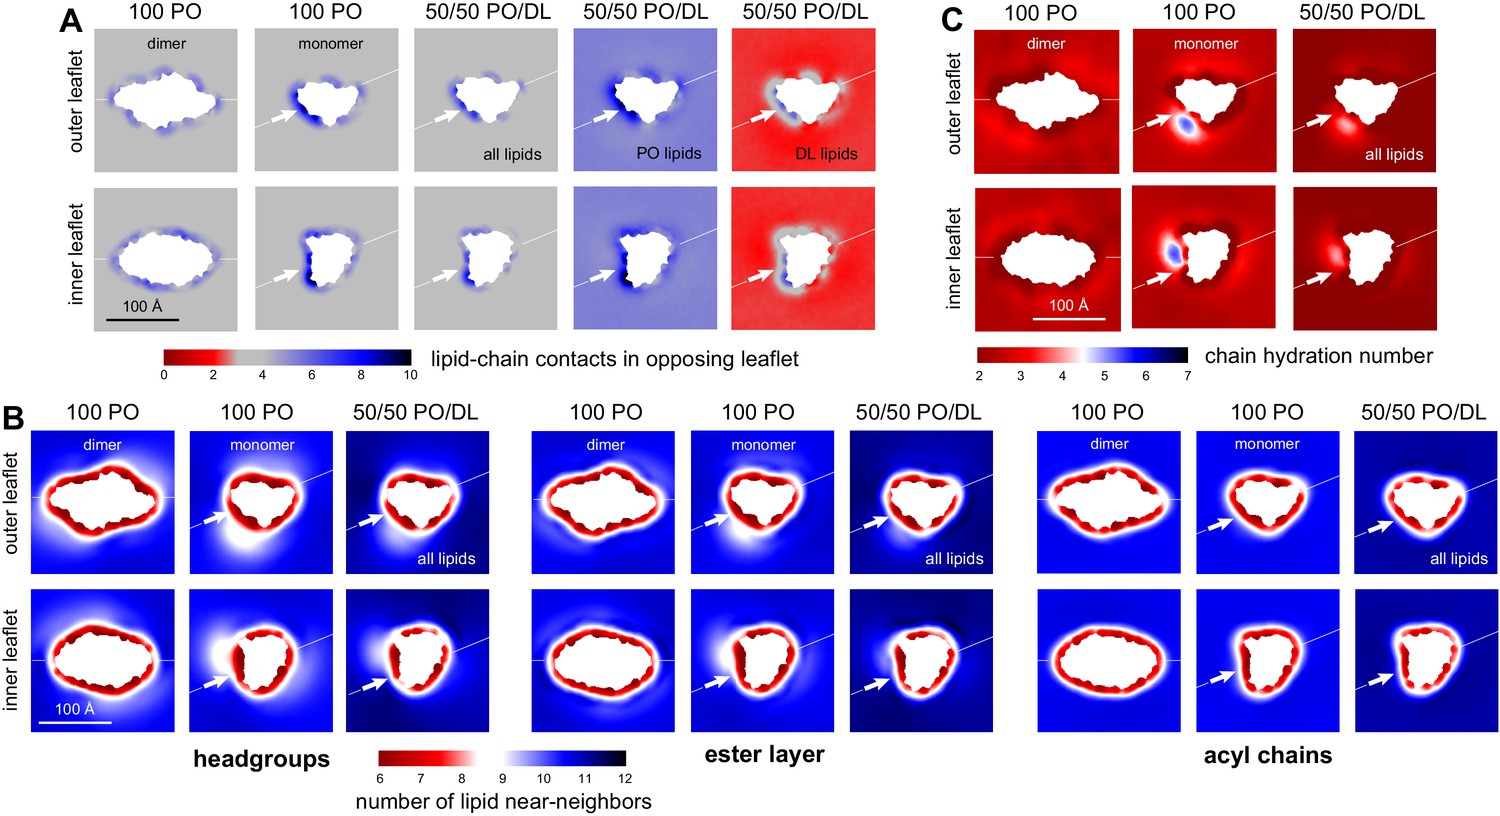
DL enrichment of membrane defect partially restores native-like properties.
(A) Analysis of the average number of contacts formed by each of the acyl chains of a given lipid (either both PO and DL, PO only, or DL only) and any other acyl chain in the opposing leaflet. The results are mapped across the membrane plane, for either the CLC-ec1 dimer or the monomer, in either 100 PO or 50/50 PO/DL. This is the same quantity reported in Figure 3H for the pure PO/DL bilayers, but here it is mapped in 2D, and is calculated with the protein present. Note the number of contacts formed by DL lipids at the defect induced by monomeric CLC-ec1 approximately matches the bulk values for 100 PO or 50/50 PO/DL (regions of map in gray); by contrast, PO lipids exceed the bulk quantity. (B) Analysis of the 2D lipid density, at the level of either the headgroups, the ester layers, or the acyl chains, in terms of the number of lipid neighbors within 15 Å. Results are shown for each leaflet separately, for either the CLC-ec1 dimer or monomer, and in either 100 PO or 50/50 PO/DL. Note the density defect created by monomeric CLC-ec1 in the headgroup and ester layers in the 100 PO condition, and how this defect is minimized through enrichment in DL lipids. (C) Analysis of the extent of water penetration of the acyl-chain interior of the bilayer, for either the dimer or monomer and either the 100 PO or 50/50 PO/DL condition. Consistent with the lipid density analysis, the degree of water penetration into the bilayer interior in the 100 PO condition is much greater in the defect at the dimerization interface in monomeric CLC-ec1 than anywhere else in the membrane; this perturbation is diminished by DL enrichment.
Additional files
Download links
A two-part list of links to download the article, or parts of the article, in various formats.
Downloads (link to download the article as PDF)
Open citations (links to open the citations from this article in various online reference manager services)
Cite this article (links to download the citations from this article in formats compatible with various reference manager tools)
Membrane transporter dimerization driven by differential lipid solvation energetics of dissociated and associated states
eLife 10:e63288.
https://doi.org/10.7554/eLife.63288


