Tuning self-renewal in the Arabidopsis stomatal lineage by hormone and nutrient regulation of asymmetric cell division
- Department of Biology, Stanford University, United States
- Howard Hughes Medical Institute, Stanford University, United States
- School of Chemical and Biomolecular Engineering, Georgia Institute of Technology, United States
Figures
Figure 1 with 3 supplements
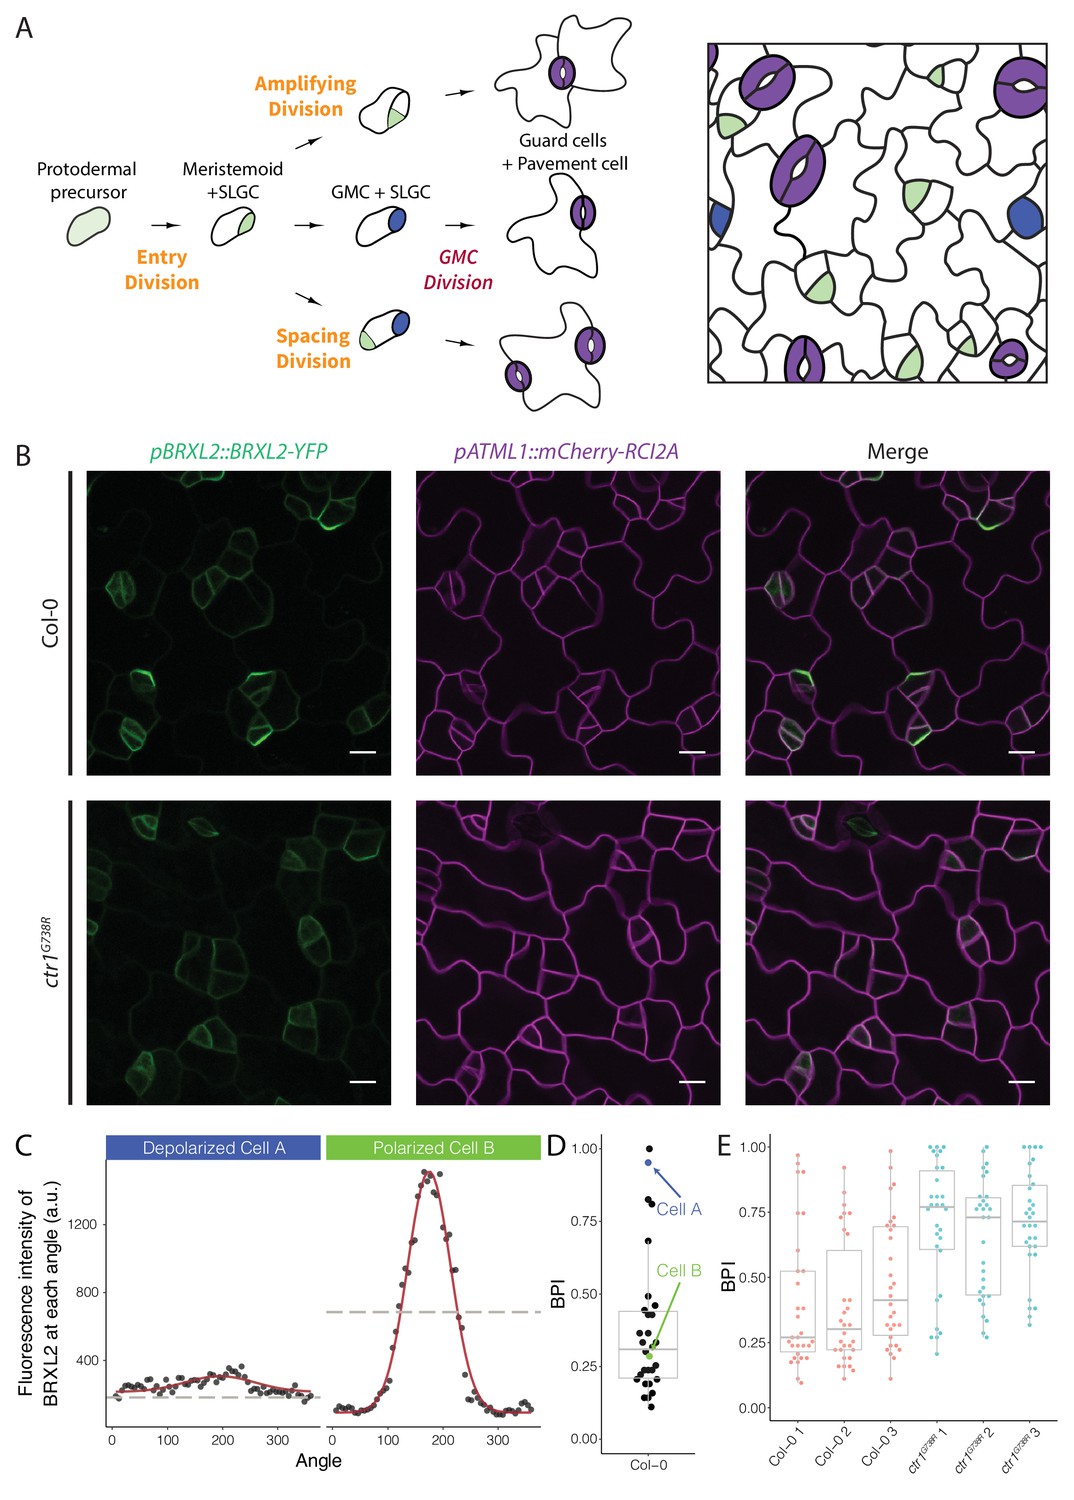
Quantitative analysis of BRXL2-YFP reporter during stomatal lineage divisions reveals reduction in polar localization in the loss-of-function mutant ctr1G738R.
(A) Schematic diagram of stomatal lineage (left) and organization of leaf epidermis (right). From dispersed protodermal precursors, each asymmetric cell division (ACD) produces a small meristemoid (green) and a large stomatal lineage ground cell (SLGC, white). The meristemoid can self-renew by undergoing amplifying ACD(s) or differentiate into guard mother cells (GMCs, blue). Each GMC divides symmetrically to produce paired guard cells (purple). The SLGC can also undergo another ACD (spacing division) or differentiate into a pavement cell. Multiple stomatal lineages are initiated and undergo divisions and differentiation in a dispersed and asynchronized fashion. (B) BRXL2 localization epidermal in cells of 4 dpg Col-0 (top panels) and ctr1G738R (bottom panels) cotyledons. pBRXL2::BRXL2-YFP (left), pATML1::RCI2A-mCherry (middle), and merged (right) are shown separately. (C) Output of POME measurement of depolarized (cell A, left) and polarized BRXL2 (cell B, right). Fluorescence intensity measurements of BRXL2 at each angle are plotted in black dots, and the nonlinear regression models per each cell are plotted in red. (D) POME quantification of BRXL2 polarity index (BPI) in Col-0 (n = 30 cells). Each point represents a BPI score calculated from the BRXL2 cortical localization pattern of one cell (details in Materials and methods and Gong et al., 2021). (E) Output of POME quantification of BRXL2 polarity in 4 dpg Col-0 and ctr1G738R cotyledons (n = 30 cells/genotype, three replicates, statistical analysis reported in Figure 1—figure supplement 3). Scale bar in (B), 10 μm.
Figure 1—figure supplement 1
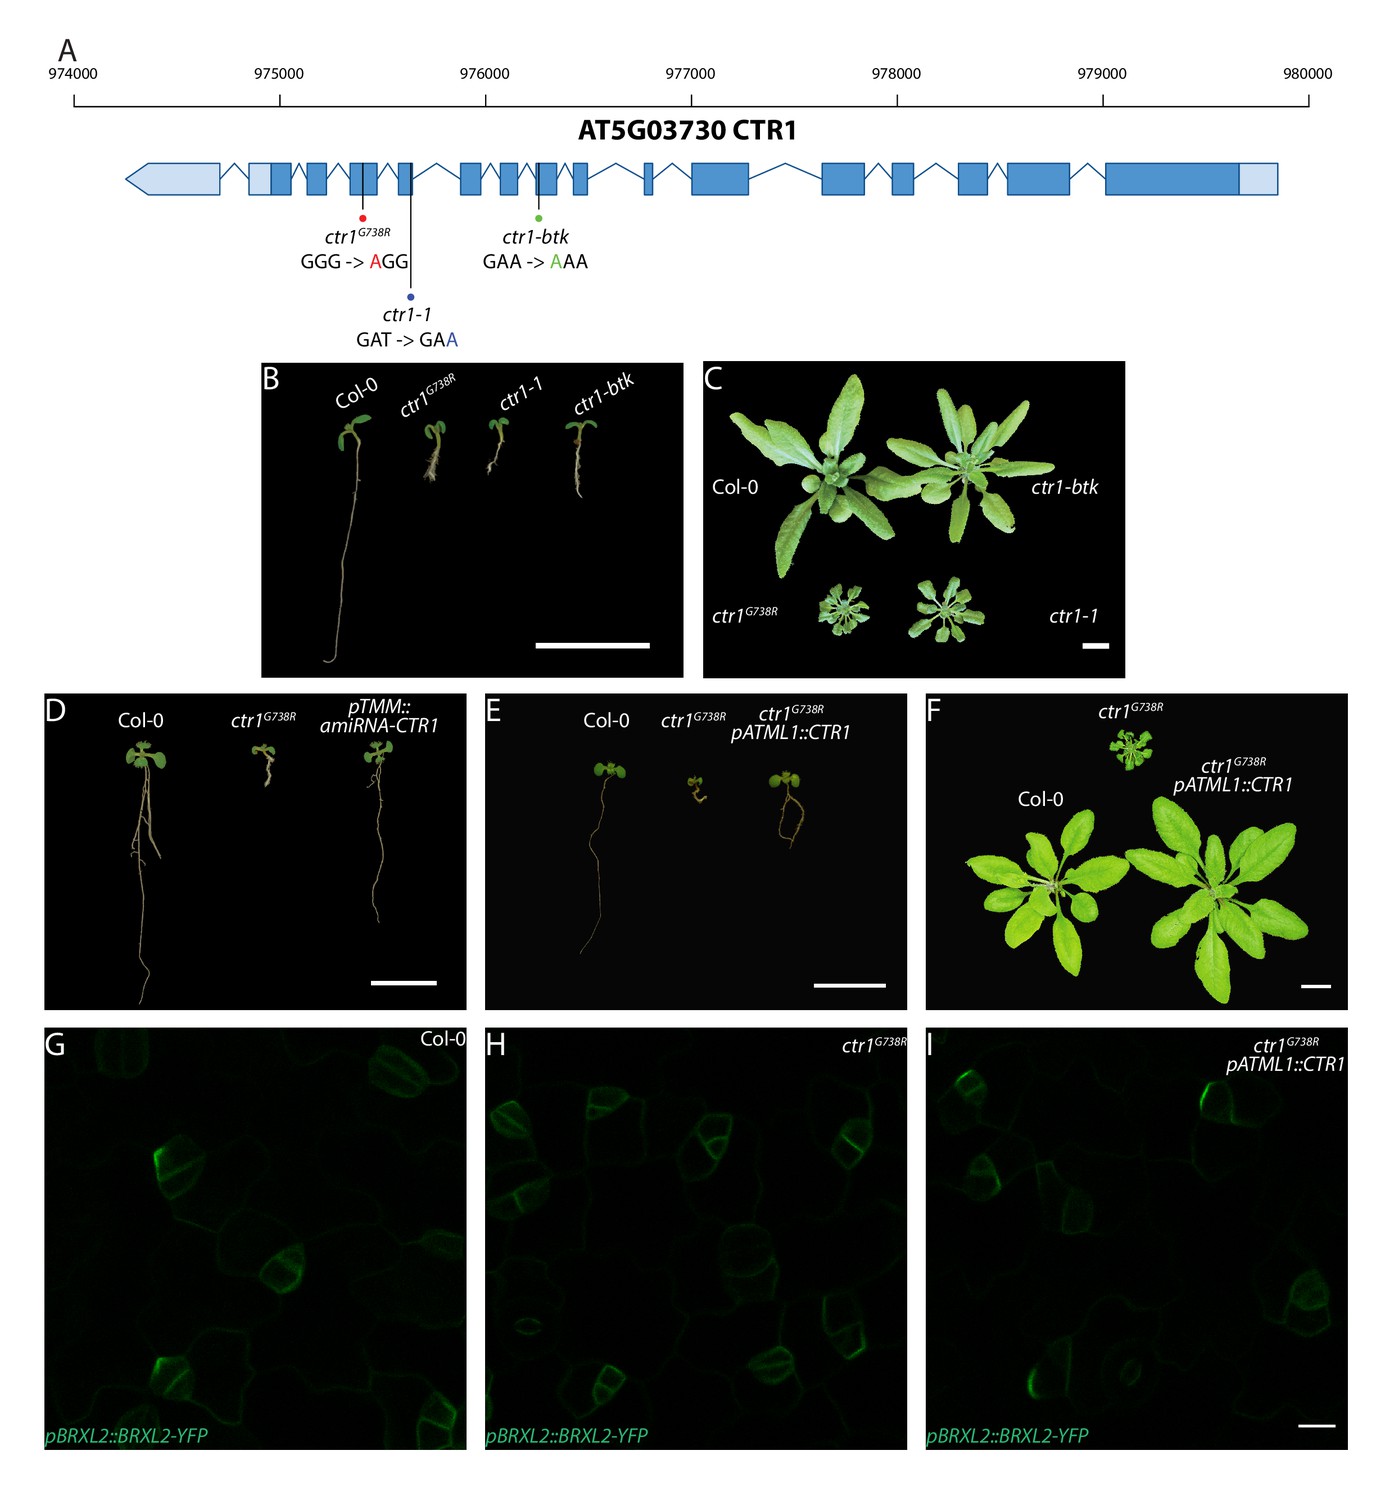
Molecular description of ctr1G738R and other alleles, and whole-plant phenotypes resulting from ctr1 mutants, artificial microRNA knockdown, and shoot epidermal-only expression of CTR1.
(A) Diagram of CTR1 (At5g03730) locus and mutation sites for ctr1G738R, ctr1-1, and ctr1-btk. The ctr1G738R, ctr1-1, and ctr1-btk sites are marked by red, blue, and green dots, respectively, and the corresponding nucleotide substitution site for each of mutations is labeled with the respective color. (B) Phenotypes of 7 dpg Col-0, ctr1G738R, ctr1-1, and ctr1-btk seedlings grown on ½ Murashige and Skoog (MS) media without sugar. (C) Phenotypes of 28 dpg Col-0, ctr1G738R, ctr1-1, and ctr1-btk plants grown on soil. (D) Phenotypes of 10 dpg Col-0, ctr1G738R, and pTMM::amiRNA-CTR1 seedlings grown on ½ MS media without sugar. (E) Phenotypes of 7 dpg Col-0, ctr1G738R, and ctr1G738R pATML1::CTR1 rescue seedlings grown on ½ MS media without sugar. (F) Phenotypes of 28 dpg Col-0, ctr1G738R, and ctr1G738R pATML1::CTR1 rescue seedlings grown on soil. (G–I) Shoot-epidermal expression of CTR1 rescues reduced BRXL2 phenotype in ctr1G738R. Confocal images of pBRXL2::BRXL2-YFP (green) in 4 dpg cotyledons from (G) Col-0, (H) ctr1G738R, and (I) ctr1G738R pATML1::CTR1 rescue grown on ½ MS plates. Scale bar in (B–F), 1 cm; (G–I) 10 µm.
Figure 1—figure supplement 2

Time-lapse imaging of BRXL2 dynamics during stomatal lineage divisions and additional quantification of BRXL2 polarity in Col-0 and ctr1G738R.
(A) Time-lapse confocal imaging of BRXL2 localization during an asymmetric cell division (left) and a consecutive symmetric cell division (right) in Col-0 (top) and ctr1G738R (bottom) cotyledons. pBRXL2::BRXL2-YFP and pATML1::RCI2A-mCherry are shown in green and magenta. Division types are marked by asterisks (guard mother cell [GMC] divisions) and triangles (amplifying divisions), and white numbers in frames indicate hours:minutes relative to first frame. Channel overlays are not shown due to the weak signal of BRXL2-YFP in the depolarizing stomatal lineage ground cell and depolarized GMC/guard cells. (B–D) Quantification of BRXL2 in cells in which it appears polarized. (B) Three example cells from 4 dpg Col-0 and ctr1G738R cotyledons. (C) BRXL2 signal intensity distribution from quantified cells, and (D) the BRXL2 polarity index measurements of these cells. In (C), each thin line represents a single cell and the regression models for both genotypes are shown in thick red lines (n = 10 cells/genotype in C, D). All p-values are calculated by Mann–Whitney test. Scale bar in (A, B), 10 μm.
Figure 1—figure supplement 3
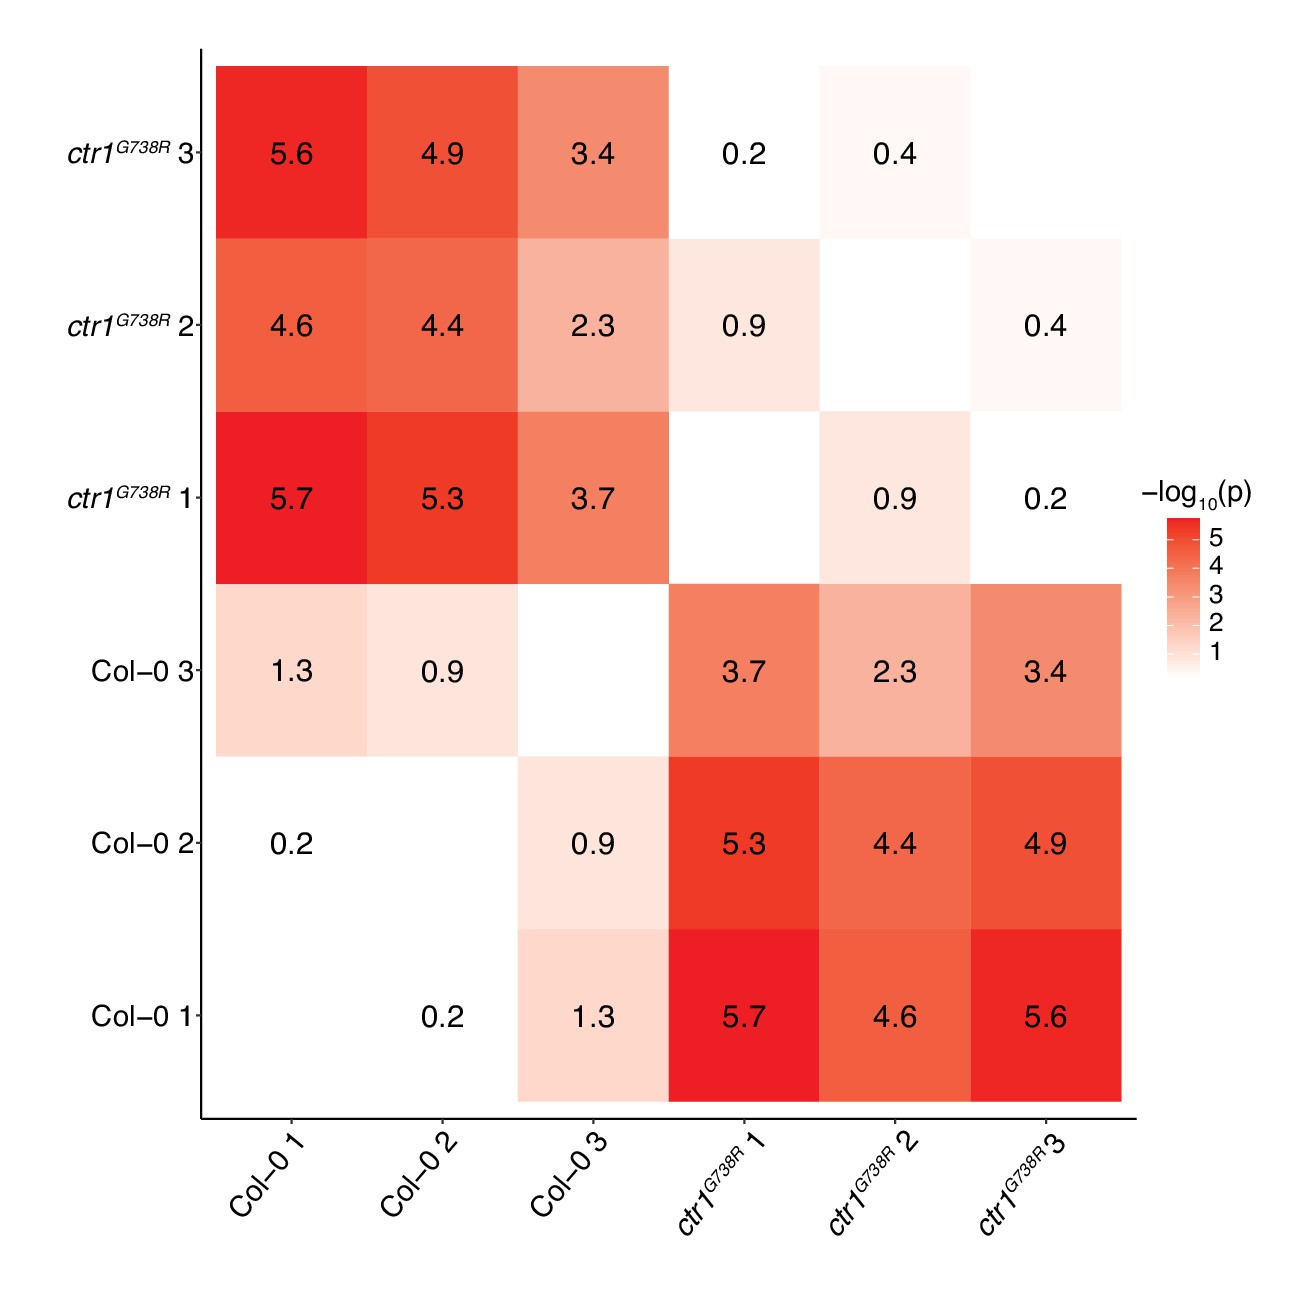
Display of full statistical tests among genotypes and replicates in Figure 1E.
Heatmap representation of p-values calculated by unpaired Mann–Whitney tests of all pairwise comparisons of the BRXL2 polarity index among genotypes and replicates in Figure 1E.
Figure 2 with 1 supplement
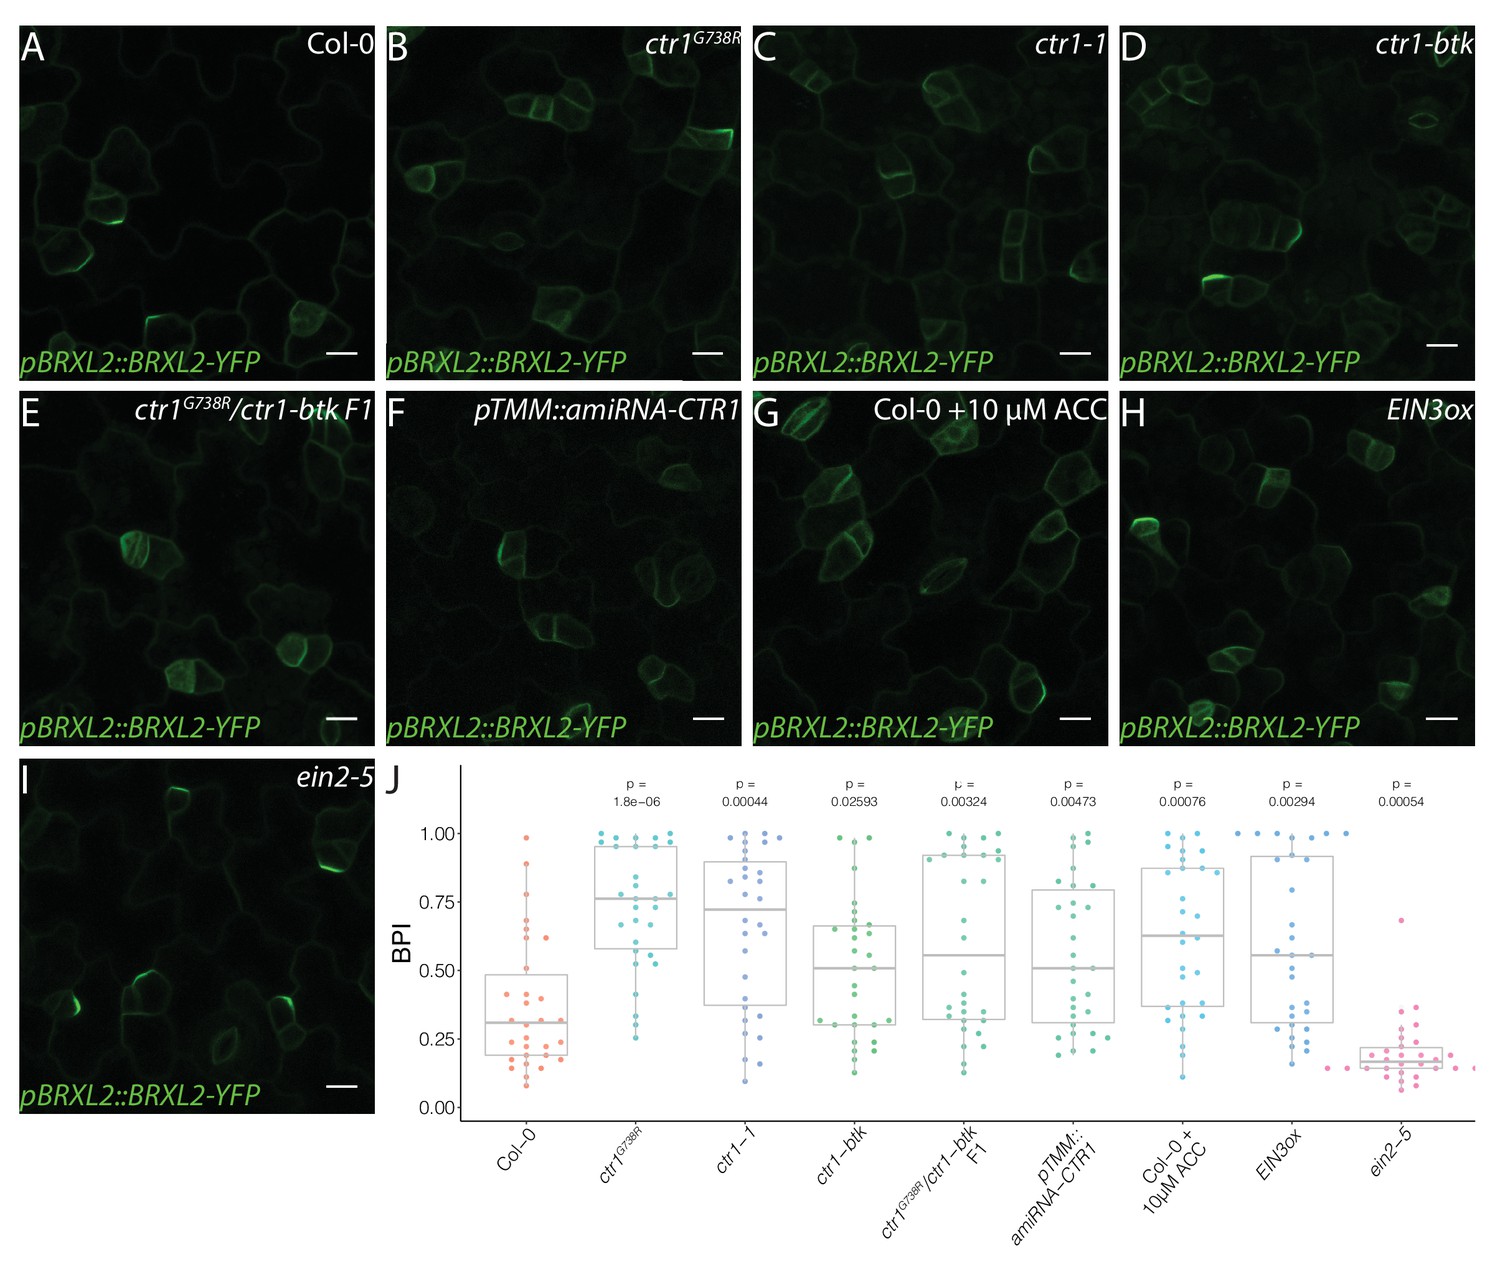
Active ethylene signaling decreases BRXL2 polarity.
(A–I) BRXL2 localization pattern in 4 dpg cotyledons from different ethylene mutants or treatment (pBRXL2::BRXL2-YFP in green). (A) Col-0, (B) ctr1G738R, (C) ctr1-1, (D) ctr1-btk, (E) ctr1G738R/ctr-btk F1, (F) pTMM::amiRNA-CTR1, (G) 10 μM 1-aminocyclopropane-1-carboxylic acid-treated Col-0, (H) EIN3ox, and (I) ein2-5. (J) POME quantifications of BRXL2 polarity index from (A–I) conditions (n = 30 cells/genotype). All p-values are calculated by Mann–Whitney test. Scale bars in (A–I), 10 μm.
Figure 2—figure supplement 1
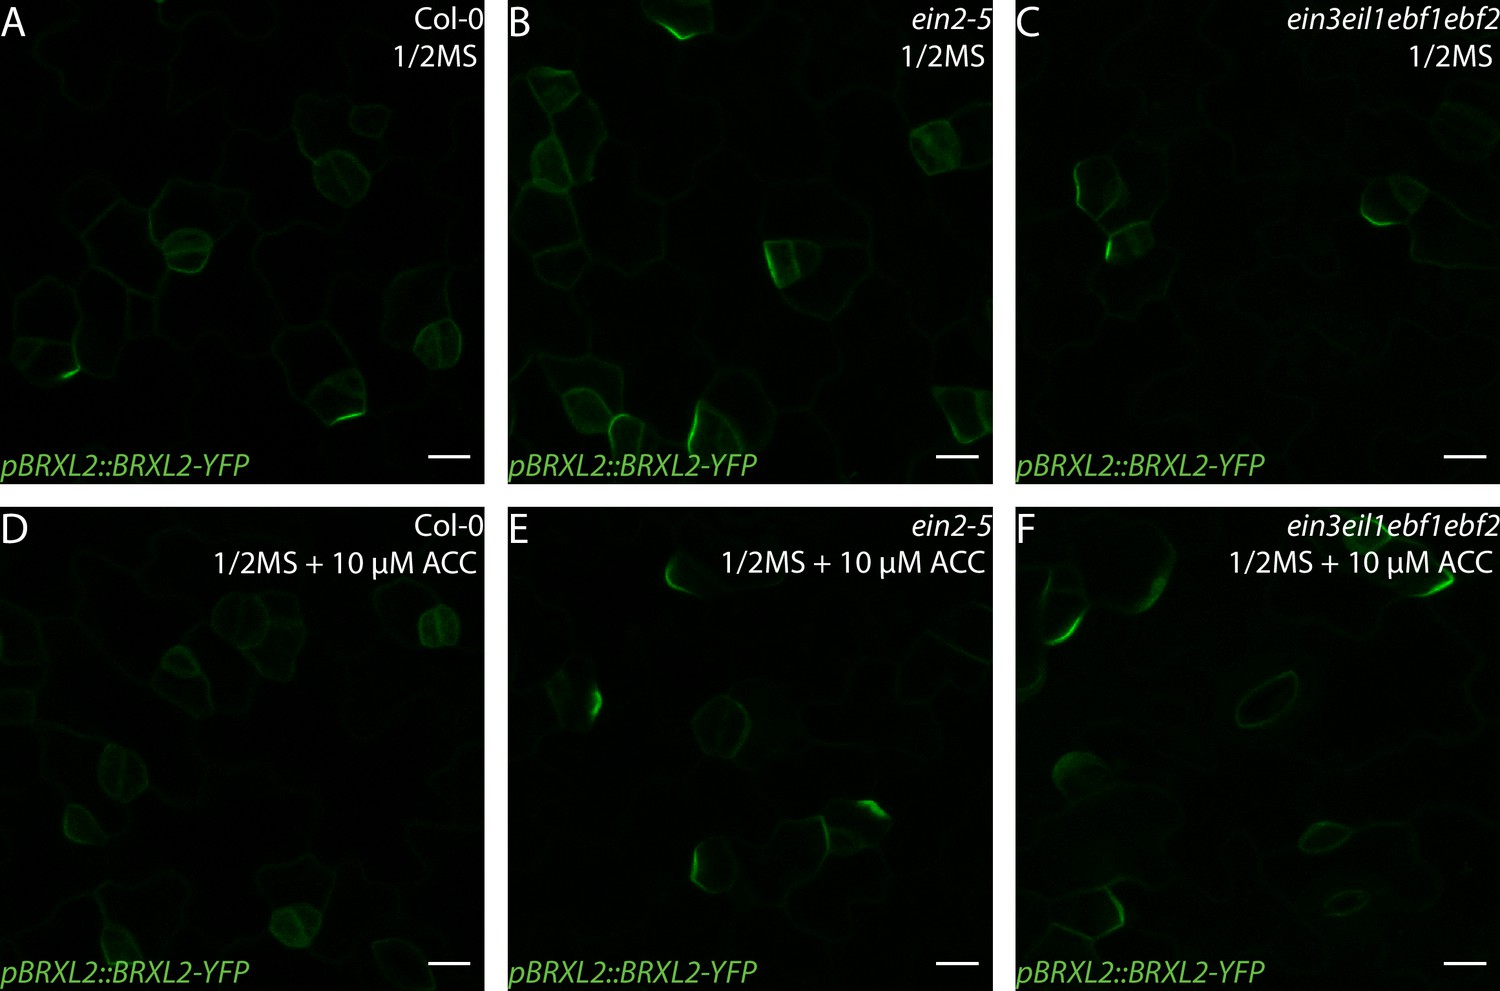
1-Aminocyclopropane-1-carboxylic acid (ACC) does not affect BRXL2 polarity in ethylene-insensitive mutants.
(A–F) Confocal images of pBRXL2::BRXL2-YFP (green) in 4 dpg cotyledons grown on ½ Murashige and Skoog (MS) plates with or without 10 µM ACC. (A, D) Col-0, (B, E) ein2, and (C, F) ctr1-1. (A–C) ½ MS and (D–F) ½ MS + 10 µM ACC. Scale bars in (A–F), 10 µm.
Figure 3 with 1 supplement
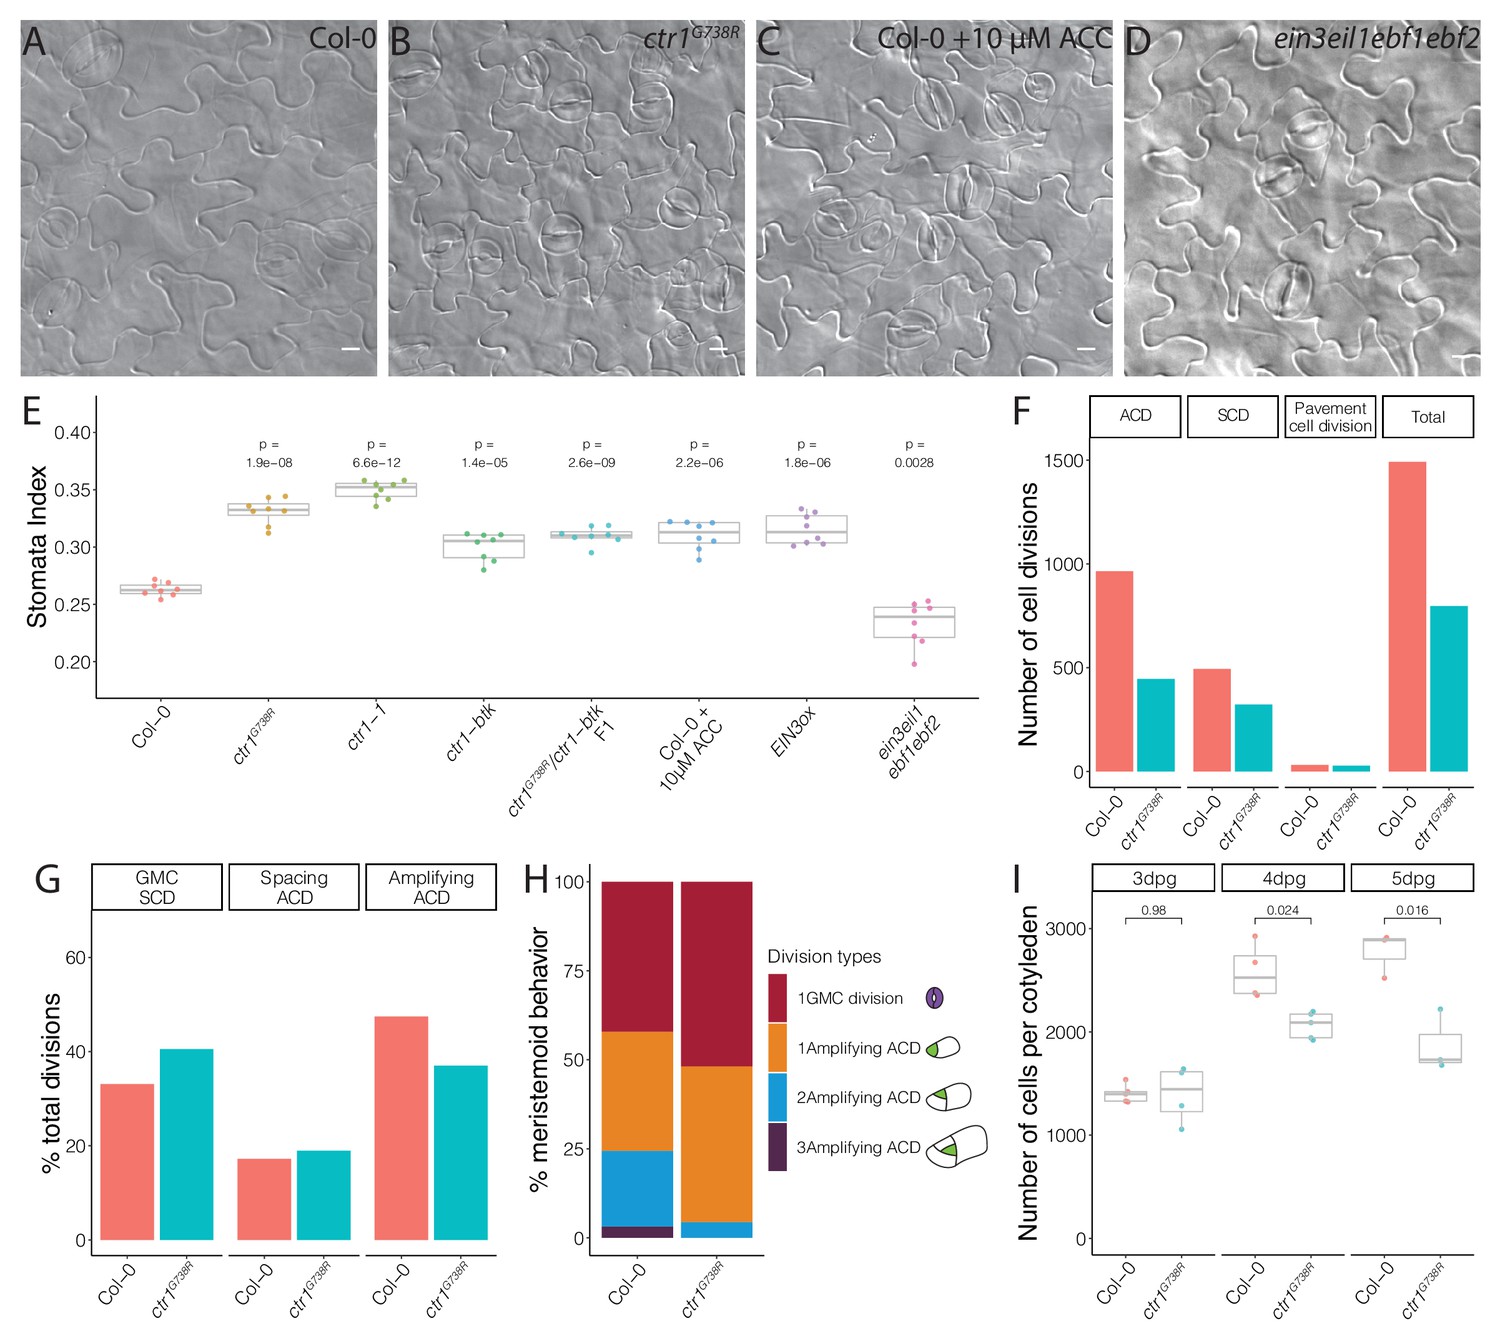
Ethylene signaling modulates the symmetric cell division/asymmetric cell division balance during leaf epidermal development.
(A–D) Differential interference contrast (DIC) images of (A) Col-0, (B) ctr1G738R, (C) 10 μM 1-aminocyclopropane-1-carboxylic acid (ACC)-treated Col-0, and (D) ein3eil1ebf1ebf2 14 dpg cotyledons grown on ½ Murashige and Skoog media without sugar. (E) Quantification of the stomatal index of Col-0, ACC-treated Col-0, and selected ethylene signaling mutants (n = 8/genotype). (F–H) Results of tracing epidermal cell lineages in Col-0 and ctr1G738R cotyledons. (F) Total numbers of different division types tracked. (G) Percentage of each division type among total divisions. (H) Quantification of number of divisions the tracked meristemoids undergo, accompanied by cartoon representation (n > 500 cells/genotype). (I) Total abaxial epidermal cell number in Col-0 and ctr1G738R cotyledons from 3 to 5 dpg (n = 3–5 cotyledons/genotype/day). All p-values are calculated by Student’s t-test due to the small sample sizes. Scale bars in (A–D), 10 μm.
Figure 3—figure supplement 1
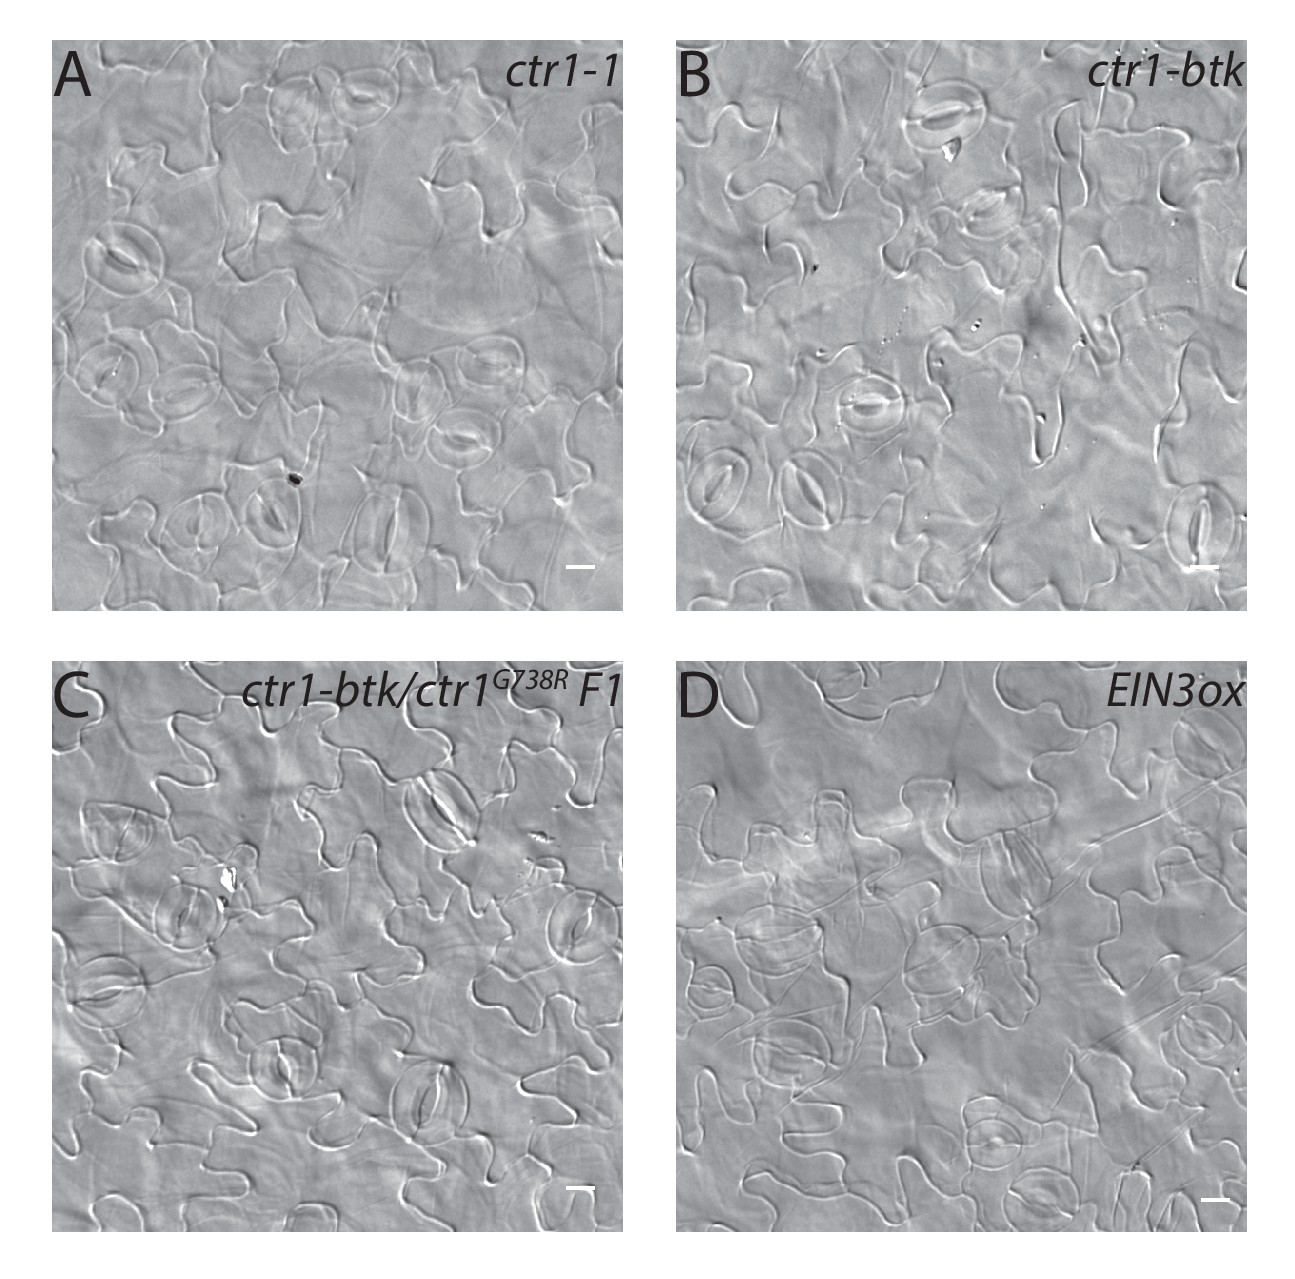
DIC images of cotyledon epidermis of ethylene signaling mutants.
(A–D) DIC images of the epidermis in 14 dpg cotyledons of (A) ctr1-1, (B) ctr1-btk, (C) ctr1-btk/ ctr1G738R F1, and (D) EIN3ox grown on ½ Murashige and Skoog media without sugar. Scale bars in (A–D), 10 µm.
Figure 4 with 2 supplements
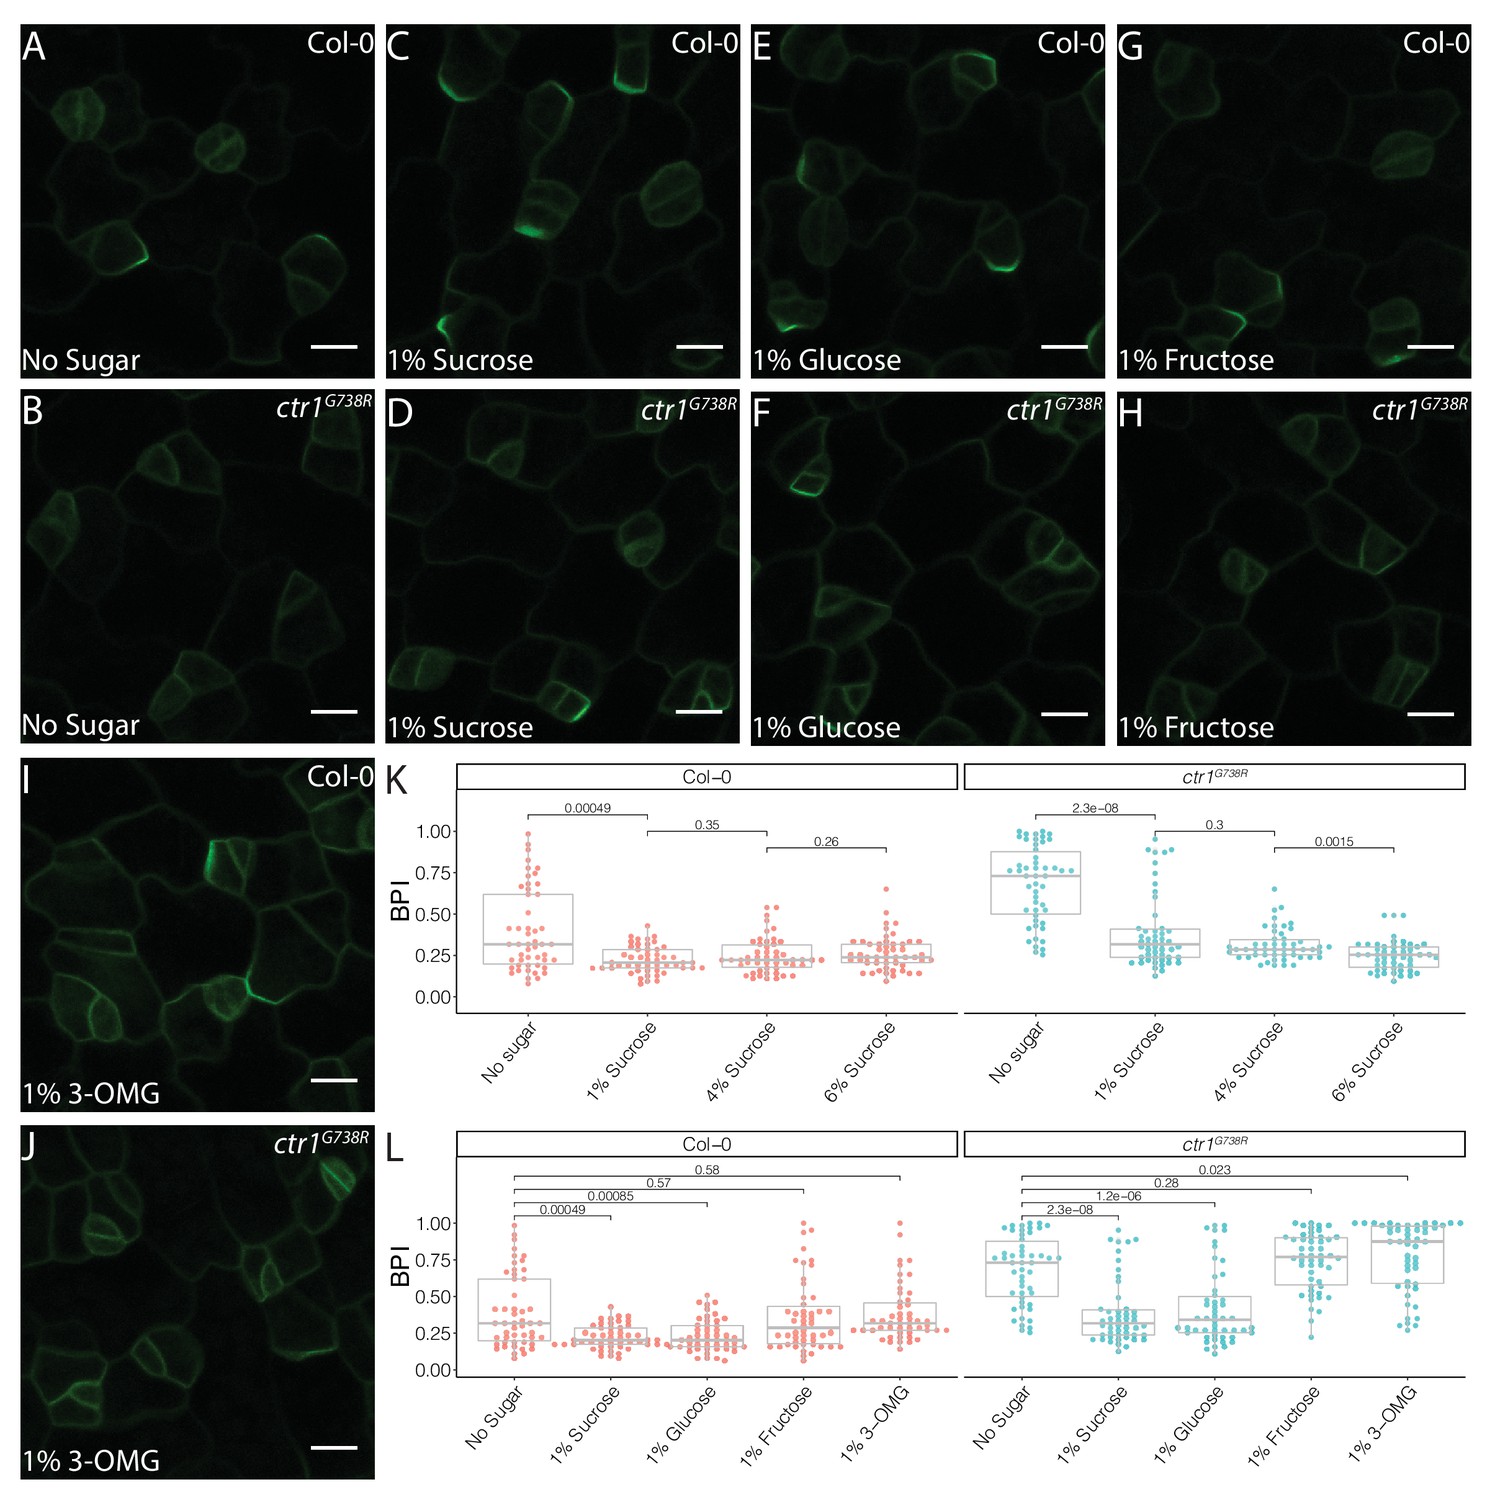
Sucrose and glucose signaling increase BRXL2 polarity.
(A–J) BRXL2 localization pattern in 4 dpg cotyledons grown on ½ Murashige and Skoog (MS) plates with various sugars (pBRXL2::BRXL2-YFP in green). (A, C, E, G, and I) Col-0 and (B, D, F, H, and J) ctr1G738R. (A, B) No sugar, (C, D) 1% sucrose, (E, F) 1% fructose, and (I, J) 1% 3-O-methyl-D-glucose. (K) BRXL2 polarity index (BPI) quantification of Col-0 and ctr1G738R grown on ½ MS plates with different sucrose concentrations (n = 50 cells/genotype). (L) BPI quantification in 4 dpg Col-0 and ctr1G738R seedlings growing on ½ MS plates with various sugars (n = 50 cells/genotype). The same BPI measurements of Col-0 and ctr1G738R from no sugar and 1% sucrose treatment are included in (K) and (L) for easier visual comparison. All p-values are calculated by Mann–Whitney test. Scale bars in (A–J), 10 μm.
Figure 4—figure supplement 1
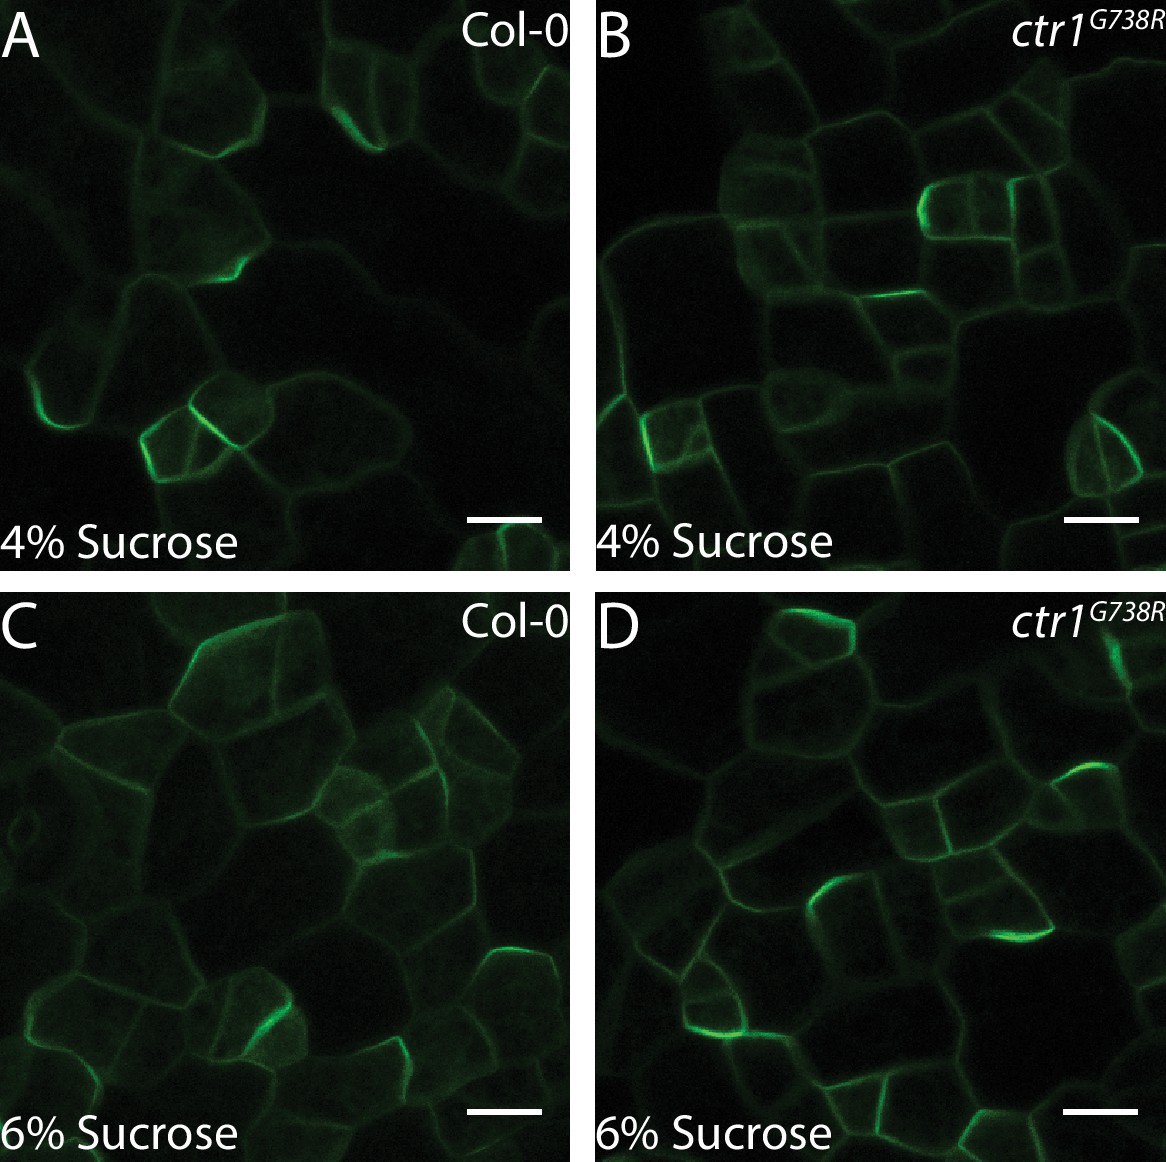
BRXL2 localization of Col-0 and ctr1G738R grown on high levels of sucrose.
(A–D) Confocal images of pBRXL2::BRXL2-YFP (green) in 4 dpg cotyledons grown on ½ Murashige and Skoog (MS) plates with 4% or 6% sucrose. (A, C) Col-0 and (B, D) ctr1G738R. (A, B) ½ MS + 4% sucrose and (C, D) ½ MS + 6% sucrose. Scale bars in (A–D), 10 µm.
Figure 4—figure supplement 2
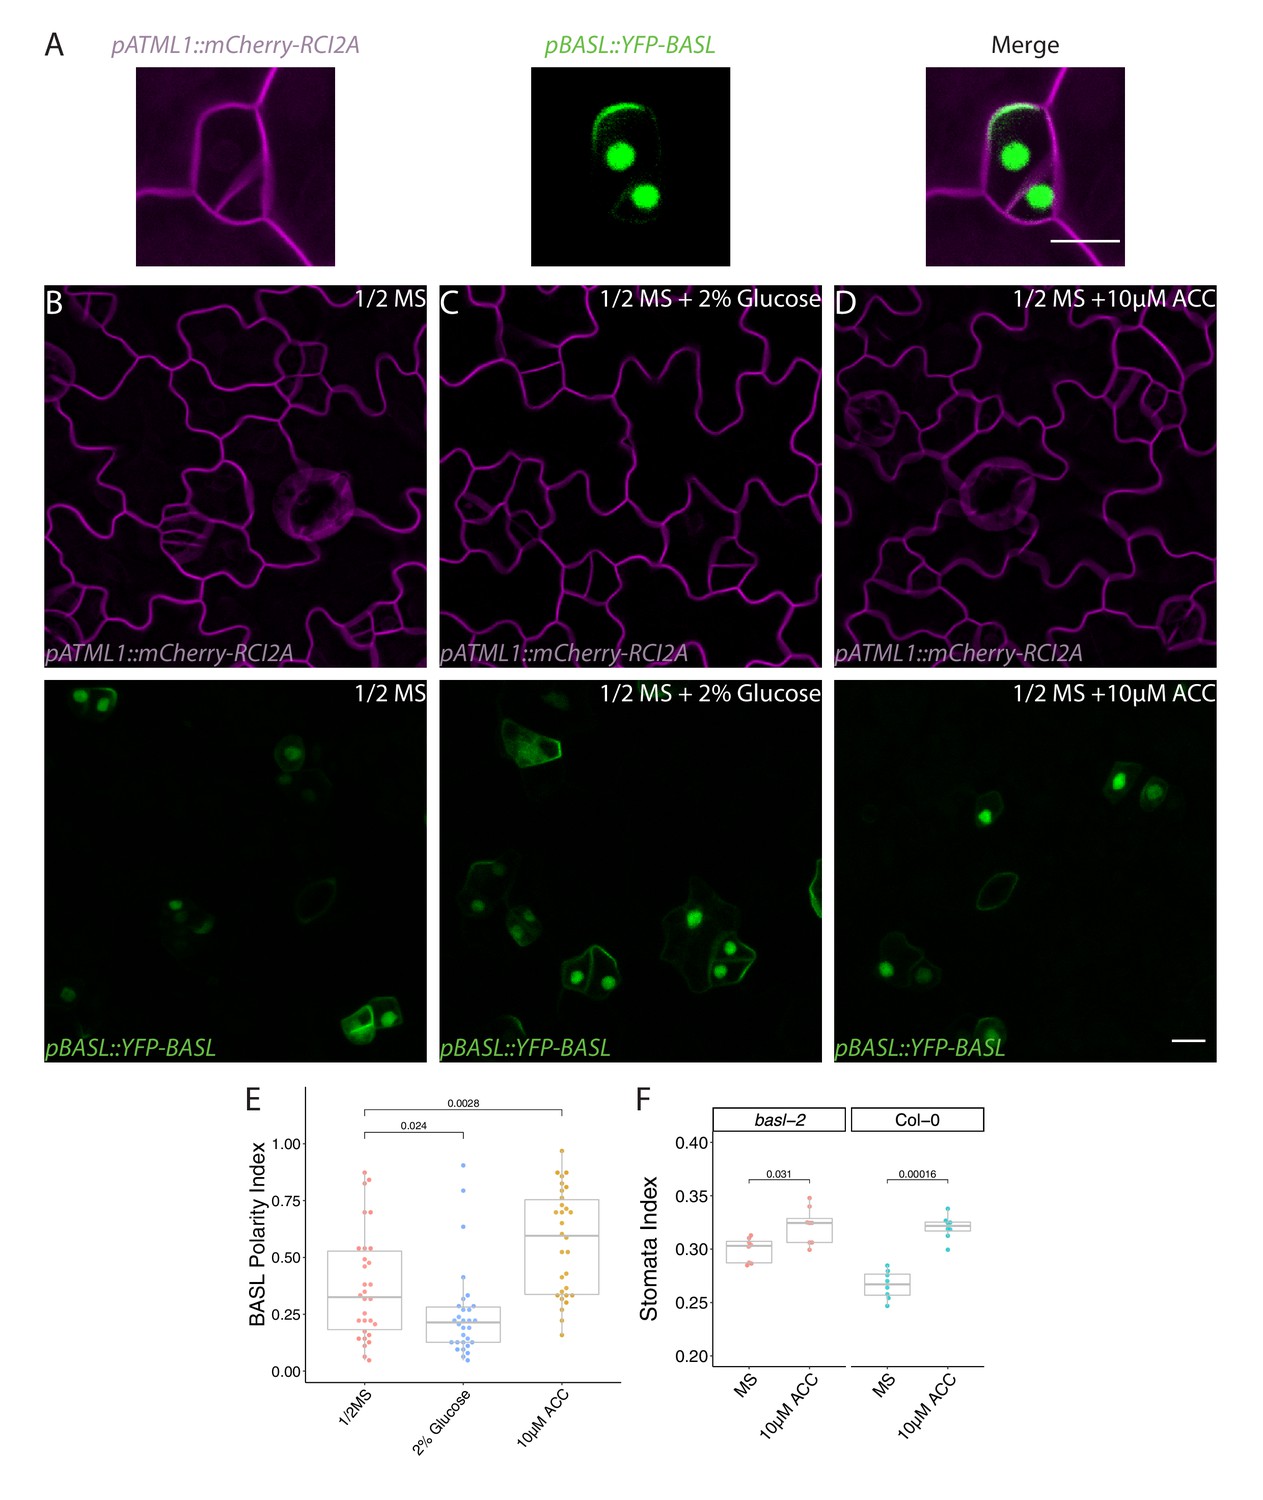
BASL polarity is altered by glucose and ethylene signaling.
(A) Stereotypical BASL localization pattern immediately after asymmetric cell division in Col-0; note nuclear localization in both cells, but polarized BASL only in the larger daughter. pATML1::RCI2A-mCherry (left), pBASL::YFP-BASL (middle), and merged image (right). (B–D) Confocal images of pBASL::YFP-BASL (green, bottom) and pATML1:: pATML1::RCI2A-mCherry (magenta, top) in 4 dpg cotyledons (Col-0) grown on (B) ½ Murashige and Skoog (MS) plates (left), (C) ½ MS plates with 2% glucose (middle), and (D) ½ MS plates with 10 µM 1-aminocyclopropane-1-carboxylic acid (ACC) (right). (E) Quantification of BASL polarity index (defined the same as BPI) of stomatal lineage cells from conditions in (B–D). (F) Stomatal index of 14 dpg cotyledons of Col-0 or basl-2 germinated on ½ MS plates or ½ MS plates with 10 µM ACC (n = 8/genotype). p-Values are calculated by Mann–Whitney test. Scale bar, 10 µm.
Figure 5 with 5 supplements

Glucose promotes amplifying asymmetric cell divisions independent of ethylene signaling and HXK1- or TOR-mediated glucose signaling pathways.
(A) Cartoon of types of divisions meristemoids undergo, and fraction of each type in Col-0, ctr1G738R, Col-0 with 2% glucose treatment, and ctr1G738R with 2% glucose treatment (n > 500 cells/condition). Data for the no sugar condition of Col-0 and ctr1G738R are also reported in Figure 3H. (B) Stomatal index of 14 dpg Col-0 and ctr1G738R growing on ½ Murashige and Skoog (MS) plates or 2% glucose ½ MS plates (n = 8/condition). (C) BRXL2 polarity index (BPI) quantification of 4.5 dpg abaxial cotyledons of Col-0, ein2-5, and ein3eil1ebf1ebf2 grown on ½ MS plates or 2% glucose ½ MS plates (n = 30 cells/genotype). (D) BPI quantification of 4 dpg abaxial cotyledons of Ler-0 and gin2 grown on ½ MS plates or 2% glucose ½ MS plates (n = 45 cells/genotype). (E) BPI quantification in 4 dpg Col-0 treated with TOR inhibitor AZD8055 and/or 2% glucose (n = 30 cells/genotype). (F) BPI quantification of true leaves in 9 dpg Col-0 seedlings 110 μE normal light condition for 7 days and then transferred to different low light intensity conditions for 48 hr (n = 30 cells/genotype). All p-values are calculated by Mann–Whitney test.
Figure 5—figure supplement 1
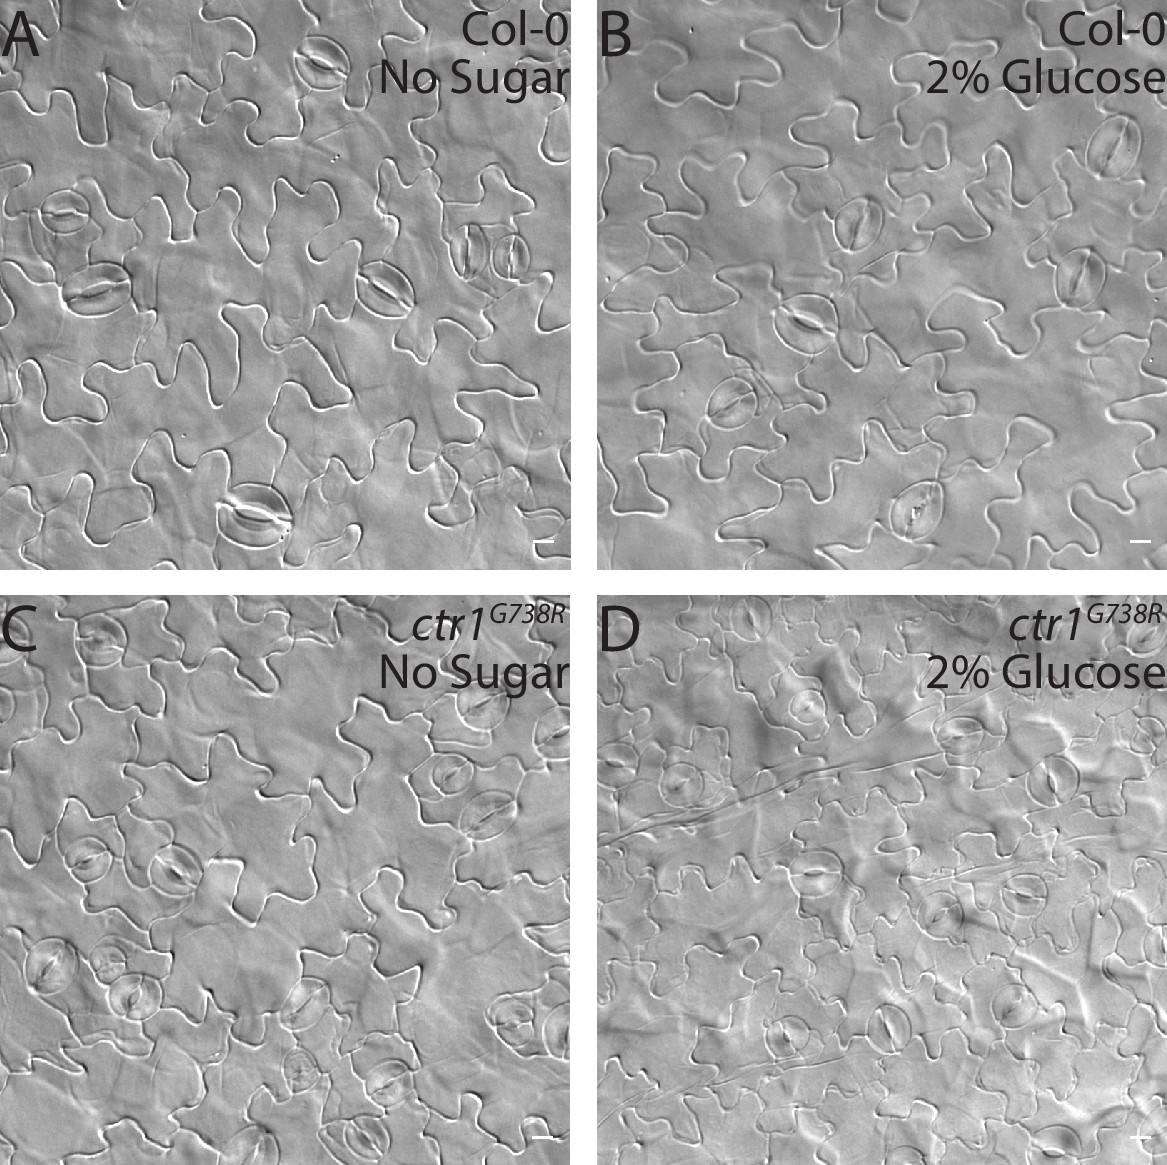
DIC images of cotyledons from seedlings grown on ½ Murashige and Skoog (MS) media with or without 2% glucose.
(A–D) DIC images of the epidermis in 14 dpg cotyledons grown on ½ MS media with or without 2% glucose. (A, B) Col-0 and (C, D) ctr1G738R. (A, C) ½ MS and (B, D) ½ MS + 2% glucose. Scale bars in (A–D), 10 µm.
Figure 5—figure supplement 2
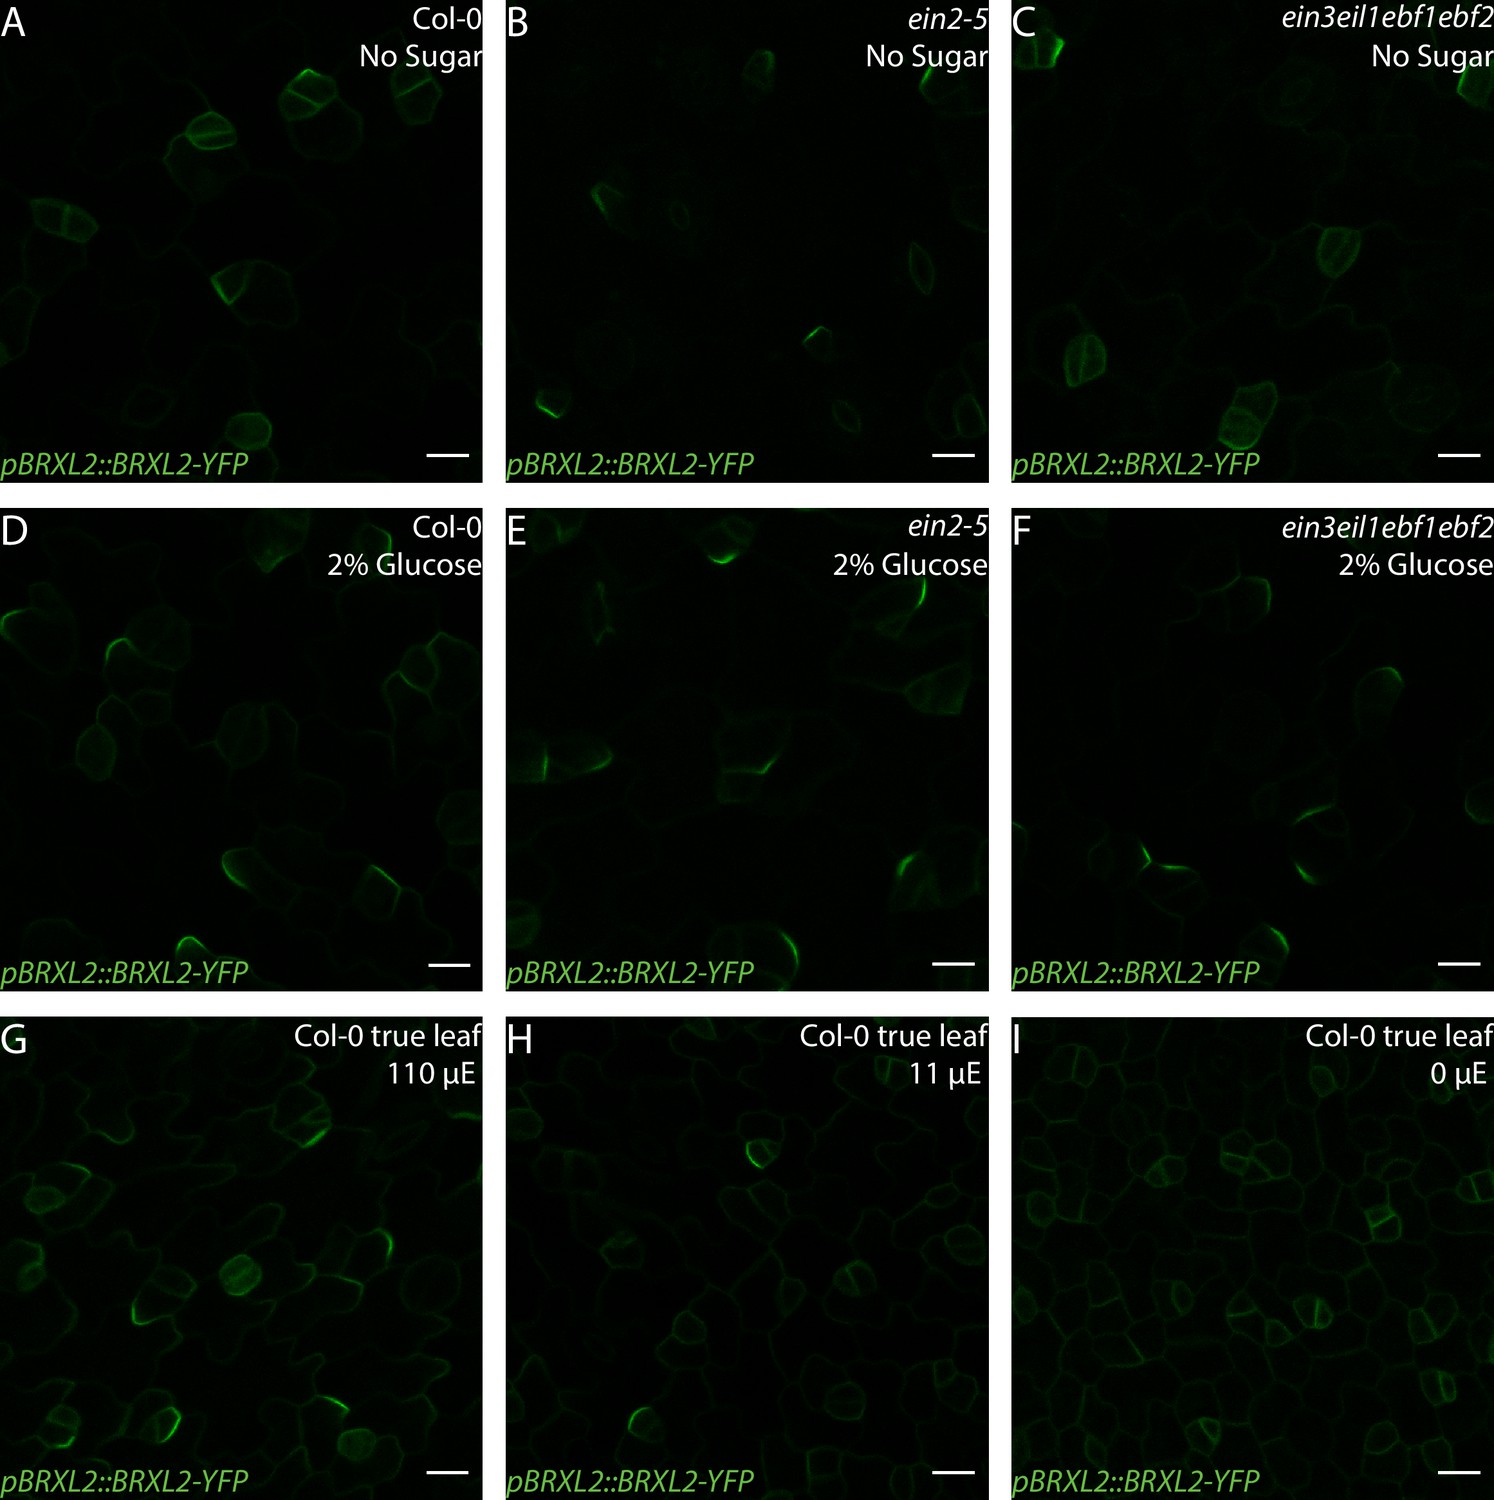
BRXL2 localization pattern in Col-0 and ethylene-insensitive mutants under different light and sugar treatment regimes.
(A–F) Confocal images of pBRXL2::BRXL2-YFP (green) in 4 dpg cotyledons grown on ½ Murashige and Skoog (MS) plates with or without 2% glucose. (A, D) Col-0, (B, E) ein2, and (C, F) ein3eil1ebf1ebf2. (A–C) ½ MS and (D–F) ½ MS + 2% glucose. POME quantifications of BRXL2 polarity index (BPI) from (A–F) are shown in Figure 5C. (G–I) BRXL2 in 9 dpg Col-0 true leaves grown on ½ MS plates under different light condition. Col-0 seedlings are grown under 110 μE normal light condition for 7 days and then transferred to different light intensity conditions for 2 days. Light intensity in (G–I): (G) 110 µE, (H) 11 µE, and (I) 0 µE. POME quantifications of BPI from (G–I) are shown in Figure 5F. Scale bars in (A–I), 10 µm.
Figure 5—figure supplement 3

Glucose control of BRXL2 polarity is independent of HXK1 signaling.
(A–H) Confocal images of pBRXL2::BRXL2-YFP (green) in 4 dpg cotyledons of different hxk1 mutants and their corresponding wild-type controls grown on ½ Murashige and Skoog (MS) plates with or without 2% glucose. (A, B) Ler-0, (C, D) gin2, (E, F) Col-0, and (G, H) hxk1-3. (A, C, E, and G) ½ MS and (B, D, F, and H) ½ MS + 2% glucose. POME quantifications of BRXL2 polarity index (BPI) from (A–D) are shown in Figure 5D. Membrane staining (PI) or labeling (pATML1::mCherry-RCI2A) is shown in magenta. (I) POME quantifications of BPI from (E–H) (n = 30 cells/genotype). (J) qRT-PCR analysis of HXK1 transcript level in 7 dpg Col-0 and hxk1-3 seedlings. Relative transcript level of HXK1 5′ end (left plot) and 3′ end (right plot) is shown. Expression values are normalized to the control gene UBC21 and are relative to the expression of first Col-0 replicate. All p-values are calculated by Mann–Whitney test. Scale bars in (A–H), 10 µm.
Figure 5—figure supplement 4
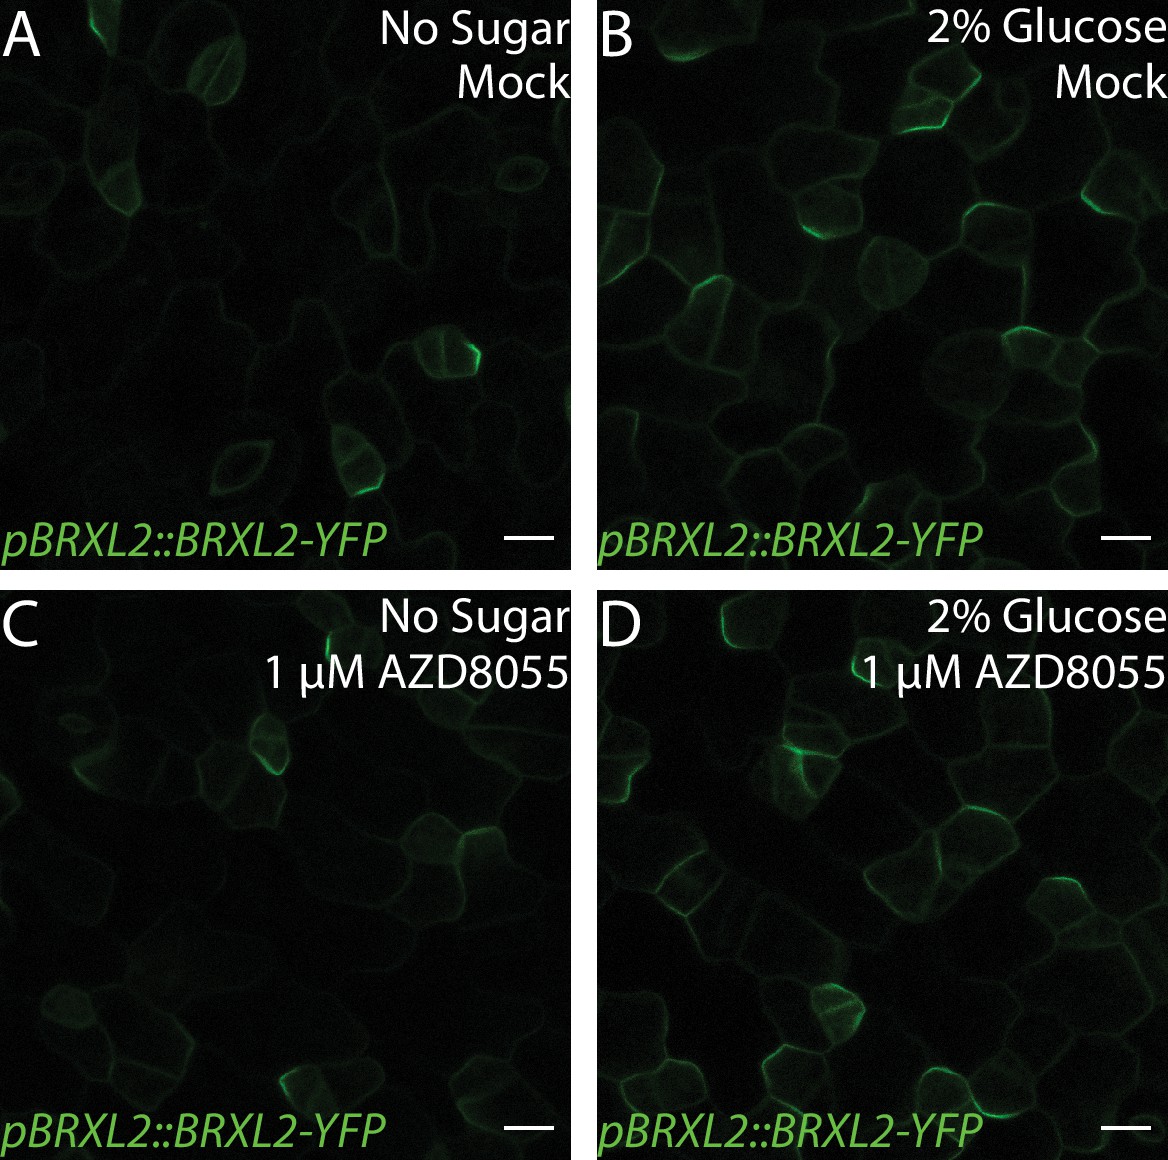
Glucose control of BRXL2 polarity is independent of TOR signaling.
(A–D) BRXL2 localization pattern in 4 dpg Col-0 treated with TOR inhibitor AZD8055 and/or 2% glucose. (A, C) ½ Murashige and Skoog (MS) and (B, D) ½ MS + 2% glucose. (A, B) Mock treatment and (C, D) 1 µM AZD8055 treatment. POME quantifications of BRXL2 polarity index from (A–D) are shown in Figure 5E. Scale bars in (A–D), 10 µm.
Figure 5—figure supplement 5
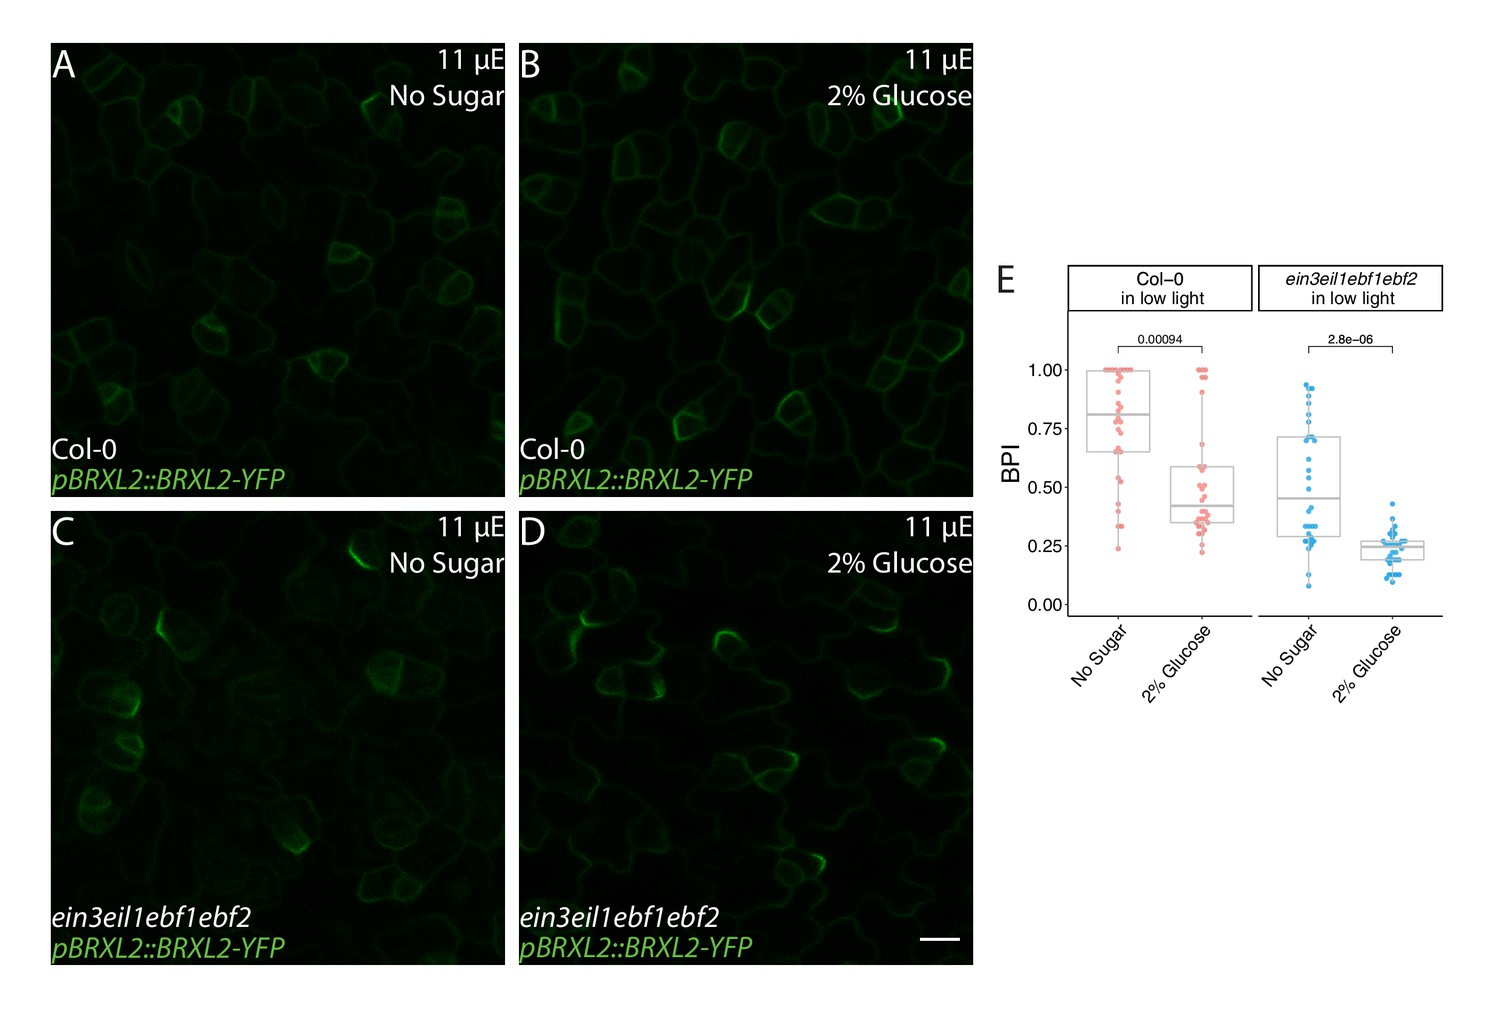
Glucose increases BRXL2 polarity in Col-0 and ein3eil1ebf1ebf2 true leaves grown under low-light condition.
(A–D) Confocal images of pBRXL2::BRXL2-YFP (green) at 9 dpg from (A, B) Col-0 and (C, D) ein3eil1ebf1ebf2 seedlings grown for 7 days on ½ Murashige and Skoog (MS) plates without sugar under 110 μE normal light condition, then transferred to (A, C) ½ MS plates without sugar or (B, D) ½ MS plates with 2% glucose and grown under 11 μE low-light-intensity conditions for two more days before measurement. (E) POME quantifications of BRXL2 polarity index from (A–D). All p-values are calculated by Mann–Whitney test. Scale bar, 10 µm.
Figure 6 with 1 supplement
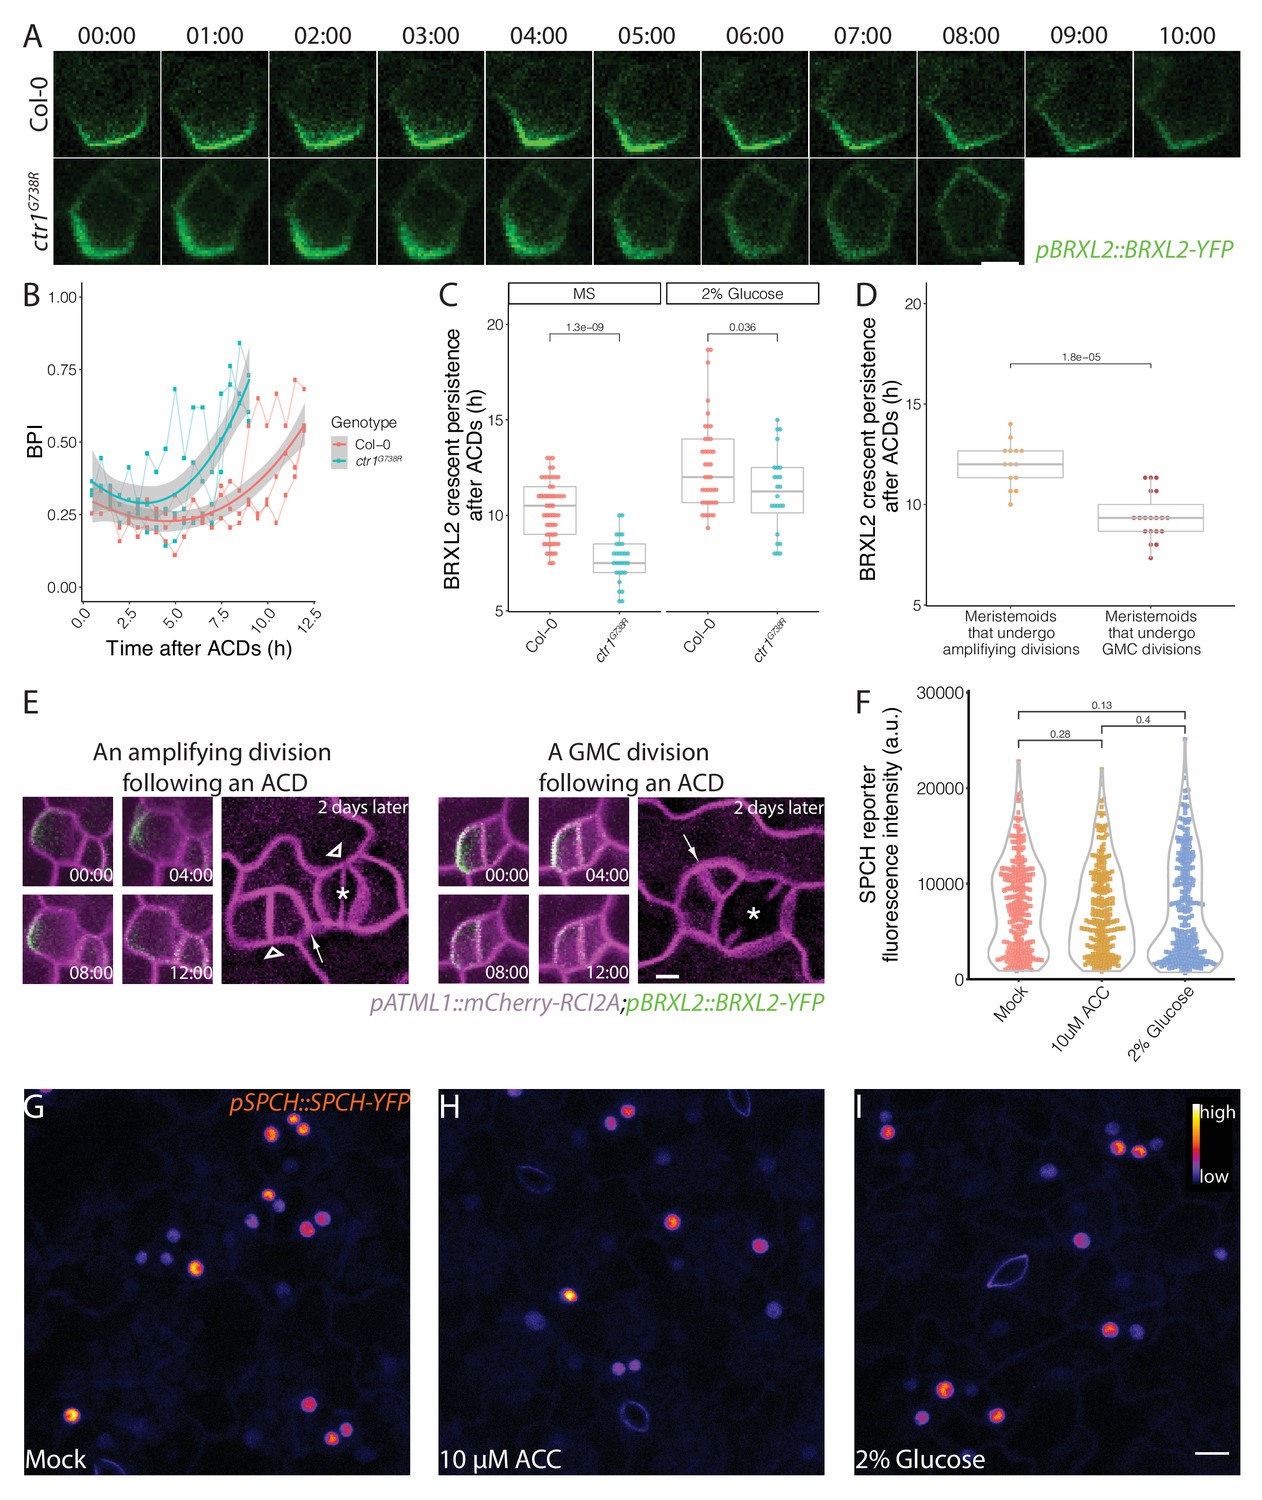
Post-division persistence of BRXL2 polarity is associated with meristemoid fate determinacy.
(A) Time-lapse images of post-asymmetric cell division (ACD) BRXL2 dynamics from stomatal lineage ground cells (SLGCs) in Col-0 and ctr1G738R cotyledons (3 dpg). 00:00 (hours:minutes) marks cell plate formation. (B) Quantification of BRXL2 polarity dynamics after ACDs in Col-0 and ctr1G738R. Individual measurement per each cell (n = 3 cells per genotype) shown in thin lines and the respective trend per each genotype with 0.95 confidence interval is indicated as the thick line with gray band. (C) Persistence of BRXL2 post-ACD in SLGCs from 3 dpg Col-0 and ctr1G738R grown in ½ Murashige and Skoog (MS) media or ½ MS media with 2% glucose. (D) Relationship between persistence of BRXL2 in SLGCs and division behavior of their meristemoid sisters. (E) Examples of division behaviors quantified in (D). Time-lapse analysis of BRXL2 polarity in 3 dpg Col-0 cotyledons followed by lineage tracing. BRXL2 was imaged every 40 min for 16 hr, then plants returned to ½ MS plate for 48 hr, then reimaged to capture divisions and fate of the BRXL2-expressing cells. Different division types are marked with asterisks (GMC division), triangles (amplifying division), and arrows (spacing divisions). (F–I) Evidence that ethylene and glucose signaling does not affect SPCH level in individual stomatal lineage cells. (F) Quantification of gSPCH reporter fluorescence intensity at 4 dpg in (G) mock, (H) 10 μM 1-aminocyclopropane-1-carboxylic acid, and (I) 2% glucose-treated Col-0 cotyledons (n = 3 cotyledons/treatment; n > 120 cells/treatment). Lookup table Fire is used to false color gSPCH reporter intensity (color key in figure). All p-values are calculated by Mann–Whitney test. Scale bars in (A, E), 5 μm; (I), 10 μm.
Figure 6—figure supplement 1
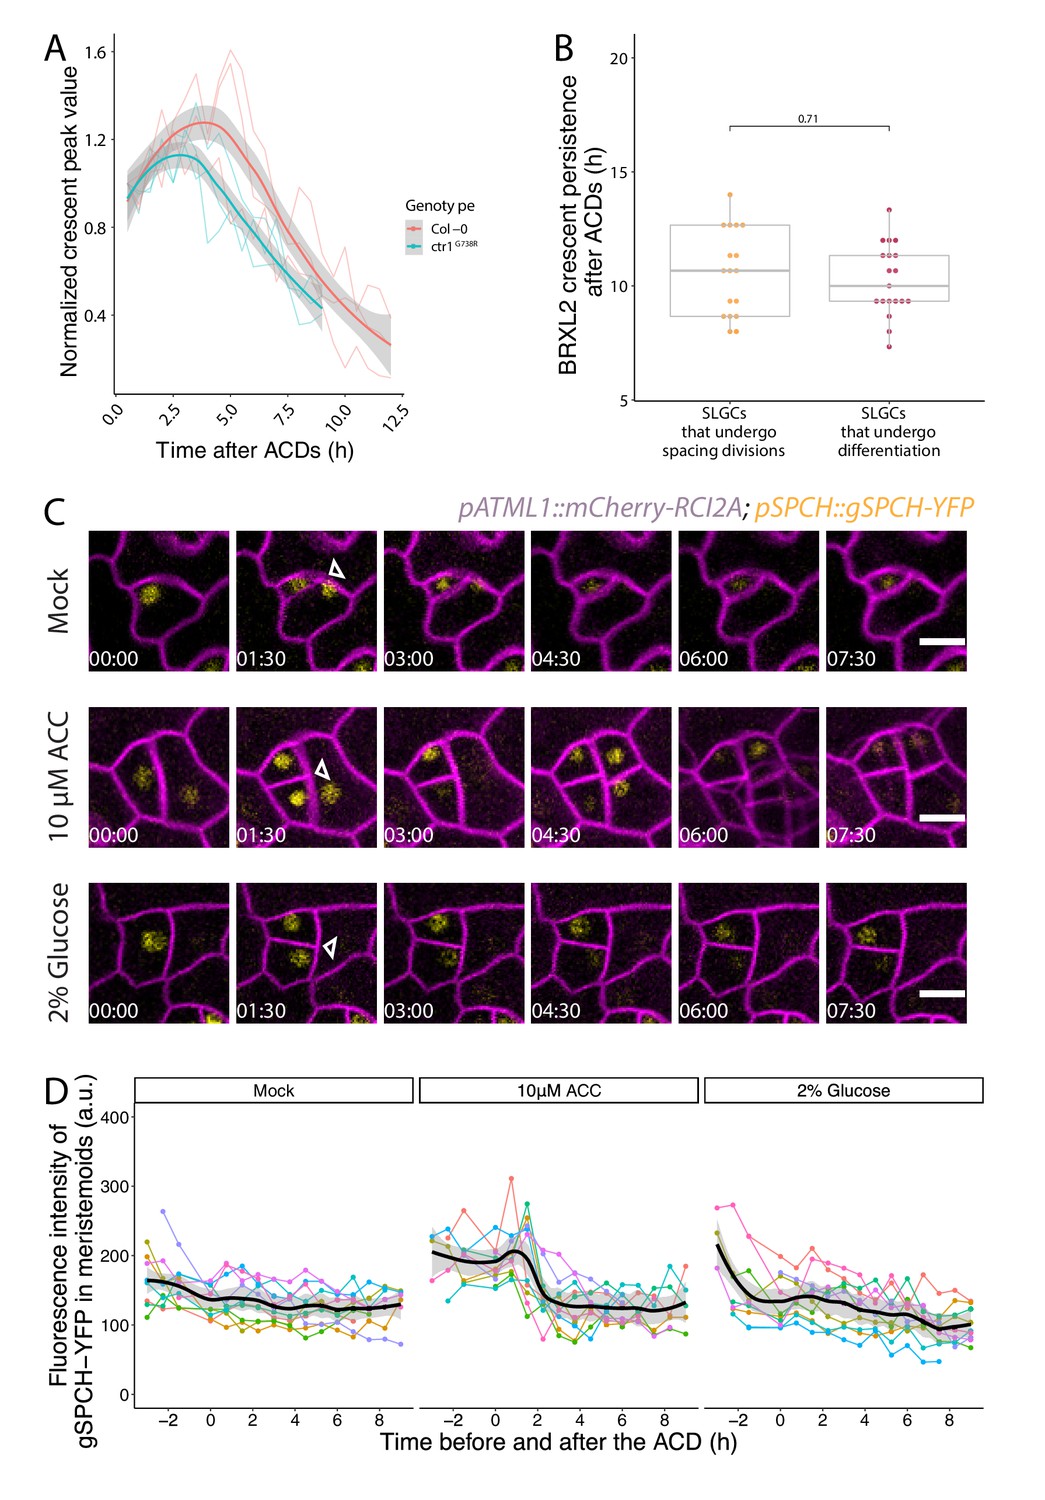
Additional characterization of BRXL2 and SPCH dynamics during asymmetric cell divisions (ACDs).
(A) Normalized peak value of BRXL2 crescents measured by POME over time from cells in Col-0 and ctr1G738R (n = 3). Individual measurements per cell are shown in thin lines, and the respective trend per each genotype with 0.95 confidence interval is indicated as the thick line with gray band. BRXL2 polarity index measurements of the same cells are shown in Figure 6B. (B) Persistence of post-asymmetric cell division (ACD) BRXL2 in stomatal lineage ground cells grouped based on whether they undergo spacing divisions or differentiation (no spacing division). (C) Time-lapse images of SPCH dynamics in 3 dpg mock, 10 µM 1-aminocyclopropane-1-carboxylic acid (ACC), or 2% glucose-treated Col-0 seedlings. pSPCH::gSPCH-YFP and pATML1::RCI2A-mCherry are shown in yellow and magenta. Each cell division is marked by a triangle, and white numbers in frames indicate hours:minutes relative to first frame. (D) Quantification of gSPCH-YFP reporter dynamics during ACDs under mock, 10 µM ACC, or 2% glucose treatment. gSPCH-YFP reporter intensity is tracked with TrackMate (Tinevez et al., 2017) during 10 ACDs (thin colored lines), and the respective trend per each condition with 0.95 confidence interval is indicated as the thick line with gray band. All p-values are calculated by Mann–Whitney tests. Scale bars in (C), 10 µm.
Figure 7

Models at organ and cell scales for connection between systemic signaling, cell polarity, stomatal stem-cell potential, and leaf growth.
(A) Schematic representation of the regulation of ethylene and glucose on amplifying divisions in meristemoids. Potential regulatory mechanisms used by these signals are illustrated in dashed box. (B) Schematic representation of modes of communication possible between stomatal lineage ground cells and meristemoids during polarity and cell division control.
Author response image 1

Liquid culture significantly alters epidermal development.
(A) Confocal images of 4 dpg Col-0 cotyledons grown on regular ½ MS plates (top) and in ½ MS liquid culture (bottom). Cell outline is visualized with pATML1::RCI2A-mCherry (gray). (B-C) Quantification of cotyledon surface area (B) and total cell numbers (C) from cotyledons shown in A. All p-values are calculated by Student’s t- test. Scale bars in A, 50 μm.
Author response image 2
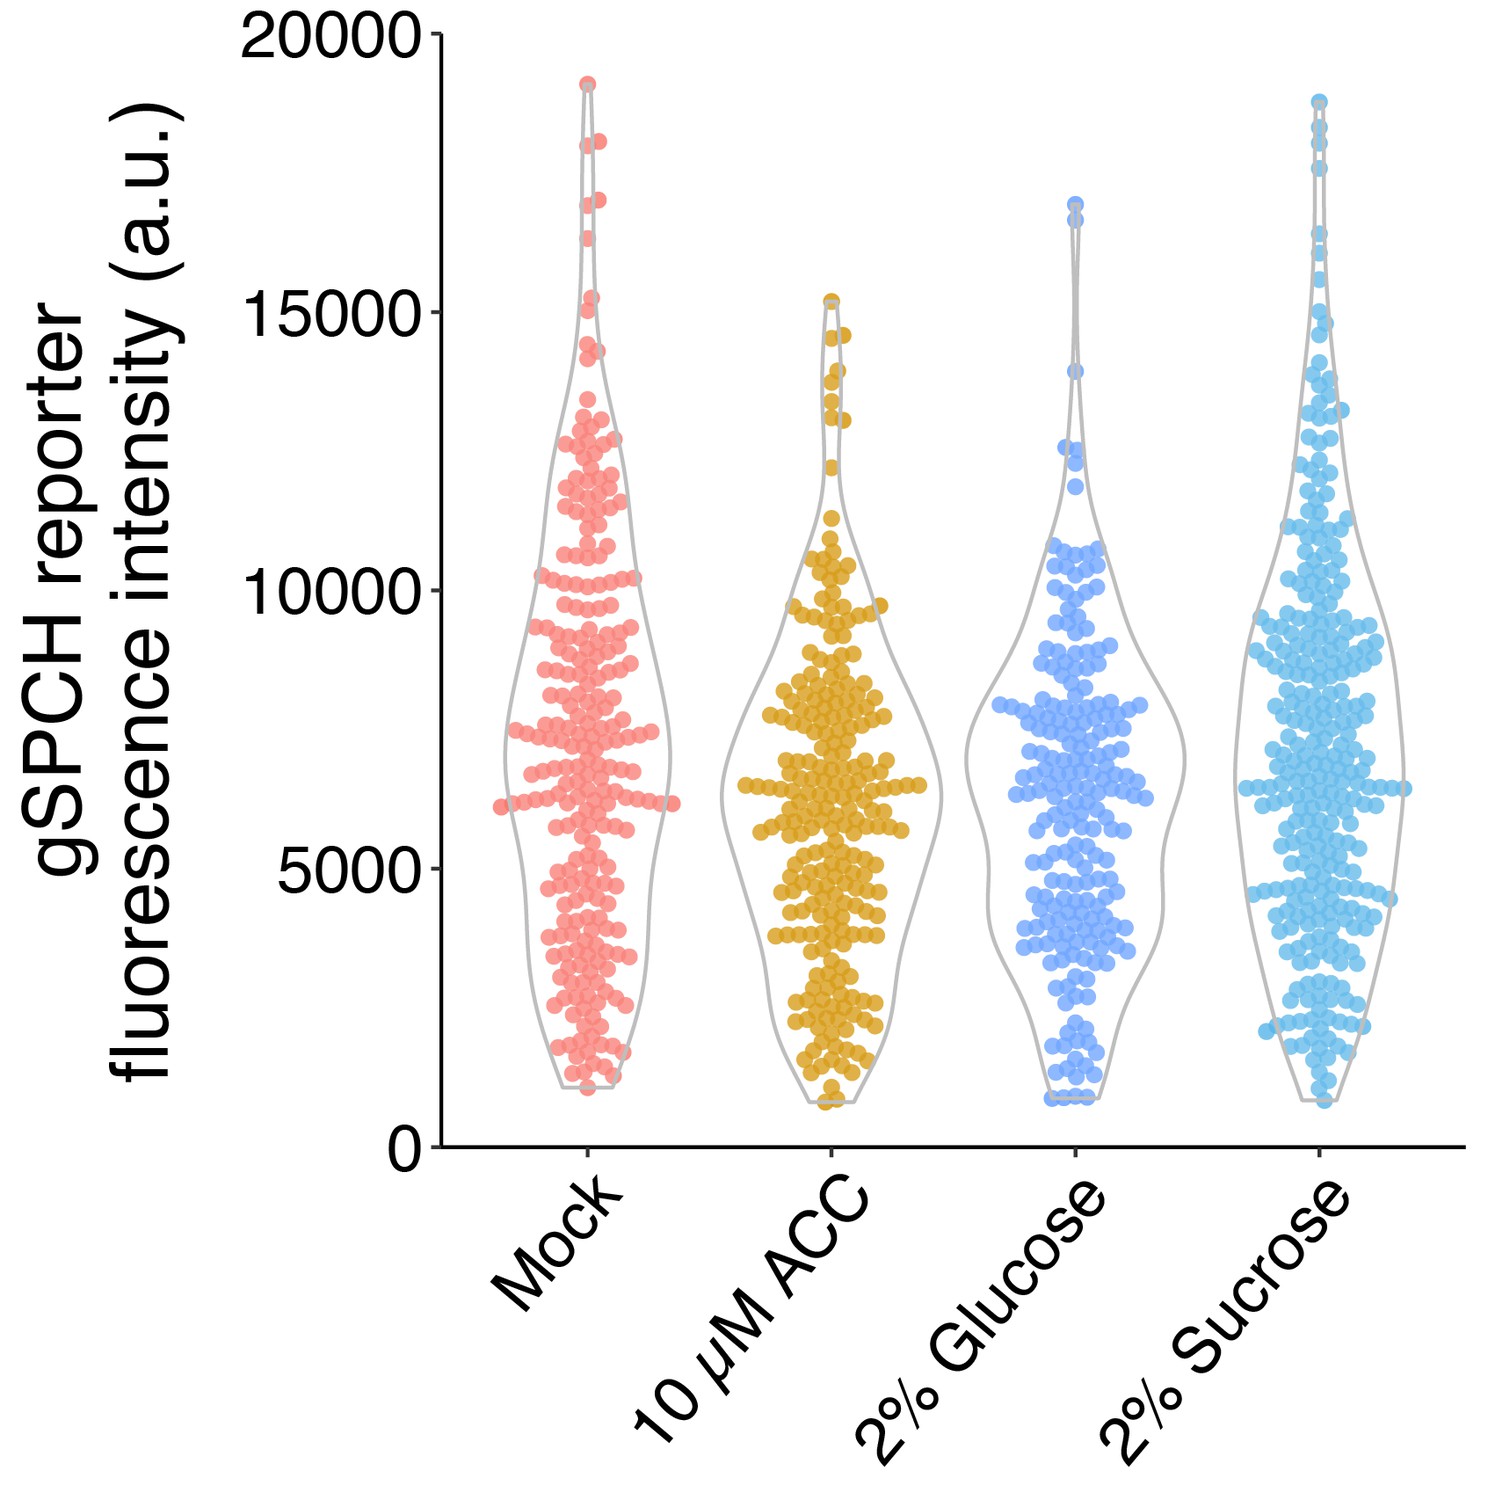
SPCH reporter fluorescence intensity under different sugar and ethylene treatments.
Quantification of gSPCH reporter fluorescence intensity at 4 dpg in mock, 10 μM ACC, 2% glucose, and 2% sucrose treated Col-0 cotyledons (n = 8 cotyledons/treatment; n>200 cells/treatment).
Videos
Video 1
BRXL2 dynamics in Col-0.
Examples of BRXL2 dynamics (green, pBRXL2::BRXL2-YFP) during stomatal lineage asymmetric cell divisions (labeled by white arrowheads) and symmetric cell divisions (labeled by yellow arrows) on the abaxial surface of a 3 dpg wild-type Col-0 cotyledon. Cell membrane is labeled by pATML1::RCI2A-mCherry in magenta. White numbers in frames indicate hours:minutes relative to first frame. Scale bar, 10 µm.
Video 2
BRXL2 dynamics in ctr1G738R.
Examples of BRXL2 dynamics (green, pBRXL2::BRXL2-YFP) during stomatal lineage asymmetric cell divisions (labeled by white arrowheads) and symmetric cell divisions (labeled by yellow arrows) on the abaxial surface of a 3 dpg ctr1G738R cotyledon. Cell membrane is labeled by pATML1::RCI2A-mCherry in magenta. White numbers in frames indicate hours:minutes relative to first frame. Scale bar, 10 µm.
Tables
Key resources table
| Reagent type (species) or resource | Designation | Source or reference | Identifiers | Additional information |
|---|---|---|---|---|
| Gene (Arabidopsis thaliana) | CTR1 | TAIR (https://www.arabidopsis.org/) | AT5G03730 | Receptor-coupled kinase involved in ethylene signaling |
| Gene (Arabidopsis thaliana) | BRXL2 | TAIR (https://www.arabidopsis.org/) | AT3G14000 | Polarity protein in the stomatal lineage |
| Gene (Arabidopsis thaliana) | BASL | TAIR (https://www.arabidopsis.org/) | AT5G60880 | Polarity protein in the stomatal lineage |
| Gene (Arabidopsis thaliana) | ATML1 | TAIR (https://www.arabidopsis.org/) | AT4G21750 | Homeobox transcription factor |
| Gene (Arabidopsis thaliana) | EIN2 | TAIR (https://www.arabidopsis.org/) | AT5G03280 | Component of ethylene signaling |
| Gene (Arabidopsis thaliana) | EIN3 | TAIR (https://www.arabidopsis.org/) | AT3G20770 | Transcriptional factor in ethylene signaling |
| Gene (Arabidopsis thaliana) | EIL1 | TAIR (https://www.arabidopsis.org/) | AT2G27050 | Transcriptional factor in ethylene signaling |
| Gene (Arabidopsis thaliana) | EBF1 | TAIR (https://www.arabidopsis.org/) | AT2G25490 | F-box protein involved in ethylene signaling |
| Gene (Arabidopsis thaliana) | EBF2 | TAIR (https://www.arabidopsis.org/) | AT5G25350 | F-box protein involved in ethylene signaling |
| Gene (Arabidopsis thaliana) | HXK1 | TAIR (https://www.arabidopsis.org/) | AT4G29130 | Hexokinase in the glucose signaling network |
| Gene (Arabidopsis thaliana) | SPCH | TAIR (https://www.arabidopsis.org/) | AT5G53210 | bHLH transcription factor involved in stomatal development |
| Gene (Arabidopsis thaliana) | TMM | TAIR (https://www.arabidopsis.org/) | AT1G80080 | LRR receptor-like protein involved in stomatal development |
| Strain, strain background (Arabidopsis thaliana) | Col-0 | ABRC | CS28166 | Wild-type Arabidopsis ecotype used in this study |
| Strain, strain background (Arabidopsis thaliana) | Ler-0 | ABRC | CS20 | Wild-type Arabidopsis ecotype used in this study |
| Strain, strain background (Agrobacterium tumefaciens) | GV3101 | Other | Electrocompetent A. tumefaciens | |
| Genetic reagent (Arabidopsis thaliana) | ctr1-1 | Kieber et al., 1993; DOI:10.1016/0092-8674(93)90119-b | ||
| Genetic reagent (Arabidopsis thaliana) | ctr1-btk | Ikeda et al., 2009; DOI:10.3389/fpls.2017.00475 | ||
| Genetic reagent (Arabidopsis thaliana) | ein3eil1ebf1ebf2 | Sugano et al., 2010; DOI: 10.1105/tpc.110.076588 | ||
| Genetic reagent (Arabidopsis thaliana) | ein2-5 | Alonso et al., 1999; DOI:10.1126/science.284.5423.2148 | ||
| Genetic reagent (Arabidopsis thaliana) | gin2 | Moore et al., 2003; DOI:10.1126/science.1080585 | ||
| Genetic reagent (Arabidopsis thaliana) | hxk1-3 | Huang et al., 2015; DOI:10.3389/fpls.2015.00851 | ||
| Genetic reagent (Arabidopsis thaliana) | EIN3ox | Chao et al., 1997; DOI:10.1016/s0092-8674(00)80300–1 | ||
| Genetic reagent (Arabidopsis thaliana) | ctr1G738R | This paper | A ctr1 (in Col-0,Arabidopsis thaliana) mutant harboring a point mutation; first introduced in Figure 1 and fully described in Figure 1—figure supplement 1; request to DCB Laboratory, Stanford, USA | |
| Genetic reagent (Arabidopsis thaliana) | pTMM::amiRNA-CTR1 | This paper | Transgenic line expressing an artificial microRNA (amiRNA) knockdown construct targeting CTR1 under the stomatal lineage-specific promoter TMM; first introduced in Figure 2; request to DCB Laboratory, Stanford, USA | |
| Genetic reagent (Arabidopsis thaliana) | pATML1::CTR1; ctr1G738R | This paper | Transgenic line expressing CTR1 under the epidermal-specific promoter ATLML1 in the ctr1G738R mutant background; first introduced in Figure 1—figure supplement 1; request to DCB Laboratory, Stanford, USA | |
| Genetic reagent (Arabidopsis thaliana) | pBRXL2::BRXL2-YFP; pATML1::mCherry-RCI2A | Rowe et al., 2019; DOI: 10.1101/614636 | ||
| Genetic reagent (Arabidopsis thaliana) | pBASL::YFP-BASL; pATML1::mCherry-RCI2A | Rowe et al., 2019; DOI: 10.1101/614636 | ||
| Genetic reagent (Arabidopsis thaliana) | pSPCH::gSPCH-YFP; spch3 | Lopez-Anido et al., 2020; DOI: 10.1101/2020.09.08.288498 | ||
| Chemical compound, drug | Propidium iodide | Thermo Fisher | Thermo Fisher: P3566 | Dye for staining intercellular space in Arabidopsis |
| Chemical compound, drug | AZD-8055 | Fisher Scientific | Fisher Scientific: 50-101-5840 | ATP-competitive inhibitor of TOR |
| Chemical compound, drug | 1-Aminocyclopropane-1-carboxylic acid | Sigma | Sigma: A3903-100MG | Ethylene precursor |
| Chemical compound, drug | Glucose | Sigma | Sigma: G7021-1KG | |
| Chemical compound, drug | 3-O-Methyl-D-glucopyranose | Sigma | Sigma: M4849-10G | Non-metabolizable sugar |
| Chemical compound, drug | Sucrose | Sigma | Sigma: S3929-1KG | |
| Chemical compound, drug | Fructose | Sigma | Sigma: 1040071000 | |
| Commercial assay or kit | RNeasy plant mini kit | QIAGEN | QIAGEN: 74104 | |
| Commercial assay or kit | iScript cDNA synthesis kit | Bio-Rad | Bio-Rad: 170-8891 | |
| Commercial assay or kit | Ssoadvanced Universal SYBR Green Supermix | Bio-Rad | Bio-Rad: 172-5274 | |
| Software, algorithm | Leica Application Suite X | Leica | Version: 3.5.2.18963 | |
| Software, algorithm | FIJI | Schindelin et al., 2012; DOI:10.1038/nmeth.2019 | Version: 2.0.0-rc-69/1.52 p | |
| Software, algorithm | POME | Gong et al., 2021; DOI:10.1111/nph.17165 | Version:1.0.0 | |
| Software, algorithm | R | https://www.R-project.org/ | Version: 4.0.1 | |
| Software, algorithm | TrackMate | Tinevez et al., 2017; DOI: 10.1016/j.ymeth.2016.09.016 | Version: 6.0.1 | |
| Software, algorithm | RStudio | https://rstudio.com | Version: 1.3.959 |
Additional files
Download links
A two-part list of links to download the article, or parts of the article, in various formats.
Downloads (link to download the article as PDF)
Open citations (links to open the citations from this article in various online reference manager services)
Cite this article (links to download the citations from this article in formats compatible with various reference manager tools)
Tuning self-renewal in the Arabidopsis stomatal lineage by hormone and nutrient regulation of asymmetric cell division
eLife 10:e63335.
https://doi.org/10.7554/eLife.63335


