Local circuit allowing hypothalamic control of hippocampal area CA2 activity and consequences for CA1
- INSERM UMR1266, Institute of Psychiatry and Neuroscience of Paris, Team Synaptic Plasticity and Neural Networks, Université de Paris, France
- GHU Paris Psychiatrie and Neurosciences, France
- Laboratory for Circuit and Behavioral Physiology, RIKEN Center for Brain Science, Japan
Figures
Figure 1 with 2 supplements
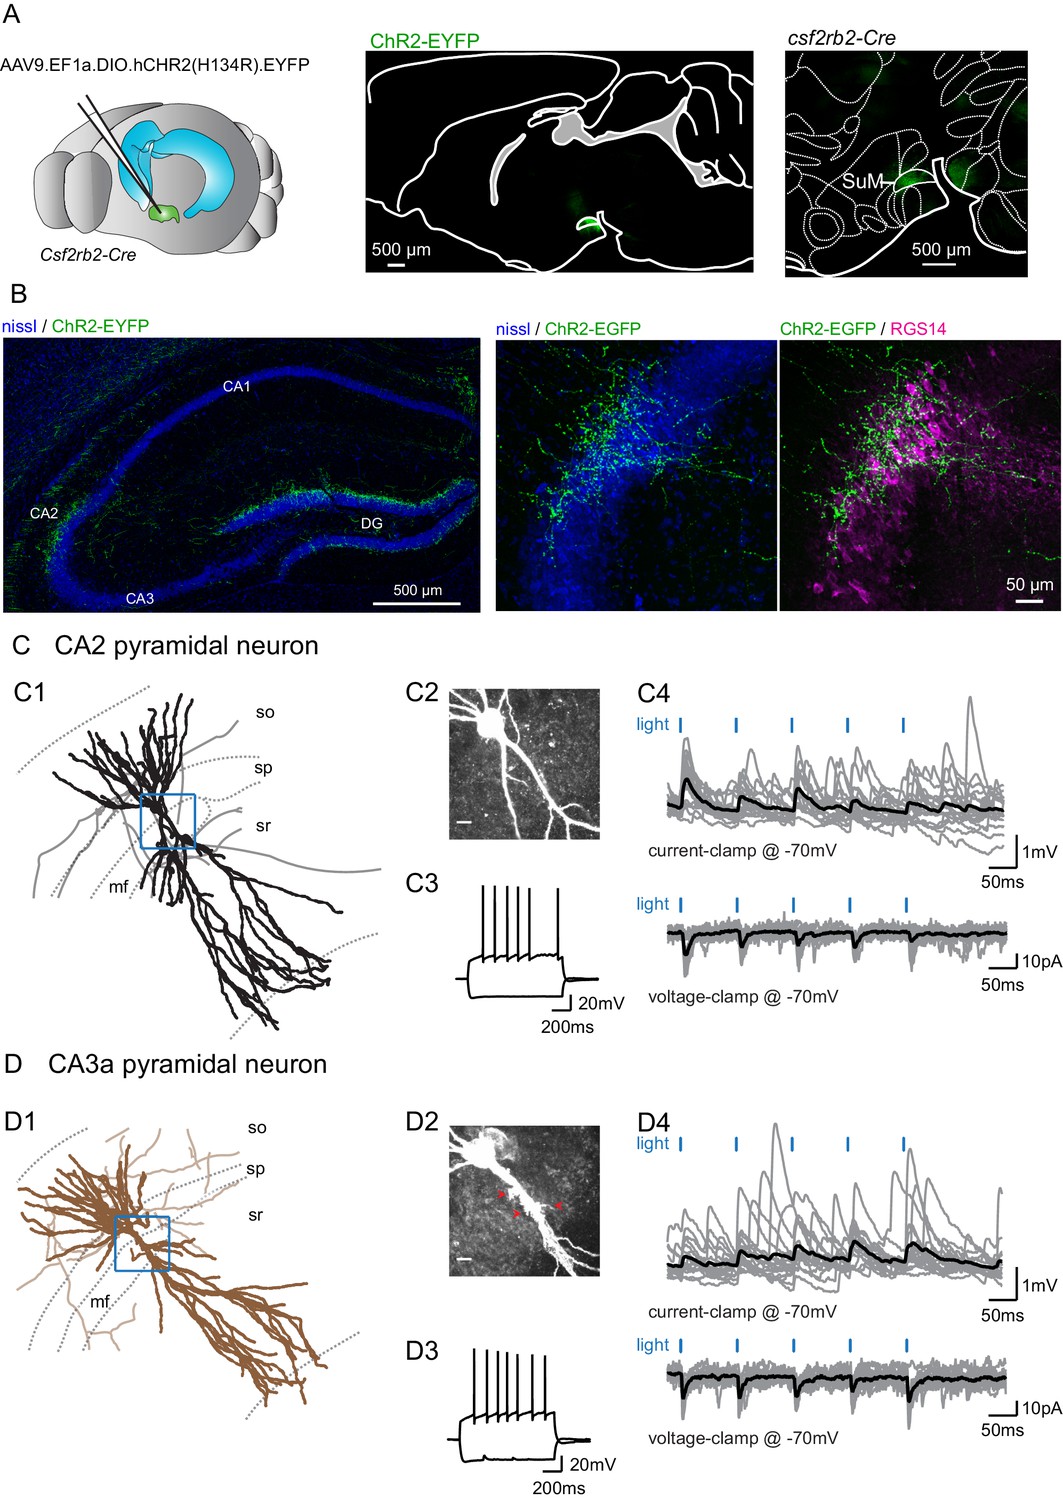
Selective functional mapping of SuM neurons that project to hippocampal area CA2.
(A) Left, diagram illustrating the injection of AAVs into the SuM. Middle, sagittal image indicating the infected SuM area expressing hCHR2(H134R)-EYFP (green). Right, expanded view of injection site in the Csf2rbr-Cre mouse line. (B) Left, hCHR2(H134R)-EYFP -expressing SuM fibers (green) and nissl staining (blue) in the hippocampus. Right, higher magnification image of area CA2 with hCHR2(H134R)-EYFP -expressing SuM fibers (green) and nissl staining (blue) and RGS14 staining (magenta) to label area CA2. (C) CA2 pyramidal neurons in the SuM-innervated region receive excitatory transmission. (C1) Example CA2 PN reconstruction (dendrites in black, axons in gray, hippocampal stratum borders shown in dotted line, area demarcated in blue corresponds to the expanded image in C2). (C2) Biocytin labeling of the recorded cell proximal dendrites, scale bar represents 10 µm. (C3) AP firing and repolarizing sag potential in response to steps of +800 and −400 pA current injection. (C4) Light-evoked EPSPs (top traces, individual traces shown in gray, average trace shown in black) and EPSCs (bottom traces, individual traces shown in gray, average trace shown in black). (D) CA3a pyramidal neurons in the SuM-innervated region receive excitatory transmission. (D1) Example CA3 PN reconstruction (dendrites in brown, axons in light brown, hippocampal stratum borders shown in dotted line, area demarcated in blue corresponds to the expanded image in D2). (D2) Biocytin labeling of the recorded cell proximal dendrites, note the presence of thorny excrescences, as indicated by the red arrows; scale bar represents 10 µm. (D3) AP firing and repolarizing sag potential in response to steps of +800 and −400 pA current injection. (D4) Light-evoked EPSPs (top traces, individual traces shown in gray, average trace shown in black) and EPSCs (bottom traces, individual traces shown in gray, average trace shown in black).
Figure 1—figure supplement 1

Anatomy and immunohistochemistry of hippocampal-projecting SuM neurons.
(A) Diagram illustrating the intersectional strategy used to label CA2-projecting SuM neurons. (B-E) Labeling of CA2-projecting SuM neurons with the retrograde CAV-2 carrying Cre-recombinase injected in CA2 and the anterograde AAV carrying DIO-EGFP injected in SuM of wild type mice. (B) Labeling of SuM fibers in the hippocampus from CA2-projecting SuM neurons. Left, nissl staining (blue) and EGFP expression (green) in the hippocampus. Right, PCP4 staining (magenta) and EGFP expression (green) in area CA2. (C) Retrograde-labeled SuM neurons that project to hippocampal area CA2. Left, nissl staining (blue) and EGFP expression (green) in SuM (mtg = mammillotegmental tract, rmx = retromammillary decussation, SuMl = lateral SuM, SuMm = medial SuM, pm = principal mammillary tract, MM = medial mammillary nucleus). Right, calretinin staining (magenta) and EGFP expression (green) in SuM. (D) Higher magnification image of CA2-projecting SuM neurons. Left, nissl staining (blue) and EGFP expression (green) in SuM. Center, nissl (blue) and calretinin staining (magenta) in SuM. Right, calretinin staining (magenta) and EGFP expression (green) in SuM. (E). VGluT2 expression of CA2-projecting SuM neurons. Left, nissl staining (blue) and EGFP expression (green) in SuM. Right, VGluT2 staining (red) and EGFP expression (green) in SuM. (F) Top, diagram illustrating the injection of AAVs into the SuM. Bottom, sagittal image of the injection site in SuM to express hCHR2(H134R)-EYFP (green) in the VGluT2-Cre line. (G-H) Anterograde labeling of SuM projections to the hippocampus from AAV carrying DIO-ChR2-EYFP injected in SuM of VGluT2-Cre mice. (G) Left, VGluT2 (red) and nissl staining (blue) in the hippocampus. Right, hCHR2(H134R)-EYFP -expressing SuM fibers (green) and nissl (blue) staining in the hippocampus. (H) Left, higher magnification image of area CA2 with VGluT2 (red) and nissl (blue) staining. Center, hCHR2(H134R)-EYFP -expressing SuM fibers (green) and nissl staining (blue). Right, hCHR2(H134R)-EYFP -expressing SuM fibers (green) and VGluT2 staining (red).
Figure 1—figure supplement 2
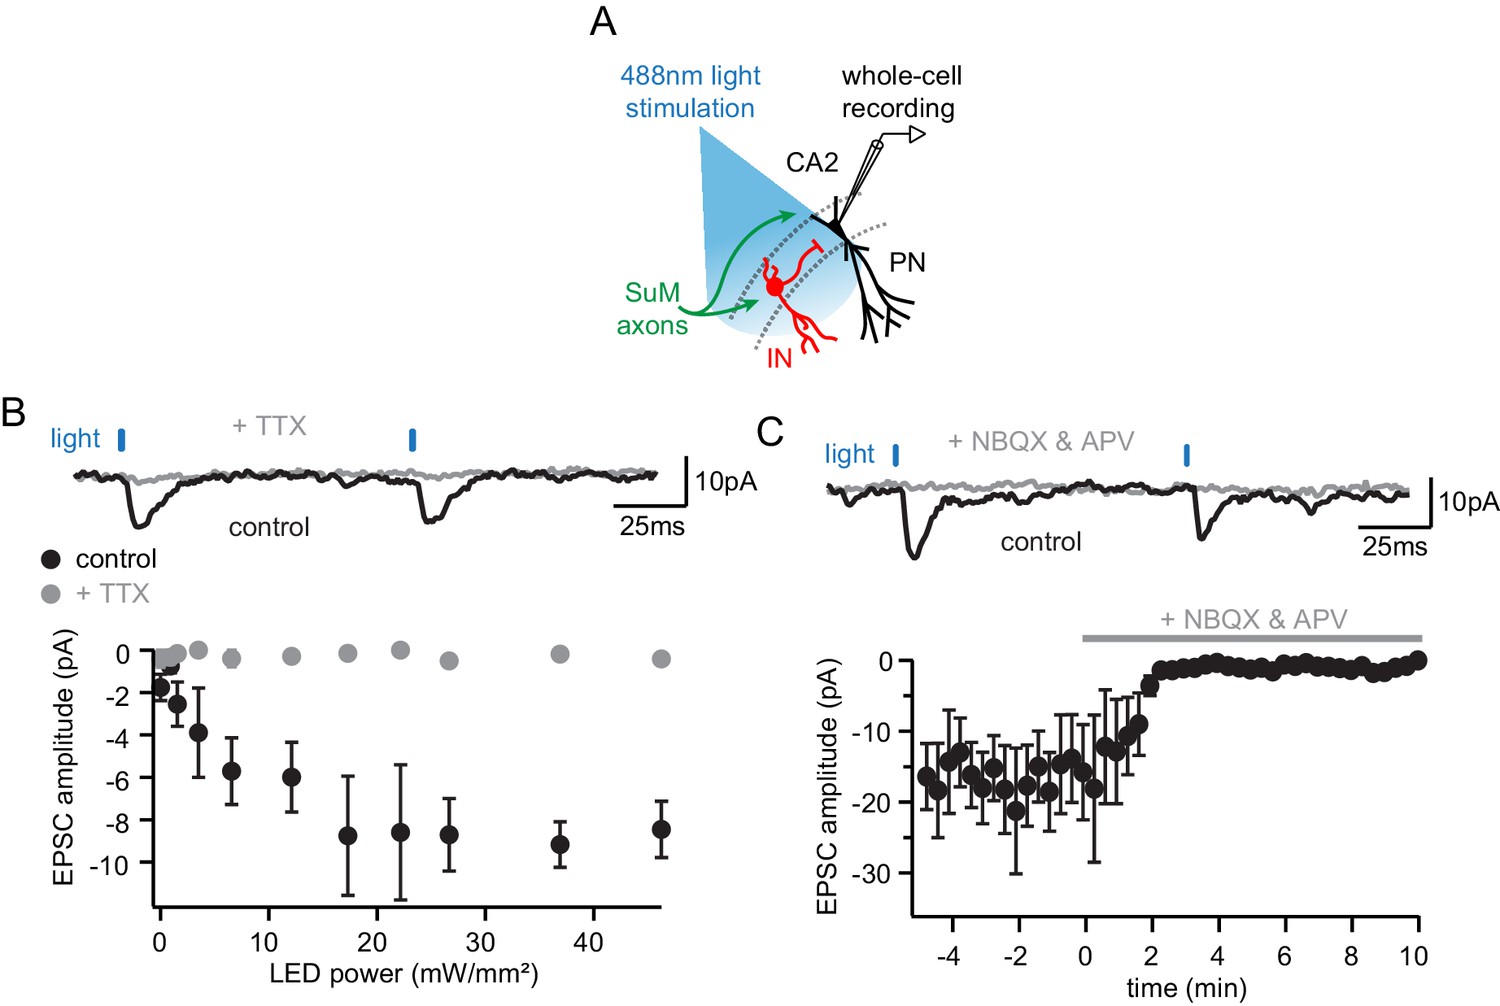
Glutamate is the only neurotransmiter at the SuM-CA2 synapse.
(A) Diagram illustrating the whole-cell recording configuration of PNs in area CA2 and SuM fiber stimulation in acute hippocampal slices. (B) Light-evoked EPCSs from SuM inputs are completely blocked following application of tetrodotoxin (TTX). Sample traces (top, control shown in black,+TTX shown in gray) and power-response curves (bottom) of light-evoked EPSC amplitudes recorded in PN before (black) and after application of 0.2 µM TTX (gray) at different light intensities (n = 5, error bars represent SEM). (C) Light-evoked EPCSs from SuM inputs are completely blocked following application of NMDA and AMPA receptor blockers (NBQX and APV). Sample traces (top, control shown in black, NBQX and APV shown in gray) and time course (bottom) of light-evoked EPSC amplitudes upon application of 10 µM NBQX and 50 µM APV (n = 6, error bars represent SEM).
Figure 2

SuM input drives inhibition that controls excitation in CA2 PNs.
Whole-cell current clamp recordings of light-evoked post-synaptic potentials (PSPs) from SuM input stimulation onto CA2 PNs reveal contribution of feedforward inhibition in dampening excitatory input at −70 mV. (A) Diagram illustrating whole-cell recording configuration in acute hippocampal slices. During these experiments, direct current was injected as necessary to maintain a membrane potential of −70 mV. (B) Sample traces of three 10 Hz SuM light-evoked PSPs in a CA2 PN before and after blocking inhibitory transmission (control shown in black, SR95531 and CGP55845A in gray). (C) Summary graph of light-evoked PSP amplitudes recorded in PNs before and after application of 1 µM SR95531 and 2 µM CGP55845A (individual cells shown as thin lines, population average shown as thick line, error bars represent SEM, n = 14; Wilcoxon signed-rank tests, p=0.004 for the first PSP, p=0.013 for the second PSP, p<0.001 for the third PSP). (D-H) Summation of SuM synaptic potentials with SR and SLM electrical input stimulation. (D) Diagram illustrating the recording configuration similar to panel A but with stimulating electrodes positioned in stratum lacunosum moleculare (SLM) and stratum radiatum (SR). (E) Left, example traces of PSPs evoked by SuM fiber light stimulation alone (blue trace). Center, PSPs evoked by electrical stimulation of SR inputs alone (black) or paired with simultaneous SuM stimulation (orange). Right, PSPs evoked by electrical stimulation of SLM inputs alone (black) or paired with SuM stimulation (green). (F) Plots of the difference between the mathematical summation of the amplitudes of the SuM PSP amplitude and electrical stimulation (linear summation) and the measured SuM +electrical PSP. Left, SR inputs are not significantly different from zero, indicating that SuM and SR inputs linearly summate. Right, for the first pulse, the measured SLM + SuM amplitude is significantly smaller (n = 10; T test, p=0.014) than the expected linear summation. (G) Left, example traces of 10 Hz trains of PSPs of either electrical stimulation (black traces) or trains of paired electrical and light stimulation of SuM fibers (SR + SuM in orange or SLM + SuM in green). Right, traces with amplitudes normalized to the first PSP for both the electrical and simultaneous light and electrical PSPs. The amplitudes for all PSPs are measured from the potential immediately before each stimulus. (H) Summary plots of the summation ratio of the 2nd, 3rd, and 4th PSP for electrical stimulation (black symbols) or paired stimulation of SR + SuM (left, orange) or SLM + SuM (right, green).
Figure 3

SuM input provides strong excitatory glutamatergic transmission to basket cells (BCs) in area CA2.
(A-B) Left, diagrams illustrating whole-cell recordings in area CA2 and SuM fiber stimulation in acute slice preparation. Middle, example reconstruction of different cell types (soma and dendrites in thick lines, axon in thin lines, hippocampal strata in dotted gray lines). Right, sample traces of light-evoked EPSPs (top, individual traces in gray, average trace in black) and EPSCs (bottom, individual traces in gray, average trace in black). (A) Basket cell in area CA2. (B) Non-basket cell in area CA2. (C) Summary graph of light-evoked EPSC potencies in PNs, BCs, and non-BCs in area CA2 (individual cells shown as dots, population average shown as thick line, error bars represent SEM, PNs: n = 166; BC INs: n = 18; non-BCs: n = 13; Kruskal-Wallis test with Dunn-Holland-Wolfe post hoc test, p=0.022). (D) Summary graph of light-evoked PSP amplitudes in PNs, BCs and non-BCs (individual cells shown as dots, population average shown as thick line, error bars represent SEM, PNs: n = 20; BCs: n = 10; non-BCs: n = 4; Kruskal-Wallis test with Dunn-Holland-Wolfe post hoc test, p<0.001). (E) Left, proportion of post-synaptic CA2 PNs, BCs and non-BCs firing action potentials time-locked to light stimulation of SuM input. Right, sample traces of light-evoked action potentials in a BC recorded in current-clamp at resting membrane potential (top) and in cell-attached (bottom) configurations.
Figure 4
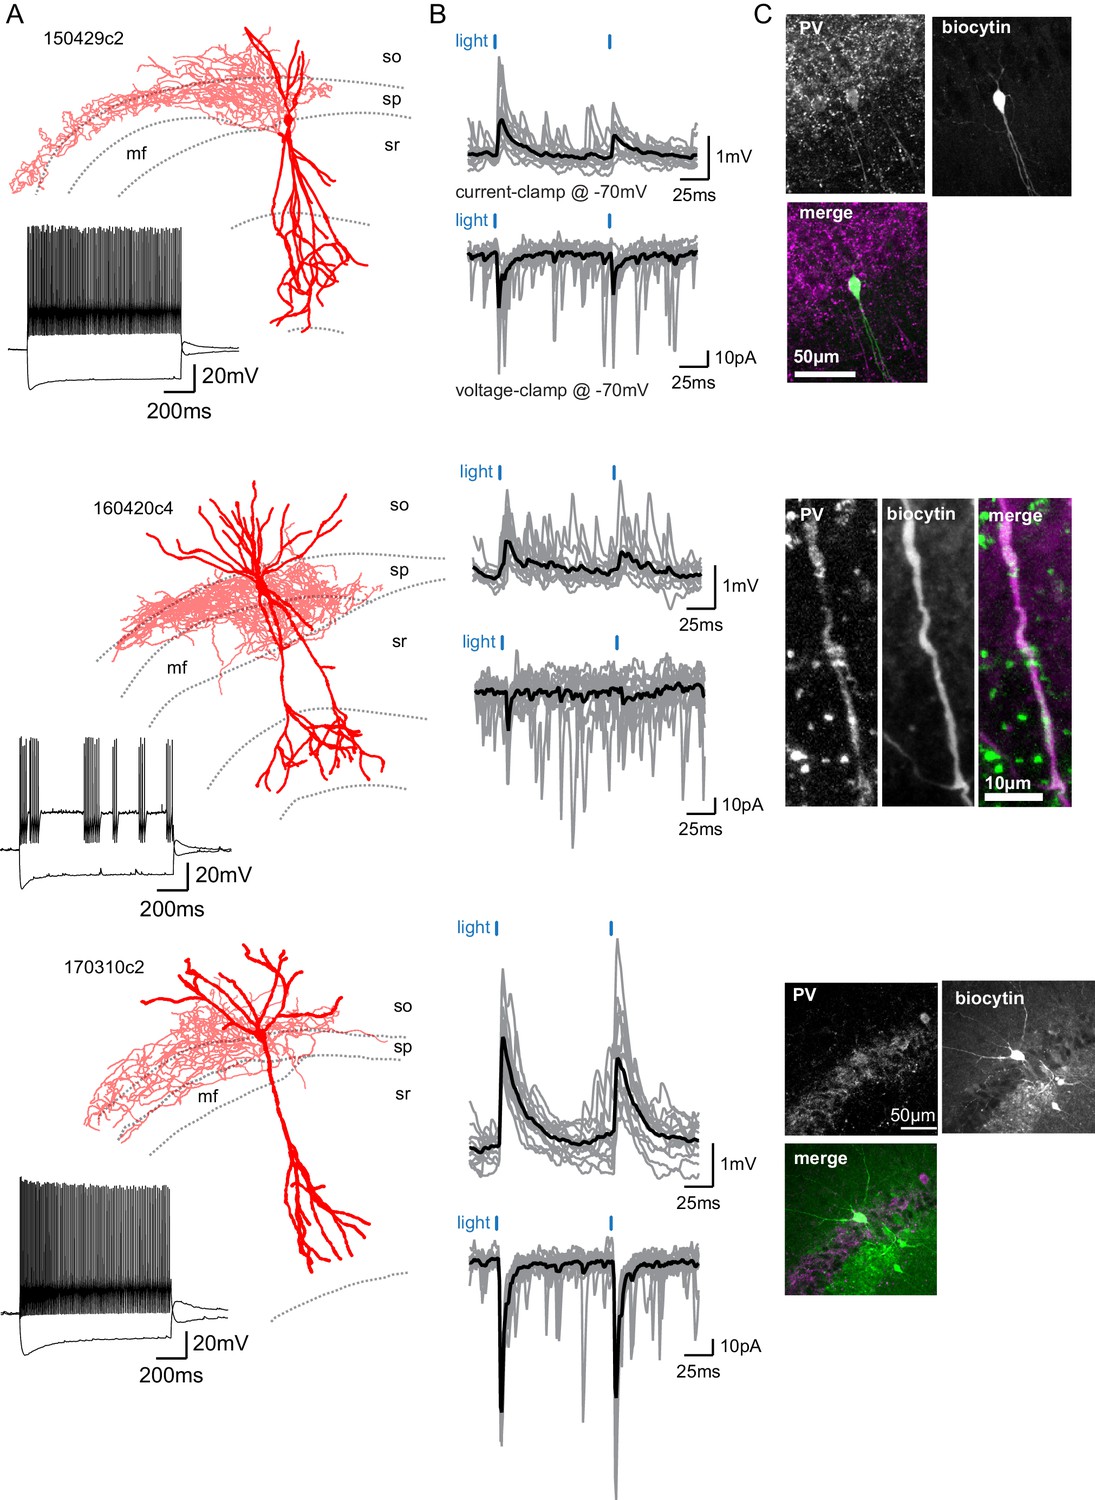
SuM input provides excitation to Parvalbumin-expressing BCs.
(A) Three biocytin reconstructions of BC INs with dendrites in red and axons in light red. Inset, current clamp steps to −400 pA and +400 pA display high-frequency AP firing and repolarizing sag current. (B) Corresponding light-evoked EPSCs and EPSPs for the three reconstructed neurons (individual traces in gray, average trace in black). (C) Corresponding PV immunostaining of the three interneurons: parvalbumin staining, biocytin labeling of the recorded cell, and merge (PV in magenta and biocytin in green).
Figure 5 with 1 supplement
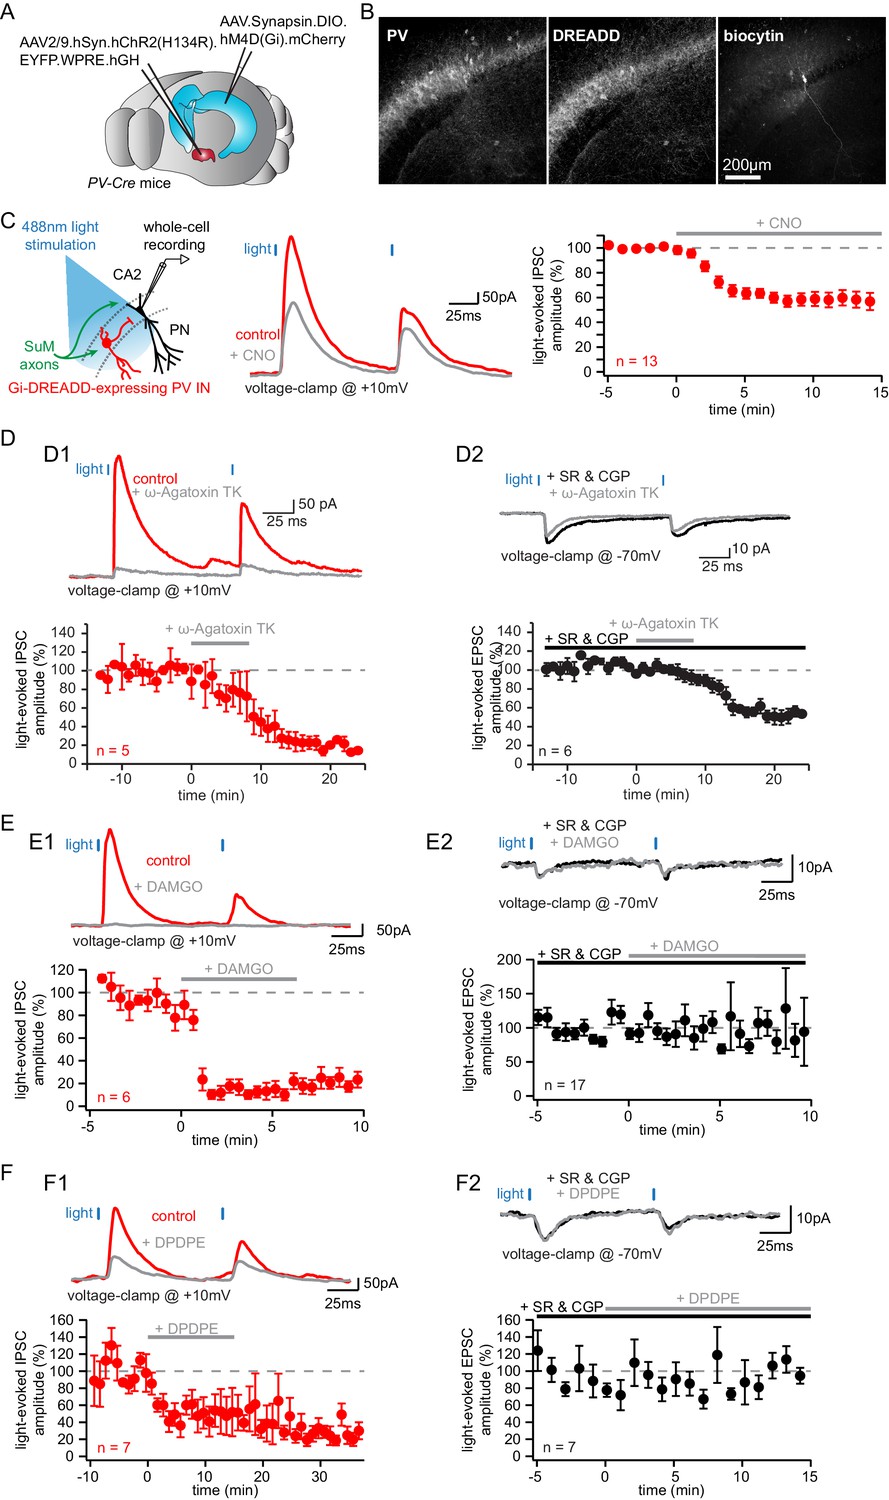
Parvalbumin-expressing BCs mediate the feedforward inhibition recruited by photostimulation of SuM fibers.
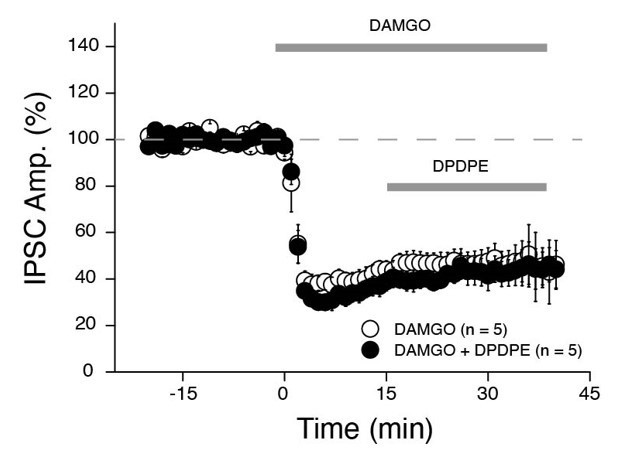
(A-C) Silencing of PV+ INs by inhibitory DREADDs reduces SuM feedforward inhibition onto area CA2 PNs. (A) Diagram illustrating the method to infect SuM neurons and selectively inhibit PV+ INs in area CA2. An AAV allowing the Cre-dependent expression of inhibitory DREADD was injected bilaterally into area CA2 of the dorsal hippocampus and another AAV allowing the expression of ChR2 was injected into the SuM of PV-Cre mice, allowing optogenetic stimulation of SuM inputs and pharmacogenetic inhibition of PV+ INs by application of the DREADD agonist CNO at 10 µM. (B) Example immunostaining against PV, DREADD and biocytin labeling in area CA2 from a slice used in these experiments. (C) Left, diagram of the recording configuration in hippocampal slices. Center, sample traces (control in red, CNO in gray). Right, summary graph of light-evoked IPSC amplitudes recorded in CA2 PNs before and after application of 10 µM CNO (n = 13, error bars represent SEM). (D) Application of the P/Q-Type voltage-activated calcium channel blocker ω-agatoxin TK results in nearly complete loss of feedforward inhibition recruited by light activation of SuM inputs in area CA2. D1, sample traces, (top, control in red, ω-agatoxin TK in gray) and summary graph of light-evoked IPSC amplitudes recorded in CA2 PNs before and after application of 200 nM ω-agatoxin TK (bottom, n = 5, error bars represent SEM). D2, sample traces (top, SR95531 and CGP55845A in black, ω-agatoxin TK in gray) and summary graph of light-evoked EPSC amplitudes before and after application of 200 nM ω-agatoxin TK (bottom, n = 6, error bars represent SEM). (E) Application of the mu-opioid receptor agonist, DAMGO, results in the complete abolition of light-evoked SuM inhibitory transmission. E1, sample traces (top, control in red, DAMGO in gray) and summary graph of light-evoked IPSC amplitudes recorded in CA2 PNs before and after application of 1 µM DAMGO (bottom, n = 6, error bars represent SEM). E2, sample traces (top, SR95531 and CGP55845A in black, DAMGO in gray) and summary graph of light-evoked EPSC amplitudes before and after application of 1 µM DAMGO (bottom, n = 17, error bars represent SEM). (F) Application of the delta-opioid receptor agonist, DPDPE, results in the long-term depression of light-evoked SuM inhibitory transmission. F1, sample traces (top, control in red, DPDPE in gray) and summary graph of light-evoked IPSC amplitudes before and after application of 0.5 µM DPDPE (bottom, n = 7, error bars represent SEM). F2, sample traces (top, SR95531 and CGP55845A in black, DAMGO in gray) and summary graph of light-evoked EPSC amplitudes before and after application of 0.5 µM DPDPE (bottom, n = 7, error bars represent SEM).
Figure 5—figure supplement 1
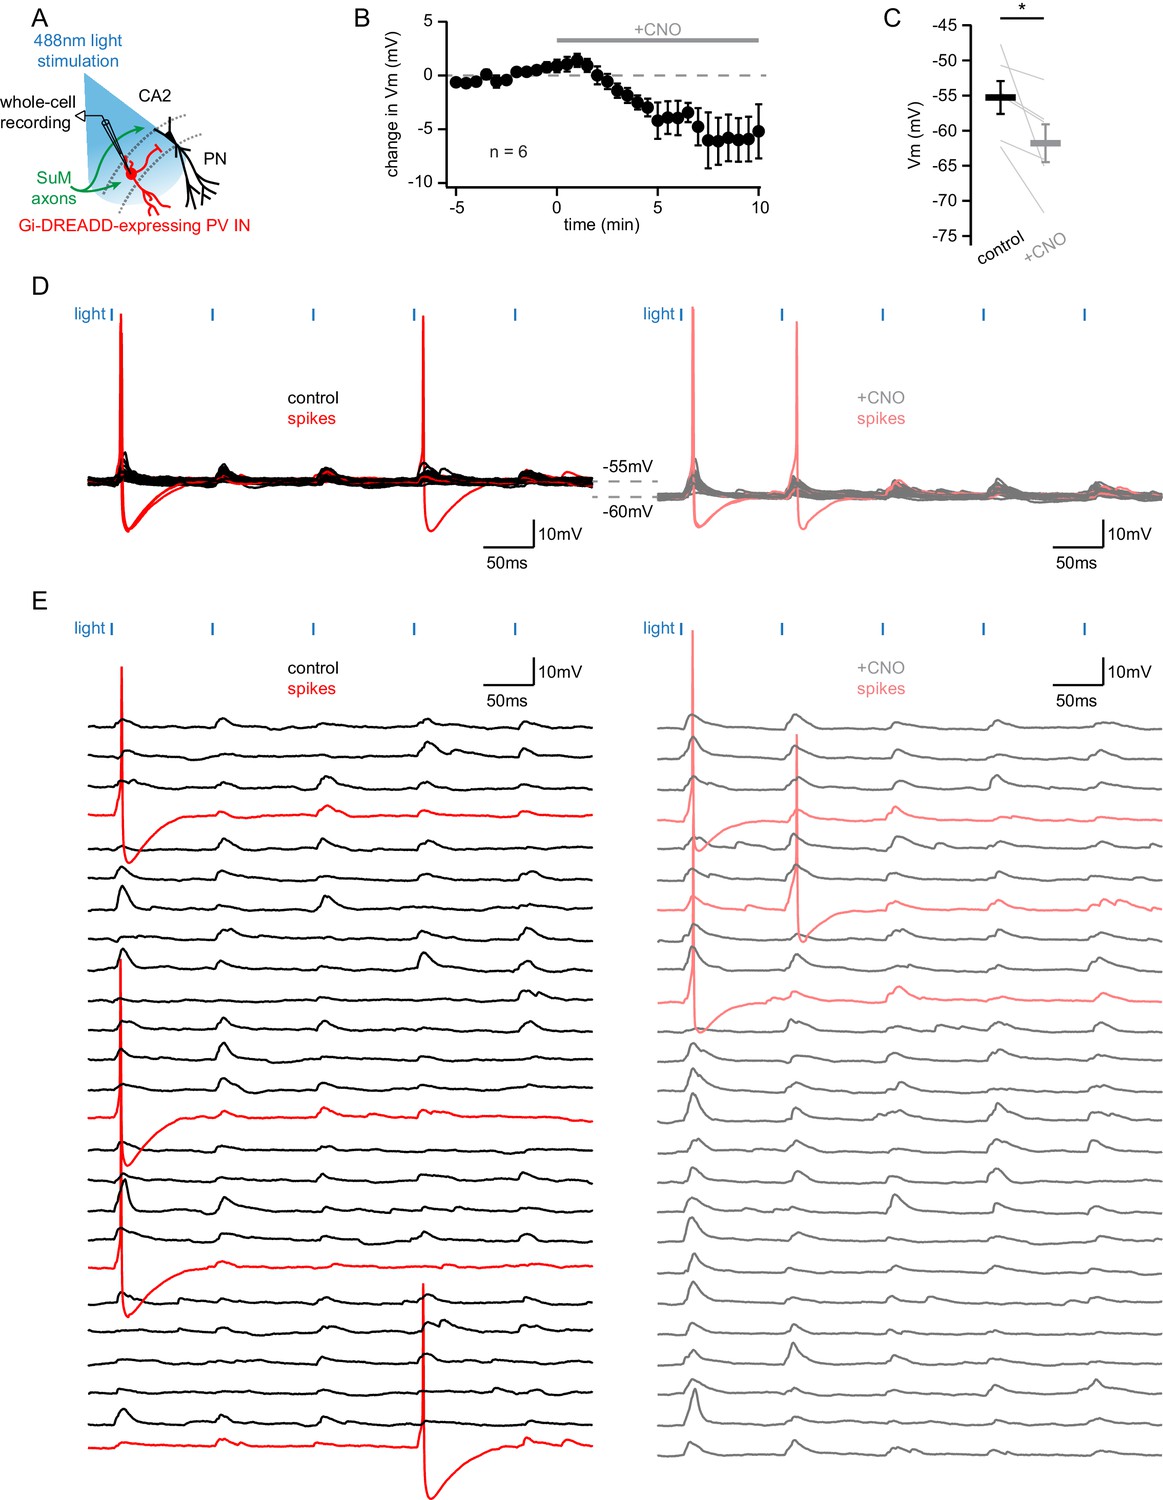
Evidence that Gi-DREADD expression in PV+ cells is not sufficient to prevent action potential firing.
(A) Diagram illustrating the whole-cell recording configuration of hM4D(Gi)-mCherry DREADD-expressing PV INs in area CA2 and SuM fiber stimulation in acute hippocampal slices. (B) Time course of the change of membrane potential (VM) level of Gi-DREADD-expressing CA2 PV INs with application of 10 µM CNO (n = 6, error bars represent SEM). (C) VM level before and after application of CNO (n = 6; Wilcoxon signed-rank test, p=0.031; individual cells shown as thin lines, population averages shown as thick lines, error bars represent SEM). (D) Sample traces of PSPs and spikes recorded from a Gi-DREADD-expressing CA2 PV IN before (left, PSPs in black, spikes in red) and after CNO application (right, PSPs in gray, spikes in light red). (E) Same as D with traces displayed as waterfall.
Figure 6
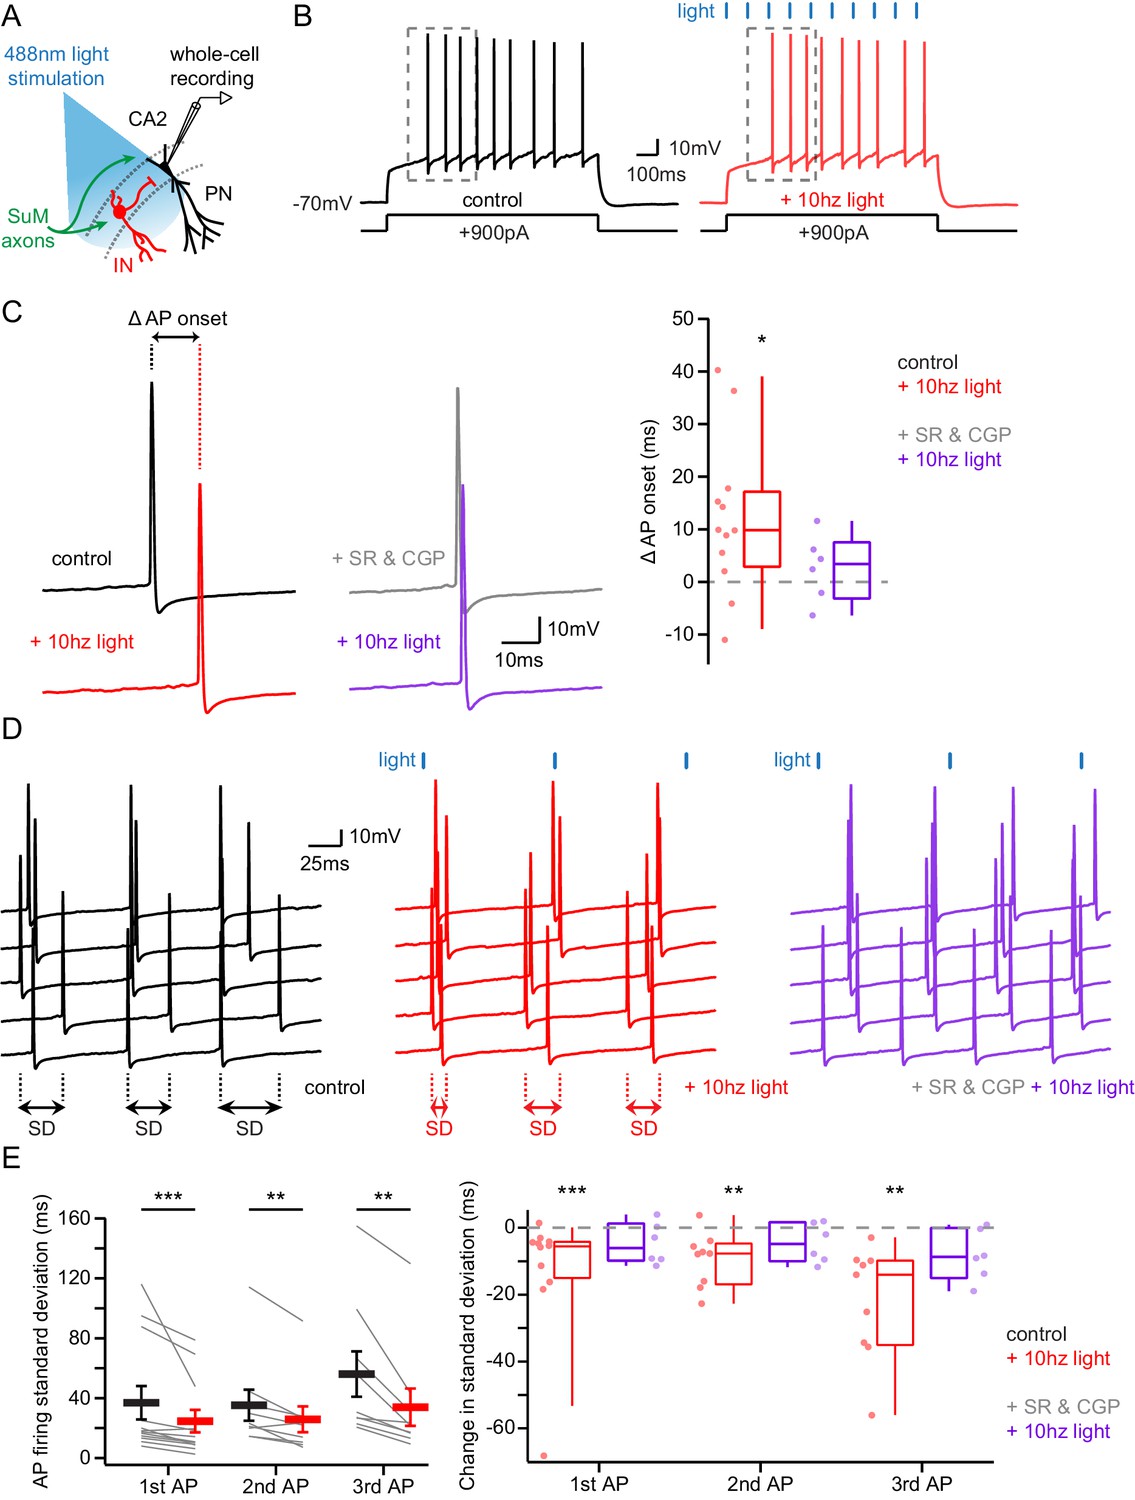
Area CA2 PNs receive a net inhibitory drive from SuM that controls AP firing properties.
(A) Diagram illustrating whole-cell recordings of area CA2 PNs and SuM fiber light stimulation in acute slice preparation. (B) Example traces of a CA2 PN action potential firing in response to current injection in the absence (black traces) or presence of 10 Hz photostimulation of SuM inputs (red traces). (C) Action potential onset latency is increased with 10 Hz SuM input photostimulation. Left, sample traces of the first AP in control and with inhibition blocked by 1 µM SR95531 and 2 µM CGP55845A application (light-off in black, light-on in red, light-off in SR95531 and CGP55845A in gray, light-on in SR95531 and CGP55845A in purple). Right, summary graph of photostimulation-induced delay of AP firing in area CA2 PNs before and after application of SR95531 and CGP55845A (control shown in red, n = 12, paired-T test, p=0.016; SR95531 and CGP55845A shown in purple, n = 6; Wilcoxon signed-rank test, p=0.44; individual cells shown with dots, boxplot represents median, quartiles, 10th and 90th percentiles). (D) Sample traces of AP firing in repeated trials (light-off in black, light-on in red, light-on in SR95531 and CGP55845A in purple; during experiment photostimulation was interleaved with control but traces are grouped here for demonstration purposes). (E) AP jitter in CA2 PNs is reduced by activation of SuM inputs. Left, summary graph of the standard deviation of AP firing with or without 10 Hz photostimulation (n = 12; Wilcoxon signed-rank test, p<0.001 for the first AP, p=0.008 for the second AP, p=0.004 for the third AP; individual cells shown with thin lines, population average shown as thick line, error bars represent SEM). Right, photostimulation-induced reduction of AP firing standard deviation in control and in SR95531 and CGP55845A (control, n = 12; Wilcoxon signed-rank tests, p<0.001 for the first AP, p=0.008 for the second AP, p=0.004 for the third AP; SR95531 and CGP55845A, n = 6; Wilcoxon signed-rank tests, p=0.22 for the first AP, p=0.16 for the second AP, p=0.09 for the third AP; individual cells shown with dots, boxplot represents median, quartiles, 10th and 90th percentiles).
Figure 7 with 1 supplement
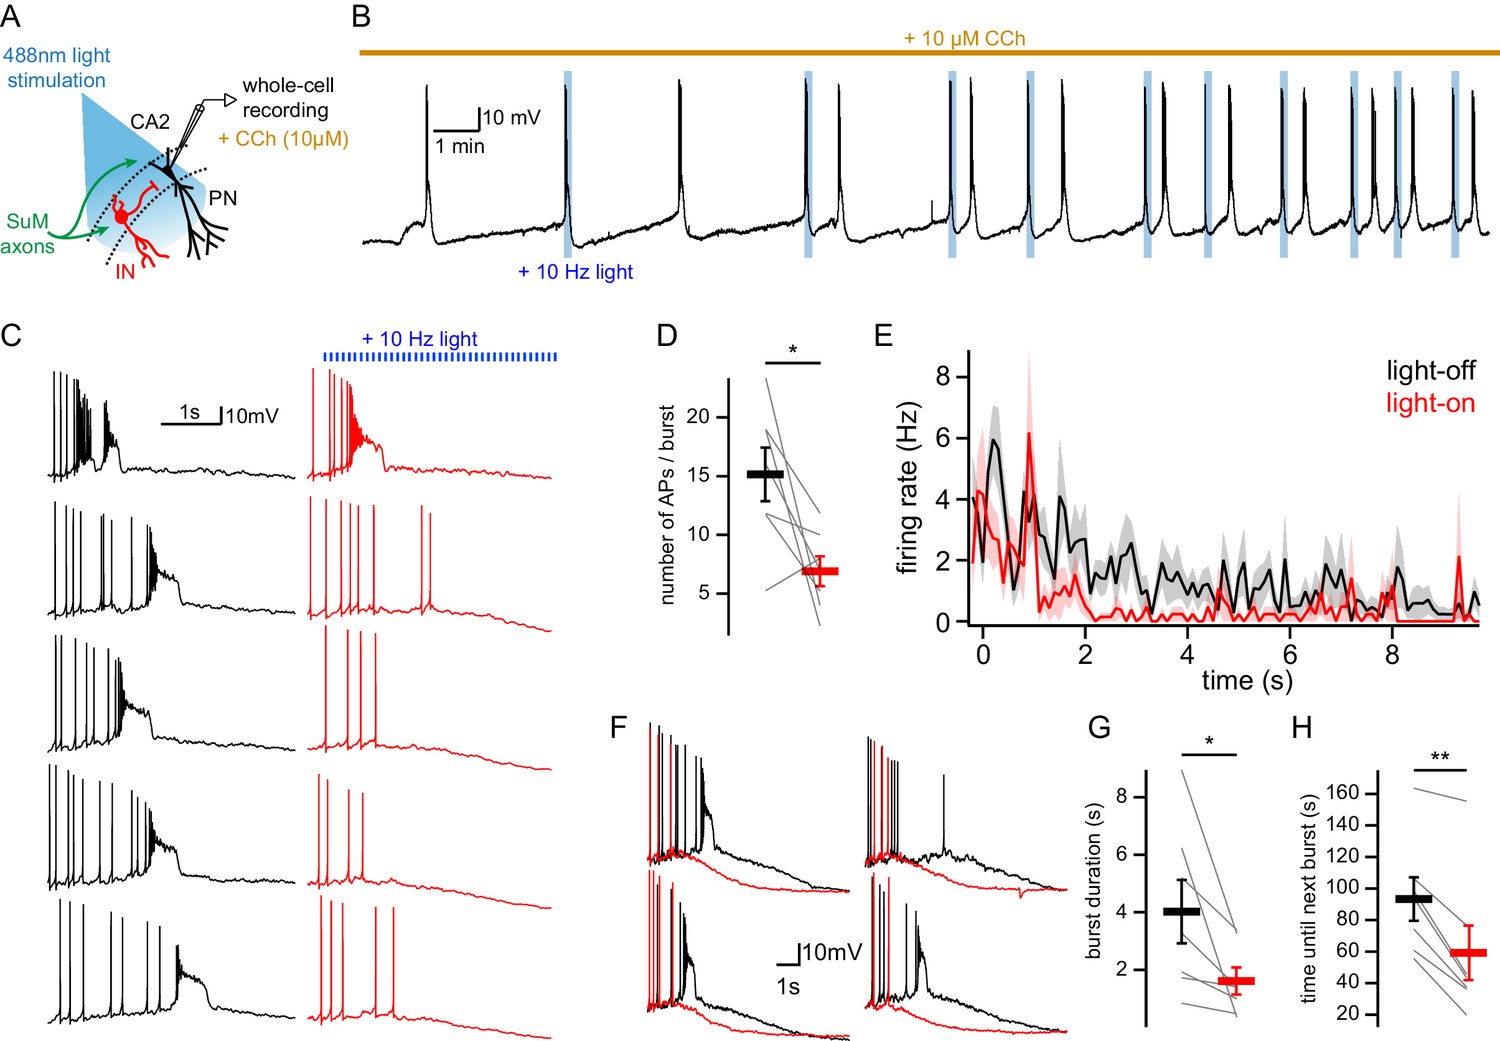
SuM input shapes CA2 PN AP bursts in conditions of elevated cholinergic tone.
(A) Diagram illustrating whole-cell recordings of area CA2 PNs with light stimulation of SuM fibers in an acute slice preparation. (B) Sample trace of spontaneous AP bursting activity recorded from a CA2 PN during bath application of 10 µM CCh. For every even-numbered burst, a 10 Hz photostimulation (blue bars) was delivered to excite SuM inputs in area CA2 allowing a comparison of burst AP firing in the same cell. (C) Sample traces of AP firing during bursts for light-off (left, black) and light-on (right, red) epochs. (D) Comparison of AP number per burst for light-off (black) and light-on (red) events (n = 7; individual cells shown as thin lines, population average shown as thick line, error bars represent SEM; paired-T test, p=0.031). (E) Average firing rate during spontaneous burst events with SuM photostimulation (red, light-on) and controlled interleaved burst events (black, light-off). Shaded area represents SEM for seven cells each with between 3 and 13 bursts analyzed in light-on and light-off conditions (two-way ANOVA, light factor: p<0.001, time factor: p<0.001, light x time factor: p=0.052). (F) Example burst events with (red) and without (black) SuM photostimulation overlayed and on a scale that shows the rapidly hyperpolarizing membrane potential that occurs with SuM input stimulation. (G) Comparison of bursts duration for events with (red) and without (black) photostimulation (n = 7; individual cells shown as thin lines, population average shown as thick line, error bars represent SEM; paired-T test, p=0.037). (H) Comparison of time elapsed to next burst onset following bursts with (red) or without (black) photostimulation (n = 7; individual cells shown as thin lines, population average shown as thick line, error bars represent SEM; paired-T test, p=0.001).
Figure 7—figure supplement 1

Effect of carbachol on SuM-CA2 transmission.
(A) Diagram illustrating the whole-cell recording configuration of PNs in area CA2 and SuM fiber stimulation in acute hippocampal slices. (B-C) Effect of 10 µM CCh on SuM light-evoked PSCs recorded in CA2 PNs under different conditions: voltage clamp at −70 mV with inhibitory transmission blocked (B, SR95531 and CGP55845A in gray, SR95531 and CGP55845A + CCh in orange), and voltage clamp at +10 mV (C, control in red, CCh in orange). Left, sample traces. Middle, power-response curves (B, n = 7; two-way ANOVA with repeated measures, p<0.001; C, n = 17; two-way ANOVA with repeated measures, p<0.001; error bars represent SEM). Right, comparison of PPRs (B, n = 7; paired-T test, p<0.001; C, n = 17; paired-T test, p=0.001; individual cells shown as gray lines, population average shown as horizontal line, error bars represent SEM). (D-G) Short term dynamics of PSCs evoked by repeated SuM input stimulation at 10 Hz within the same CA2 PNs in voltage clamp at −70 mV or +10 mV. Both SuM-evoked EPSCs and IPSCs were recorded in the same cells before and after application of 10 µM CCh (EPSCs before CCh in black, EPSCs after CCh in gray, IPSCs before CCh in red, IPSCs after CCh in orange; n = 13; error bars represent SEM). (D) Sample traces. (E) PSC amplitude. (F) Pulse #n over pulse #1 ratio. (G) E/I ratio. See Figure 7—figure supplement 1—source data 1 for statistics.
-
Figure 7—figure supplement 1—source data 1
Values for amplitude, Pn/P1 ration and E/I ratio with statistical comparisons for values measured and plotted in Figure 7—figure supplement 1.
- https://cdn.elifesciences.org/articles/63352/elife-63352-fig7-figsupp1-data1-v2.docx
Figure 8
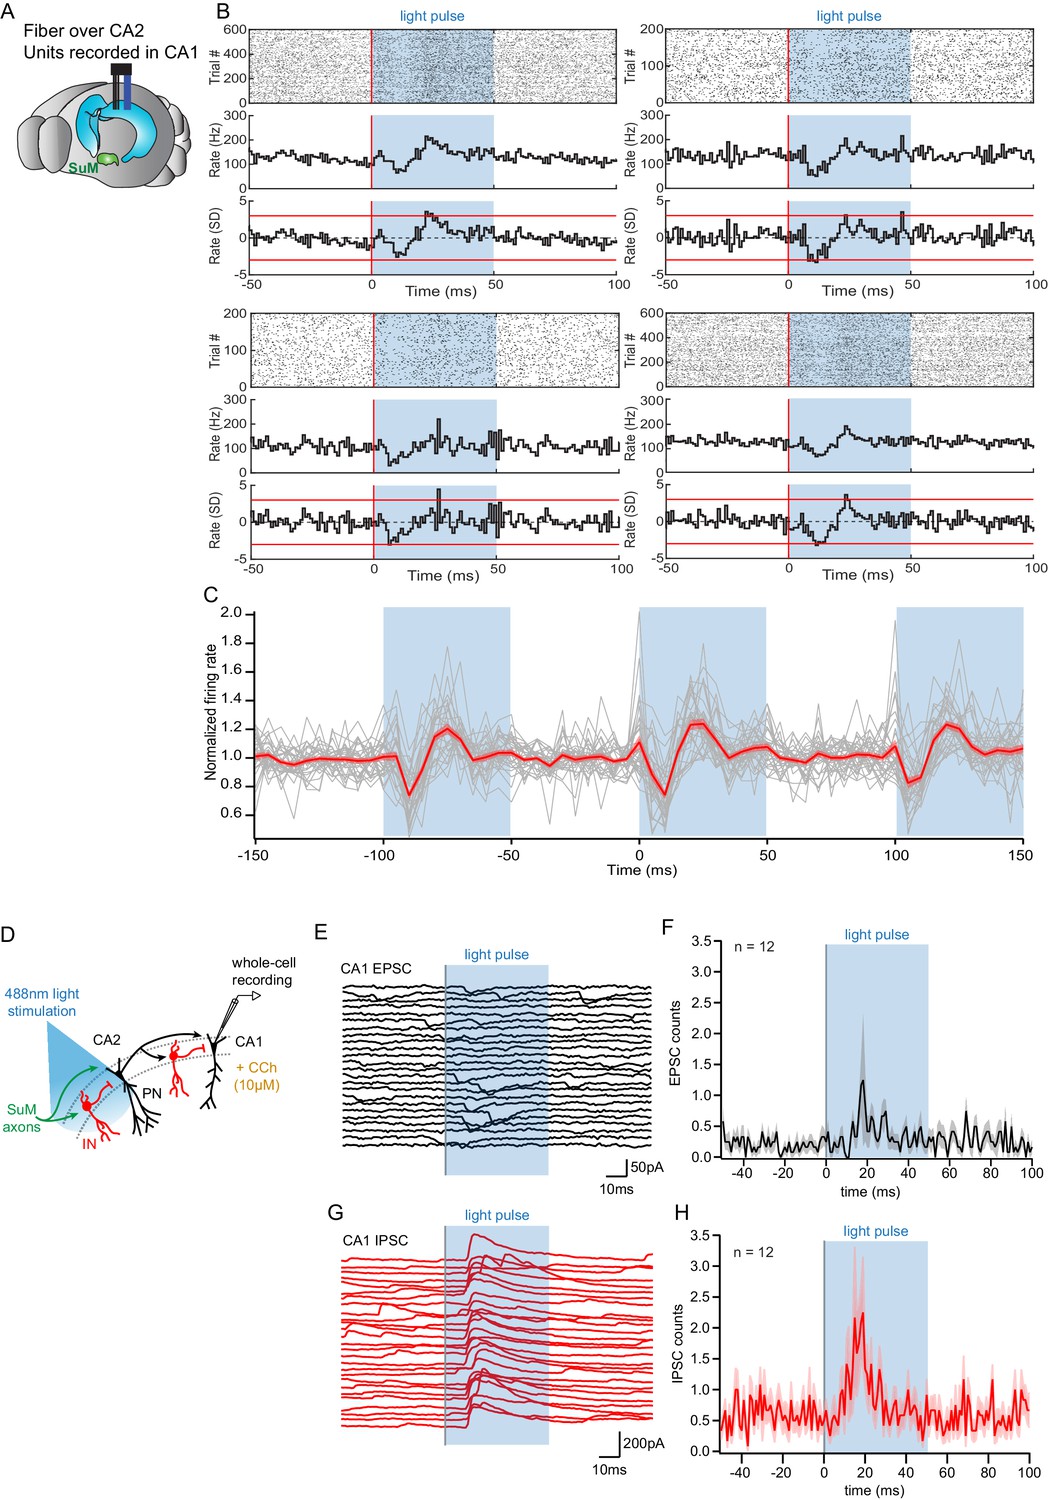
Consequences of SuM input on area CA2 output to CA1.
(A) Diagram illustrating in vivo recording in CA1 with tetrodes and SuM axon terminals stimulation over CA2 with an implanted optical fiber. (B) Representative data from four multi-unit recordings. Raster plot (top) showing CA1 AP firing activity before and during photostimulation of SuM fibers in area CA2. The corresponding firing rate histogram (middle) of four tetrodes placed in the CA1 pyramidal cell layers, as well as plots of standard deviation (SD; bottom). Red lines indicate ±3 SD. (C) Individual (gray) and average (red) normalized firing rates from 34 multiunit recordings, three consecutive light stimulation epochs are displayed to help visualizing the consistency of the effect of SuM input light stimulation over area CA2 on CA1 multi-unit firing; the shaded area represents the SEM. (D) Diagram illustrating whole-cell recordings of area CA1 PNs and SuM fiber light stimulation over area CA2 in acute slice preparation. (E-H) Example waterfall plots (E, G) and corresponding peri-stimulus time histogram (F, H) (population average shown as thick line, shaded area represents SEM) of EPSCs (black) and IPSCs (red) recorded from a CA1 PN ex vivo during photostimulation of SuM input over area CA2 with bath application of 10 µM CCh.
Author response image 1
Author response image 2
Author response image 3

Tables
Table 1
Electrophysiological properties of pyramidal neurons in SuM-innervated area.
| VM (mV) | RM (MOhm) | CM (pF) | |
|---|---|---|---|
| CA2 PN (n = 81) | −69.8 ± 0.70 | 59.2 ± 2.65 | 209 ± 11.4 |
| CA3 PN (n = 31) | −70.3 ± 1.06 | 72.4 ± 4.82 | 211 ± 15.7 |
| Statistics | Mann-Whitney U test p=0.997 | Student T test p=0.020* | Mann-Whitney U test p=0.625 |
| PN deep (n = 57) | −71.1 ± 0.76 | 64.0 ± 3.94 | 200 ± 12.3 |
| PN superficial (n = 76) | −69.3 ± 0.67 | 64.9 ± 3.19 | 196 ± 11.8 |
| Statistics | Student T test p=0.077 | Mann-Whitney U test p=0.777 | Mann-Whitney U test p=0.588 |
Table 2
Characteristics of SuM light-evoked transmission onto pyramidal neurons.
| EPSC | ||||||
|---|---|---|---|---|---|---|
| Cell type | Connectivity (%) | Amplitude (pA) | Rise time (ms) | Decay time (ms) | Latency (ms) | Success rate |
| CA2 PN | 56 (n = 58 of 103) | −16 ± 1.9 | 2.9 ± 0.1 | 14 ± 0.8 | 2.4 ± 0.2 | 0.44 ± 0.03 |
| CA3 PN | 49 (n = 22 of 45) | −23 ± 5.9 | 3.0 ± 0.2 | 14 ± 0.9 | 2.7 ± 0.3 | 0.56 ± 0.06 |
| Statistics | χ² test p=0.572 | Mann-Whitney U test p=0.409 | Mann-Whitney U test p=0.391 | Mann-Whitney U test p=0.797 | Mann-Whitney U test p=0.156 | Student T test p=0.074 |
| PN deep | 56 (n = 35 of 63) | −15 ± 2.0 | 3.5 ± 0.2 | 16 ± 1.0 | 3.5 ± 0.4 | 0.39 ± 0.03 |
| PN superficial | 56 (n = 53 of 94) | −20 ± 3.0 | 3.1 ± 0.2 | 15 ± 0.9 | 2.7 ± 0.3 | 0.51 ± 0.04 |
| Statistics | χ² test p=0.946 | Mann-Whitney U test p=0.306 | Mann-Whitney U test p=0.051 | Mann-Whitney U test p=0.314 | Mann-Whitney U test p=0.083 | Mann-Whitney U test p=0.072 |
| IPSC | ||||||
| Cell type | Connectivity (%) | Amplitude (pA) | Rise time (ms) | Decay time (ms) | Latency (ms) | Success rate |
| CA2 PN | 35 (n = 19 of 55) | 197 ± 41.3 | 3.8 ± 0.4 | 25 ± 1.2 | 6.3 ± 0.7 | 0.55 ± 0.06 |
| CA3 PN | 57 (n = 16 of 28) | 145 ± 23.4 | 4.5 ± 0.4 | 25 ± 1.2 | 7.5 ± 0.9 | 0.54 ± 0.05 |
| Statistics | χ² test p=0.134 | Mann-Whitney U test p=0.870 | Student T test p=0.203 | Mann-Whitney U test p=0.896 | Mann-Whitney U test p=0.303 | Student T test p=0.893 |
| PN deep | 47 (n = 16 of 34) | 199 ± 40.6 | 3.8 ± 0.4 | 25 ± 1.4 | 7.2 ± 0.8 | 0.52 ± 0.07 |
| PN superficial | 47 (n = 26 of 55) | 167 ± 27.5 | 4.9 ± 0.4 | 26 ± 1.2 | 6.8 ± 0.7 | 0.50 ± 0.05 |
| Statistics | χ² test p=0.987 | Mann-Whitney U test p=0.258 | Student T test p=0.047* | Student T test p=0.564 | Student T test p=0.706 | Student T test p=0.796 |
Table 3
Electrophysiological properties of interneurons in SuM-innervated area.
| VM (mV) | RM (MOhm) | CM (pF) | Firing adaptation index | Sag (mV) | |
|---|---|---|---|---|---|
| Basket cell (n = 16) | −57.3 ± 1.38 | 144 ± 28.1 | 64.0 ± 8.70 | 0.74 ± 0.05 | 9.4 ± 1.0 |
| Non-Basket Cell (n = 12) | −55.6 ± 1.84 | 224 ± 46.8 | 52.0 ± 5.90 | 0.57 ± 0.06 | 5.9 ± 1.4 |
| Interneuron SO (n = 6) | −57.0 ± 3.16 | 201 ± 21.0 | 44.7 ± 5.31 | 0.61 ± 0.11 | 7.6 ± 1.9 |
| Interneuron SR (n = 8) | −60.1 ± 2.89 | 282 ± 49.8 | 39.6 ± 3.18 | 0.65 ± 0.09 | 8.1 ± 2.1 |
| Statistics | One-way ANOVA test p=0.527 | One-way ANOVA test p=0.100 | Kruskal-Wallis test p=0.354 | One-way ANOVA test p=0.238 | One-way ANOVA test p=0.292 |
Table 4
Characteristics of excitatory SuM light-evoked transmission onto interneurons and pyramidal cells.
| Cell type | Connectivity (%) | Amplitude (pA) | Rise time (ms) | Decay time (ms) | Latency (ms) | Success rate |
|---|---|---|---|---|---|---|
| Pyramidal cell | 63 (n = 166 of 263) | −19 ± 1.6* | 3.4 ± 0.1* | 15 ± 0.5* | 2.9 ± 0.1 | 0.46 ± 0.02 |
| Basket cell | 82 (n = 18 of 22) | −43 ± 8.7* | 1.7 ± 0.3* | 8.4 ± 1.3* | 3.1 ± 0.4 | 0.59 ± 0.07 |
| Non-Basket Cell Interneuron SO Interneuron SR | 39 (n = 10 of 26) 12 (n = 2 of 17) 11 (n = 1 of 9) | −16 ± 2.8 | 2.6 ± 0.5 | 12 ± 1.4 | 3.4 ± 0.7 | 0.36 ± 0.06 |
| Statistics | χ² test p=0.006* | Kruskal-Wallis test p=0.016 Dunn-Holland-Wolfe post hoc p<0.05* | One-way ANOVA test p<0.001 Tukey post hoc p<0.001* | One-way ANOVA test p<0.001 Tukey post hoc p<0.001* | One-way ANOVA test p=0.580 | One-way ANOVA test p=0.066 |
Key resources table
| Reagent type (species) or resource | Designation | Source or reference | Identifiers | Additional information |
|---|---|---|---|---|
| Genetic reagent (Mus. musculus) | Tg(Slc17a-icre)10Ki | Borgius et al., 2010 | Tg(Slc17a-icre)10Ki; VGluT2-cre | |
| Genetic reagent (Mus. musculus) | Csf2rb2-Cre | Chen et al., 2020 | Csf2rb2-Cre; SuM-cre | |
| Genetic reagent (Mus. musculus) | Pvalbtm1(cre)Arbr/J (PV-Cre) | Jackson | RRID:IMSR_JAX:017320 | |
| Genetic reagent (adeno-associated virus) | AAV9.EF1a.DIO.hChR2(H134R).EYFP | Addgene | RRID:Addgene 20298 | |
| Genetic reagent (adeno-associated virus) | AAV9.hSynapsin.EGFP.WPRE.bGH | Addgene | RRID:Addgene 51502 | |
| Genetic reagent (adeno-associated virus) | AAV.Synapsin.DIO.hM4D(Gi).mCherry | McHugh Laboratory, Riken | ||
| Genetic reagent (adeno-associated virus) | AAV2/9.hSyn.hChR2(H134R).EYFP.WPRE.hGH | Addgene | RRID:Addgene 26973 | |
| Genetic reagent (Canine adeno virus) | CAV2-cre | Platforme de Vectorologie de Montpellier | CAV Cre | |
| Antibody | Anti-RGS14 (mouse monoclonal) | NeuroMab | 73–422 RRID:AB_2877596 | (1:300) |
| Antibody | Anti-GFP (chicken polyclonal) | Abcam | ab13970 RRID:AB_300798 | (1:10,000) |
| Antibody | Anti-VGluT2 (guinea pig polyclonal) | Millipore | AB2251 RRID:AB_1587626 | (1:10000) |
| Antibody | Anti-parvalbumin (rabbit polyclonal) | Swant | PV27 RRID:AB_2631173 | (1:2000) |
| Antibody | Anti- PCP4 (rabbit polyclonal) | Sigma | HPA005792 RRID:AB_1855086 | (1:600) |
| Antibody | Anti-Calretinin (mouse monoclonal) | Millipore | MAB1568 RRID:AB_94259 | (1:500) |
| Antibody | Anti-mCherry (rat monoclonal) | Life technologies | M11217 RRID:AB_2536611 | (1:5000) |
| Other | Far-red neurotrace | Life technologies | N21483 RRID:AB_2572212 | (1:300) |
| Peptide, recombinant protein | Alexa-546-conjugated streptavidin | Life Technologies | S11225 RRID:AB_2532130 | (1:500) |
| Peptide, recombinant protein | Biocytin | HelloBio | HB5035 | (4mg/mL) |
| Chemical compound, drug | NBQX | HelloBio | HB0443 | (10 µM) |
| Chemical compound, drug | D-APV | HelloBio | HB0225 | (50 µM) |
| Chemical compound, drug | SR95531 | Tocris | 1262 | (1 µM) |
| Chemical compound, drug | CGP55845A | Tocris | 1248 | (2 µM) |
| Chemical compound, drug | DPDPE | Alfa Aesar | J66293 | (0.5 µM) |
| Chemical compound, drug | DAMGO | Tocris | 1171 | (1 µM) |
| Chemical compound, drug | Clozapine N-oxide (CNO) | HelloBio | HB1807 | (10 µM) |
| Chemical compound, drug | Tetrodotoxin (TTX) | Tocris | 1078 | (0.2 µM) |
| Chemical compound, drug | Carbamoylcholine chloride (CCh) | Tocris | 2810 | (10 µM) |
| Chemical compound, drug | ω-agatoxin TK | Alomone labs | STA-530 | (200 nM) |
| Software, algorithm | Matlab | Mathworks | http://www.mathworks.com RRID:SCR_001622 | |
| Software, algorithm | Igor Pro | Wavemetrics | http://www.wavemetrics.com RRID:SCR_000325 RRID:SCR_004186 (neuromatic) | |
| Software, algorithm | OriginPro | OriginLab Corporation | http://www.originlab.com RRID:SCR_014212 | |
| Software, algorithm | pClamp | Molecular Devices | http://www.moleculardevices.com RRID:SCR_011323 | |
| Software, algorithm | Axograph | Axograph | http://www.axograph.com RRID:SCR_014284 |
Additional files
Download links
A two-part list of links to download the article, or parts of the article, in various formats.
Downloads (link to download the article as PDF)
Open citations (links to open the citations from this article in various online reference manager services)
Cite this article (links to download the citations from this article in formats compatible with various reference manager tools)
Local circuit allowing hypothalamic control of hippocampal area CA2 activity and consequences for CA1
eLife 10:e63352.
https://doi.org/10.7554/eLife.63352


