Properdin oligomers adopt rigid extended conformations supporting function
- Department of Molecular Biology and Genetics, Center for Structural Biology, Aarhus University, Denmark
- Structural Biophysics, X-ray and Neutron Science, the Niels Bohr Institute, University of Copenhagen, Denmark
- Linderstrøm-Lang Centre for Protein Science, Department of Biology, University of Copenhagen, Denmark
Figures
Figure 1 with 3 supplements
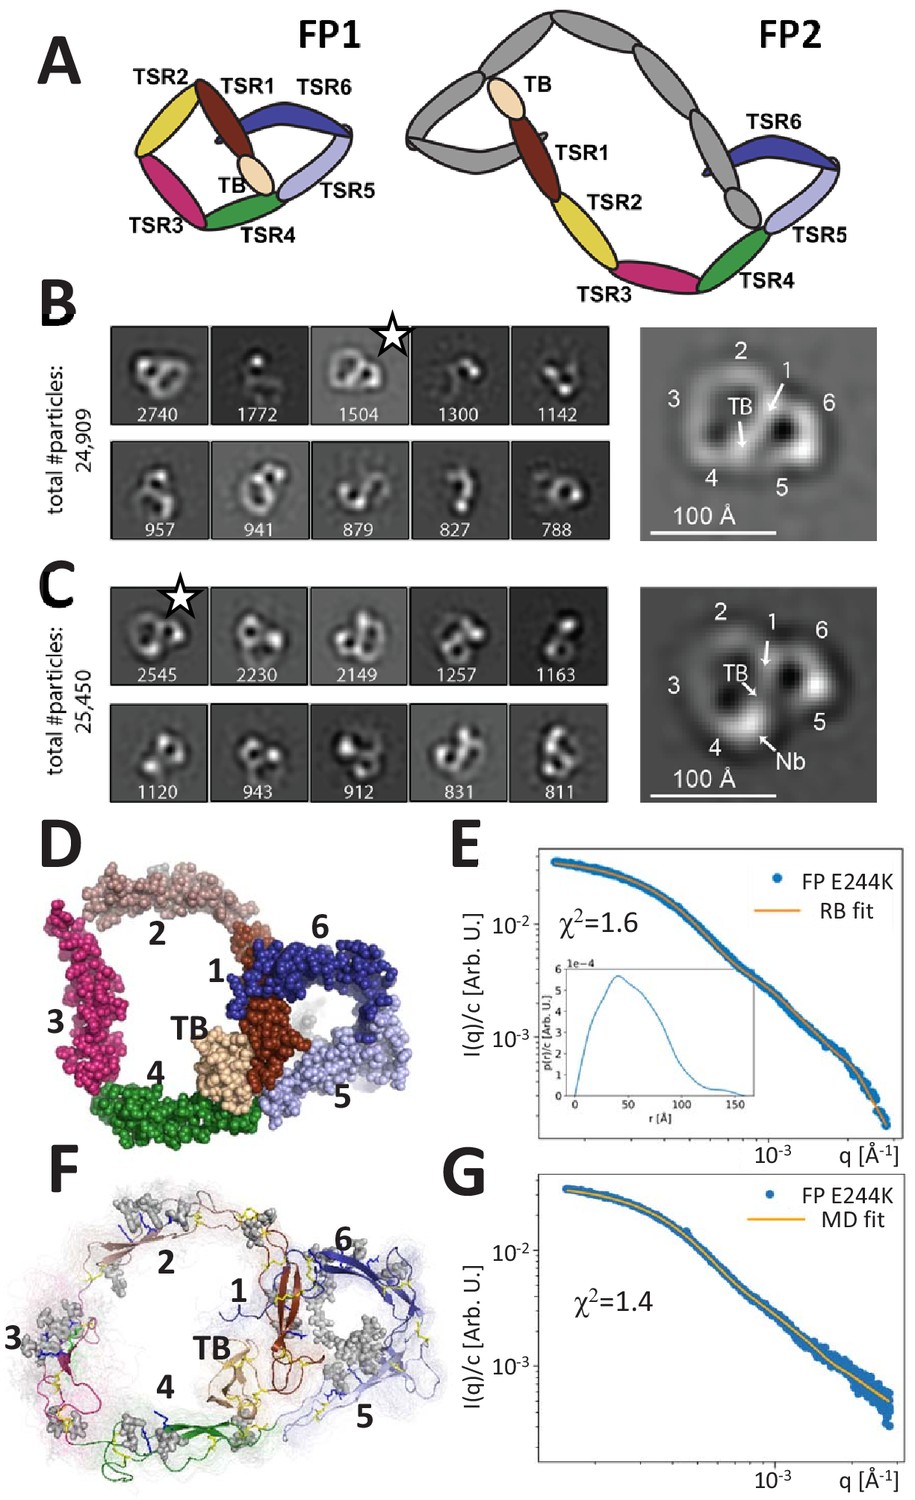
Principles of properdin architecture and the structure of FP1.
(A) Schematic representation of the FP1 monomer and FP2 as an example of an oligomer, where one subunit is colored gray, while the other is colored according to the domain structure as for FP1. (B) The 10 most populated nsEM 2D classes obtained with FP1 with the number of particles indicated. A magnified view of the 2D class marked by star is shown to the right. (C) As for (B), but for the FP1-hFPNb1 complex. Compared to FP1, an additional mass marks the location of hFPNb1 and hence TSR4 enabling assignment of the TB domain and the six thrombospondin repeats in the magnified view to the right. (D) Representative atomic model of FP1 E244K derived by rigid-body modeling against the SAXS data. (E) Comparison of SAXS experimental data (Pedersen et al., 2017) and the fitted scattering curve corresponding to the FP1 E244K model presented in (E). Insert to (E): p(r) function derived from the SAXS data. (F) Conformational ensemble of FP1 E244K sampled by a 1 μs MD simulation represented by 100 frames with 10 ns interval shown as transparent tubes. The starting model is displayed as a cartoon with the glycans and glycosylated residues in gray stick representation. Disulfide bridges are represented by yellow sticks. (G) Comparison of SAXS experimental data and the scattering curve obtained from MD ensemble after refinement using the Bayesian maximum entropy approach, the two curves fit with χ2 = 1.4. The minor difference in the experimental data apparent at the highest q-values in (E) and (G) is due to subtraction of a constant by CORAL in (E).
Figure 1—figure supplement 1
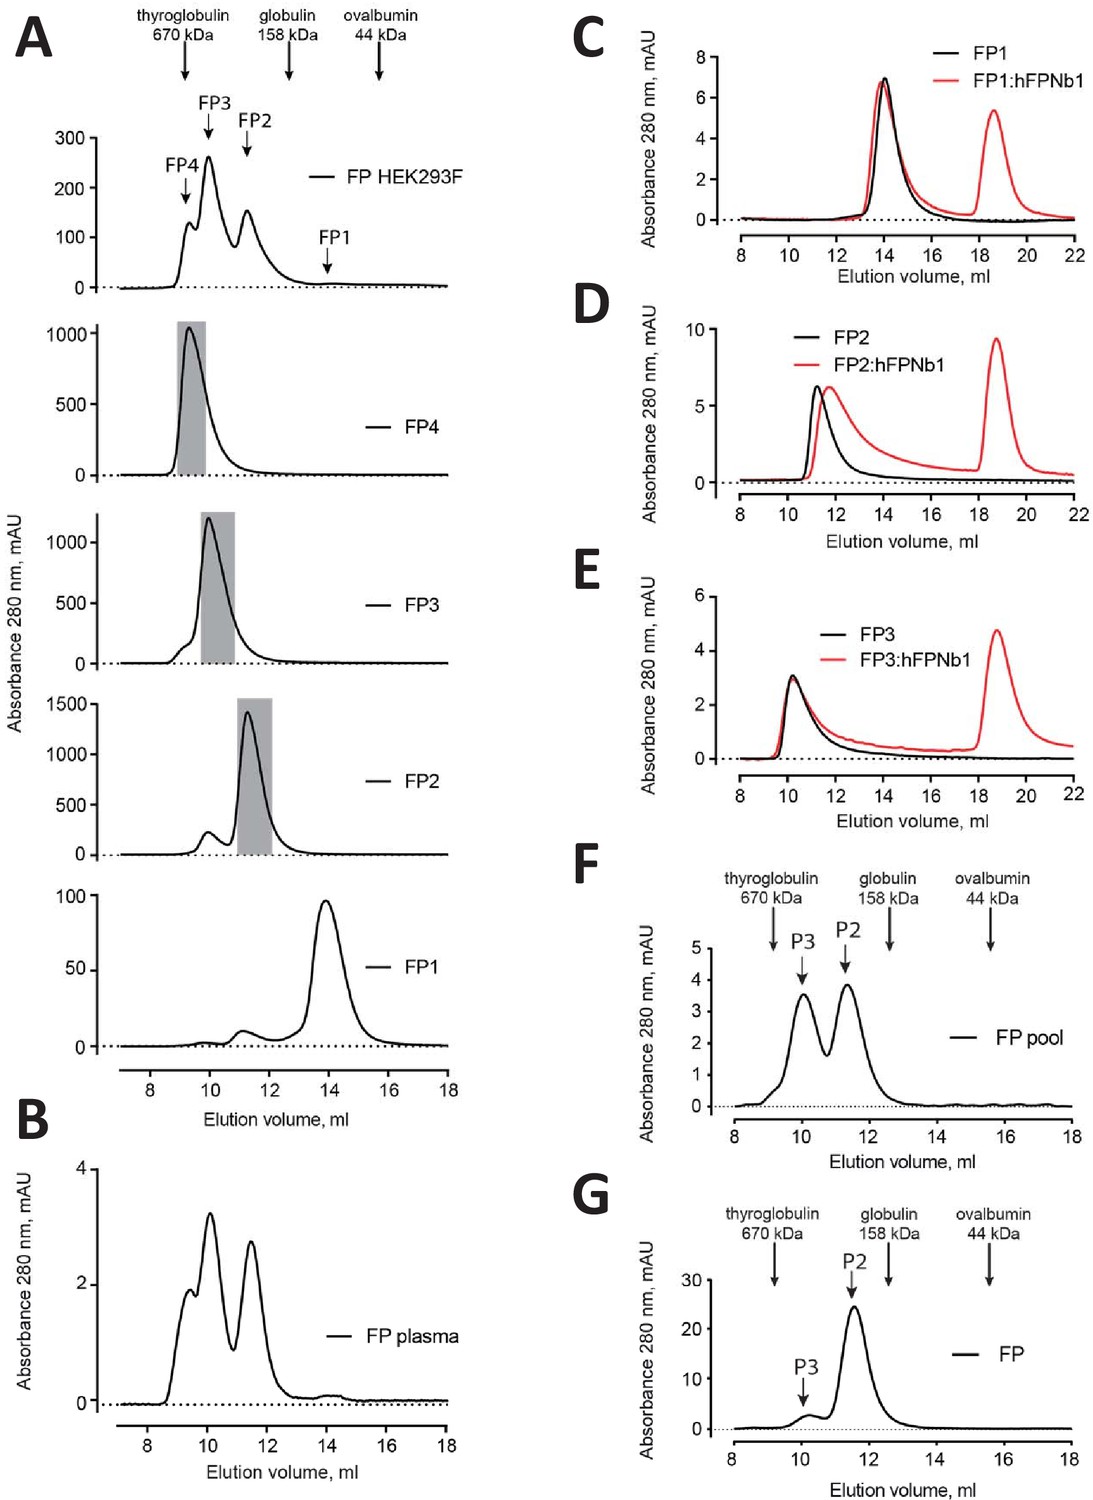
Elution profiles of recombinant FP.
(A) Top, SEC analysis of initial pool of recombinant FP obtained by His6–based affinity chromatography. Below is presented SEC profiles for the final purification step of recombinant FP1, FP2, FP3, and FP4 obtained from HEK293F cells used for SAXS data collection and negative-stain EM (grayed areas). (B) SEC profile of commercial plasma FP for comparison. (C–E) SEC analysis of FP1, FP2, and FP3 with or without hFPNb1 used for nsEM in Figures 1 and 2. (F–G) SEC analysis of the FP2/FP3 pool and a pool dominated by FP2 used the functional assays in Figure 5 and for the exchange experiments in Figure 4, respectively.
Figure 1—figure supplement 2
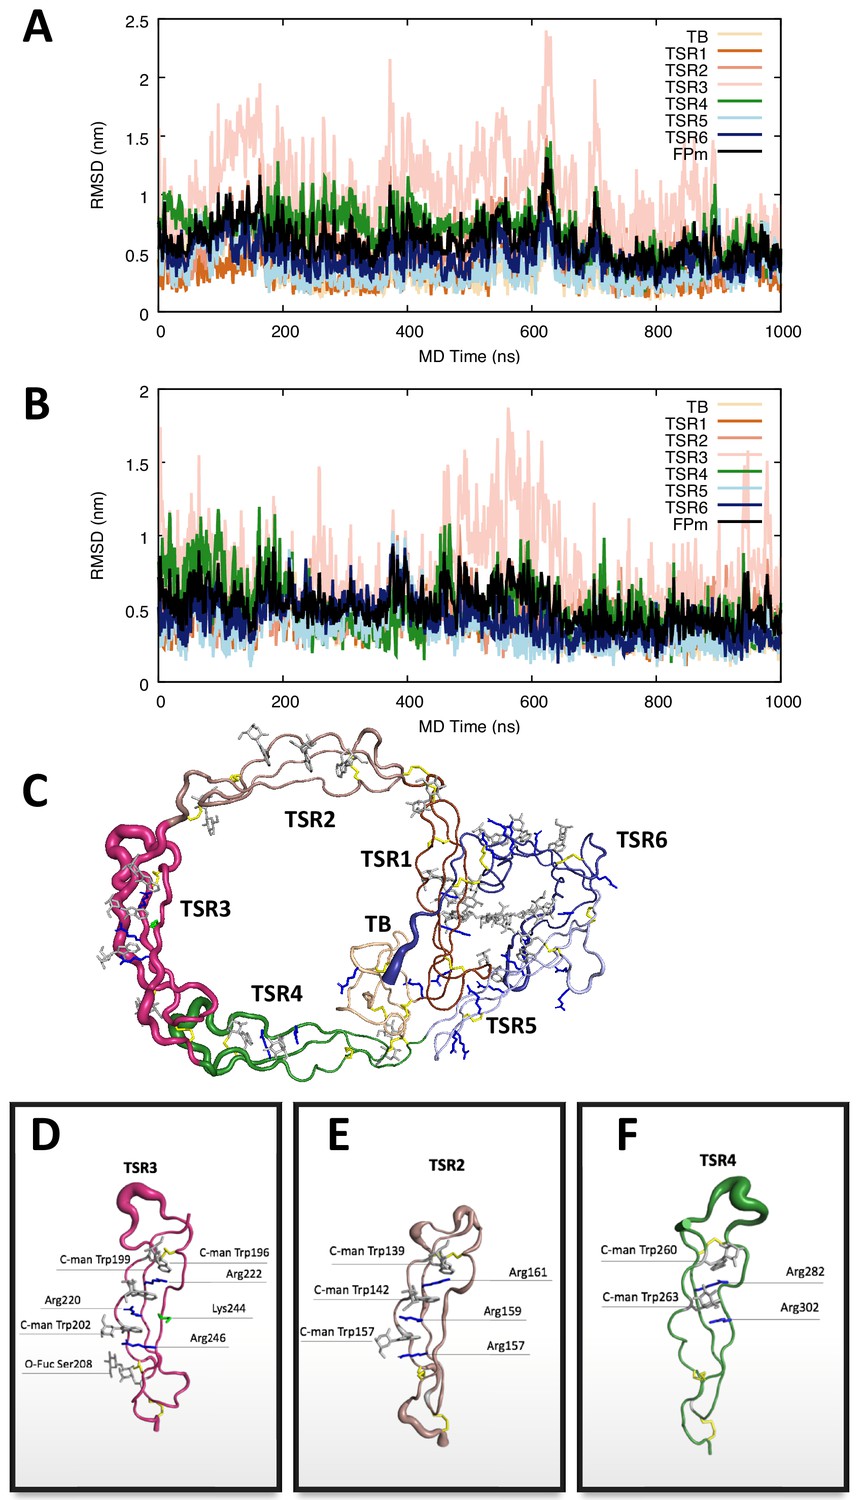
Molecular dynamics simulation of the FP1 E244K.
(A,B) The root mean square deviation of each domain and the whole protein with the trajectories aligned to the initial FP1 E244K model in two independent 1 µs MD simulations. Both simulations commonly revealed significant dynamics of TSR3. (C) The RMS fluctuations within the entire FP E244K with the trajectory aligned to the initial model illustrated by cartoon representations in which the thickness of the tube is scaled by the corresponding RMS fluctuation values per residue. (D–F) Close-up of the RMS fluctuations of TSR3, TSR2, and TSR4 with the trajectories aligned to the corresponding domain, indicating that these thrombospondin repeats have limited conformational flexibility in their overall structure. Importantly, the mutation of glutamate 244 to lysine in TSR3 does not cause breakdown of the central Trp-Arg stack.
Figure 1—video 1
Molecular dynamics simulation of FP E244K.
Domains and glycans are colored as in Figure 1F. All frames in a 1 µs simulation are displayed as thin lines in the background. Notice how TSR3 is able to rotate substantially around the two hinges connecting it to TSR2 and TSR4 facilitated by flexibility of the N-terminal regions in TSR3 and TSR4. The rest of the molecule exhibits only limited dynamics.
Figure 2
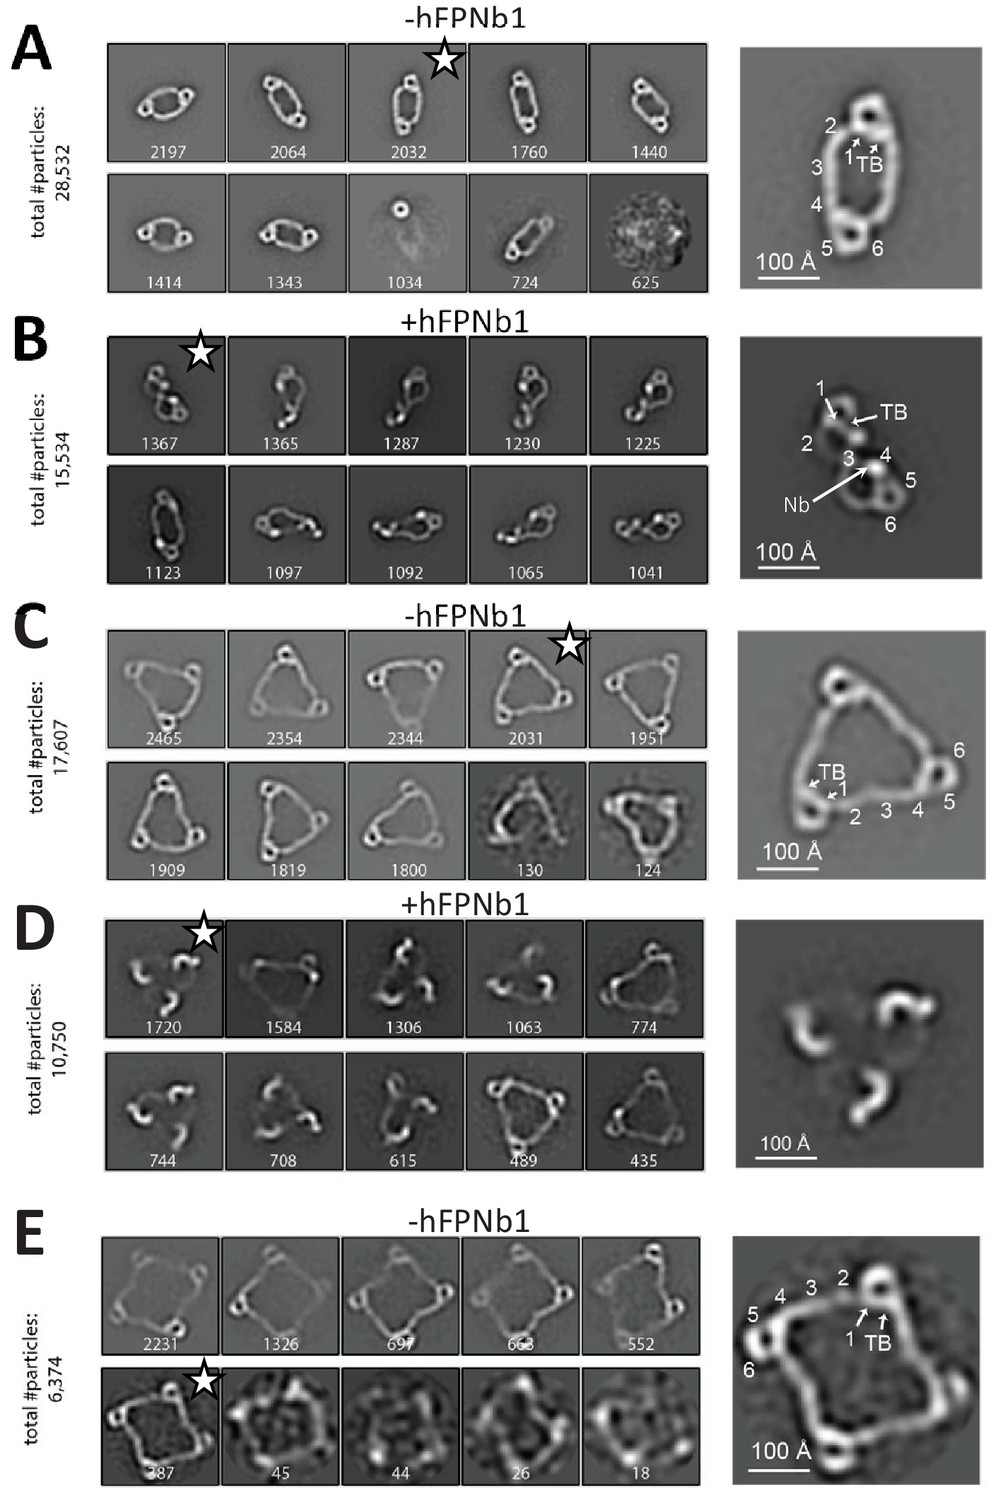
Negative-stain EM analysis of FP oligomers.
For all cases, the 10 most populated nsEM 2D classes obtained are displayed with the number of particles indicated. (A) The 2D classes obtained with FP2 and a magnified view of the 2D class marked by star is shown to the right with the putative domain assignment indicated for one of the two monomers in the dimer. Notice the difference in curvature at TSR2 and TSR4 of the connecting arms, which facilitates the domain assignment. (B) As (A), but with the FP2-hFPNb1 complex. The double-pretzel conformation is present in two classes, while others feature the elliptical shape or intermediates. (C) The 2D classes obtained with FP3 reveal a flat molecule structure of apparent C3 symmetry. (D) The FP3-hFPNb1 complex. The 2D class to the left reveals an FP3 conformation with an apparent C3 symmetry that is radically different from the cyclic appearance of FP3 in (C), but 2D classes presenting flat cyclic FP3 and intermediates are also present. (E) The 2D classes obtained with FP4 suggest a planar extended molecule with apparent C4 symmetry.
Figure 3 with 1 supplement
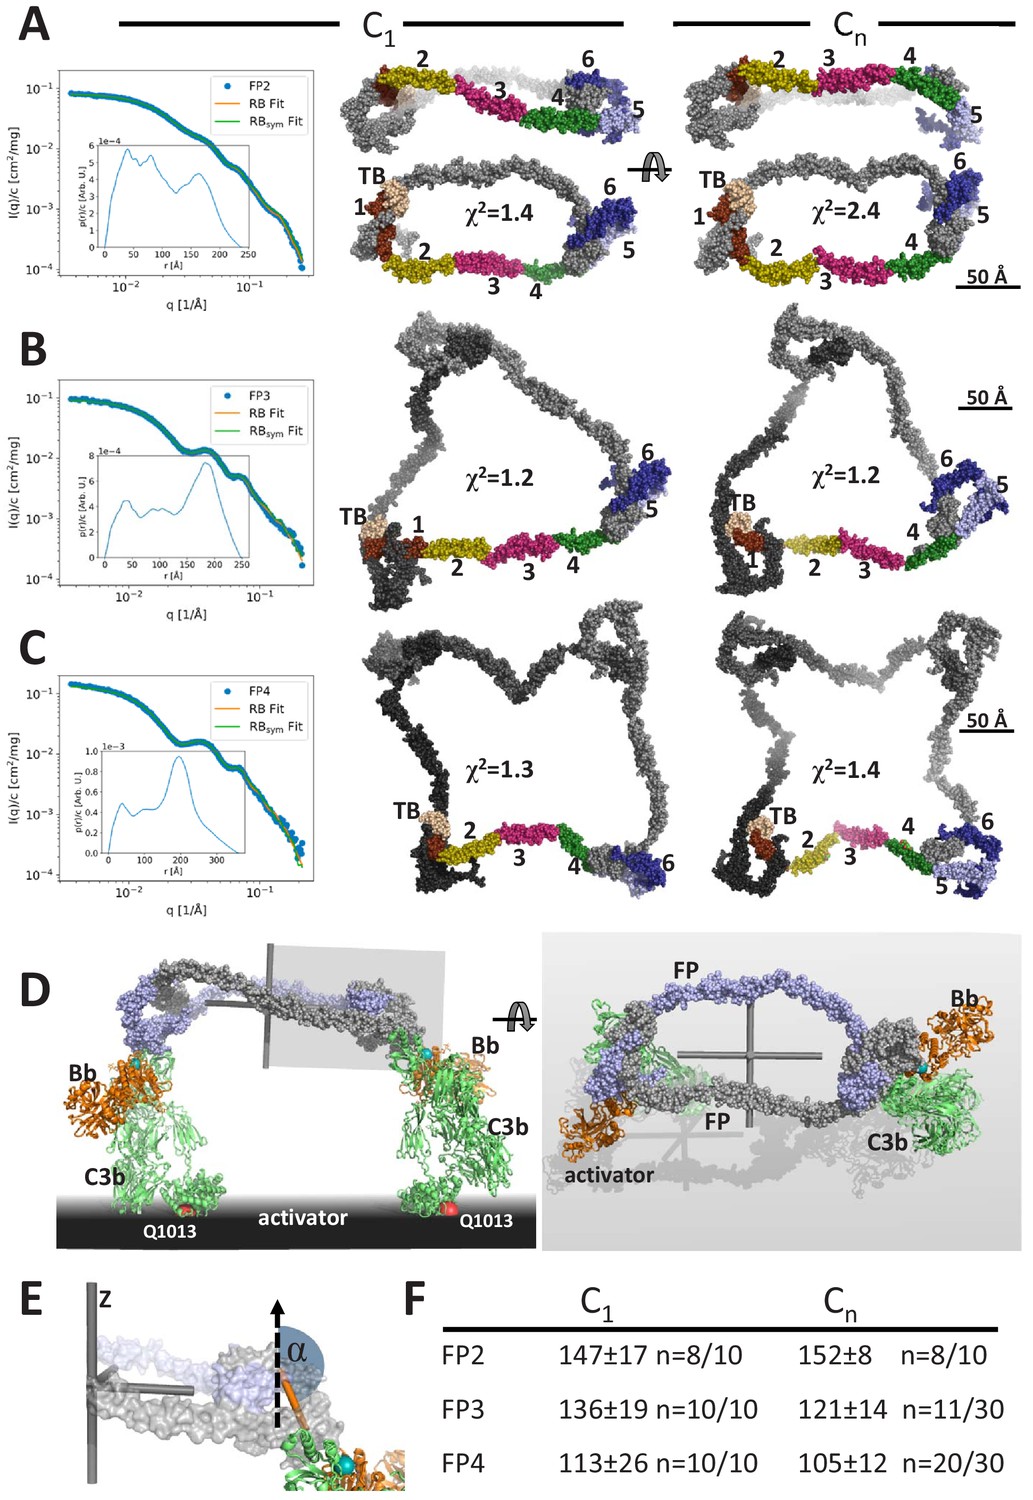
Models of FP oligomers obtained by SAXS rigid-body refinement.
(A–C) Left: SAXS data (blue) and model fits (orange) corresponding to FP2, FP3, and FP4 structures obtained with C1 symmetry. Inserts plot the corresponding p(r) functions. Middle: Models fitted using C1 symmetry. Right: Models fitted assuming Cn symmetry. The C1 models were chosen as the most representative model in the largest cluster from the 10 generated, whereas the Cn models were those amongst 10 or 30 models that according to their χ2 value were in best agreement with the experimental data, see (F). In (A), two orientations are displayed to illustrate the curvature of FP2 models. (D) Hypothetical model of FP2 from panel A bound to two C3 convertases to illustrate that such a complex could be formed on an activator to which the two C3b molecules (green) carrying the Bb protease (orange) are bound through their Gln1013 (red sphere). The two FP monomers are colored light blue and gray, respectively. To the left is presented a side view and to the right a top view. The principal axes of FP2 are displayed as a gray Cartesian coordinate system. (E) Enlarged view of the area outlined with a gray box in (D). The vertical dashed vector is parallel to the smallest principal axis (labeled ‘z’) of the FP2 molecule, the orange stick represents the vector in the plane of the FP eye used for calculation of α, the angle between the two vectors. (F) The average α values calculated from the SAXS rigid-body models. The number of models used for statistics from a pool of 10 or 30 models is indicated by the number n, remaining models were discarded as they had χ2 values that were significantly higher than the n well fitting models.
Figure 3—figure supplement 1
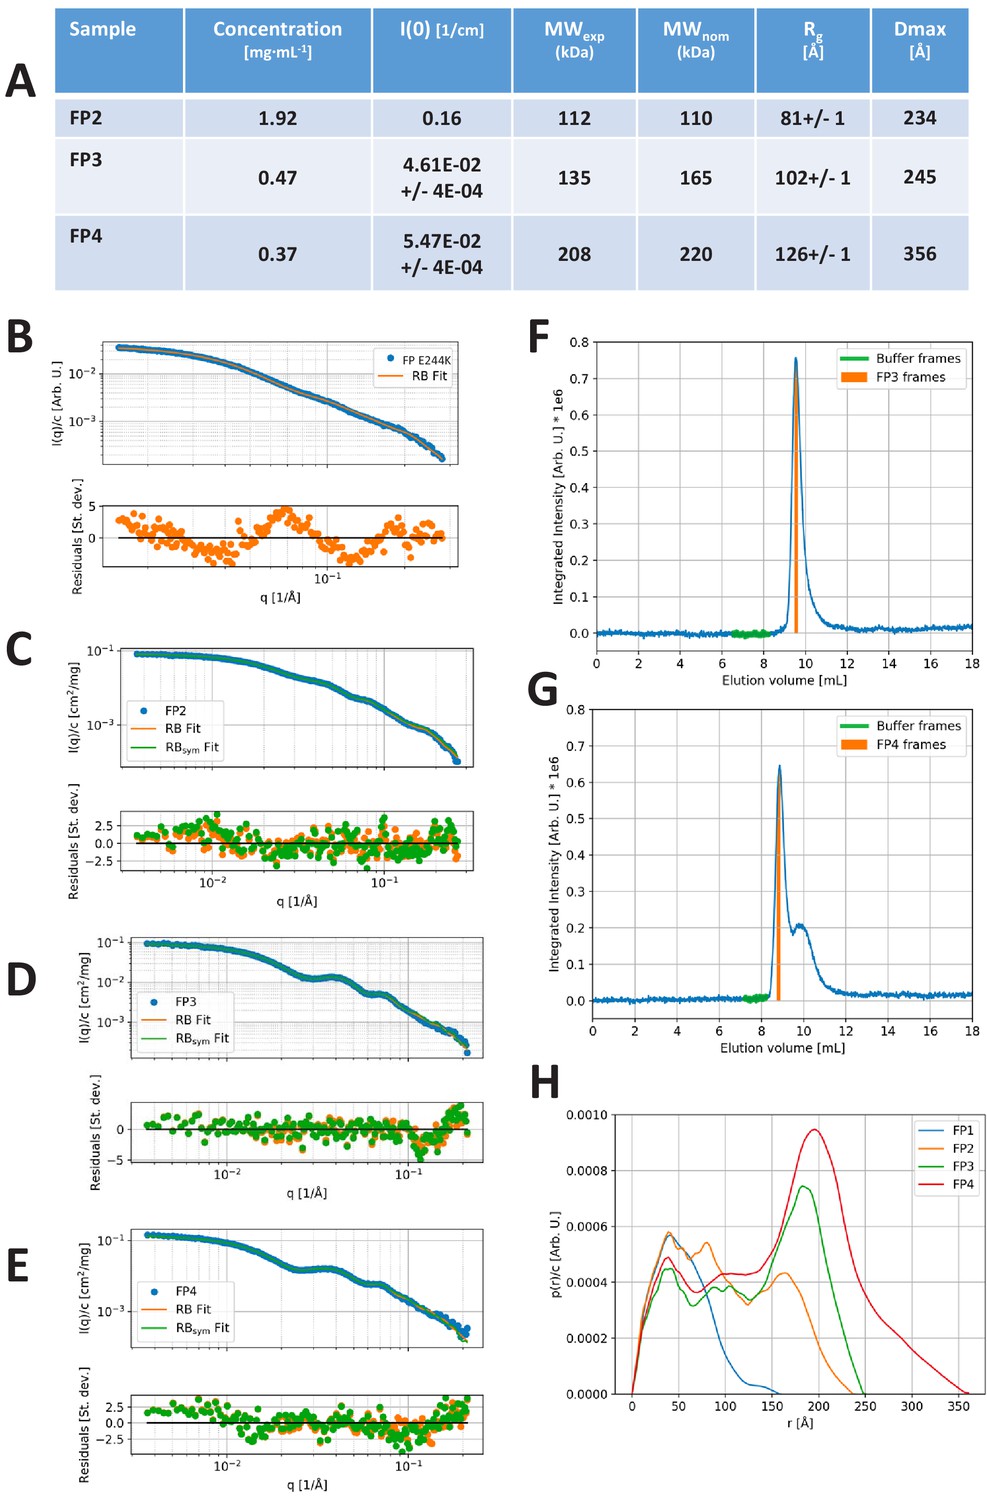
SAXS data.
(A) Model-independent parameters of the SAXS analysis. Forward scattering intensity, I(0), in absolute units of cm−1. MWexp: Average MW of the oligomer as derived from the forward scattering and the protein concentration. The uncertainty of the MW determination is expected to be around 10% for the FP2, which was measured using the sample changer setup and around 20% for the SEC-SAXS-based setup. When taking this into account, the experimental MW values compare well with their nominal values, MWnom, calculated using a monomer MW of 55 kDa. Rg: Radius of gyration and Dmax: Maximal distance of the p(r). The I(0), Rg, and Dmax are derived from the indirect Fourier transformation as described in the Materials and methods section. (B–E) Experimental SAXS data (blue points), fit of rigid-body (RB) model (orange full line) and fit of Cn symmetric model with n = 2 (FP2), 3 (FP3), and 4 (FP4), respectively, in (C), (D), and (E) (green full line). Corresponding residual plots are presented underneath each SAXS plot. (F–G) Integrated SAXS intensity of the SEC-SAXS data obtained for FP3 and FP4. The frames used for the foreground (FP3/4 frames) and buffer frames selected for the background are indicated on the plots. (H) Direct comparison of the p(r) functions obtained from the SAXS data on FP1 E244K, FP2, FP3, and FP4.
Figure 4
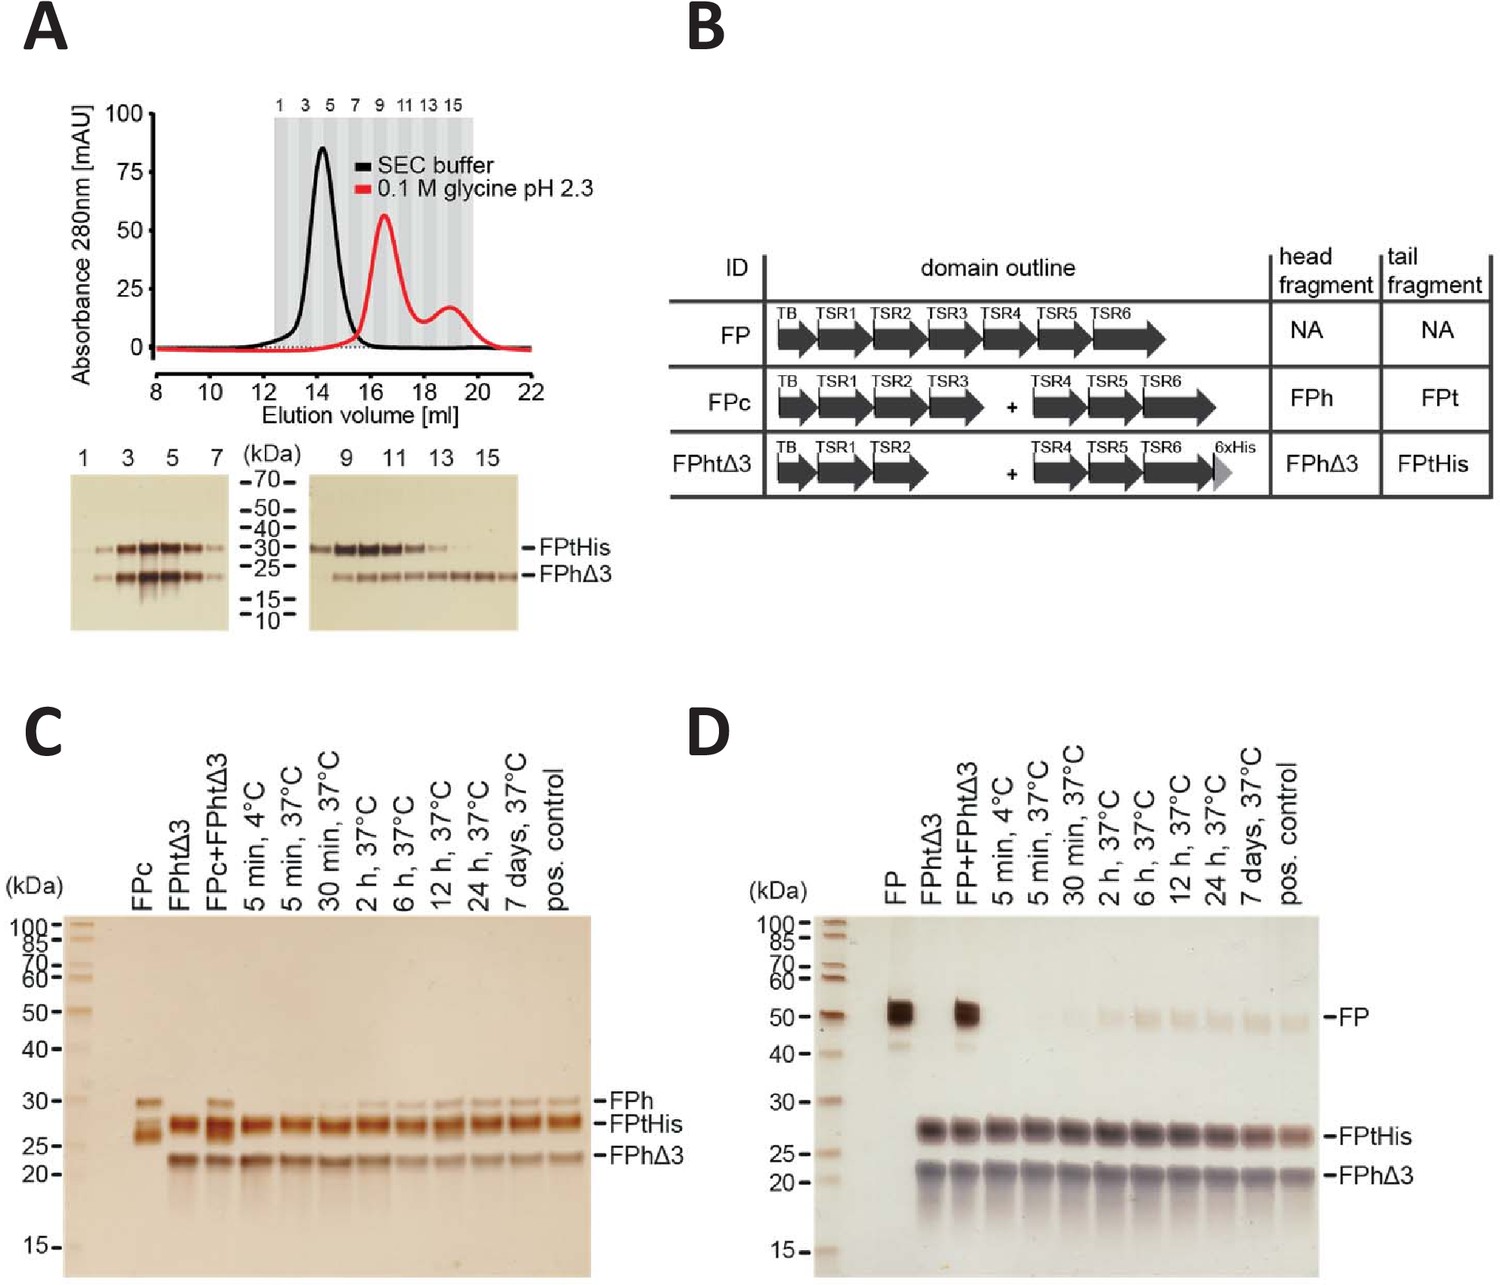
FP oligomerization interfaces can open up to enable exchange monomer.
(A) SEC analysis of FPhtΔ3 in 20 mM HEPES, 150 mM NaCl, pH 7.5 (black), or 100 mM glycine pH 2.3 (red), demonstrating that the two chains of FPhtΔ3 dissociate at low pH (top). Fractions from the SEC experiments were analyzed by SDS–PAGE and silver staining showing that at neutral pH the two fragments of FPhtΔ3 co-elute (bottom, left), whereas at low pH, FPtHis (25 kDa) elute first and FPhΔ3 (18 kDa) elute last (bottom, right). (B) Overview of FP constructs used in (C) and (D). (C) A silver-stained SDS–PAGE gel following the exchange of chains between FPc and FPhtΔ3. The exchange was monitored by the appearance of the FPh chain (25 kDa) from FPc and the disappearance of the FPhΔ3 chain, after pull-down on Ni-NTA beads using the His-tag on the C-terminus of FPtHis. (D) A silver-stained gel from SDS–PAGE demonstrating the exchange of FP chains between FP2 and FPhtΔ3. The exchange was monitored by the appearance of the full-length FP (50 kDa) after pull-down on Ni-NTA beads using the C-terminal His-tag of FPtHis from FPhtΔ3.
Figure 5 with 1 supplement
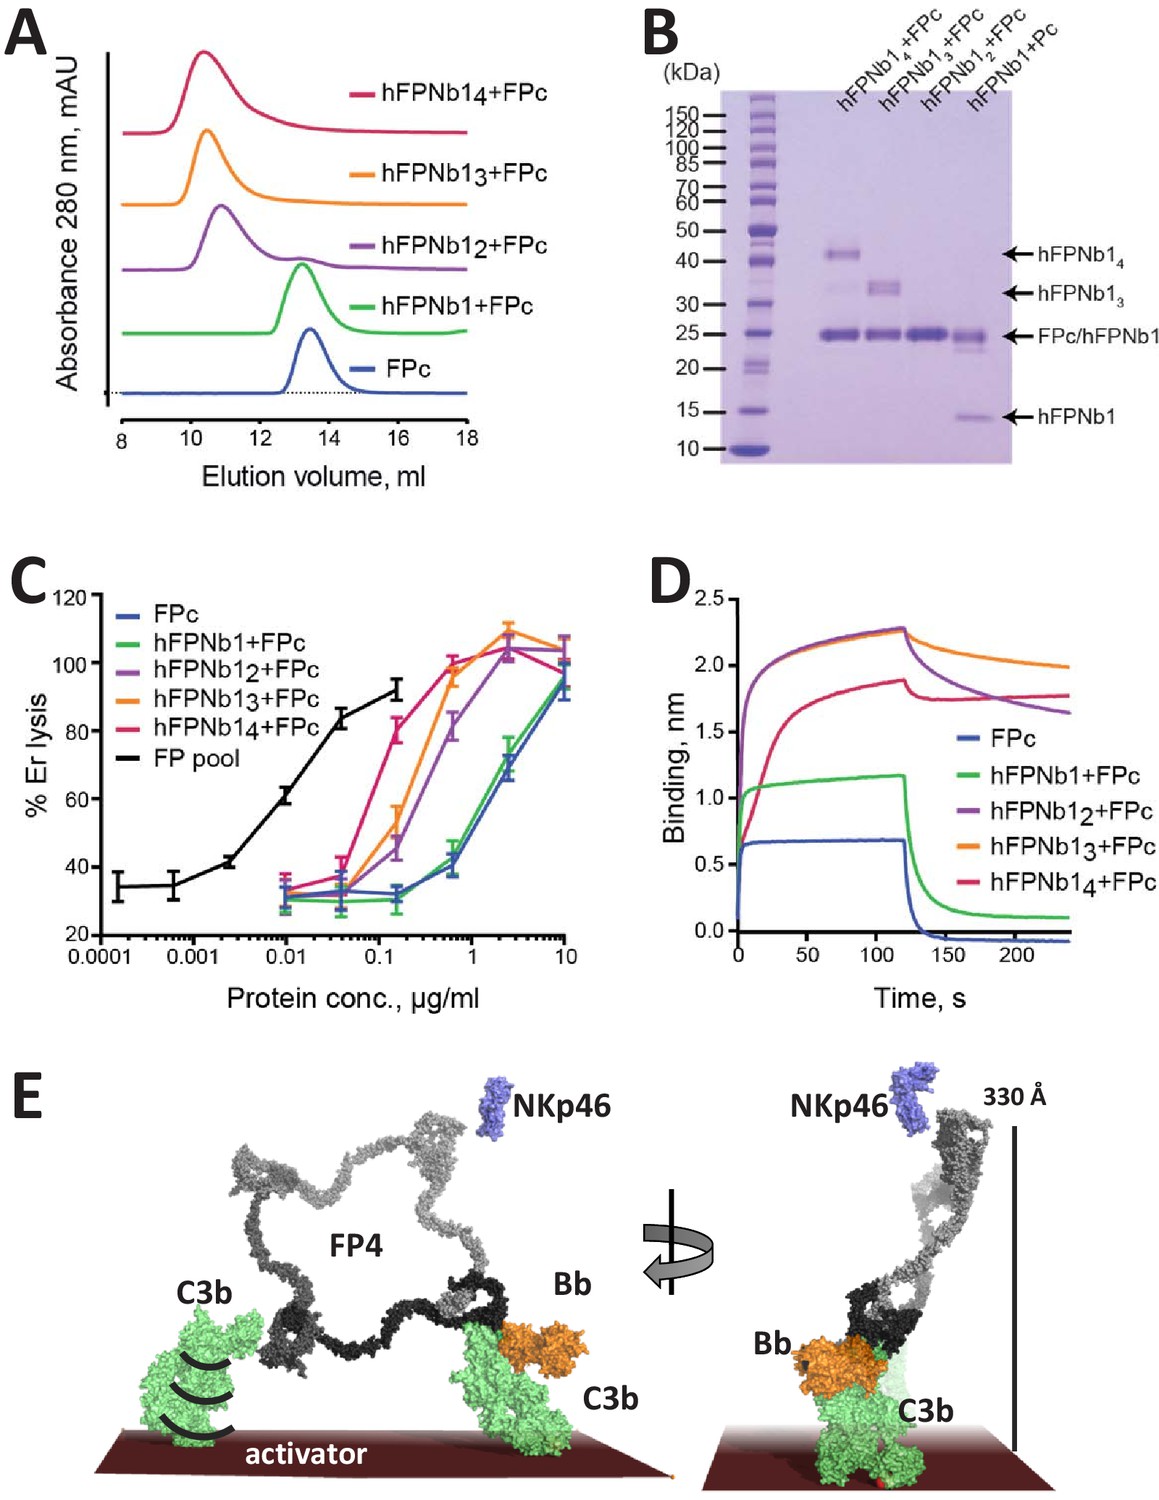
The biological activity of nanobody-linked FP oligomers is lower than that of an FP2/FP3 oligomer pool.
(A) SEC profiles showing that hFPNb1 oligomers form stable oligomers with FPc. (B) SDS–PAGE analysis of the peak fraction from each SEC experiments in (A) confirming that all hFPNb1 variants form stable complexes with FPc. (C) Assay where lysis of rabbit erythrocytes (% of lysis in pure water) in FP depleted serum is used as a measure of AP activity. Erythrocyte lysis is shown as a function of protein concentration. The ability to induce erythrocyte lysis clearly increases with increasing hFPNb1-mediated oligomerization of FPc. Each point corresponds to the average of two independent experiments, both performed in technical duplicates. The error bars represent the standard deviation between the two independent experiments. (D) Biolayer interferometry sensorgrams showing the binding of FPc (blue) or preformed FPc-hFPNb1 monomers (green), dimers (purple), trimers (orange), or tetramers (red) to a C3b-coated sensor. The sensorgrams demonstrate that binding of hFPNb1-mediated FPc oligomers to C3b is stronger than for the monomeric FPc or the FPc-hFPNb1 complex. In particular, the dissociation rate is observed to be strongly dependent on hFPNb1 valency. (E) Model of FP structure–function relationships using FP4 as example. To the left, one convertase binding site is occupied, a neighboring binding site may form contact with a nearby C3b, proconvertase, or convertase. Flexibility of C3b due to the single-bond attachment to the activator may favor FP interaction with the second C3b molecule. Right, FP-convertase binding sites not pointing toward the activator surface reach >300 Å into solution and appear as ideal for bridging C3b-opsonized pathogens with NKp46 presenting innate lymphoid cells. Notice that the NKp46 binding site on FP is presently unknown.
Figure 5—figure supplement 1

Sequence alignment of FP sequences reveals a shared domain organization across major phylogenetic classes.
Sequences displayed represent the classes Hyperoartia (Petromyzon marinus), Mammalia (Homo sapiens), Aves (Camarhynchus parvulus), Actinopterygii (Salmo trutta), Reptilia (Python bivittatus), and Amphibia (Xenopus laevis). Residues are colored in shades of gray according to conservation. The domains are indicated by the colored boxes. The residue numbers at the top are those of human the FP sequence.
Videos
Video 1
Close-up on TSR3 during the MD simulation of FP E244K.
The thrombospondin repeat is shown in the orientation and coloring used in Figure 1—figure supplement 2. Notice how the central Trp-Arg stack remains stable despite the presence of a lysine at position 244. In the structure of wild-type FPc, the glutamate at position 244 engages the side chain of Arg220 in an electrostatic interaction and thereby stabilizes the arginine conformation.
Tables
Key resources table
| Reagent type (species) or resource | Designation | Source or reference | Identifiers | Additional information |
|---|---|---|---|---|
| Strain, strain background (Escherichia coli) | E. coli BL21(DE3) LOBSTR strain | PMID:23852738 | hFPNb1 expression system | |
| Cell line (Homo sapiens) | HEK293F | Thermo Fisher Scientific | R79007 | FP expression system |
| Transfected construct (Homo sapiens) | FP | This paper | Construct used for expression and purification of the different FP oligomers. Construct is based on that described in PMID:28264884 and modified with a C-term His-tag | |
| Transfected construct (Homo sapiens) | FPc | PMID:28264884 | Monomeric FP used insize exclusion chromatography, biolayer interferometry and exchange experiments | |
| Transfected construct (Homo sapiens) | FPthΔ3 | PMID:31507604 | Monomeric FP lacking TSR3 used in exchange experiment | |
| Biological sample (Oryctolagus cuniculus) | Er | Statens Serum Institut, Denmark | Rabbit erythrocytes used in AP activity assay | |
| Biological sample (Homo sapiens) | FP depleted serum | Complement Technologies | A339 | Human FP depleted serum |
| Antibody | hFPNb1. Lama monoclonal VHH domain. | PMID:31507604 | Nanobody recognizing TSR4 domain of human FP used forsize exclusion chromatography and negative-stain EM. | |
| Commercial assay or kit | Silver Quest | Thermo Fisher Scientific | LC6070 | Silver stain kit |
| Software, algorithm | CORAL | PMID:25484842 | ||
| Software, algorithm | Gromacs 2019.4 and 2019.5 | 10.1016/j.softx.2015.06.001 | Software used for MD simulations | |
| Software, algorithm | Crysol3 | PMID:28808438 | Calculation of theoretical SAXS curves | |
| Software, algorithm | RELION | PMID:23000701 | Data processing of negative-stain EM micrographs | |
| Other | Biotinylated human C3b | PMID:28264884 | Biotinylated C3b used for biolayer interferometry |
Additional files
Download links
A two-part list of links to download the article, or parts of the article, in various formats.
Downloads (link to download the article as PDF)
Open citations (links to open the citations from this article in various online reference manager services)
Cite this article (links to download the citations from this article in formats compatible with various reference manager tools)
Properdin oligomers adopt rigid extended conformations supporting function
eLife 10:e63356.
https://doi.org/10.7554/eLife.63356


