Innovation of heterochromatin functions drives rapid evolution of essential ZAD-ZNF genes in Drosophila
- Medical Scientist Training Program, University of Washington School of Medicine, United States
- Molecular and Cellular Biology Graduate program, University of Washington School of Medicine, United States
- Division of Basic Sciences, Fred Hutchinson Cancer Research Center, United States
- Biological Systems and Engineering Division, Lawrence Berkeley National Laboratory, United States
- Department of Molecular and Cell Biology, University of California at Berkeley, United States
- Innovative Genomics Institute, United States
- Howard Hughes Medical Institute, Fred Hutchinson Cancer Research Center, United States
Figures
Figure 1

Total number of ZAD-ZNF genes across Drosophila.
Phylogeny of 12 Drosophila genomes with a scale bar showing approximate divergence times (Drosophila 12 Genomes Consortium, 2007). The number of ZAD-containing genes in each Drosophila species genome (Supplementary file 1) is indicated by black bars.
Figure 2 with 1 supplement

Nicknack and Oddjob are essential for viability.
(A) A schematic of the Oddjob-Nicknack cluster of ZAD-ZNF genes in D. melanogaster. (B) Viability of adult flies ubiquitously knocked down for each Odj-Nnk cluster member. The vertical axis shows a ratio of the observed/expected number of knockdown progeny per cross; each cross is represented by a point. Ubiquitous knockdown of either Odj or Nnk greatly reduces adult viability. Horizontal bars represent the mean and one standard deviation. We compared controls and ZAD-ZNF knockdowns using a two-tailed Student’s t-test; ** denotes p-value<0.01. (C) Phylogenomic analysis of the Odj-Nnk cluster shows that Oddjob, CG17801 and CG17806 all date back to the origin of the Drosophila genus. However, Oddjob is the only gene within the cluster retained in all queried Drosophila species; CG17801 has been lost within the obscura clade and in D. takahashii, whereas CG17806 has undergone numerous gains and losses. CG17803 arose in the ancestor of D. melanogaster and D. ananassae but was lost in D. eugracilis. Nicknack arose in the ancestor of D. melanogaster and D. pseudoobscura, duplicated in D. biarmipes and D. takahashii, but was independently lost in D. ananassae and the D. elegans/D. rhopaloa lineage.
Figure 2—figure supplement 1
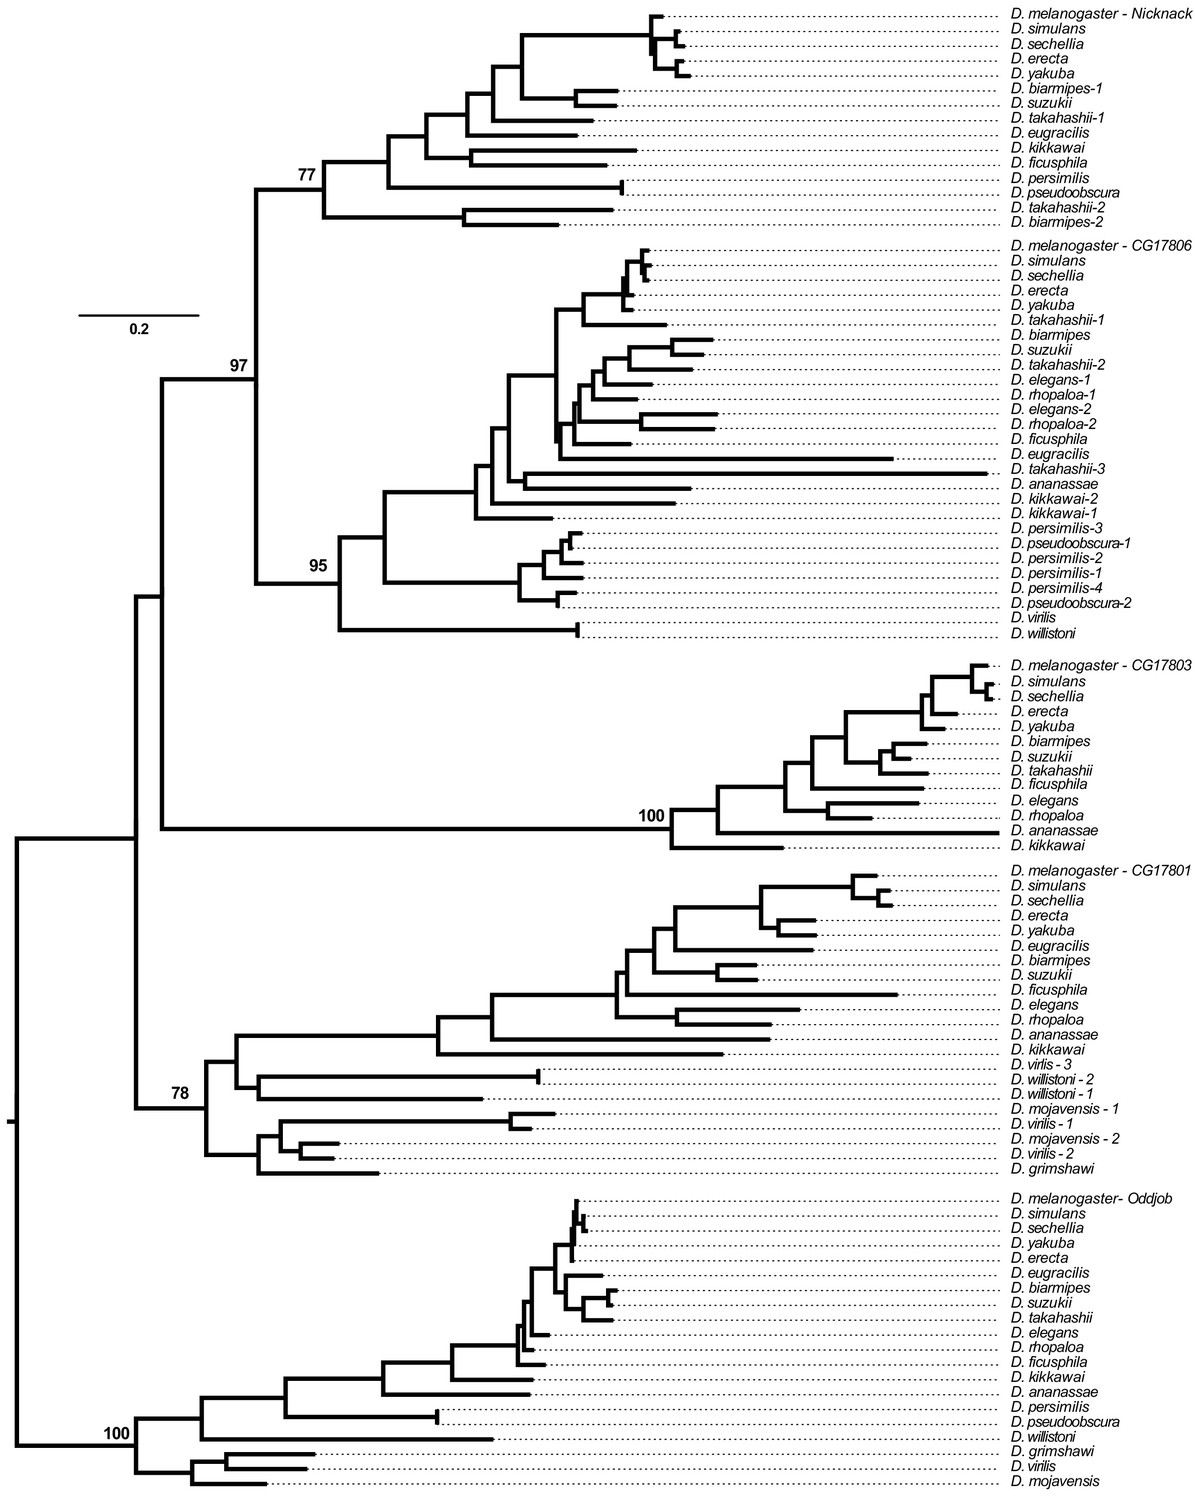
Phylogenetic analysis of all genes found within the Odj-Nnk ZAD-ZNF cluster across 20 Drosophila species based on a multiple alignment of their ZNF domains (Supplementary file 2).
Bootstrap numbers in support of each orthology group (as a percentage of 100 bootstrap trials) are reported. Numbers next to the species names refer to lineage-specific gene duplications within orthology groups (Figure 2C).
Figure 3
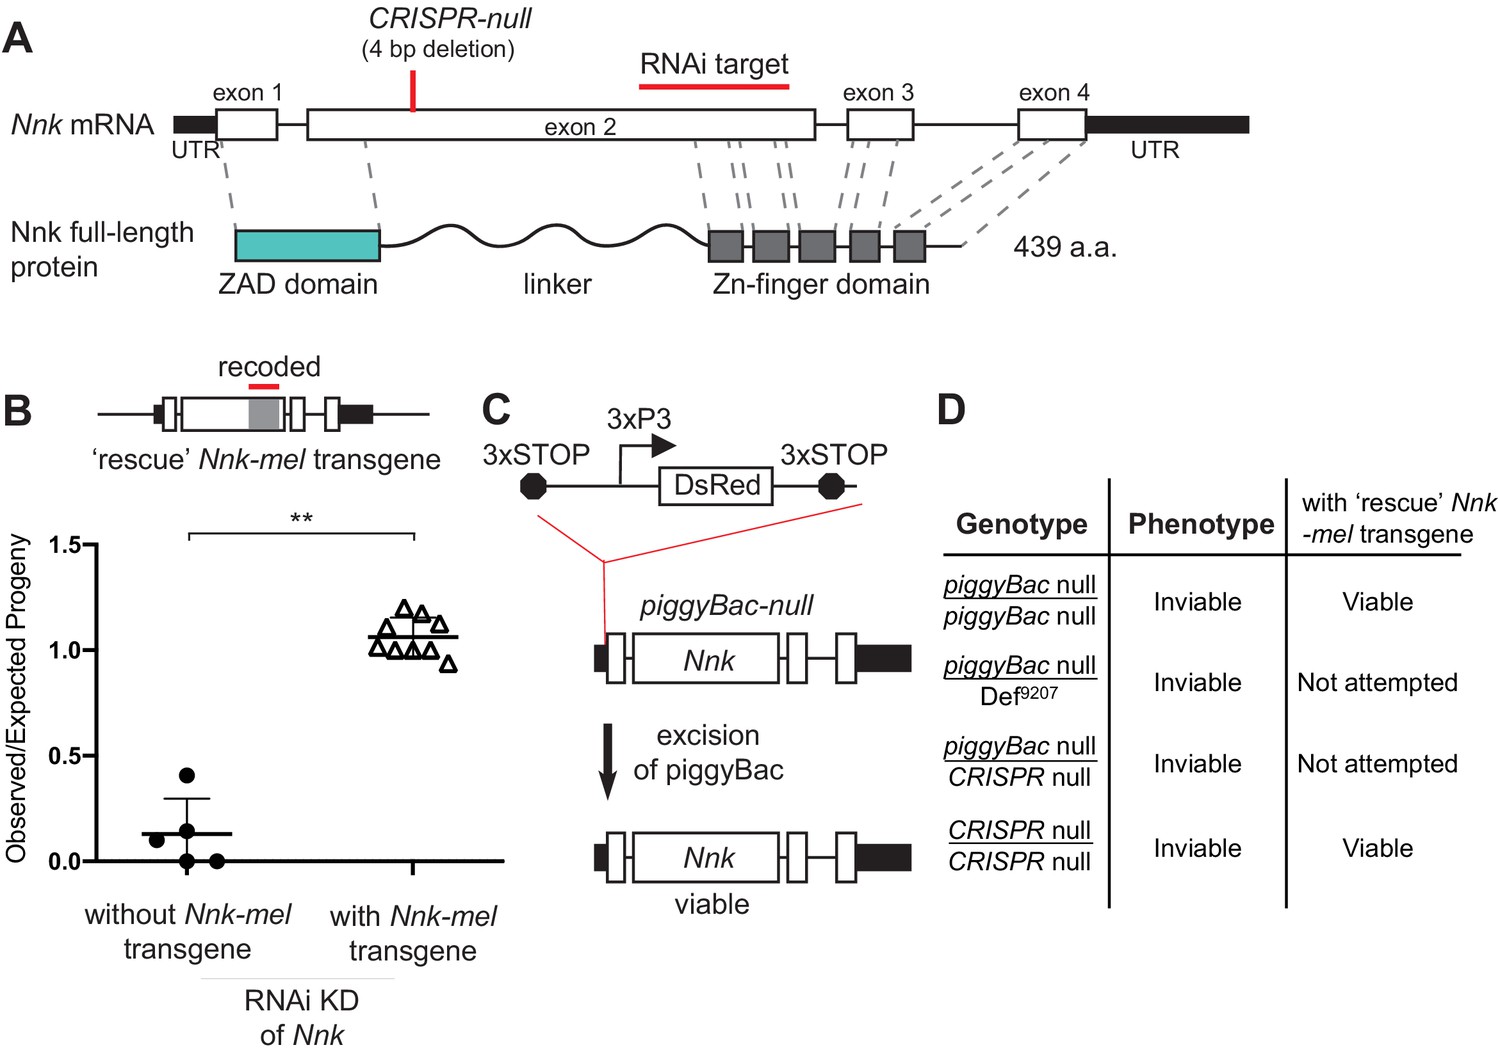
Nicknack RNAi and mutant alleles.
(A) Schematic of Nnk gene. The Nnk gene contains four coding exons and encodes a full-length protein containing ZAD, linker, and ZNF domains. The CRISPR-null is a 4 bp deletion within exon 2 (Kondo et al., 2017): this deletion creates a frameshift and a premature stop codon within the linker region. The VDRC RNAi KK line creates double-stranded RNA corresponding to a region of exon 2 (schematized). (B) Schematic of Nnk-rescue transgene design, which contains the genomic region 1 kb upstream of the Nnk start codon and 1 kb downstream of the stop codon. The region targeted by the RNAi construct (highlighted) was recoded by synonymous mutations in the Nnk-rescue transgene to make it resistant to RNAi. Upon ubiquitous knockdown of Nnk using Act5c-GAL4 driven RNAi, adult viability is very low, but is significantly restored by the RNAi-resistant Nnk-rescue transgene. Horizontal bars represent the mean and error bars represent one standard deviation of replicates of single-pair matings for each cross. Vertical axis represents the observed/expected number of progeny from each cross. Asterisks indicate p<0.01, two-tailed Student’s t-test. (C) piggyBac-null is a piggyBac insertion in the 5’ UTR of Nnk that contains a fluorescent reporter (DsRed) driven by an eye specific promoter (3xP3) and flanked by stop codons in all three reading frames which terminate translation through Nnk (Schuldiner et al., 2008). Excision of this piggyBac insertion restores viability. (D) Allelic combinations of CRISPR/piggyBac-nulls/genetic deficiencies were tested, in some cases in the presence of the Nnk-rescue transgene, to investigate and confirm Nnk essentiality (Figure 3—source data 1).
-
Figure 3—source data 1
Various Nnk disruption alleles can be all rescued significantly with a Nnk-mel rescue transgene.
Total number of flies counted across all replicates are shown. Numbers in parentheses refer to expected numbers in case of full rescue. The Nnk-mel rescue allele can rescue otherwise inviable piggyBac-null/piggyBac-null, CRISPR-null/CRISPR-null, and NnkRNAi/Act5C-Gal4 progeny.
- https://cdn.elifesciences.org/articles/63368/elife-63368-fig3-data1-v1.docx
Figure 4
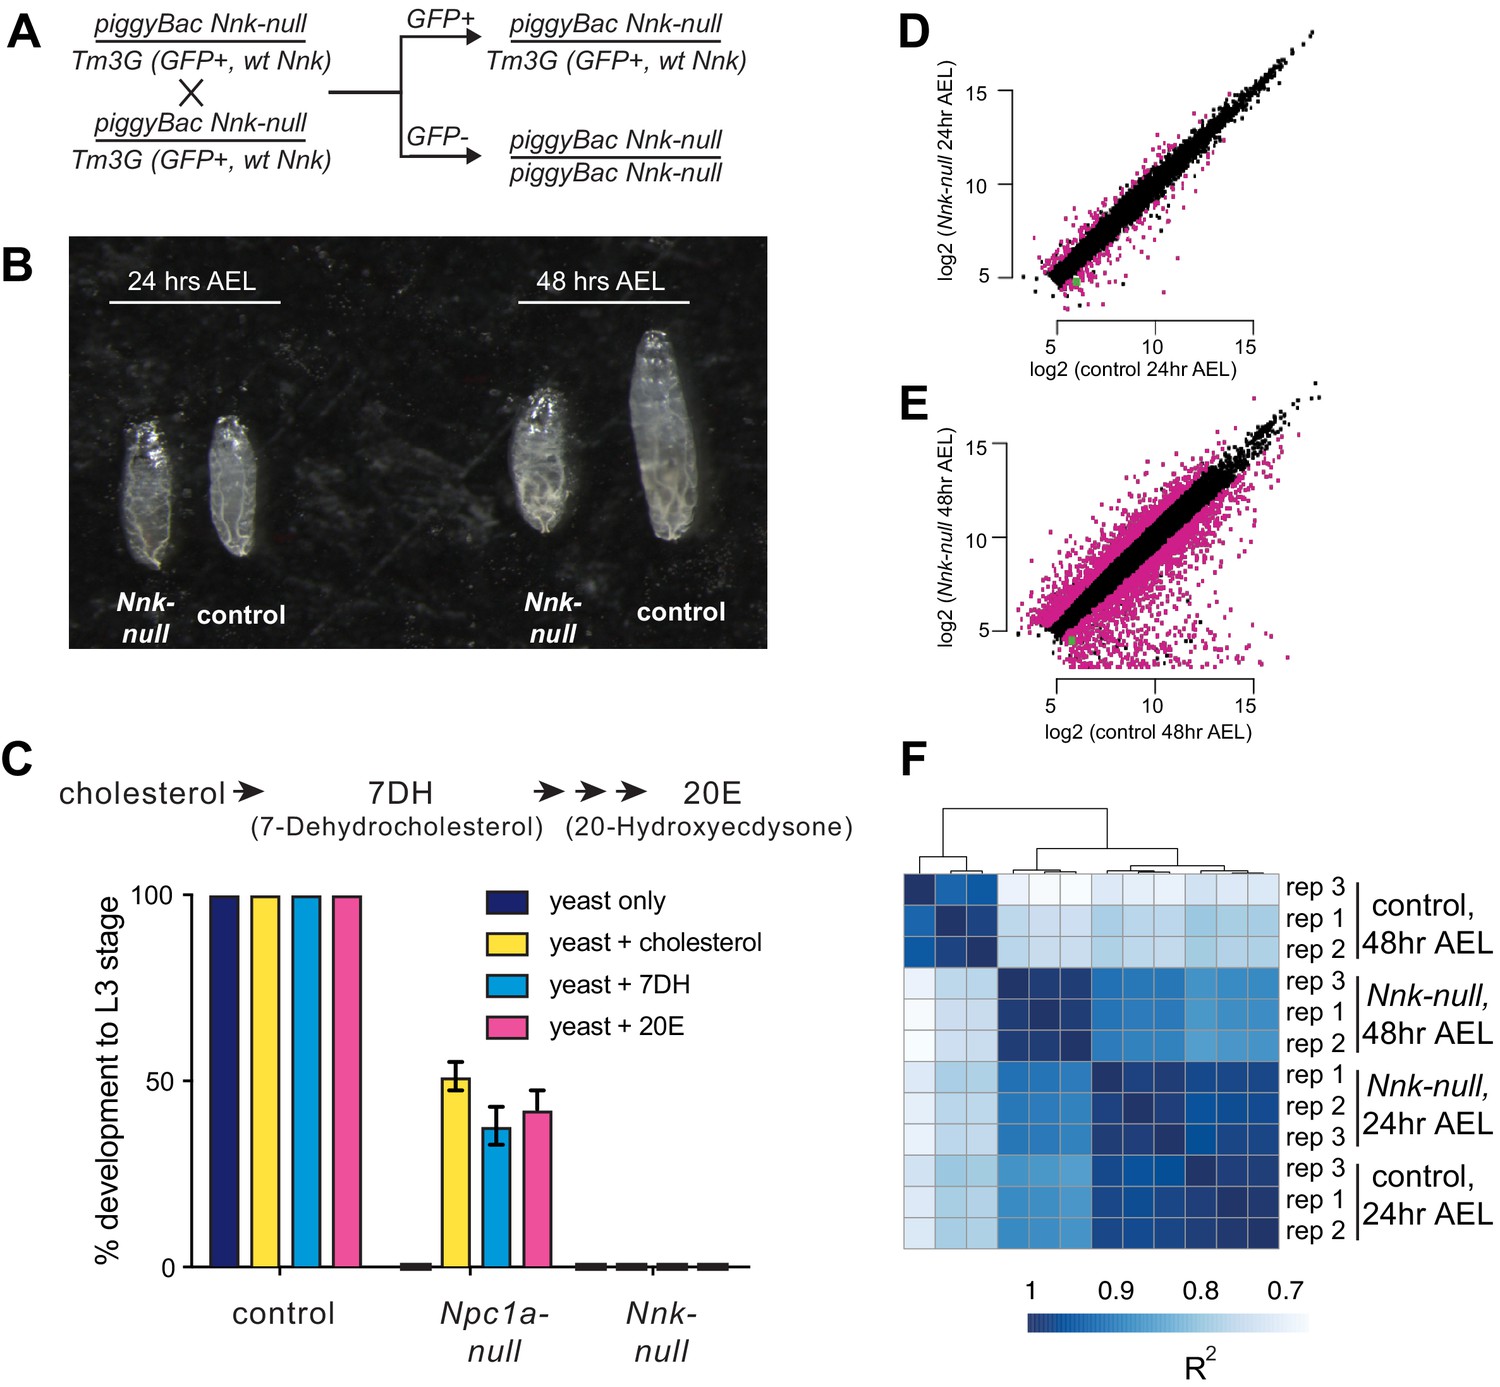
Nicknack-null larvae arrest in early larval development.
(A) Schematic of cross to generate homozygous piggyBac-null larvae and age-matched control (heterozygote) siblings. Tm3G homozygous progeny are not shown, as they die as early embryos. (B) 24 hr after egg laying (AEL), Nnk-null larvae are morphologically indistinguishable from control larvae. 48 hr AEL, Nnk-null larvae are significantly smaller than the age-matched controls and have failed to undergo the first larval molt. (C) Adding sterols (cholesterol, 7DH or 20E) to the food of control (w1118) larvae did not alter their ability to develop to L3 larvae within 60 hr AEL. Npc1a-null larvae (Npc1a57/Npc1a57) used as a control do not develop on food supplemented with yeast alone but can be partially rescued (>40% molting into L3 larvae) with the addition of cholesterol, 7DH, or 20E. In contrast, Nnk-null mutants fail to progress through development even with the addition of dietary sterols. Vertical axis shows the percentage of L1 larvae that progressed to L3 larvae. Graphs show mean of three replicates with error bars showing standard deviation; n > 100 for all genotypes and treatments. (D, E) Scatter plots showing RNA-seq results for all expressed genes at 24 hr (D) and 48 hr (E) AEL. X-axis indicates the expression (normalized abundance) of genes in control larvae whereas the Y-axis shows the expression of genes in Nnk-null larvae at the same time point. Magenta dots represent genes significantly over- and under-expressed in Nnk-null larvae (green dot represents expression of Nnk itself). (F) Overall correlations between transcriptome profiles of three replicates each for control and Nnk-null larvae reveals that Nnk-null transcriptomes 48 hr AEL are more similar to transcriptomes of control and Nnk-null larvae 24 hr AEL than they are to age-matched controls, reflecting their developmental delay. Sample-to-sample Spearman R2 distance matrix with hierarchical clustering using raw read counts of all 11,428 expressed genes.
Figure 5 with 4 supplements

Heterochromatic localization of Odj and Nnk proteins.
(A) Odj and Nnk proteins localize within the heterochromatic chromocenter, marked by H3K9me3 staining (magenta, outlined with dashed line) of D. melanogaster S2 cells. Whereas Oddjob localizes broadly to heterochromatin, Nicknack localizes to discrete foci within heterochromatin. All images are of representative nuclei from S2 cells transfected with a Venus-tagged ZAD-ZNF (yellow) under the control of an inducible heatshock-promoter. DAPI marks DNA in each nucleus. Scale bar = 2 μm. (B) Constitutive pCopia-driven expression confirms the broad Odj and discrete Nnk localization within heterochromatin of D. melanogaster S2 cells (dashed line outlines nucleus). Scale bar = 1 μm. (C) ChIP-seq analyses confirms that Odj binding is highly enriched throughout heterochromatin, whereas Nnk localizes only to some regions within heterochromatin, and to the 4th chromosome; note that S2 cells do not have an intact Y chromosome (Lee et al., 2014). The y-axis represents normalized ChIP-versus-input log2 ratios, using IGV to visualize and smooth data. Numbers on the y-axis give the range of ratios displayed for each factor.
Figure 5—figure supplement 1
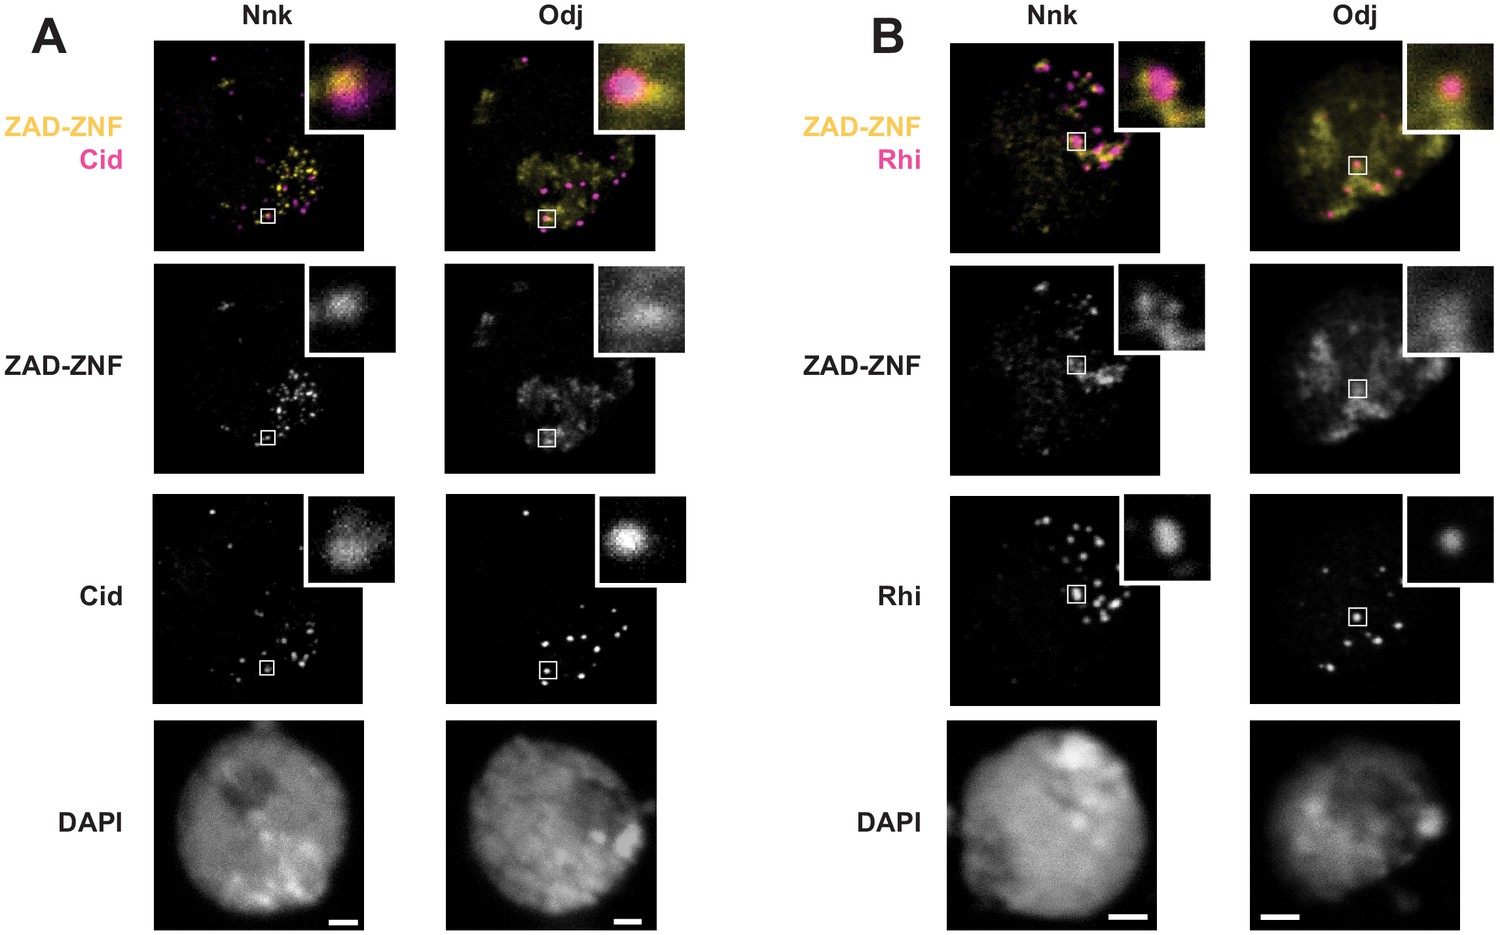
Nnk localization in heterochromatin in D. melanogaster S2 cells.
Venus-tagged Nnk or Odj proteins were induced via heat shock, and nuclei were imaged with either (A) Cid (to mark centromeres) or (B) Rhino (to mark dual-strand piRNA clusters). As shown in Figure 5, Odj has a broad heterochromatin localization whereas Nnk localizes to discrete foci, which do not overlap with centromeres or dual-strand piRNA clusters. Inset refers to specific foci to highlight the absence of significant overlap. Scale bars = 2 μm.
Figure 5—figure supplement 2
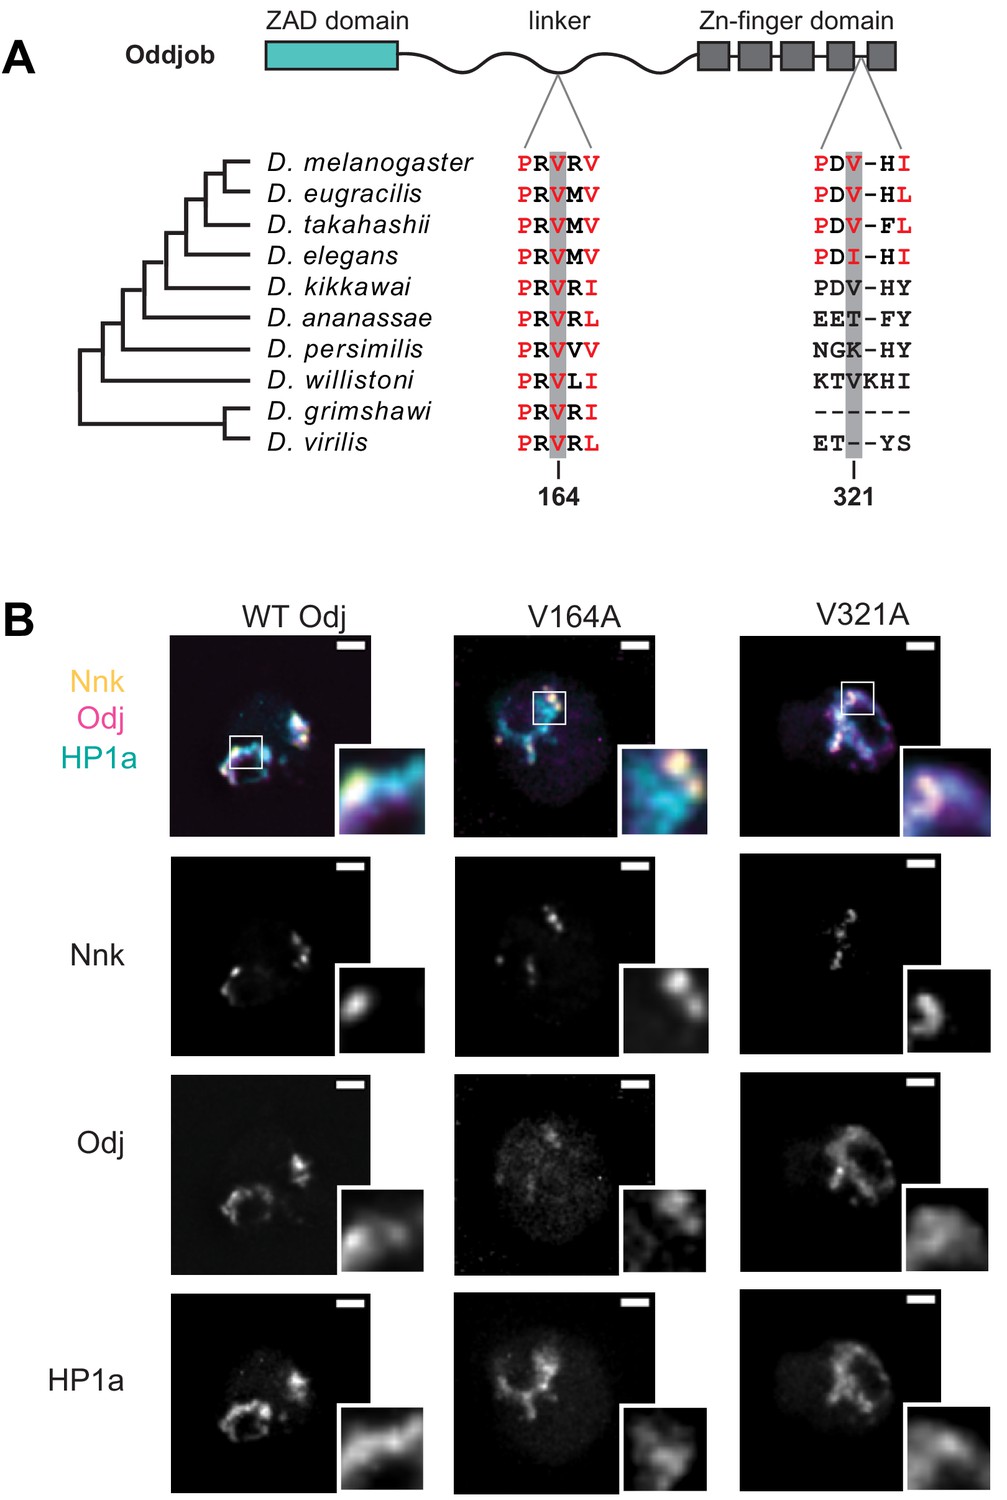
Mutation of the Odj PxVxL motif in the linker disrupts its broad localization within heterochromatin.
(A) Alignment of the two PxVxL motifs in Oddjob across Drosophila species show that the first PxVxL motif in linker region is highly conserved while the second PxVxL motif, within the ZNF domain, is not. (B) Mutation of the PxVxL motif within the linker region changes Odj’s (magenta) broad localization to discrete foci within heterochromatin like Nnk (yellow). Mutation of the PxVxL motif within the ZNF has no significant change in localization of Odj within heterochromatin (marked by HP1a, cyan). Scale bars = 1 μm.
Figure 5—figure supplement 3
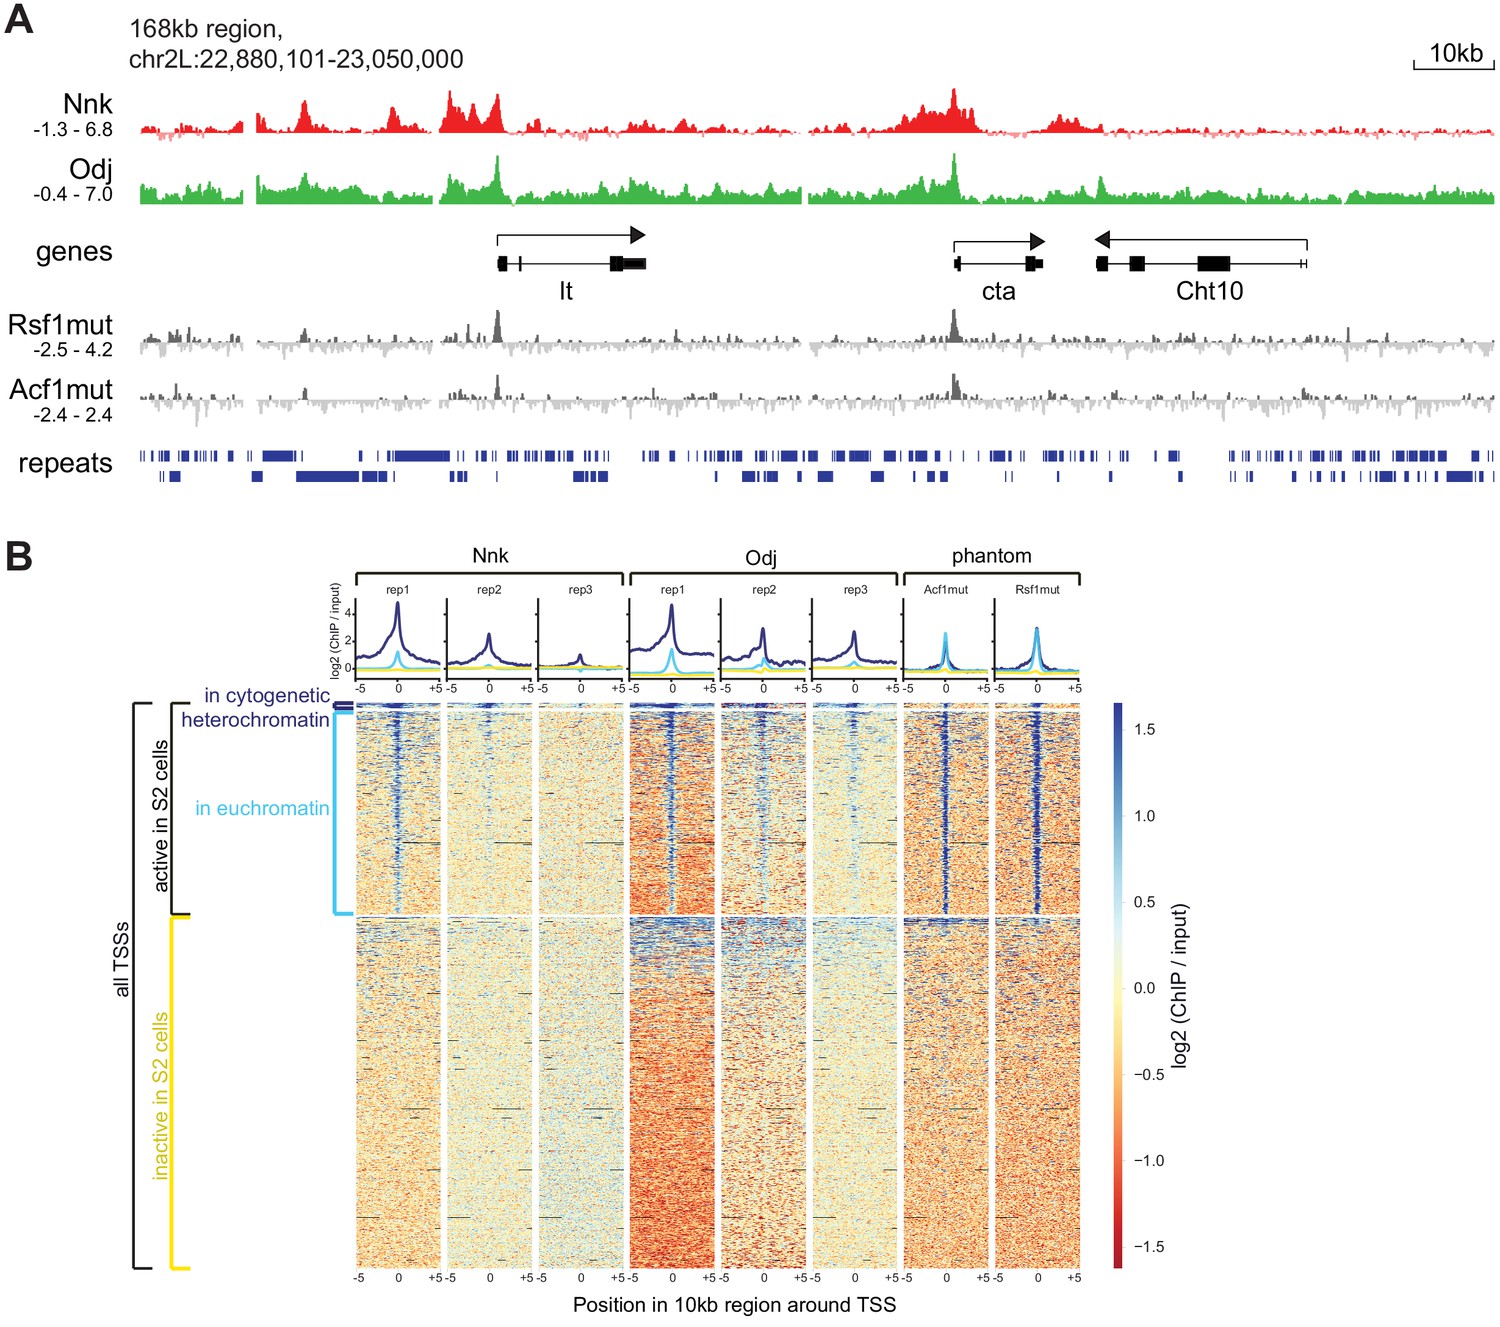
Additional analysis of ChIP-seq signals.
(A) Higher resolution view of a selected 168 kb region in the heterochromatic region of chromosome 2L, using IGV for visualization. We show log2 (ChIP/input) ratios for the first replicate each for Nicknack and Oddjob, as well as for two negative control samples (Rsf1mut and Acf1mut) that highlight ‘phantom peak’ regions where false positive signals often occur (Jain et al., 2015). (B) ChIP-seq signals (log2 ChIP/input) in regions of 10 kb surrounding all TSSs in the genome, visualized using deepTools. We split TSSs into groups according to whether they are in active chromatin in S2 cells, according to modENCODE’s ‘TSS-proximal’ state, and further split the active TSSs according to whether they are in cytogenetic heterochromatin or euchromatin. In the heatmap region of the plot (variably shaded boxes), very narrow rows represent 10 kb regions surrounding each TSS, and the color scale shows the ChIP/input ratio, with columns for each ChIP/input comparison. Graphs above heatmaps show mean signal profiles for each region type, with inactive TSSs in yellow, euchromatic active TSSs in light blue, and heterochromatic TSSs in dark blue. For both Nicknack and Oddjob, the first replicate showed the strongest signal and the third replicate showed the weakest signal, likely due to use of different batches of antibody. While inactive TSSs show very little signal in any sample, almost all active TSSs have ChIP signal in the ‘phantom’ samples as well as the Oddjob and Nicknack samples, indicating that this signal could represent a ChIP-seq artifact (Jain et al., 2015). However, for both Nicknack and Oddjob (but not the ‘phantom’ samples), ChIP signal is stronger and more broadly distributed at active TSSs within heterochromatin than at active TSSs within euchromatin, suggesting that some true signal remains.
Figure 5—figure supplement 4
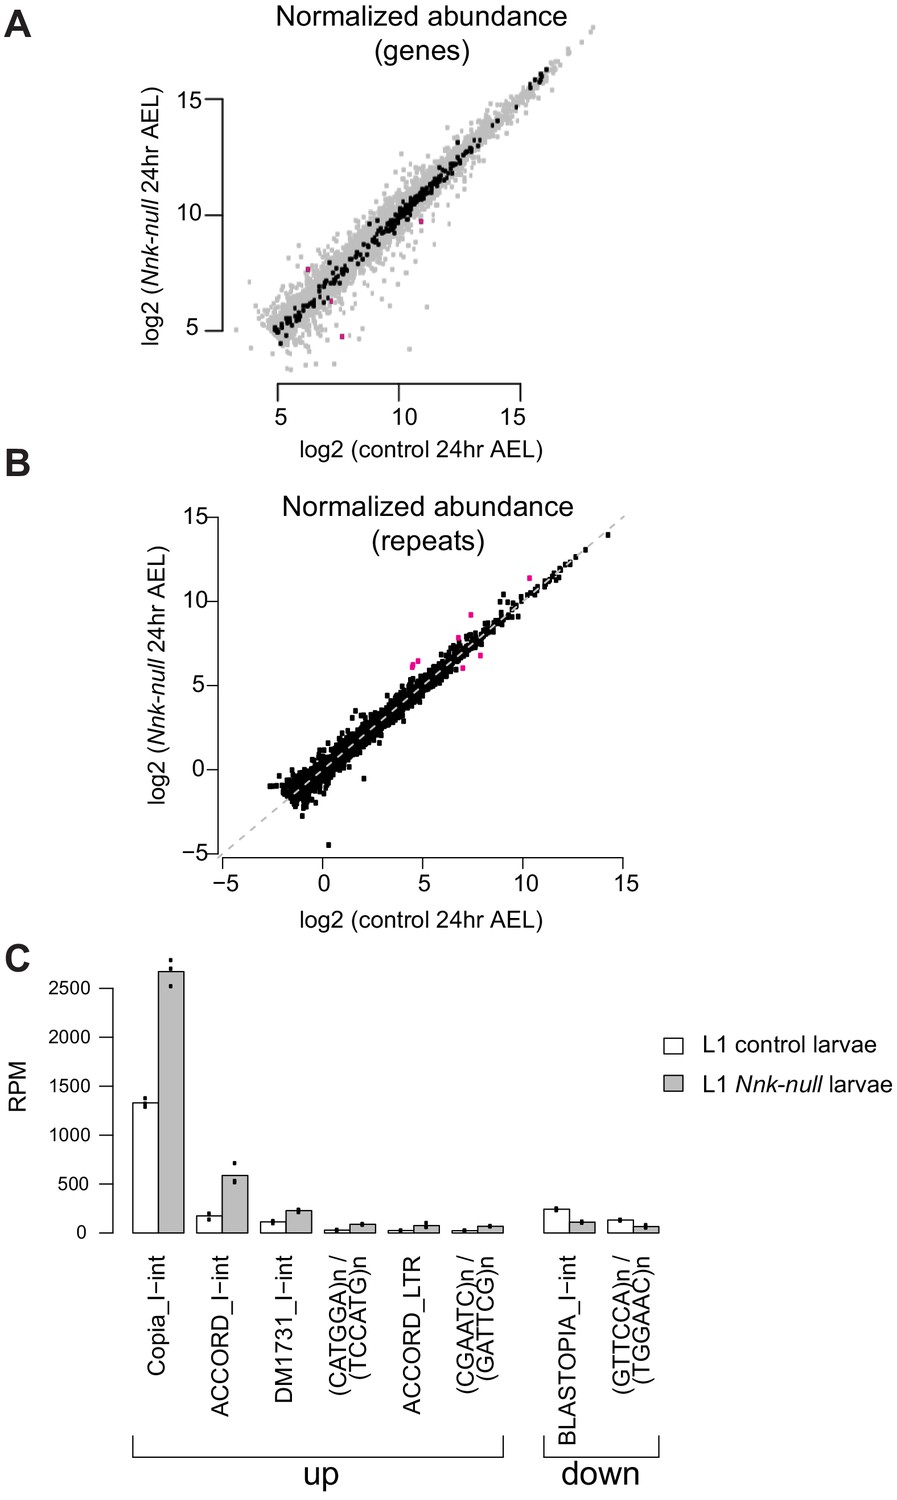
Effect of Nnk loss on gene and repeat expression.
(A) Scatter plots showing RNA-seq results for all expressed genes at 24 hr AEL. X-axis indicates the expression (normalized abundance) of genes in control larvae whereas the Y-axis shows the expression of genes in Nnk-null larvae at the same time point. Gray dots represent euchromatic genes, whereas black dots represent heterochromatin-embedded genes, with magenta dots represent heterochromatic genes that are significantly over- and under-expressed in Nnk-null larvae. (B) Some repeat elements are misregulated in Nnk-null larvae. We used an approach similar to that of Day et al., 2010 to obtain aggregate counts of reads mapping to all instances of each repeat type. Most repeat types are expressed at similar levels in control larvae 24 hr AEL and Nnk-null larvae 24 hr AEL, but a few (shown in magenta) are misregulated. Six repeat types are de-repressed in Nnk-null larvae, and two types are expressed at lower levels (absolute log2-fold-change>=1, adjusted p-value<=0.05). (C) Detailed view of misregulated repeats. Bars show triplicate means of normalized expression levels in reads per million sequenced (RPM), and dots show individual triplicate values.
Figure 6
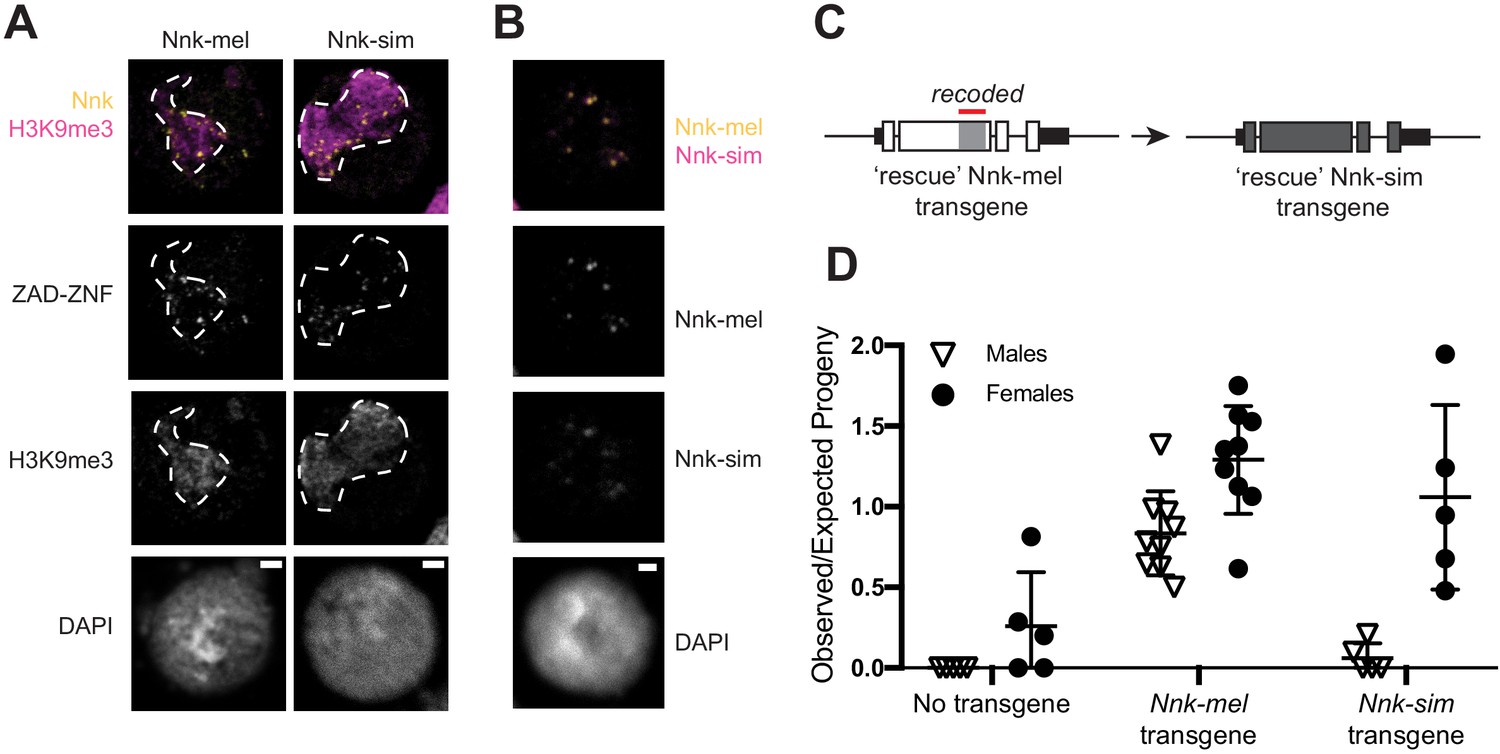
D. simulans Nicknack localizes to D. melanogaster heterochromatin but can only partially rescue essential function.
(A) Venus-tagged D. melanogaster Nnk (Nnk-mel) or Venus-tagged D. simulans Nnk (Nnk-sim) (yellow) localize to foci within the heterochromatic chromocenter marked by H3K9me3 (magenta, dashed line) in D. melanogaster S2 cells. Each image is of a representative S2 cell nucleus with DAPI marking DNA. Scale bar = 2 μm. (B) Transient co-transfection of Venus-tagged Nnk-sim (magenta) and FLAG-tagged Nnk-mel (yellow) shows that they overlap in their localization to discrete heterochromatic foci in D. melanogaster S2 cells. Scale bar = 2 μm. (C) Schematic of rescue Nnk-sim transgene, which contains the genomic region 1 kb upstream of the Nnk start codon and 1 kb downstream of the stop codon, but with the D. simulans coding region (dark gray) from start to stop codon, including introns. The region of Nnk-mel targeted by the RNAi hairpin is highlighted by the red line; because of its divergence and codon-optimization, the Nnk-sim rescue transgene is resistant to RNAi. (D) Ability of Nnk-mel and Nnk-sim transgenes to rescue ubiquitous knockdown of Nnk using Act5C-GAL4 drivers. The vertical axis represents the observed/expected progeny in each cross. Without Nnk transgene, there are significantly fewer Nnk knockdown male and female progeny recovered than expected. Nnk-mel transgene is able to rescue Nnk-RNAi depletion in both males and females. Nnk-sim transgene is able to rescue Nnk-RNAi knockdown females significantly better than knockdown males. Filled circles represent number of female adult progeny and open triangles represent number of male adult progeny recovered from single-pair matings. Horizontal bars show the mean and standard deviation.
Tables
Table 1
Links between ZAD-ZNF gene dynamism and essentiality.
(A) ZAD-ZNF genes are just as likely to be essential whether or not they are conserved across all 12 Drosophila species. Note that five genes for which phenotypic data is not available were not included in these analyses. (B) Positively-selected ZAD-ZNFs (via McDonald-Kreitman test, Table 2) are more likely to be essential than ZAD-ZNFs that have not evolved under positive selection. D. simulans lacks one of the 91 D. melanogaster genes and no data on essentiality is available for six genes. p-values were calculated by two-tailed Fisher’s exact test.
| Conservation of ZAD-ZNFs is not correlated with essentiality in Drosophila | |||
|---|---|---|---|
| ZAD-ZNFs | Essential | Not essential | p-value |
| conserved across Drosophila | 14 | 42 | - |
| not conserved across Drosophila | 8 | 21 | 0.80 |
| Positively selected ZAD-ZNFs are more likely to be essential than ZAD-ZNFs not under positive selection in D. melanogaster | |||
| ZAD-ZNFs | Essential | Not essential | p-value |
| not under positive selection | 14 | 59 | - |
| positive selection | 8 | 4 | 0.0016 |
Table 2
Positively selected ZAD-ZNFs.
Summary statistics for the McDonald-Kreitman (MK) test (with statistically significant values at p<0.05). The number of polymorphisms within D. melanogaster at synonymous (Ps) and non-synonymous (Pn) sites are compared to the number of all fixed synonymous (Ds) and non-synonymous (Dn) changes between D. melanogaster and D. simulans. A polarized MK test only considers synonymous (Ds) and non-synonymous (Dn) changes that were fixed along the lineage leading to D. melanogaster. MK test statistics were calculated either for the whole gene or individual domains. A neutrality index (N.I.) of <1 suggests an excess of fixed non-synonymous changes between species (i.e., positive selection). Phenotypes of these genes are taken from sources that are listed in Supplementary file 1.
| ZAD-ZNF gene (mutant phenotype) | Region | Alignment length (codons) | McDonald-Kreitman test (unpolarized) | Polarized changes(D. melanogaster) | Polarized changes (D. simulans) | Total polarized Dn | Total polarized Ds | |||||||||
|---|---|---|---|---|---|---|---|---|---|---|---|---|---|---|---|---|
| p-value | Dn | Ds | Pn | Ps | NI | p-value | Dn | Ds | NI | Dn | Ds | |||||
| Nnk (CG17802) (lethal) | full-length | 448 | 0.007 | 52 | 24 | 14 | 20 | 0.323 | 0.041 | 17 | 8 | 0.329 | 26 | 16 | 43 | 24 |
| ZAD | 71 | 0.119 | 6 | 2 | 2 | 4 | 0.167 | 0.058 | 3 | 0 | 0.000 | 3 | 2 | 6 | 2 | |
| linker | 216 | 0.019 | 34 | 10 | 9 | 10 | 0.265 | 0.070 | 11 | 3 | 0.245 | 15 | 7 | 26 | 10 | |
| C2H2 | 136 | 0.091 | 6 | 11 | 0 | 6 | 0.000 | 0.155 | 2 | 5 | 0.000 | 4 | 6 | 6 | 11 | |
| Odj (CG7357) (lethal) | full-length | 438 | 0.000 | 40 | 32 | 5 | 25 | 0.160 | 0.002 | 18 | 15 | 0.167 | 16 | 17 | 34 | 32 |
| ZAD | 73 | 0.197 | 4 | 4 | 0 | 2 | 0.000 | 0.248 | 1 | 1 | 0.000 | 3 | 3 | 4 | 4 | |
| linker | 138 | 0.053 | 18 | 9 | 4 | 8 | 0.250 | 0.309 | 5 | 4 | 0.400 | 9 | 5 | 14 | 9 | |
| C2H2 | 135 | 0.099 | 2 | 7 | 0 | 11 | 0.000 | 0 | 4 | 2 | 3 | 2 | 7 | |||
| Trem (CG4413) (female sterile) | full-length | 442 | 0.015 | 31 | 30 | 3 | 14 | 0.207 | 0.335 | 6 | 13 | 0.464 | 21 | 17 | 27 | 30 |
| ZAD | 77 | 0.571 | 2 | 6 | 0 | 1 | 0.000 | 0 | 1 | 2 | 5 | 2 | 6 | |||
| linker | 192 | 0.036 | 18 | 13 | 2 | 8 | 0.181 | 0.407 | 4 | 7 | 0.438 | 13 | 6 | 17 | 13 | |
| C2H2 | 133 | 0.239 | 3 | 10 | 0 | 5 | 0.000 | 0.338 | 1 | 5 | 0.000 | 2 | 5 | 3 | 10 | |
| Zw5 (CG2711) (lethal) | full-length | 590 | 0.004 | 55 | 51 | 6 | 22 | 0.253 | 0.120 | 15 | 23 | 0.418 | 28 | 28 | 43 | 51 |
| ZAD | 78 | 0.125 | 3 | 4 | 0 | 4 | 0.000 | 0.285 | 1 | 3 | 0.000 | 1 | 1 | 2 | 4 | |
| linker | 229 | 0.251 | 32 | 17 | 3 | 4 | 0.398 | 0.867 | 7 | 8 | 0.857 | 16 | 9 | 23 | 17 | |
| C2H2 | 217 | 0.060 | 12 | 25 | 0 | 8 | 0.000 | 0.159 | 3 | 11 | 0.000 | 7 | 14 | 10 | 25 | |
| CG2712 (viable) | full-length | 524 | 0.003 | 70 | 36 | 15 | 24 | 0.321 | 0.210 | 21 | 19 | 0.565 | 37 | 15 | 58 | 34 |
| ZAD | 80 | 0.161 | 10 | 6 | 3 | 6 | 0.300 | 0.569 | 2 | 2 | 0.500 | 7 | 4 | 9 | 6 | |
| linker | 231 | 0.089 | 45 | 14 | 10 | 8 | 0.389 | 0.106 | 16 | 4 | 0.313 | 18 | 8 | 34 | 12 | |
| C2H2 | 190 | 0.038 | 15 | 14 | 2 | 10 | 0.187 | 0.759 | 3 | 11 | 0.733 | 12 | 3 | 15 | 14 | |
| D19B (CG10270) (viable) | full-length | 774 | 0.005 | 11 | 42 | 3 | 66 | 0.174 | 0.049 | 4 | 20 | 0.227 | 5 | 21 | 9 | 41 |
| ZAD | 72 | 0.121 | 2 | 4 | 0 | 6 | 0.000 | 0.134 | 1 | 2 | 0.000 | 1 | 2 | 2 | 4 | |
| linker | 171 | 0.182 | 6 | 12 | 2 | 13 | 0.308 | 0.347 | 0 | 6 | 4 | 5 | 4 | 11 | ||
| C2H2 | 257 | 0 | 6 | 0 | 25 | 0 | 3 | 0 | 3 | 0 | 6 | |||||
| C2H2-2 | 78 | 0 | 2 | 0 | 7 | 0 | 2 | 0 | 0 | 0 | 2 | |||||
| CG7386 (lethal) | full-length | 688 | 0.002 | 78 | 38 | 28 | 36 | 0.379 | 0.117 | 26 | 18 | 0.538 | 47 | 19 | 73 | 37 |
| ZAD | 72 | 0.858 | 3 | 6 | 3 | 5 | 1.200 | 0.506 | 1 | 4 | 2.400 | 1 | 2 | 2 | 6 | |
| linker | 116 | 0.118 | 12 | 5 | 13 | 1 | 5.417 | 0.133 | 4 | 2 | 6.500 | 7 | 3 | 11 | 5 | |
| C2H2-1 | 21 | 0 | 0 | 0 | 1 | 0 | 0 | 0 | 0 | 0 | 0 | |||||
| C2H2-2 | 163 | 0.005 | 14 | 7 | 5 | 16 | 0.156 | 0.639 | 2 | 4 | 0.625 | 12 | 3 | 14 | 7 | |
| C2H2-3 | 78 | 0.098 | 2 | 6 | 3 | 1 | 9.000 | 0.540 | 1 | 1 | 3.000 | 0 | 5 | 1 | 6 | |
| CG17359 (lethal) | full-length | 344 | 0.000 | 43 | 17 | 3 | 14 | 0.085 | 0.000 | 18 | 6 | 0.071 | 20 | 11 | 38 | 17 |
| ZAD | 82 | 0.157 | 3 | 1 | 1 | 3 | 0.111 | 0.540 | 1 | 1 | 0.333 | 1 | 0 | 2 | 1 | |
| linker | 134 | 0.000 | 28 | 4 | 1 | 5 | 0.029 | 0.001 | 9 | 0 | 0.000 | 15 | 4 | 24 | 4 | |
| C2H2 | 105 | 0.064 | 10 | 10 | 0 | 4 | 0.000 | 0.040 | 6 | 4 | 0.000 | 4 | 6 | 10 | 10 | |
| wek (CG4148) (lethal; maternal effect lethal) | full-length | 473 | 0.001 | 29 | 42 | 3 | 30 | 0.145 | 0.596 | 3 | 19 | 0.633 | 16 | 23 | 19 | 42 |
| ZAD | 70 | 0.206 | 2 | 3 | 0 | 3 | 0.000 | 0 | 3 | 1 | 0 | 1 | 3 | |||
| linker | 194 | 0.012 | 22 | 19 | 3 | 14 | 0.185 | 0.456 | 3 | 7 | 0.500 | 11 | 12 | 14 | 19 | |
| C2H2 | 157 | 0.074 | 5 | 17 | 0 | 12 | 0.000 | 0 | 6 | 4 | 11 | 4 | 17 | |||
| CG10321 (viable) | full-length | 835 | 0.001 | 28 | 50 | 9 | 63 | 0.255 | 0.007 | 11 | 20 | 0.260 | 14 | 29 | 25 | 49 |
| ZAD | 69 | 0 | 2 | 0 | 4 | 0 | 0 | 0 | 2 | 0 | 2 | |||||
| linker | 546 | 0.008 | 24 | 38 | 8 | 42 | 0.302 | 0.072 | 8 | 15 | 0.357 | 13 | 22 | 21 | 37 | |
| C2H2 | 146 | 0.024 | 3 | 7 | 0 | 15 | 0.000 | 0.010 | 2 | 3 | 0.000 | 1 | 4 | 3 | 7 | |
| mld (CG34100) (lethal) | full-length | 2021 | 0.020 | 84 | 70 | 37 | 57 | 0.541 | 0.328 | 32 | 36 | 0.730 | 37 | 32 | 69 | 68 |
| ZAD | 70 | 0 | 0 | 0 | 0 | 0 | 0 | 0 | 0 | 0 | 0 | |||||
| linker | 1143 | 0.282 | 63 | 51 | 30 | 34 | 0.714 | 0.824 | 24 | 25 | 0.919 | 29 | 24 | 53 | 49 | |
| linker-2 | 278 | 0.075 | 6 | 8 | 2 | 13 | 0.205 | 0.292 | 2 | 4 | 0.308 | 2 | 4 | 4 | 8 | |
| C2H2-1 | 81 | 0.237 | 4 | 5 | 0 | 2 | 0.000 | 0.290 | 2 | 3 | 0.000 | 2 | 2 | 4 | 5 | |
| C2H2-2 | 110 | 0.427 | 1 | 1 | 1 | 4 | 0.250 | 0.121 | 1 | 0 | 0.000 | 0 | 1 | 1 | 1 | |
| CG4282 (viable) | full-length | 652 | 0.030 | 13 | 32 | 2 | 25 | 0.197 | 0.061 | 6 | 16 | 0.213 | 8 | 15 | 14 | 31 |
| ZAD | 75 | 0.053 | 2 | 0 | 1 | 4 | 0.000 | 0.121 | 1 | 0 | 0.000 | 1 | 0 | 2 | 0 | |
| linker | 248 | 0.252 | 9 | 18 | 1 | 7 | 0.286 | 0.433 | 4 | 11 | 0.393 | 6 | 6 | 10 | 17 | |
| C2H2 | 290 | 0 | 11 | 0 | 14 | 0 | 3 | 0 | 8 | 0 | 11 | |||||
Additional files
-
Supplementary file 1
Differential retention in Drosophila species and phenotypes conferred by the 91 ZAD-ZNF genes in D. melanogaster.
ZAD-ZNF gene repertoires in different Drosophila species were inferred from OrthoDB analyses (Materials and methods). Phenotypic consequences of knockdown or knockout phenotype of ZAD-ZNFs in D. melanogaster were retrieved from flybase.org. Key for citations: Neely et al. Cell 2010 (Neely et al., 2010) Mummery-Widmer et al. Nature 2009 (Mummery-Widmer et al., 2009) Schnorrer et al. Nature 2010 (Schnorrer et al., 2010) Chang et al. Dev. Cell 2010 (Chang et al., 2010) Burguete et al. Dev. Biol. 2019 (Burguete et al., 2019) Gibert et al. Dev. Biol. 2005 (Gibert et al., 2005) Dai et al. Dev. Cell 2003 (Dai et al., 2003) Komura-Kawa et al. PLOS Genet. 2015 (Komura-Kawa et al., 2015) Weiler Genetics 2007 (Weiler, 2007) Giulian et al. PLOS ONE 2013 (Giuliani et al., 2013) Chen et al. Science 2010 (Chen et al., 2010) Schalet Mutat. Res. 1986 (Schalet, 1986) Shannon et al. Genetics 1972 (Shannon et al., 1972) Judd et al. Genetics 1972 (Judd et al., 1972) Liu et al. Genetics 1975 (Liu and Lim, 1975) Lim et al. Genet. Res. 1974 (Lim and Snyder, 1974) Robbins Genetics 1983 (Robbins, 1983) Gaszner et al. Genes Dev. 1999 (Gaszner et al., 1999) Schertel et al. Genome Res. 2015 (Schertel et al., 2015) Toba et al. Genetics 1999 (Toba et al., 1999) Ruppert et al. Cell Rep. 2017 (Ruppert et al., 2017) Schupbach et al. Genetics 1989 (Schüpbach and Wieschaus, 1989) Chen et al. Development 2000 (Chen et al., 2000) Lieberfarb et al. Development 1996 (Lieberfarb et al., 1996) Page et al. J. Cell Sci. 1996 (Page and Orr-Weaver, 1996) Whitfield et al. PLOS Biol. 2013 (Whitfield et al., 2013) Holden et al. Genetics 1973 (Holden and Suzuki, 1973) Ishimoto et al. Genetics 2010 (Ishimoto and Kitamoto, 2010) Ishimoto et al. Proc. Natl. Acad. Sci. USA 2009 (Ishimoto et al., 2009) Walker et al. J. Insect Physiol. 1987 (Walker et al., 1987) Ono et al. Dev. Biol. 2006 (Ono et al., 2006) Neubueser et al. Dev. Biol. 2005 (Neubueser et al., 2005) Laundrie et al. Genetics 2003 (Laundrie et al., 2003) Spradling et al. Genetics 1999 (Spradling et al., 1999) Page et al. EMBO J. 2005 (Page et al., 2005) Luschnig et al. Genetics 2004 (Luschnig et al., 2004) Ashburner et al. Genetics 1990 (Ashburner et al., 1990) Chen et al. Curr. Biol. 2006 (Chen et al., 2006) Kahsai et al. G3 2018 (Kahsai and Cook, 2018) Lake et al. PLoS Genet. 2011 (Lake et al., 2011) Zhang et al. Genetics 2007 (Zhang et al., 2007) Maksimenko et al. Biochim Biophys Acta 2020 (Maksimenko et al., 1863) Zolotarev et al. BioTechniques 2019 (Zolotarev et al., 2019) Neumüller et al. Cell Stem Cell 2011 (Neumüller et al., 2011) Nazario-Yepiz et al. Mech. Dev. 2017 (Nazario-Yepiz and Riesgo-Escovar, 2017) Lewandowski et al. Dev. Biol. 2010 (Lewandowski et al., 2010) Ellis et al. PLOS ONE 2015 (Ellis et al., 2015). (KD: knockdown; VDRC GD; Vienna Drosophila Resource Center GG RNAi line; VDRC KK; Vienna Drosophila Resource Center KK RNAi line; TRiP: Transgenic RNAi project, Perrimon lab).
- https://cdn.elifesciences.org/articles/63368/elife-63368-supp1-v1.xlsx
-
Supplementary file 2
Multiple alignment of the ZNF domain encoded by all genes found within the Odj-Nnk ZAD-ZNF cluster across 20 Drosophila species.
- https://cdn.elifesciences.org/articles/63368/elife-63368-supp2-v1.doc
-
Supplementary file 3
Gene ontology analysis of transcriptional dysregulation in Nnk-null L1 larvae in D. melanogaster reveals categories of genes that are significantly over- or under-expressed upon loss of Nnk.
- https://cdn.elifesciences.org/articles/63368/elife-63368-supp3-v1.xlsx
-
Supplementary file 4
Nucleotide sequences of the Nnk-mel and Nnk-sim rescue transgenes.
Nnk-mel rescue transgene was recoded by synonymous substitutions to make it impervious to RNAi-mediated knockdown, and the Nnk-sim rescue transgene was codon-optimized to match D. melanogaster codon preferences.
- https://cdn.elifesciences.org/articles/63368/elife-63368-supp4-v1.doc
-
Transparent reporting form
- https://cdn.elifesciences.org/articles/63368/elife-63368-transrepform-v1.docx
Download links
A two-part list of links to download the article, or parts of the article, in various formats.
Downloads (link to download the article as PDF)
Open citations (links to open the citations from this article in various online reference manager services)
Cite this article (links to download the citations from this article in formats compatible with various reference manager tools)
Innovation of heterochromatin functions drives rapid evolution of essential ZAD-ZNF genes in Drosophila
eLife 9:e63368.
https://doi.org/10.7554/eLife.63368


