Ancient DNA reveals the lost domestication history of South American camelids in Northern Chile and across the Andes
- The Saxo Institute, University of Copenhagen, Denmark
- Section for Evolutionary Genomics, the GLOBE Institute, University of Copenhagen, Denmark
- Faculty of Social Sciences, University of Chile, Chile
- Institute of Archaeological Research and Museum, Católica del Norte University, Chile
- School of Science Ecology and Evolution, Faculty of Sciences, Austral of Chile University, Chile
- Human Genetics Program, Institute of Biomedical Sciences, Faculty of Medicine, University of Chile, Chile
- CIIMAR Interdisciplinary Centre of Marine and Environmental Research, University of Porto, Portugal
- School of Biosciences, Cardiff University, United Kingdom
- ICCMISAC - International Consortium for the Conservation Management and Improvement of South American Camelids, United Kingdom
- Genomic and Biodiversity Laboratory, Basic Sciences Department, Faculty of Sciences, Bio-Bio University, Chile
- The GLOBE Institute, Faculty of Health and Medical Sciences, University of Copenhagen, Denmark
Figures
Figure 1 with 2 supplements
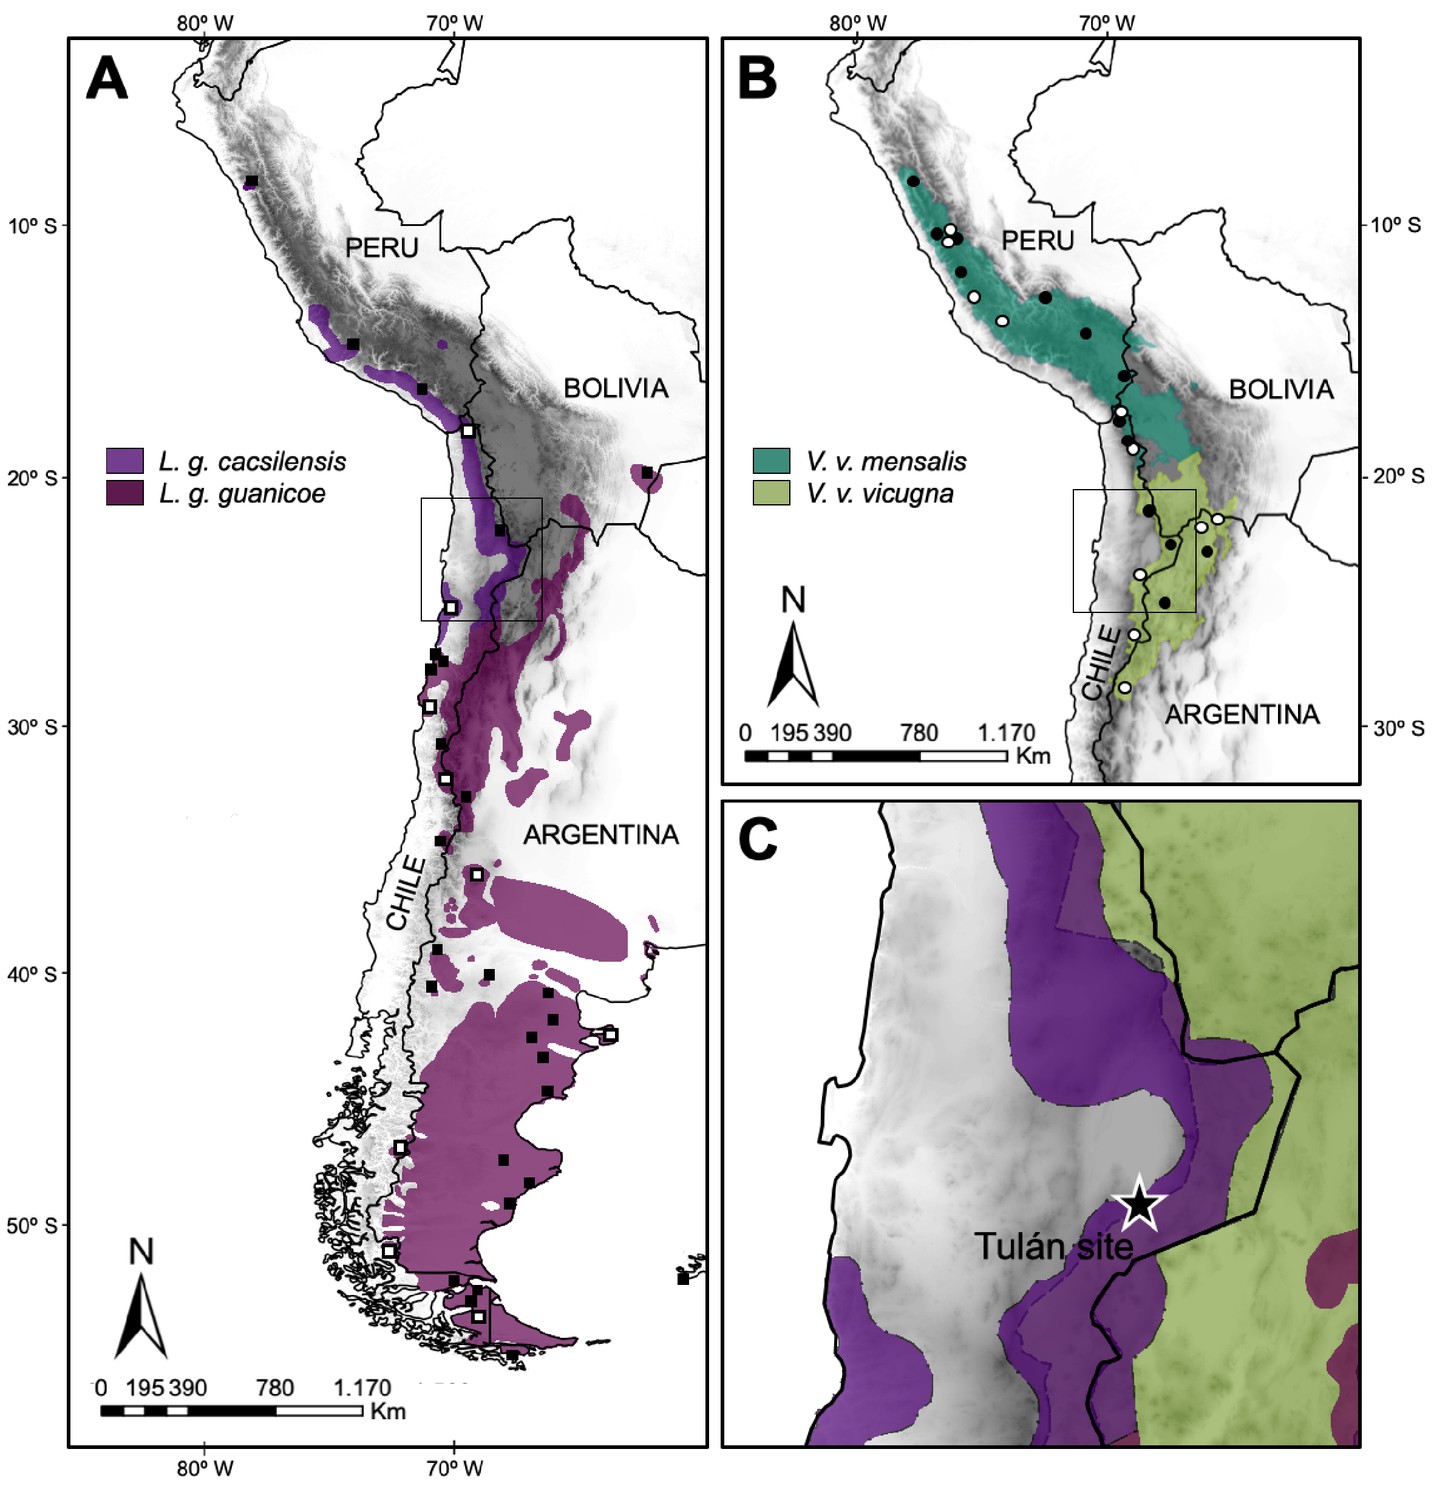
Map of the current geographic distribution for the wild species of South American camelids.
(A) Map of the current geographic distribution of Lama guanicoe subspecies (based on WCS, 2013), white and black squares correspond to sampling locations of modern mitogenomes and control region (CR) hypervariable I domain, respectively. (B) Map of the current geographic distribution of Vicugna vicugna subspecies (based on González et al., 2020), white and black dots correspond to sampling locations of modern mitogenomes and CR hypervariable I domain, respectively. (C) Star shows the Tulán site in Atacama Desert in Chile, where the ancient samples (3,500–2,400 years before the present) were obtained.
Figure 1—figure supplement 1
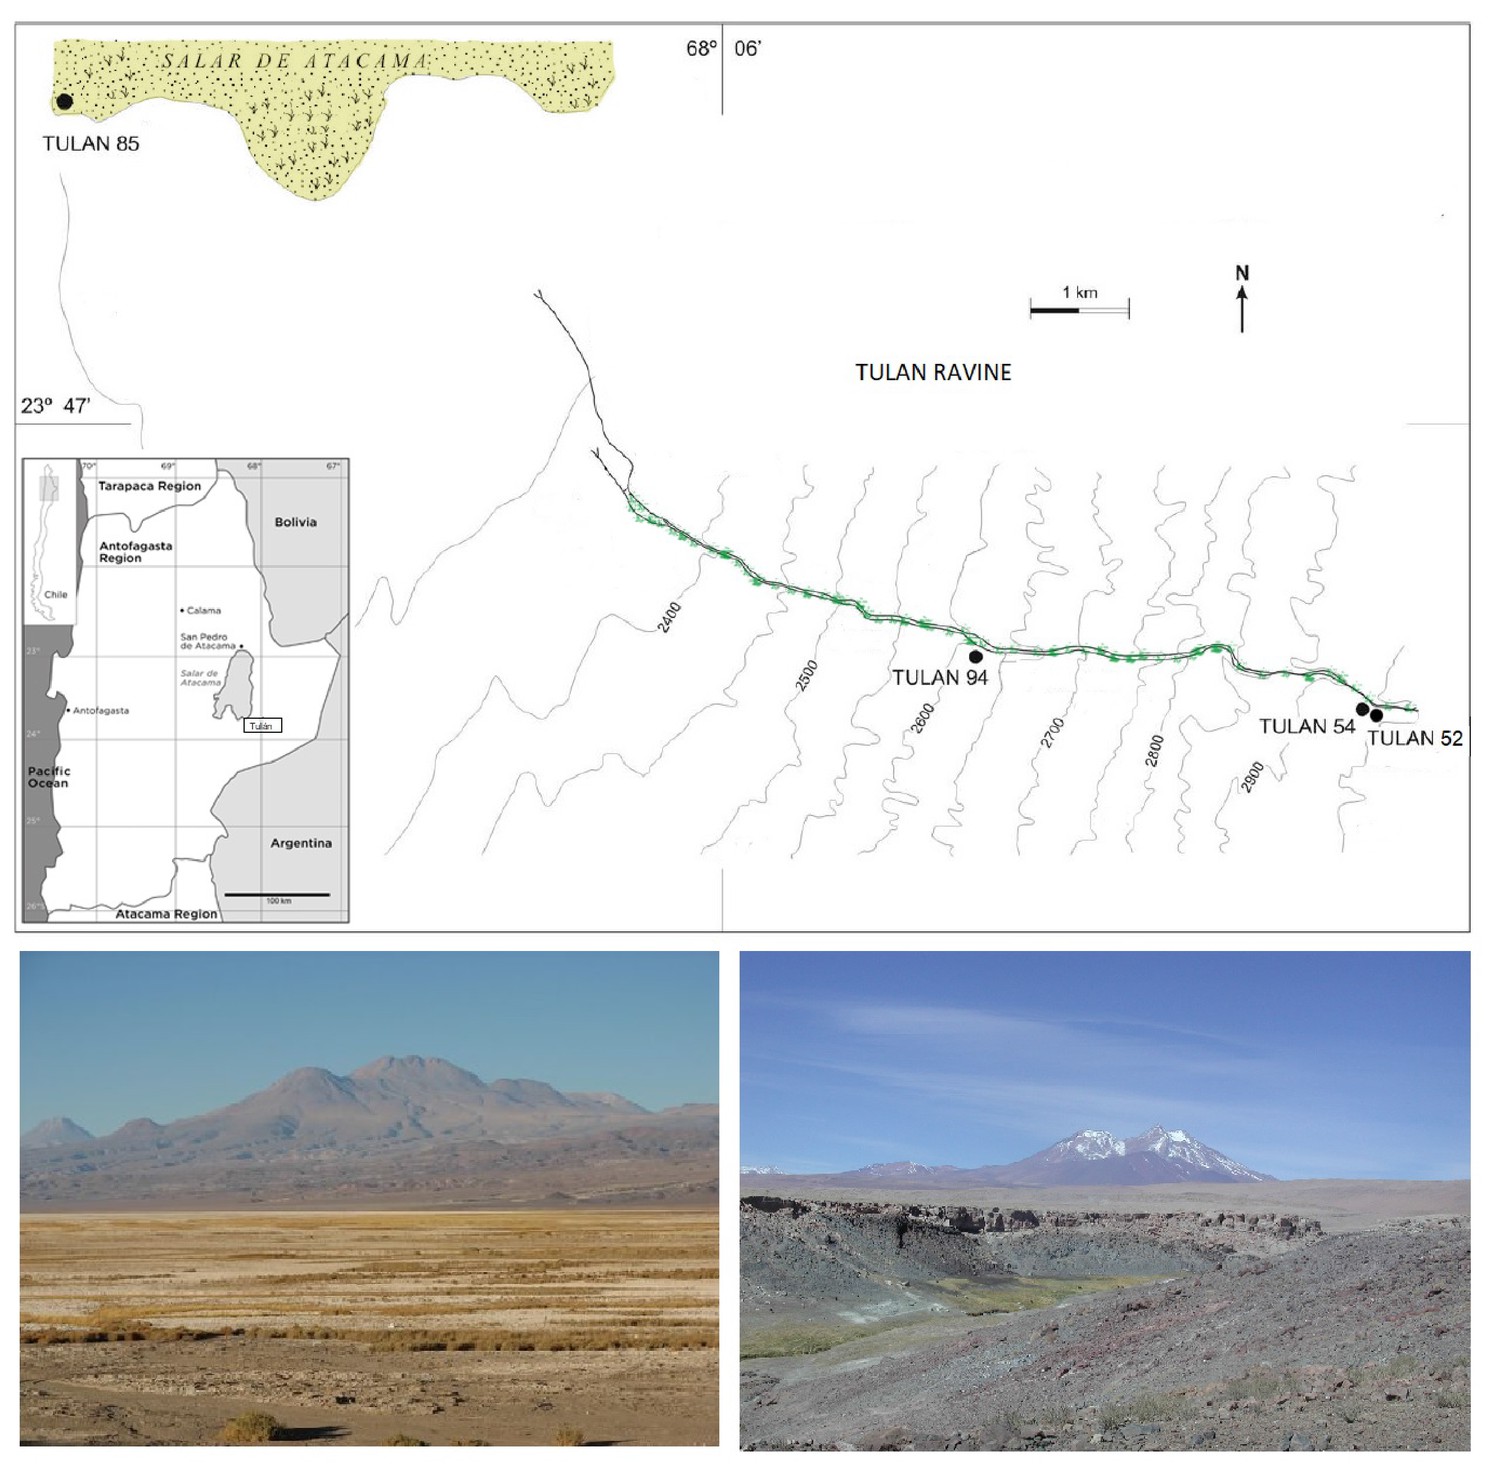
Top: Study area and sites mentioned in the text (modified from Núñez et al., 2009).
On the bottom left, Salar de Atacama salt flat border, view taken from the site Tulán-85. On the bottom right, Tulán ravine.
Figure 1—figure supplement 2
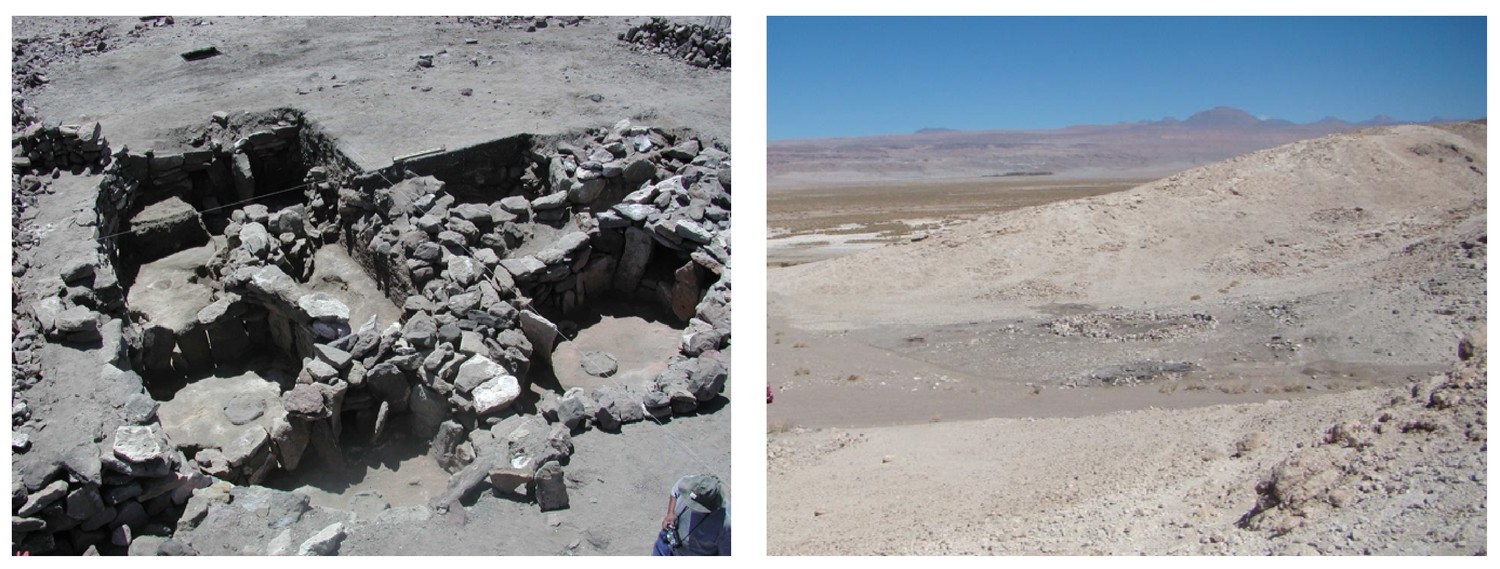
Main sunken ceremonial structure at Tulán-54 (left).
Panoramic view of Tulán-85 refuse mound (right). Map damage mapDamage plot for library 'ACTTGA' mapDamage plot for library 'TTGAAC.'
Figure 2
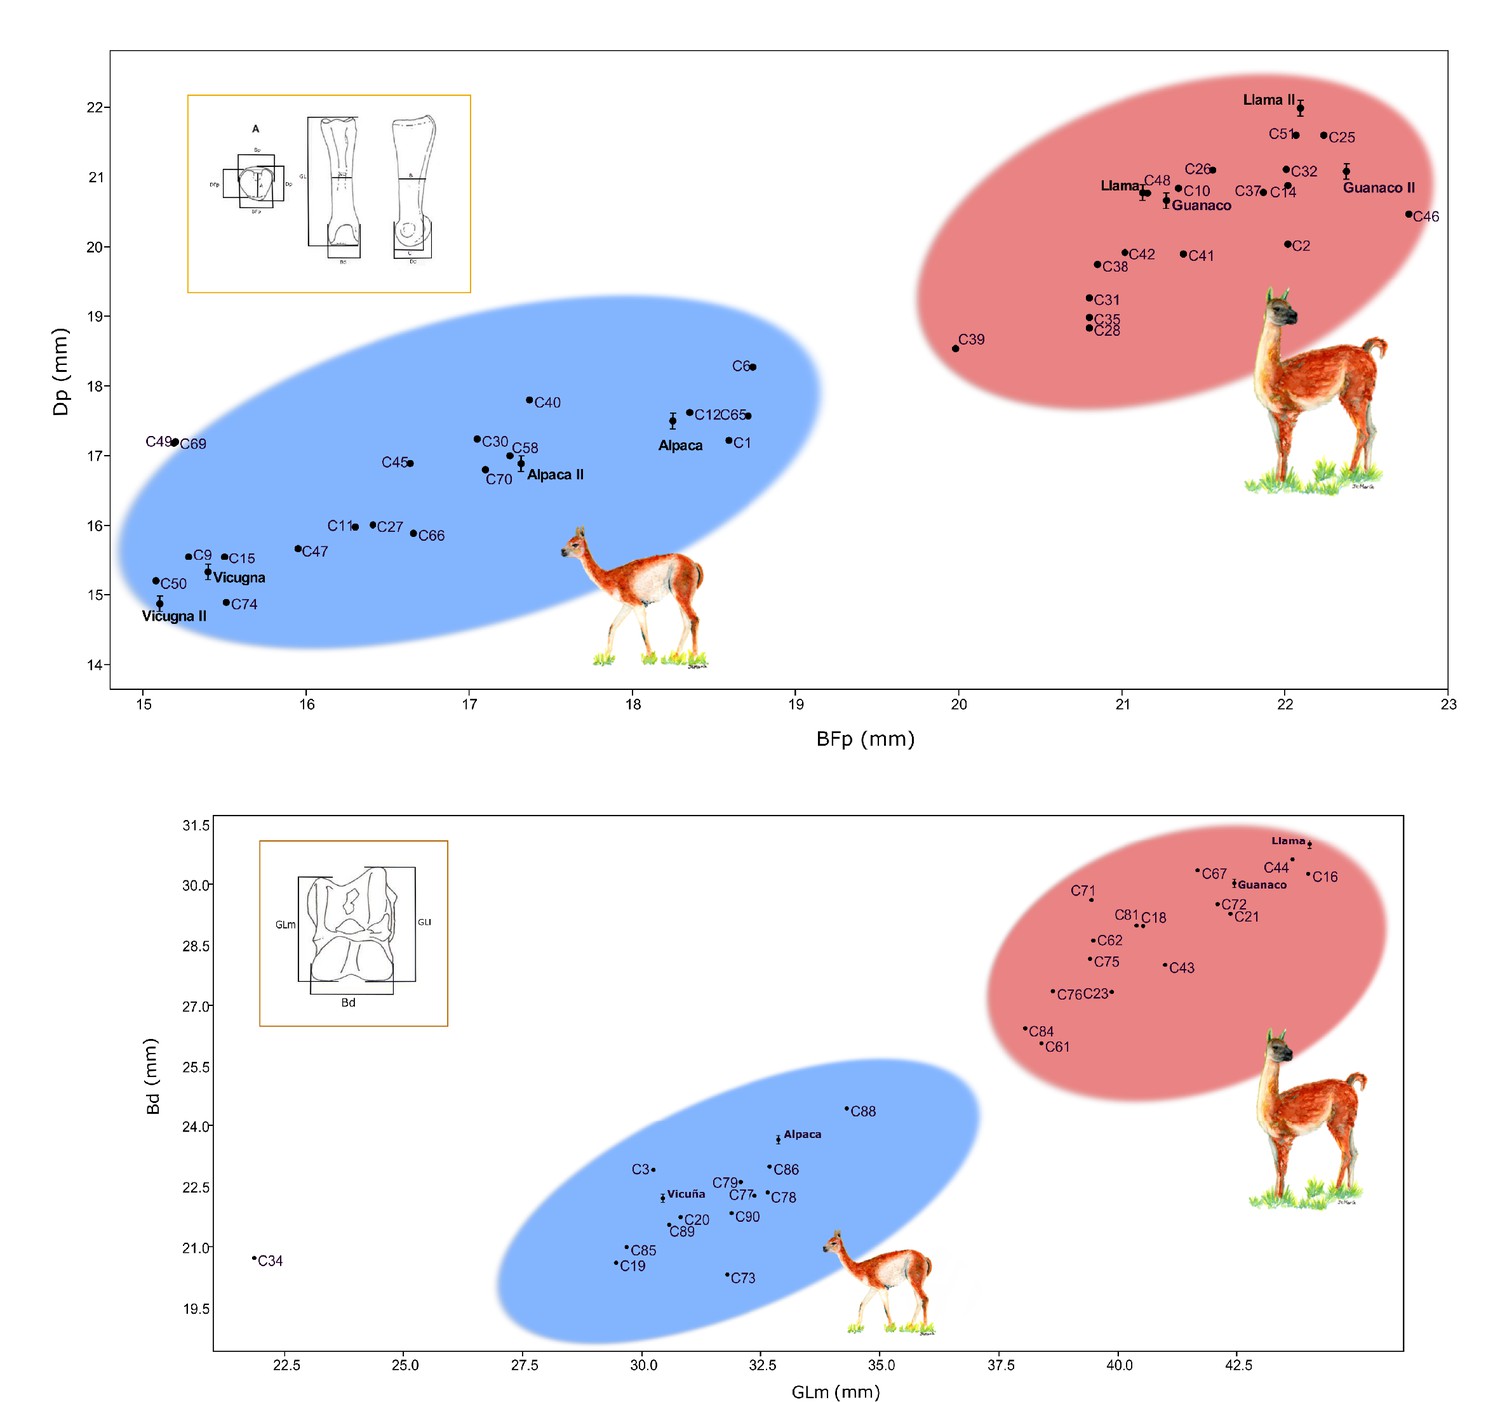
Correlation graphics of the first anterior phalanx and astragalus measurements.
(a) Correlation for the anterior phalanx measurements; Dp = depth proximal and Bfp = breath of facies articularis proximalis. (b) Correlation for the astragalus measurements; Bd = breadth distal and GLm = greatest length medial. Modern camelids are shown in bold font with standard deviations estimated for the anterior phalanx and astragalus (L' Heureux, 2010; Cartajena, 2003). Modern samples measured by Cartajena, 2003 were named as Guanaco II, Llama II, Vicuña II, and Alpaca II on the phalanx graphic. The blue ellipsis indicates the group of small sized specimens and the red ellipsis indicates the group of large sized specimens.
Figure 3 with 3 supplements
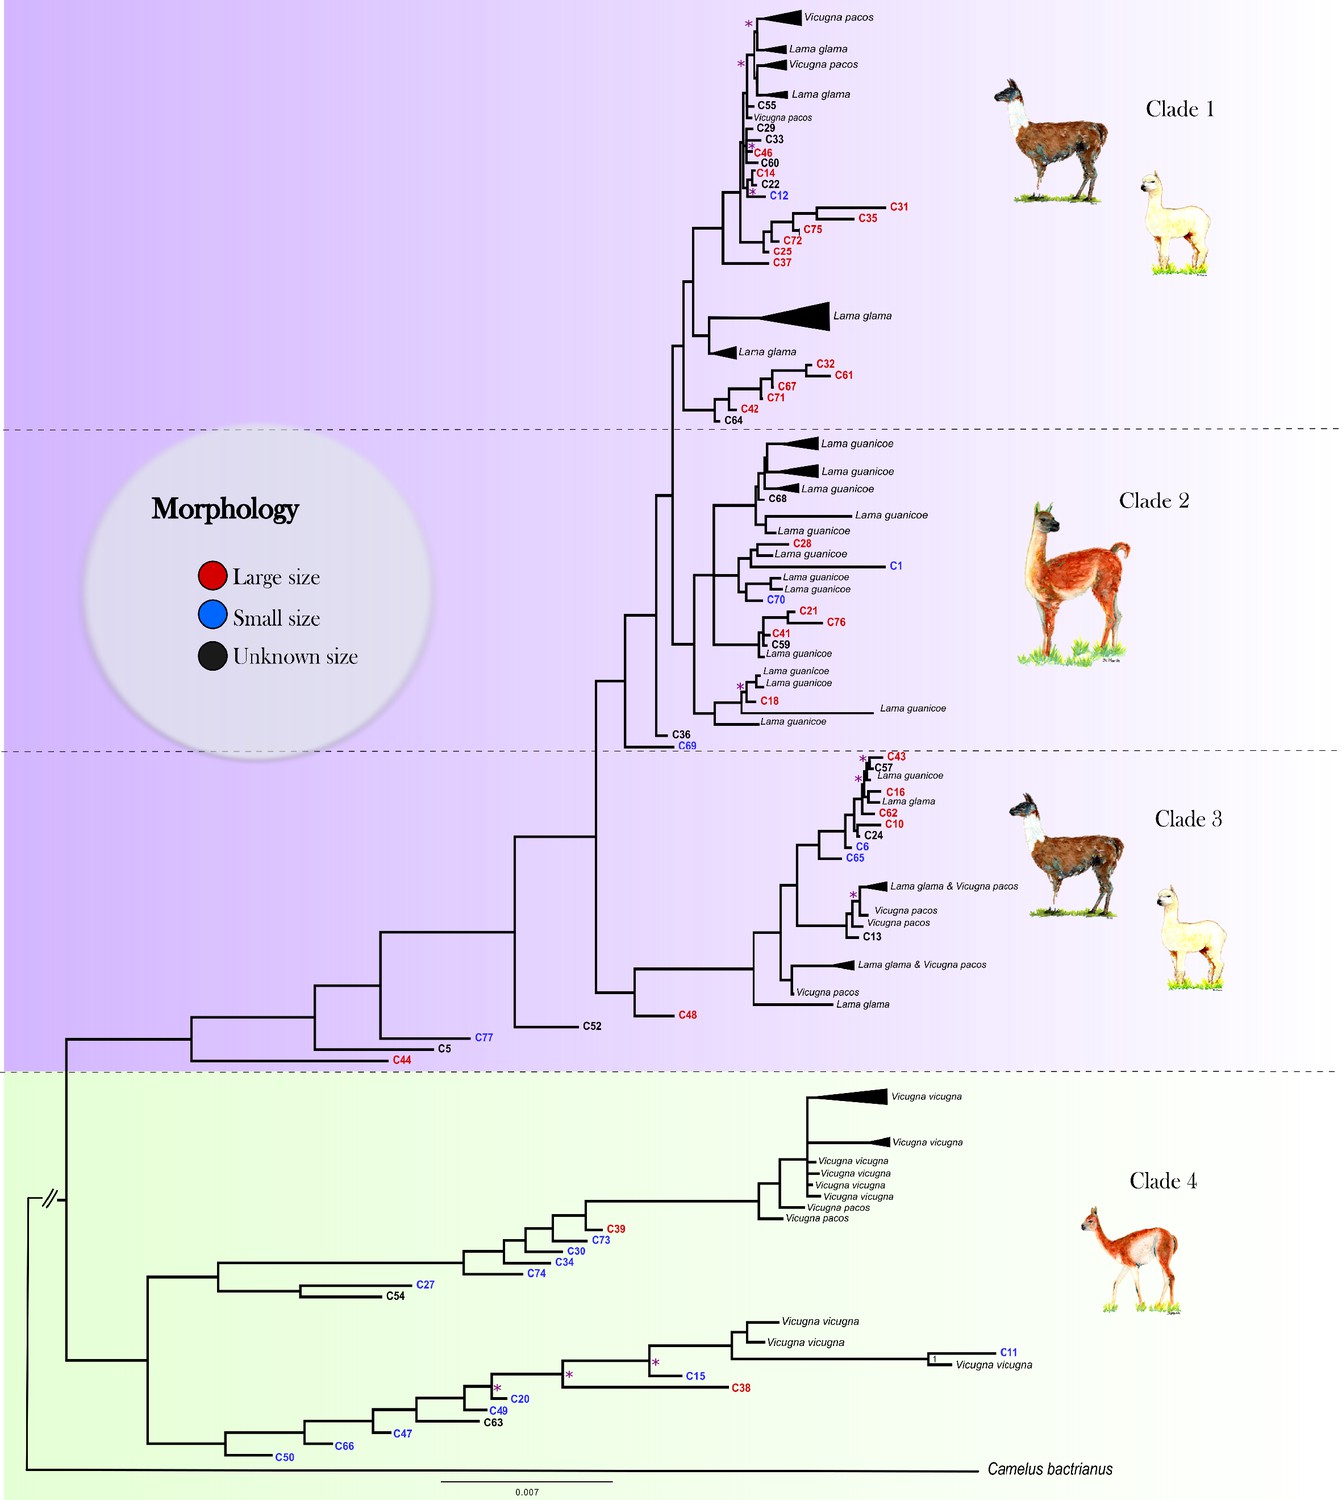
Mitogenomic phylogenetic tree.
Bayesian reconstruction of phylogenetic relationships between ancient and modern camelids using complete mitochondrial genome data. For the aDNA samples, their identification code appears on the branch tip with a color indicative of their size class assignment based on the sample’s morphological analysis. For the modern samples, the species' name and sample ID are in black font. Posterior probability values for 88.76% of the nodes were higher than 0.9, indicating strong statistical support for those nodes. The nodes with less than 0.9 posterior probability are indicated with a pink asterisk on the tree. See Figure 3—figure supplement 2 for a complete view of the modern samples included in the analysis.
Figure 3—figure supplement 1
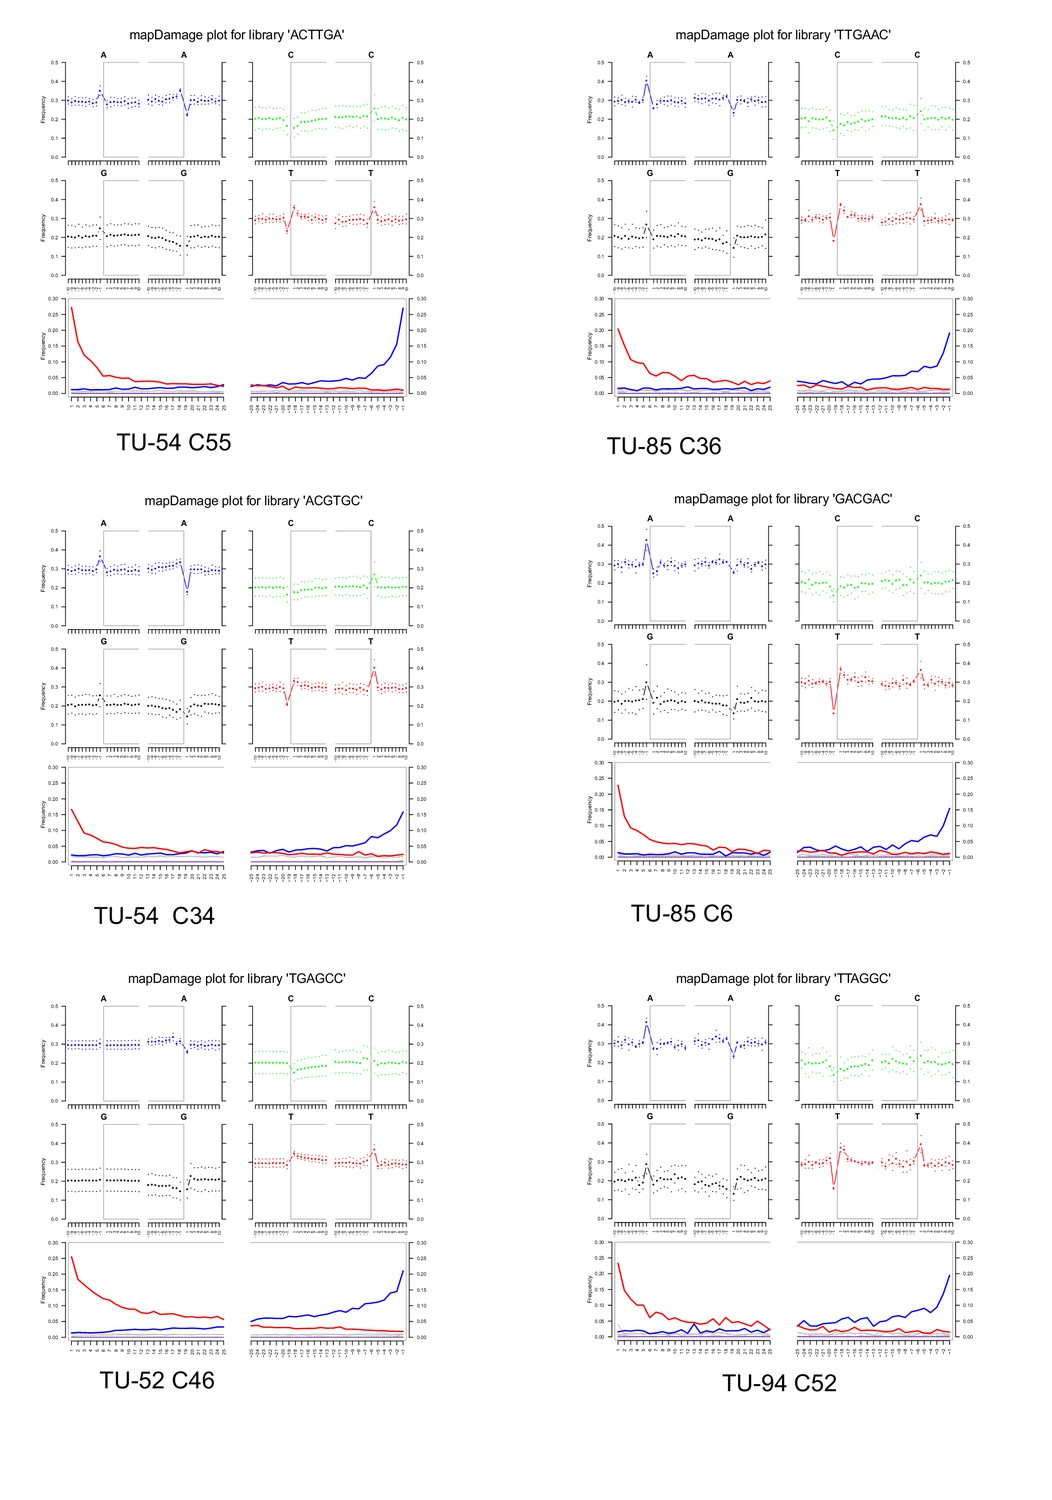
DNA fragmentation and nucleotide mis-incorporation plots for samples from Tulán-54, Tulán-85, Tulán-52, and Tulán-94.
DNA fragmentation patterns are shown for the 10 bp preceding reads starts (positions −1 to −10 on the left panels of each base composition profile) and the 10 bp following read ends (post-adapter and/or quality trimming); positions 1–10 on the right panel of each base composition profile = Nucleotide mis-incorporation patterns (3rd row) are shown for the first five nucleotides sequenced and the last 50 (post-adapter and/or quality trimming), with C→T substitution frequencies shown in red, and G→A substitution frequencies shown in blue.
Figure 3—figure supplement 2
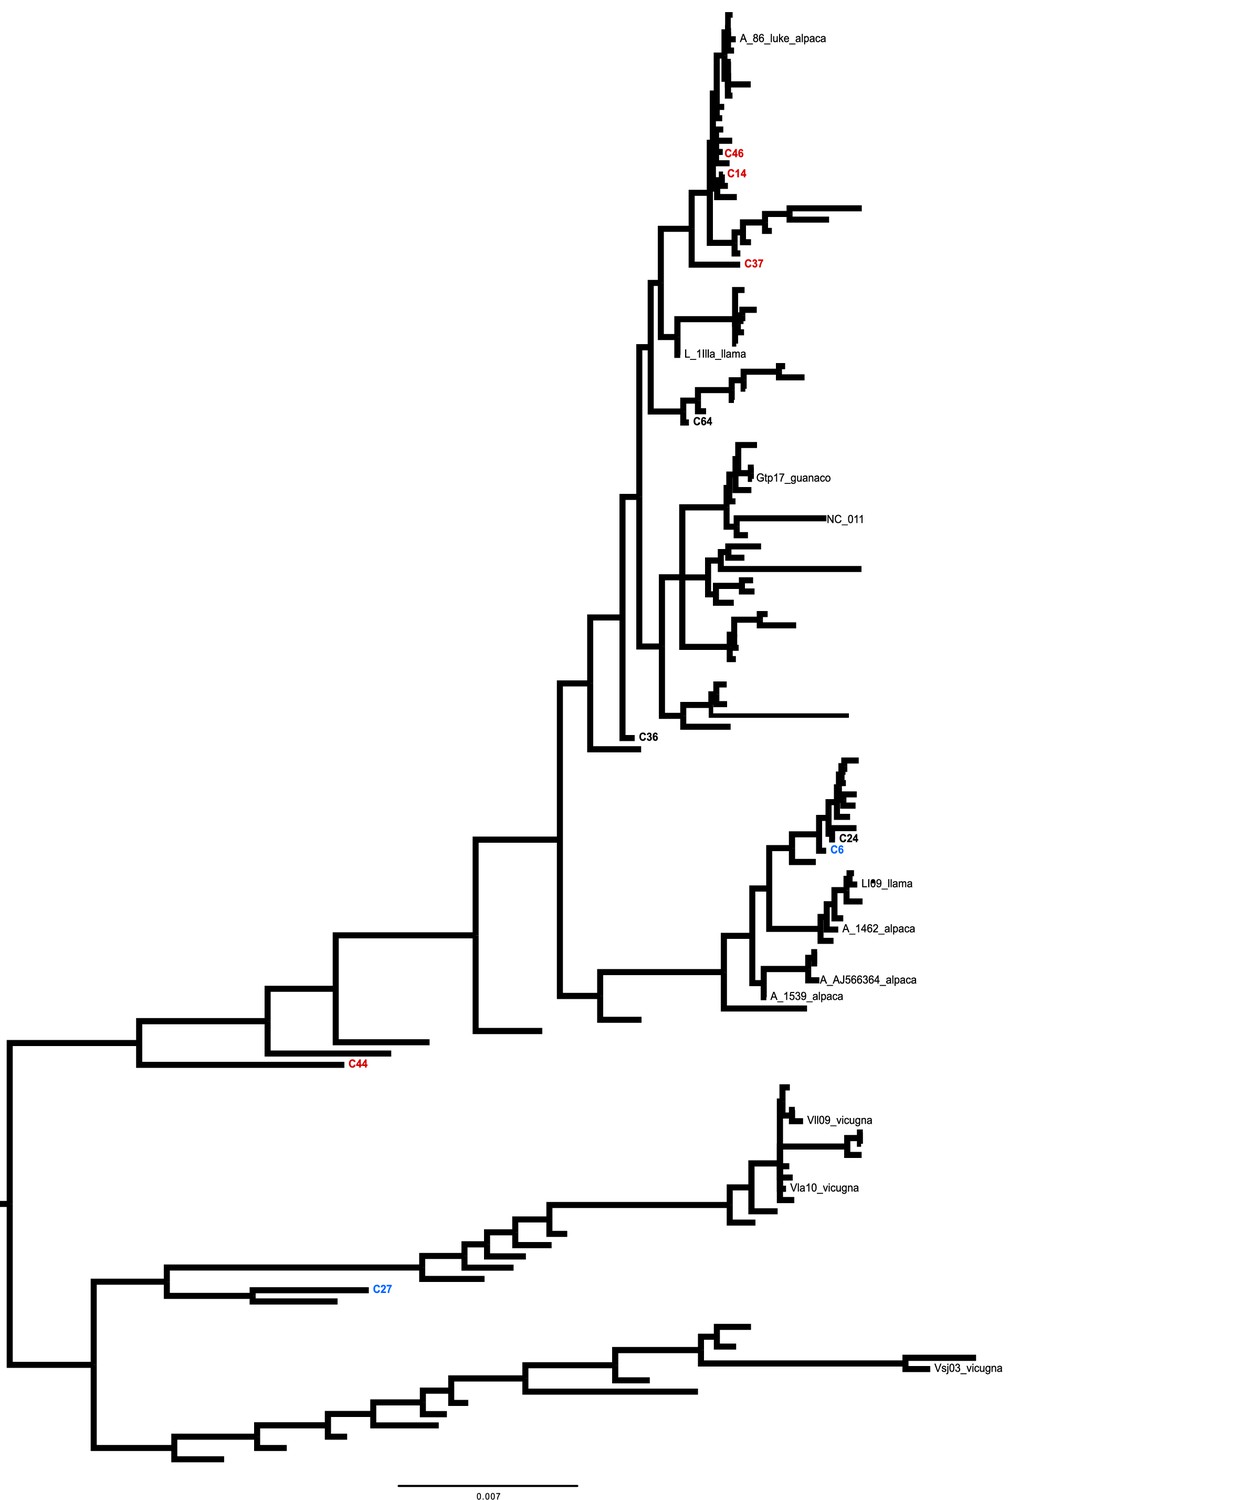
Mitogenomic phylogenetic tree.
Bayesian reconstruction of phylogenetic relationships between ancient and modern camelids using complete mitochondrial genome data. All names of the modern samples used in these analyses are included in the phylogenetic tree.
Figure 3—figure supplement 3
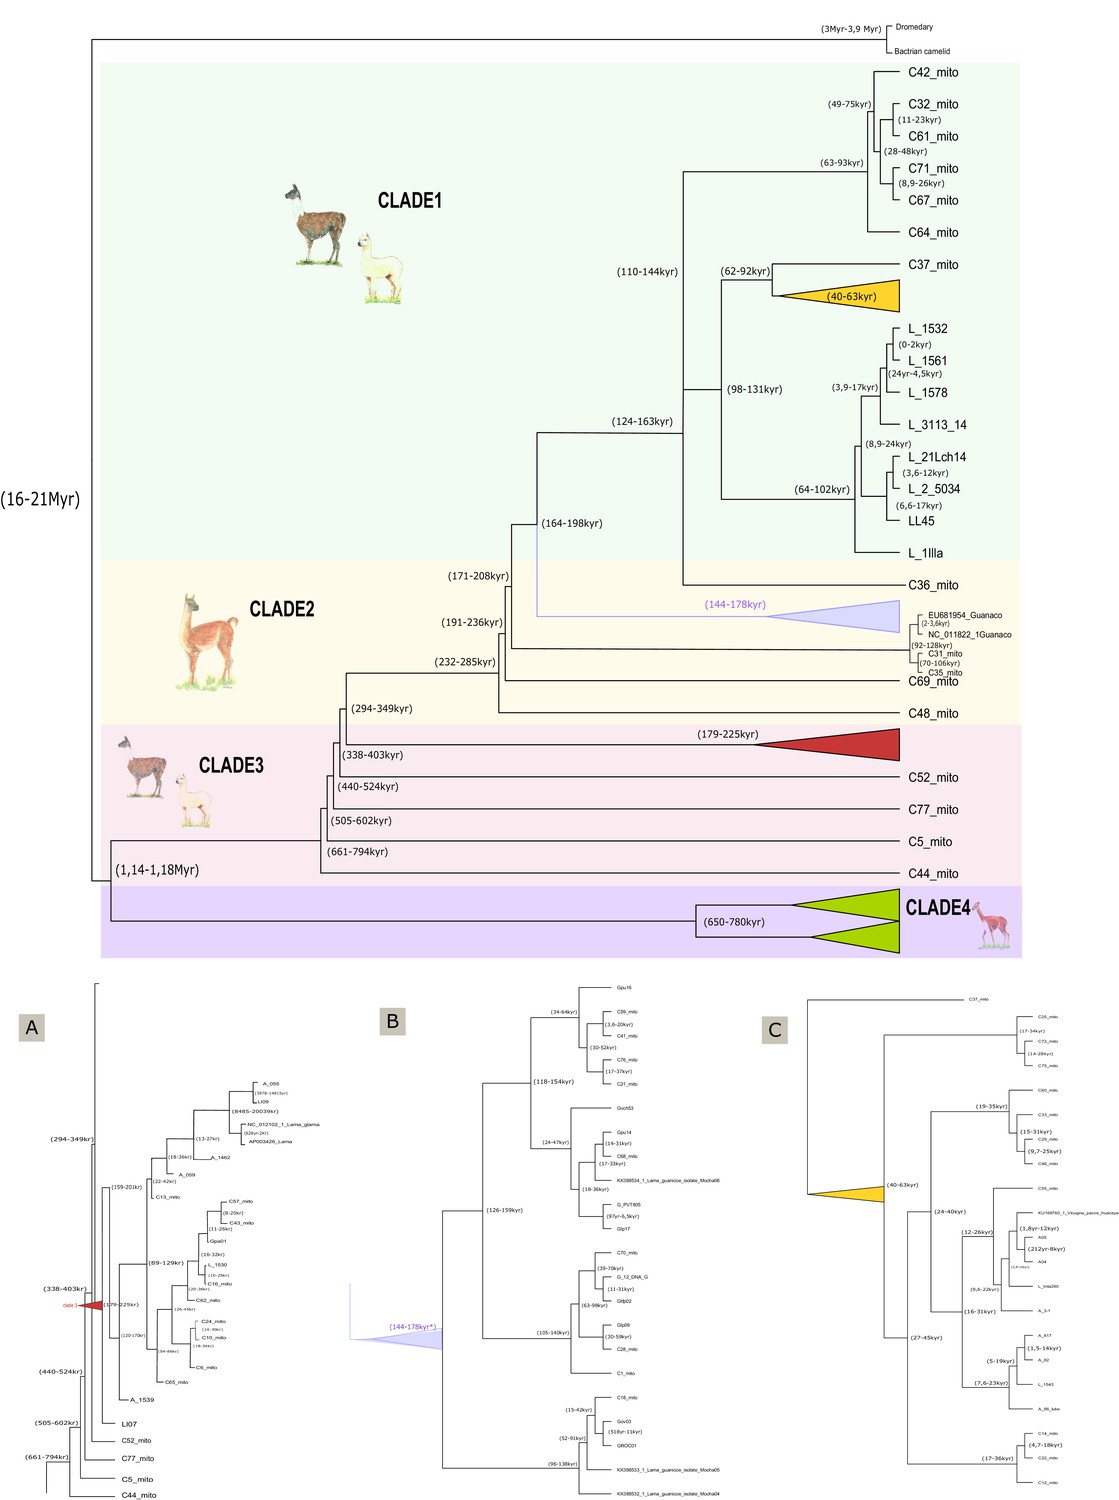
Dated mitogenomic phylogenetic tree.
Phylogeny and molecular timescale of South American camelids including Old World camels as an outgroup. Values in brackets refer to the gap of time when every clade diverges from another. (A) Enlargement of the red clade. (B) Enlargement of the yellow clade. (C) Enlargement of purple clade.
Figure 4
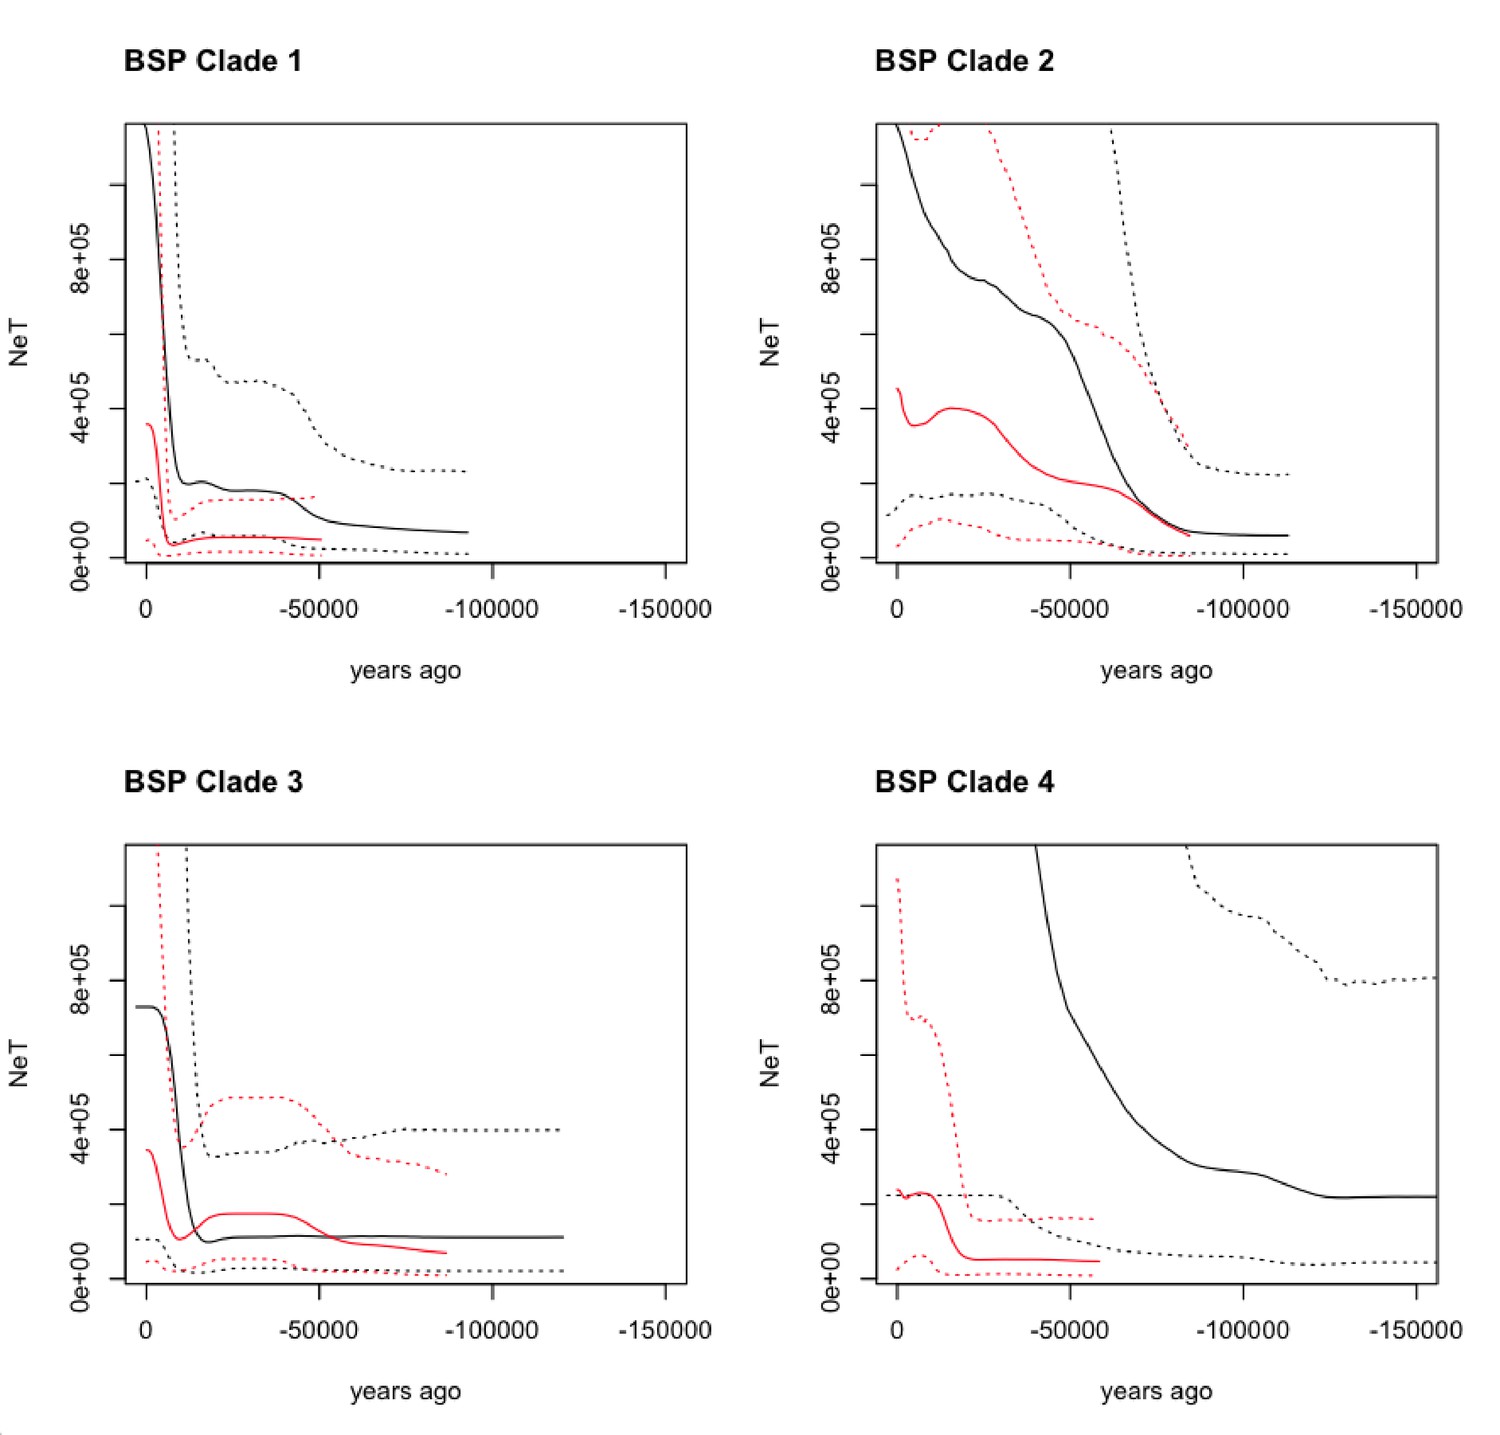
Bayesian Skyline Plot (BSP) derived from the analysis of the ancient and modern camelid data.
The x-axis is units of years in the past (from the present - zero, toward [-] 150,000 years ago), and the y-axis is equal to NeT (the product of the effective population size and the generation length). The black line is the ancient DNA dataset and the red line is the modern DNA dataset with the dotted lines indicating the 95% confidence interval of the model and the solid line the mean.
Figure 5
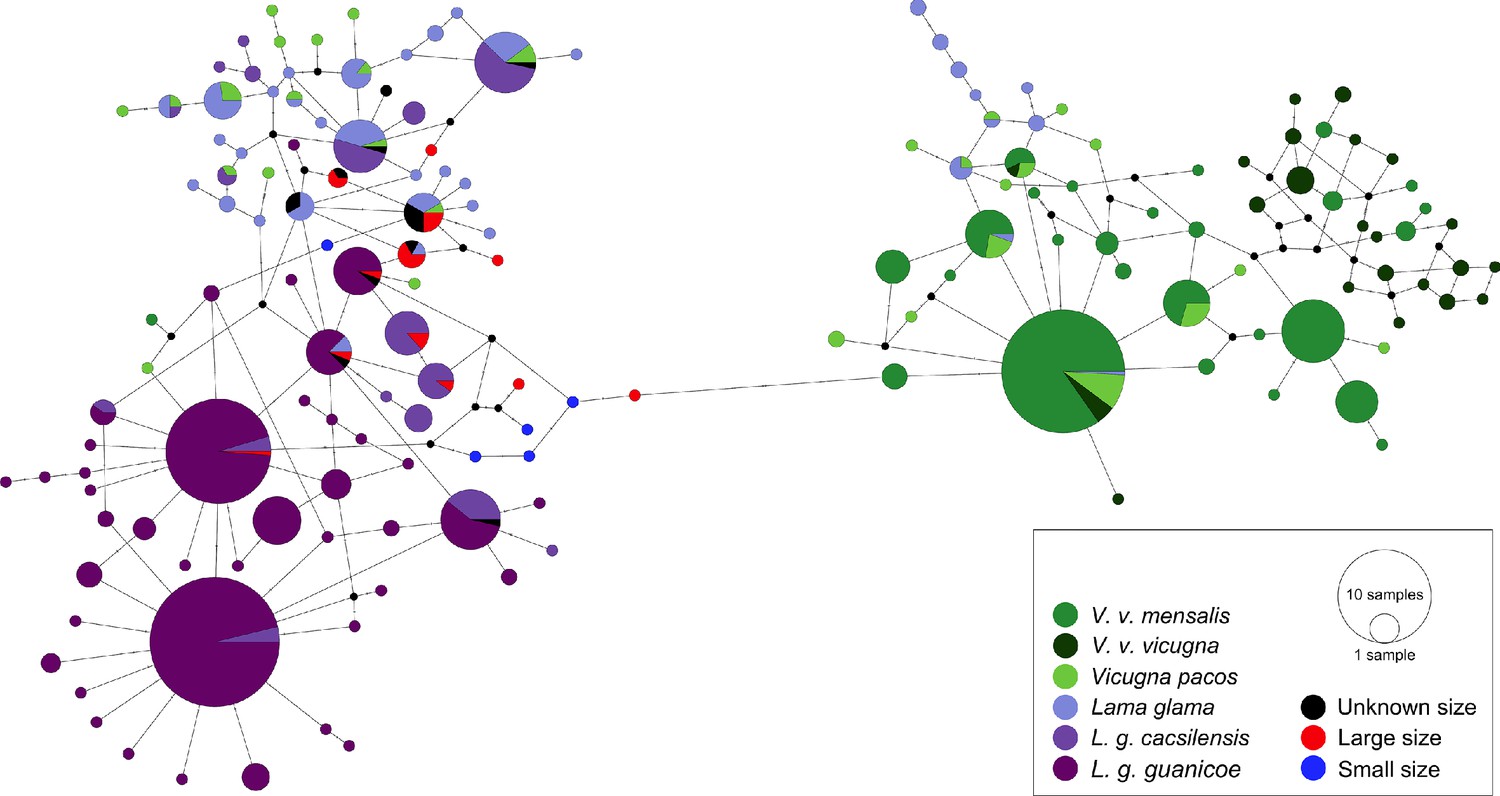
Minimum spanning network of ancient and modern camelid partial control region sequences.
A total of 158 different hypervariable I domain haplotypes found among 849 sequences are shown. Each color represents a camelid subspecies and the ancient sequences. The haplotypes colored in dark purple include the two subspecies of Lama guanicoe (cacsilensis and guanicoe) and light purple represents Lama glama. The groups colored with dark green are formed by the two subspecies of Vicugna vicugna (vicugna and mensalis), while the light green includes the domestic alpacas, Vicugna pacos. The aDNA samples from this study are shown in black, red, and blue. Each haplotype is represented by a circle with its size proportional to the haplotype’s frequency. Mutations are shown as small perpendicular lines crossing edges connecting haplotypes.
Figure 6
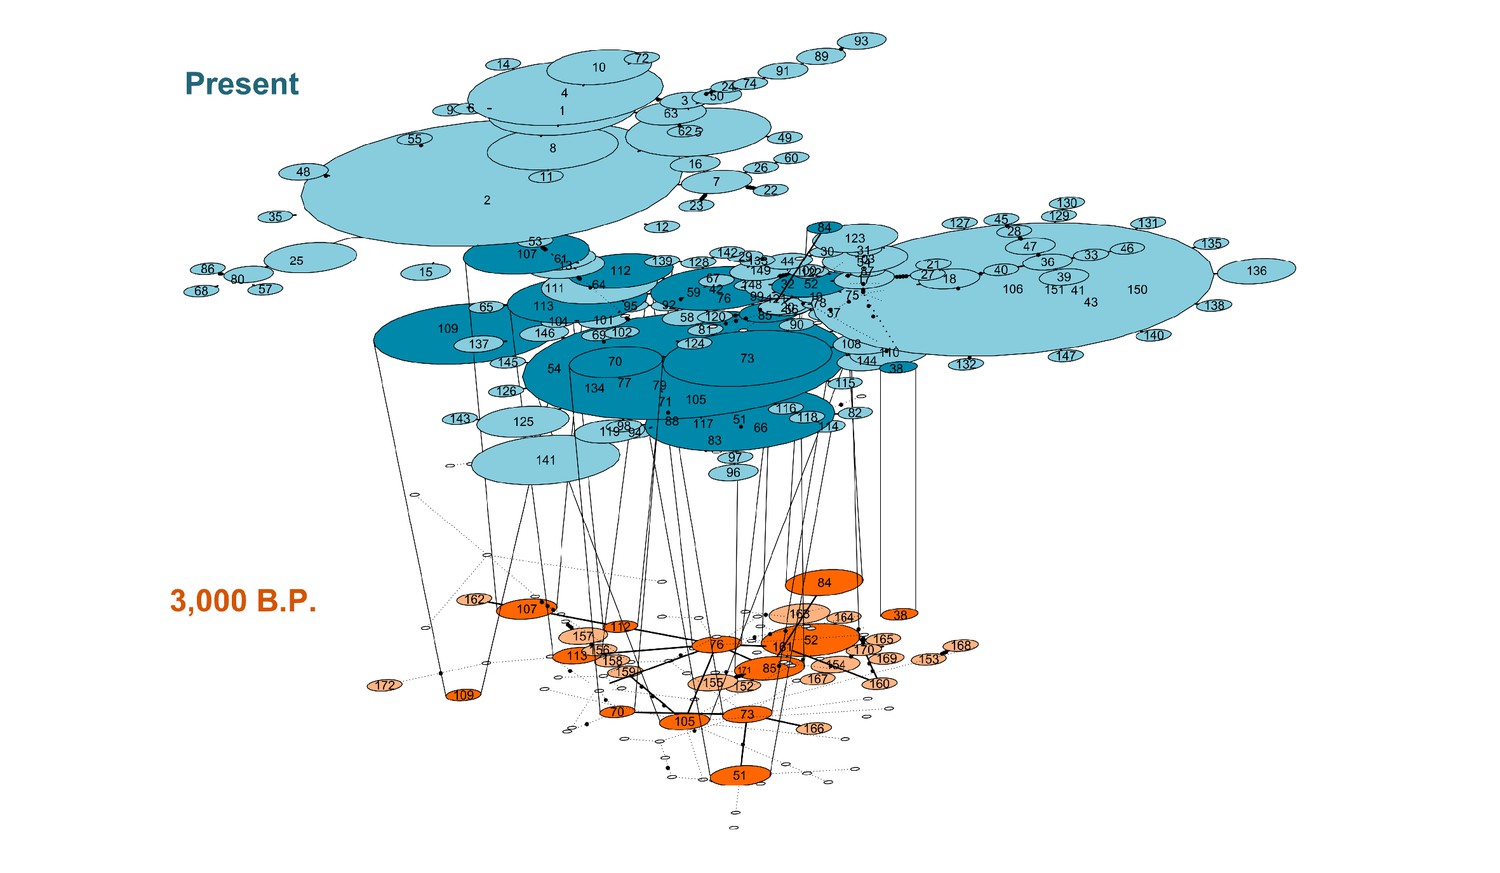
Temporal statistical parsimony haplotype networks for Lama guanicoe, Lama glama, Vicugna vicugna, and Vicugna pacos with ancient samples.
Haplotypes of modern camelid sequences are colored in blue and ancient DNA haplotypes in orange. Each mutation is connected by one black circle. If two haplotypes are separated by one mutation, they are connected by one line. Haplotypes shared by modern and ancient samples are connected by vertical lines showing dark blue and dark orange color (Table S9).
Figure 7
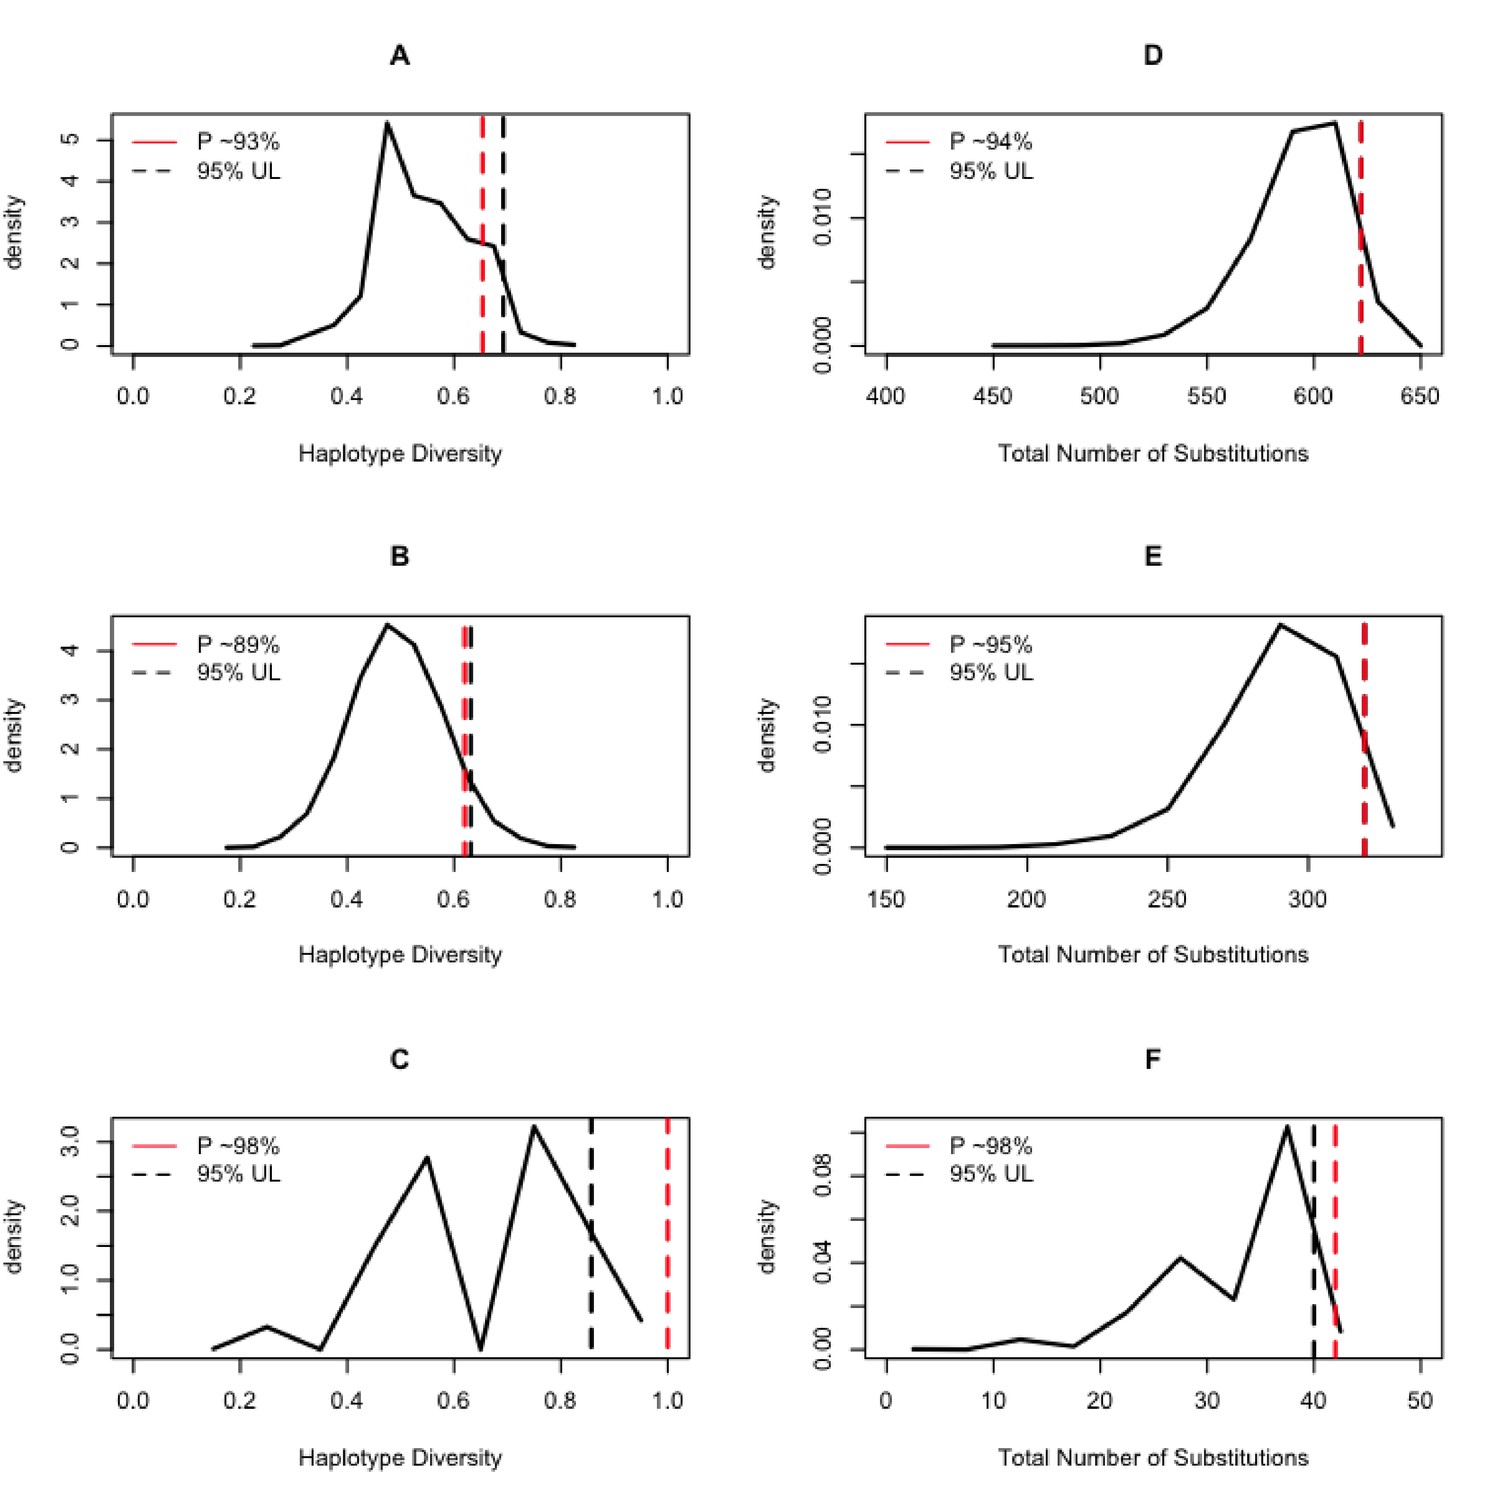
Expected distributions of summaries of genetic diversity conditional on the aDNA sample size.
The column on the left shows the results of estimating the haplotype diversity on random samples of the modern animals conditional on the sampling size of the ancient DNA samples. The column on the right shows the results of counting the number of substitutions on the random samples of the modern animals conditional on the sampling size of the ancient DNA samples. The black dashed line is the 95% upper bound of the statistic, and the red dashed line is the position of the ancient DNA data summary statistics of diversity within the context of the random samples of extant samples.
Additional files
-
Supplementary file 1
Supplementary tables that support the analysis and results above.
- https://cdn.elifesciences.org/articles/63390/elife-63390-supp1-v2.xlsx
-
Supplementary file 2
GenBank dataset information.
- https://cdn.elifesciences.org/articles/63390/elife-63390-supp2-v2.xlsx
-
Transparent reporting form
- https://cdn.elifesciences.org/articles/63390/elife-63390-transrepform-v2.pdf
Download links
A two-part list of links to download the article, or parts of the article, in various formats.
Downloads (link to download the article as PDF)
Open citations (links to open the citations from this article in various online reference manager services)
Cite this article (links to download the citations from this article in formats compatible with various reference manager tools)
Ancient DNA reveals the lost domestication history of South American camelids in Northern Chile and across the Andes
eLife 10:e63390.
https://doi.org/10.7554/eLife.63390


