Stretching of the retinal pigment epithelium contributes to zebrafish optic cup morphogenesis
- Centro de Biología Molecular Severo Ochoa, CSIC-UAM, c/ Nicolás Cabrera, 1, Campus de la Universidad Autónoma de Madrid, Spain
- CIBER de Enfermedades Raras (CIBERER), Spain
Figures
Figure 1 with 3 supplements
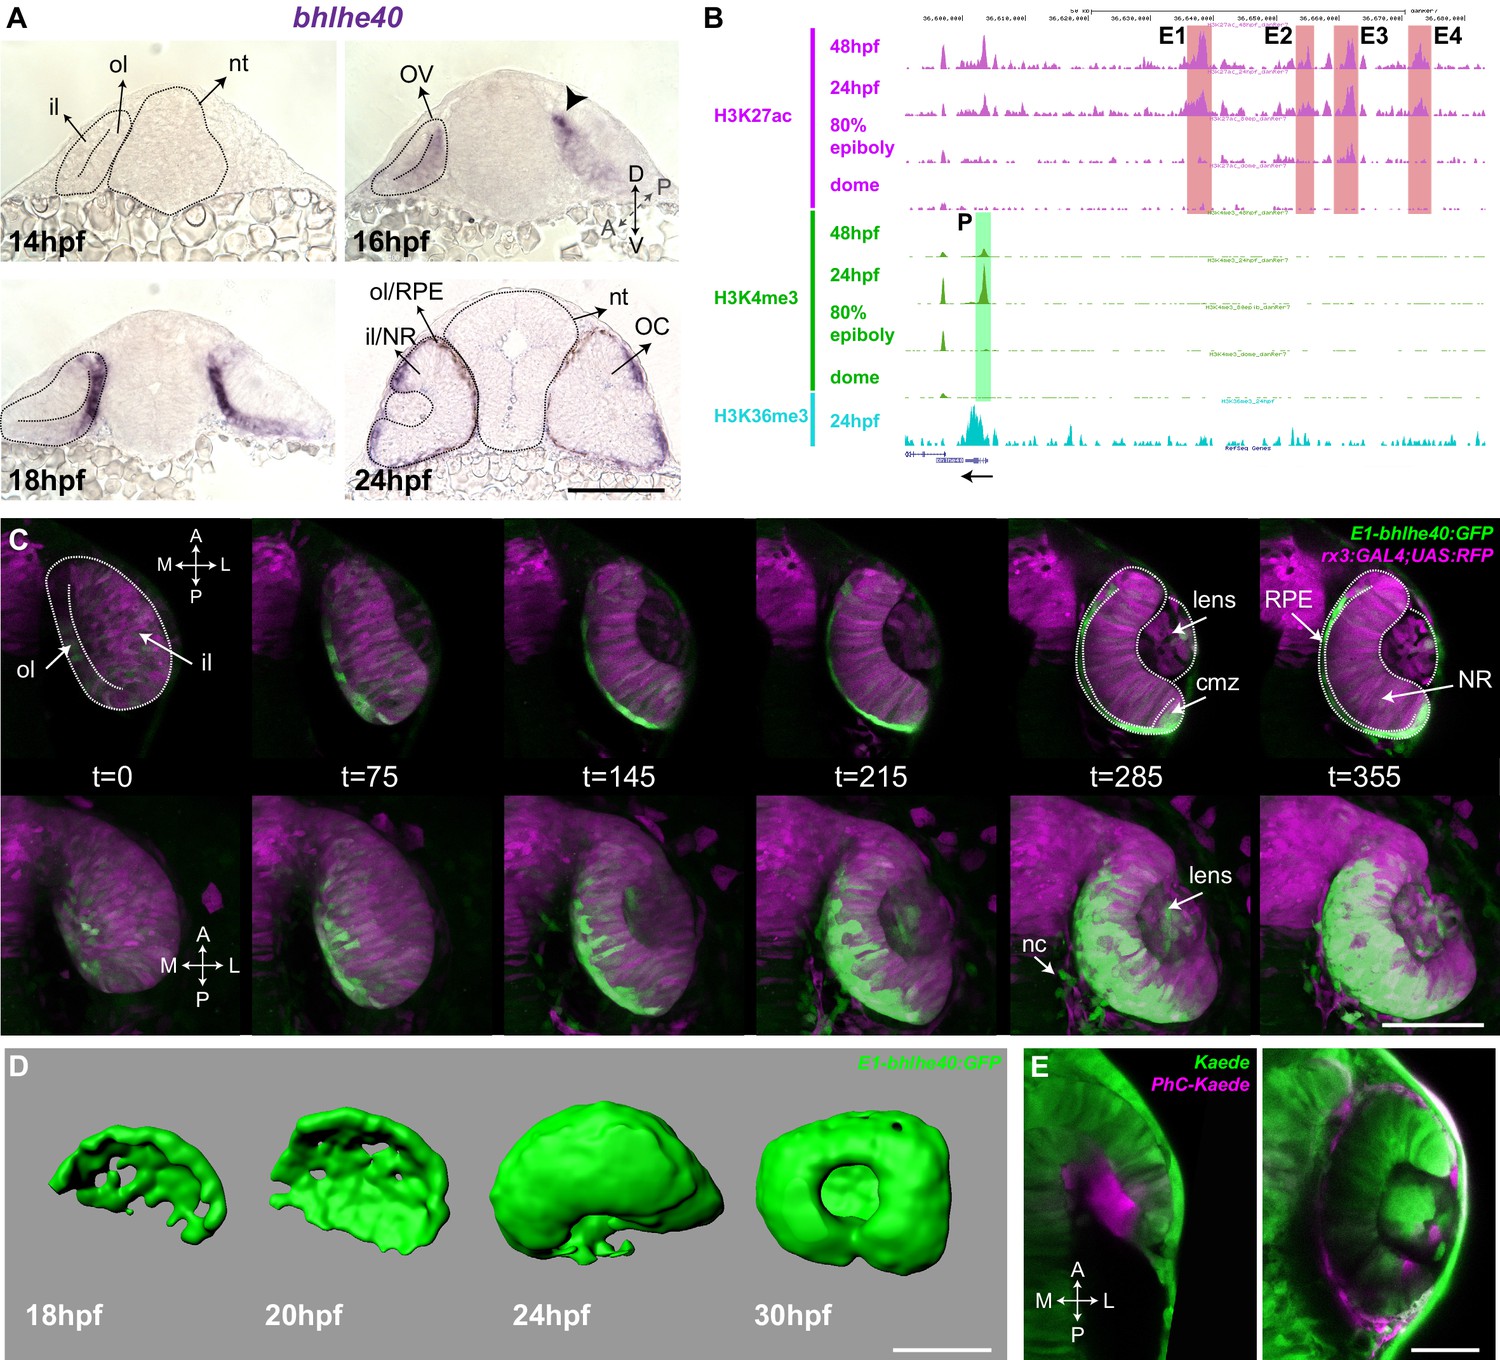
The Tg(E1-bhlhe40:GFP) line is a suitable tool to study early retinal pigment epithelium (RPE) generation.
(A) Frontal cryo-sections of 14–24 hpf wild-type (wt) embryos hybridized in toto with a bhlhe40-specific probe. mRNA is first detected in the dorsal most region of the optic vesicle (OV) outer layer (arrowhead) and then expands ventrally. (B) UCSC Genome Browser view of H3K27ac (purple, potential active enhancers), H3K4me3 (green, potentially active promoters), and H3K36me3 (light blue, transcriptionally active regions) tracks obtained for four zebrafish developmental stages: dome, 80% epiboly, 24 hpf, 48 hpf related to the upstream bhlhe40 genomic locus (50 kb). The black arrow at the bottom indicates bhlhe40 position and direction. The promoter (P) and the four selected enhancers (E1–4) are highlighted with a colour-coded box. (C) Time frames from in vivo time-lapse recording of a Tg(E1-bhlhe40:GFP;rx3:GAL4;UAS;RFP) embryo between 14 and 24 hpf. Time is indicated in min. Note that the GFP reporter signal matches the bhlhe40 mRNA distribution in A. (D) 3D reconstruction of the prospective RPE from Tg(E1-bhlhe40:GFP) embryos at the stages indicated in the panel. (E) Dorsal view of a wt embryo injected with Kaede mRNA (green) at 12 hpf. A group of cells in the dorsal region of the outer layer was photoconverted (magenta, panel on the left) and the embryo visualized at 30 hpf (right panel). Magenta labelled cells cover the entire RPE region. Black and white dashed lines delineate the OV, neural tube, and virtual lumen in A, C. Abbreviations: A, anterior; cmz, ciliary margin zone; il, inner layer; l, lateral; m, medial; NR, NR; OC, OC; ol, outer layer; OV, optic vesicle; P, posterior; RPE, retinal pigment epithelium. Scale bars: 100 µm (A–D); 50 µm, E.
Figure 1—video 1
Dorsal view of the optic vesicle (OV) to optic cup (OC) transition visualized in a double Tg(E1-bhlhe40:GFP; rx3:GAL4;UAS:RFP embryo).
Single confocal section, related to Figure 1, frame rate 1/5 min.
Figure 1—video 2
Dorsal view of the optic vesicle (OV) to optic cup (OC) transition visualized in a double Tg(E1-bhlhe40:GFP; rx3:GAL4;UAS:RFP embryo).
Maximum projection reconstruction, related to Figure 1, frame rate 1/5 min.
Figure 1—video 3
Lateral view of the optic cup (OC) folding visualized in a Tg(E1-bhlhe40:GFP) embryo injected with H2B-RFP mRNA (magenta) related to Figure 1, frame rate 1/5 min.
Figure 2
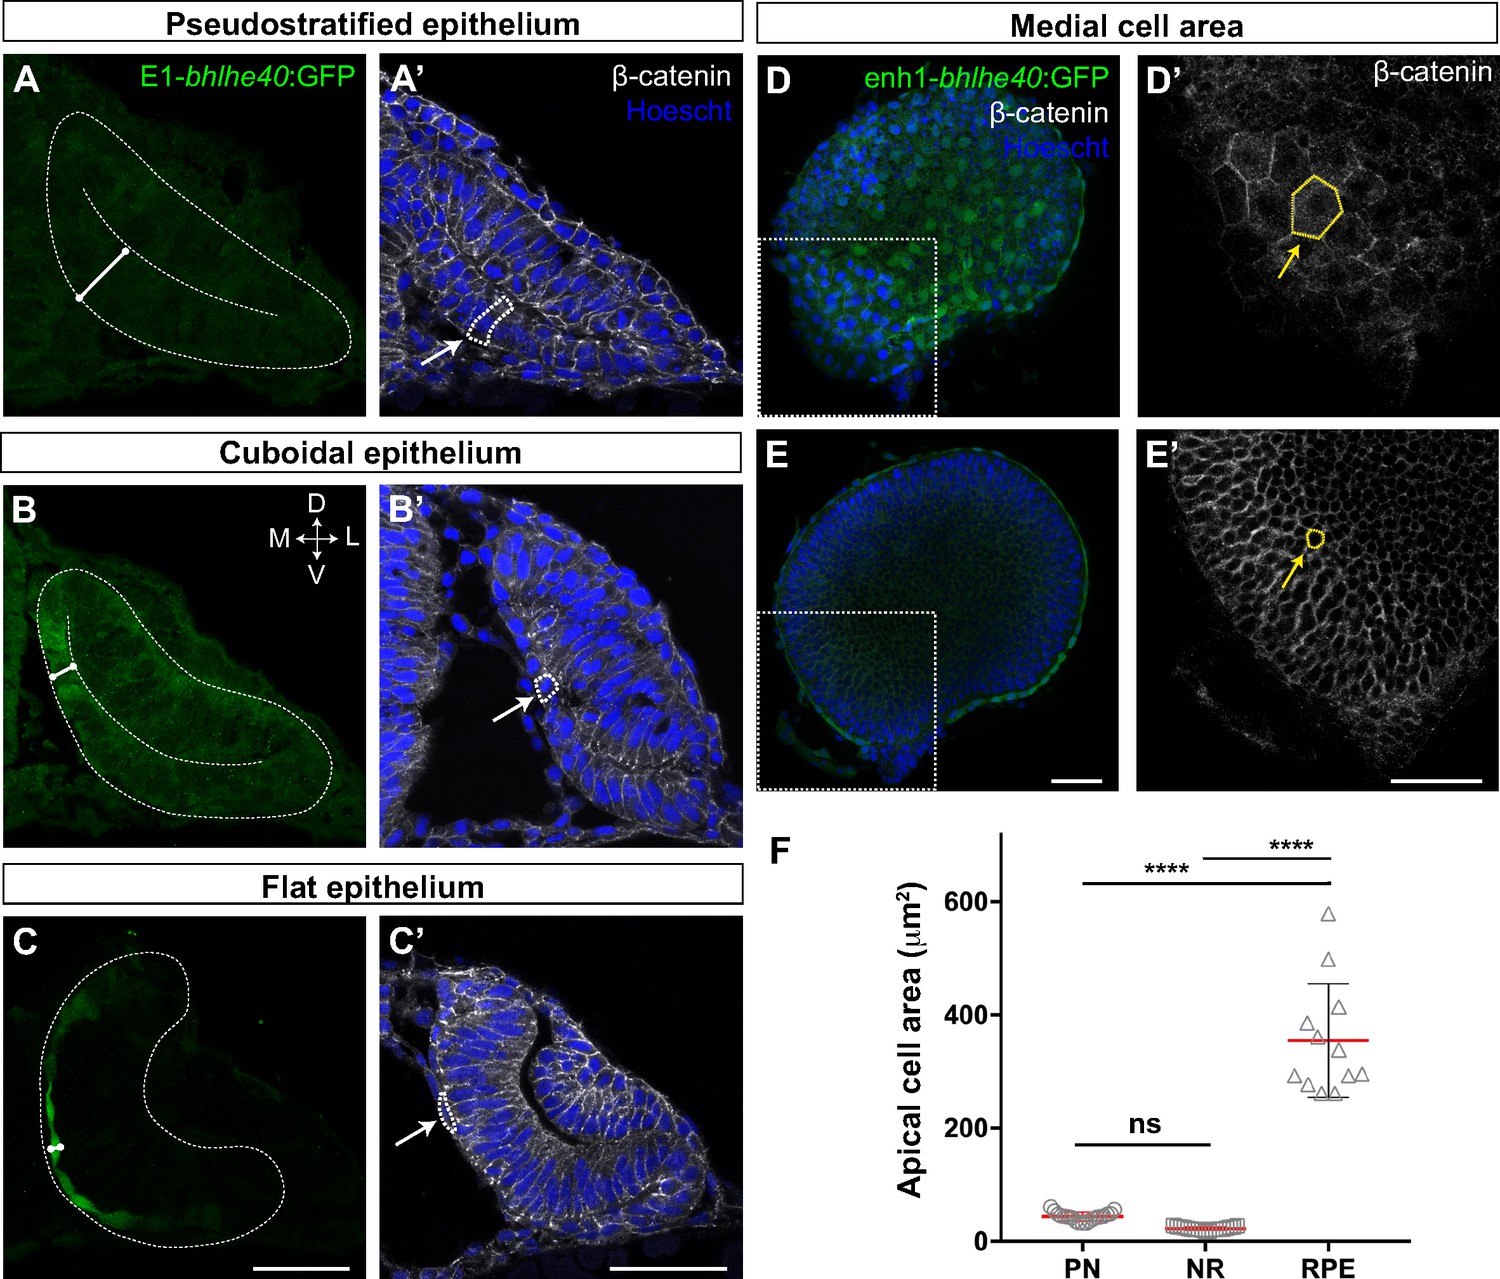
The retinal pigment epithelium (RPE) converts from a pseudostratified to a squamous epithelium during optic vesicle (OV) folding by increasing individual cell surface.
(A–C’) Confocal images of frontal cryo-sections of Tg(E1-bhlhe40:GFP) embryos immunostained for GFP (green) and β-catenin (white) and counterstained with Hoechst (blue). Note that the RPE rapidly decreases its thickness white straight line in (A–C) and cells change from columnar (14 hpf, arrow in A’) to cuboidal (16 hpf, arrow in B’) and then flat shape (22 hpf, arrow in C’). White dashed lines delineate eye contour and virtual lumen in A–C. (D–E’) Confocal images of the posterior RPE (D, D’) and neural retina (NR) (E, E’) regions of an eye cup dissected from 30 hpf Tg(E1-bhlhe40:GFP) embryos immunostained for GFP (green) and β-catenin (white) and counterstained with Hoechst (blue). Images in D’, E’ are high power views of the areas boxed in white box in D, E. Note the hexagonal morphology (yellow arrow in D’) of RPE cells (average area 354.8 ± 100.3 μm2) in contrast to the small and roundish cross-section of retinal progenitors (average area 22.5 ± 2.9 μm2; yellow arrow in E’). (F) The graph represents the average area of individual OV progenitors and NR and RPE cells (n = 15–19). The average area is calculated using cells from five different embryos. Data represent mean ± SD, ****p < 0.0001. ns, non-significant. Scale bar: 50 µm.
-
Figure 2—source data 1
The source data 1 is the excell file that is already correcly linked.
- https://cdn.elifesciences.org/articles/63396/elife-63396-fig2-data1-v2.xlsx
Figure 3 with 2 supplements
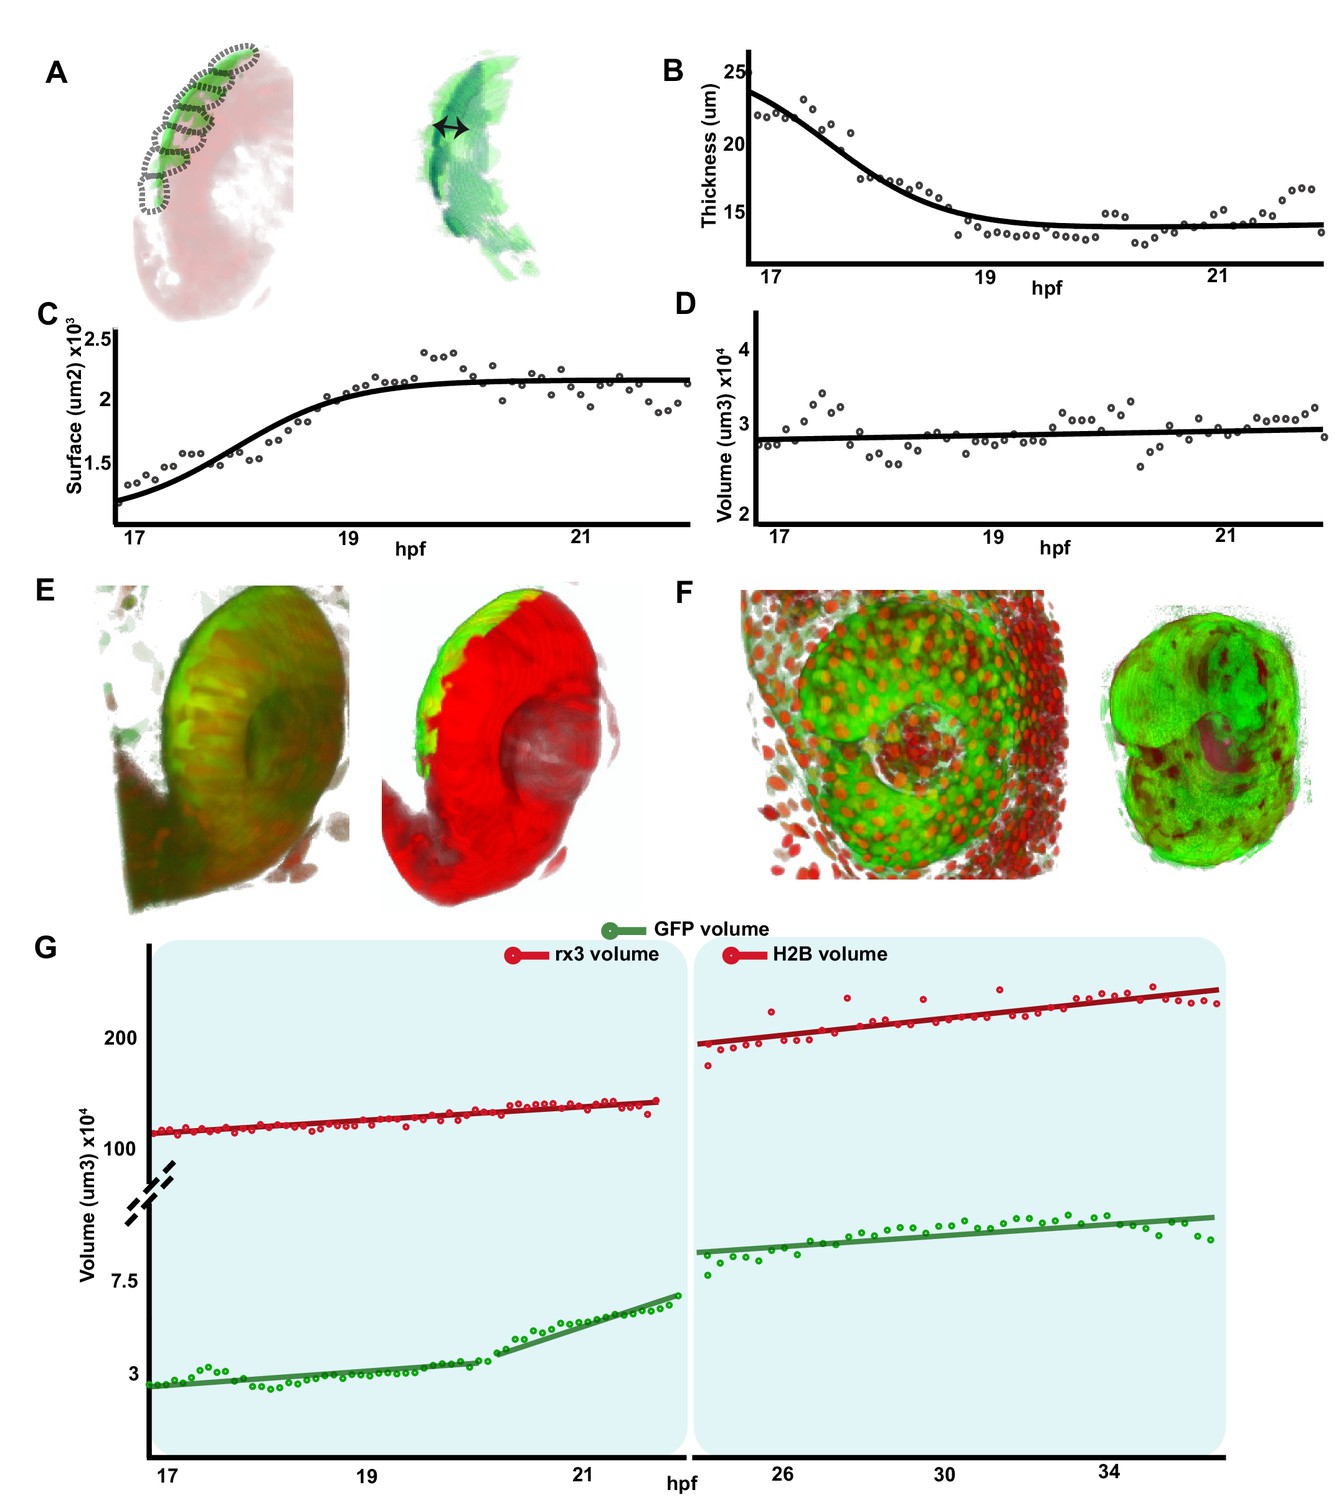
Retinal pigment epithelium (RPE) volume is conserved during initial tissue morphogenesis.
(A) Image on the left represents the reconstruction of a single frame from Figure 1—video 2 Tg(E1-bhlhe40:GFP; rx3:GAL4;UAS:RFP embryo) showing the optic vesicle/optic cup (OV/OC) in red and the RPE in green. The segments in which the RPE was discretized are depicted with black dashed lines. The image on the right shows the RPE reconstruction obtained after filtering. Double arrow points to RPE thickness. (B–D) The graphs show how the RPE thickness (B, calculated as volume/surface), surface (C), and volume (D) change as a function of the developmental stage. (E) 3D reconstructions of raw (left) and processed (right) versions of a frame from Figure 1—videos 1 and 2. (F) 3D reconstructions of raw (left) and processed (right) versions of a frame from Figure 3—video 1. (G) Quantification of RPE and eye volume based on Figure 1—videos 1 and 2 (rx3 volume quantification) and Figure 3—video 1 (H2B volume quantification) along developmental stages.
-
Figure 3—source data 1
Quantification of RPE thickness along time and space.
- https://cdn.elifesciences.org/articles/63396/elife-63396-fig3-data1-v2.xlsx
Figure 3—figure supplement 1
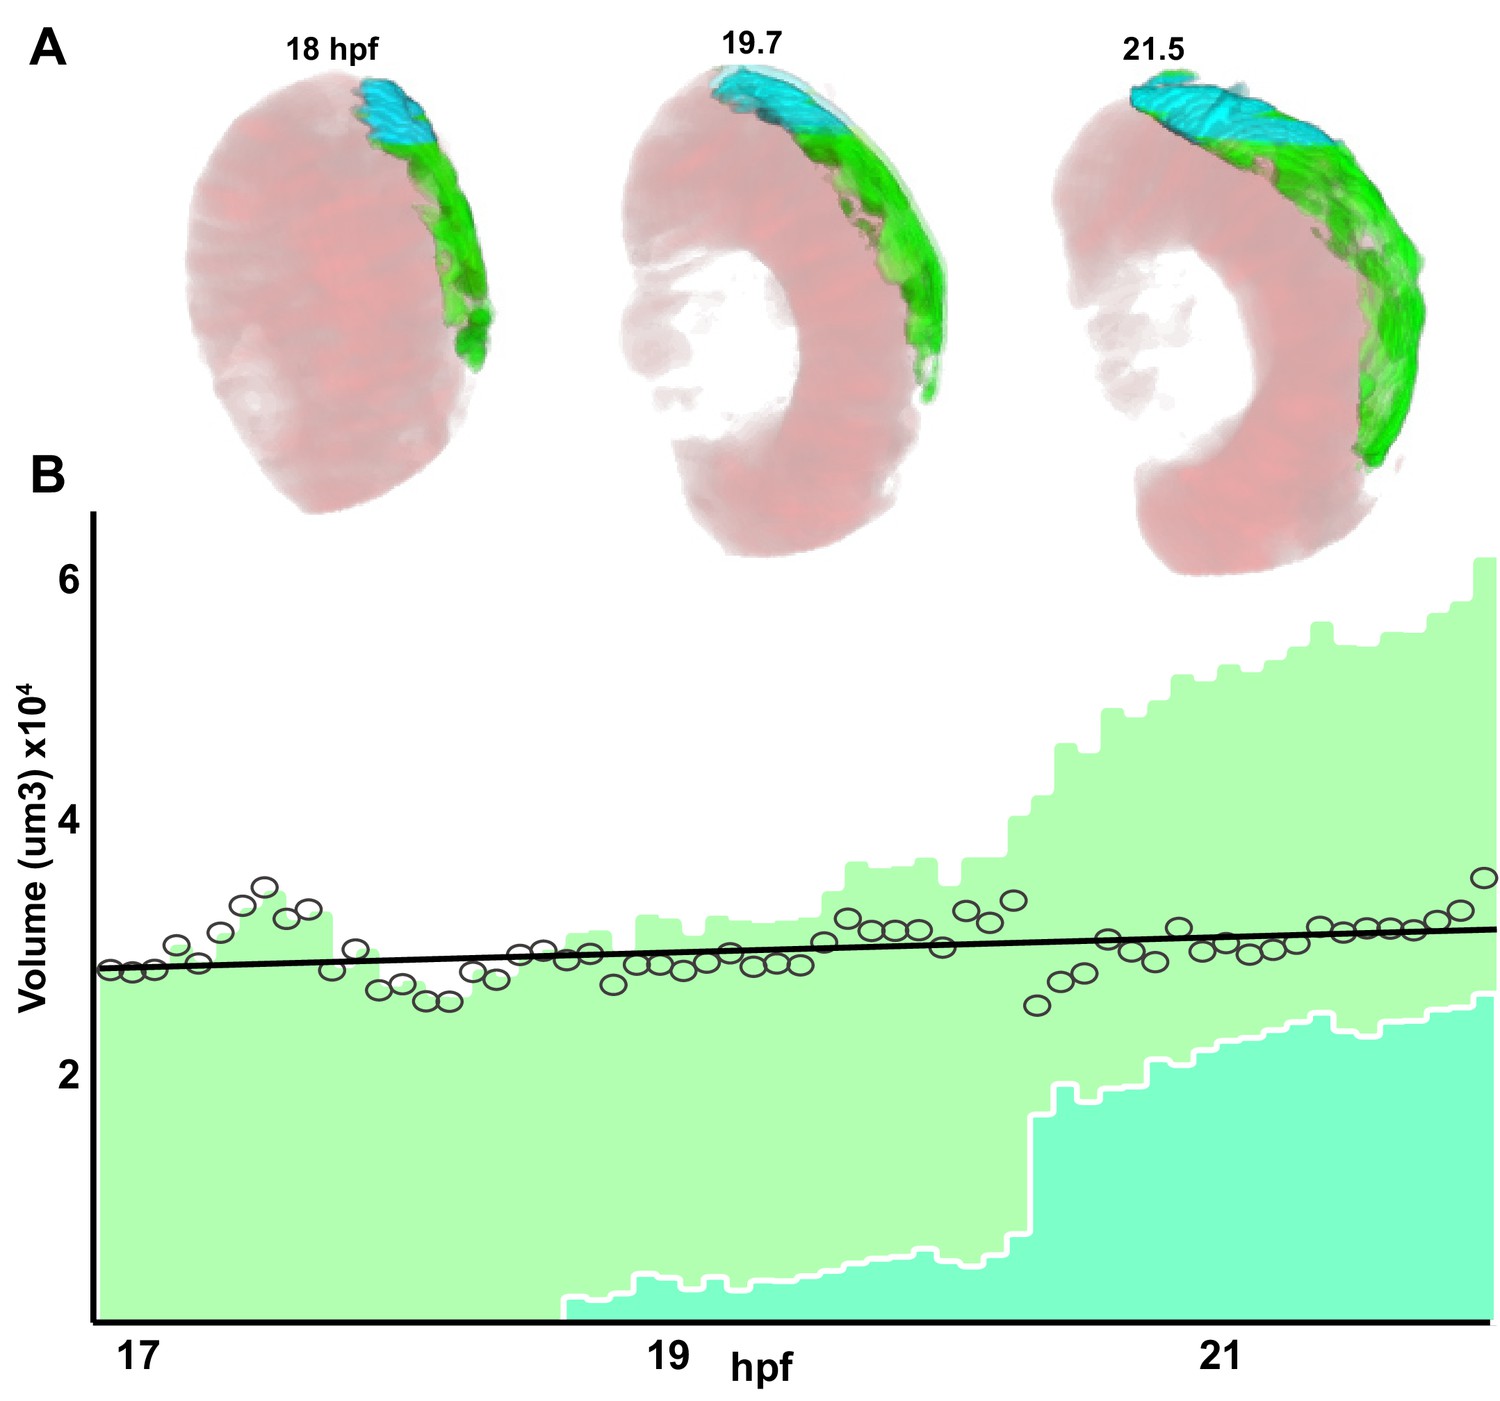
Retinal pigment epithelium (RPE) region selection from the GFP-positive domain.
(A) 3D reconstruction of the frames at 18, 19.7, and 21.5 hpf from Figure 1—video 1. The analysed GFP-positive domain are depicted in green whereas those in turquoise have been excluded when calculating the RPE volume plotted in Figure 3A. The rx3 positive domain is depicted in pink. (B) RPE volume bar plot. Light and dark green colours illustrate the total GFP-positive volume of the central RPE and ciliary marginal zone (CMZ) region, respectively. The dark green region has been excluded to calculate the total volume.
-
Figure 3—figure supplement 1—source data 1
Quantification of RPE volume in space and time.
- https://cdn.elifesciences.org/articles/63396/elife-63396-fig3-figsupp1-data1-v2.xlsx
Figure 3—video 1
Lateral view of optic cup (OC) growth visualized in a Tg(E1-bhlhe40:GFP) embryo injected with H2B-RFP mRNA (magenta), related to Figure 3, frame rate 1/5 min.
Figure 4
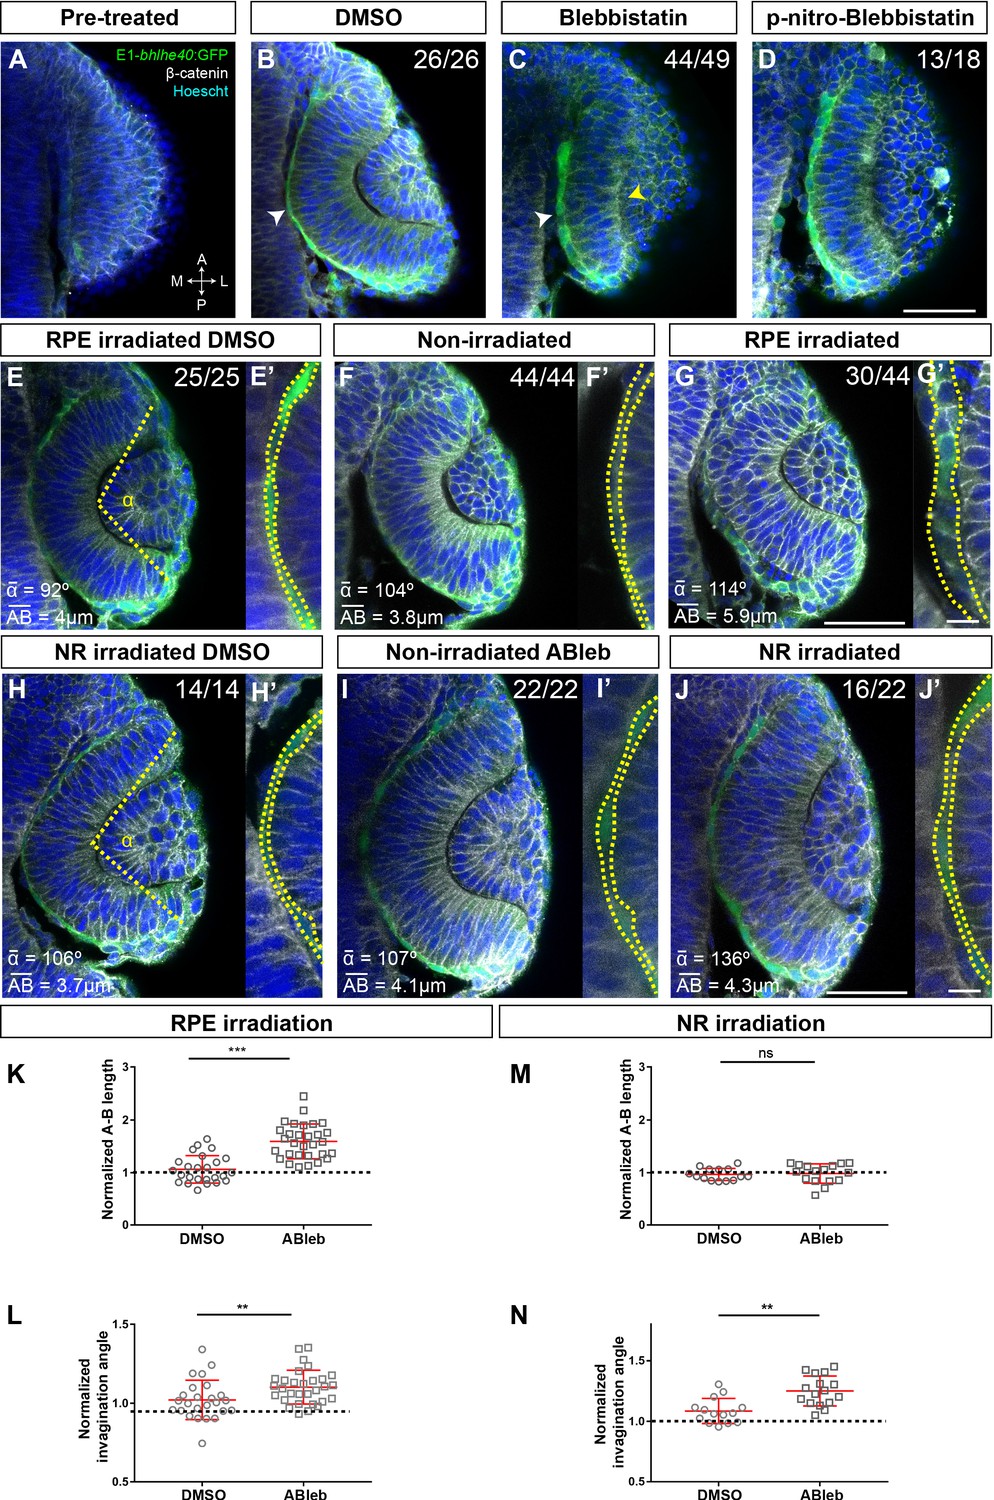
Retinal pigment epithelium (RPE) flattening is a myosin-dependent cell autonomous process required for proper optic vesicle (OV) folding.
(A–J) Confocal images of dorsally viewed Tg(E1-bhlhe40:GFP) embryos before (17 hpf; A) and 2.5 hr after incubation (19.5 hpf) with either DMSO (B, E, H), blebbistatin (C), paranitroblebbistatin (D), or azidoblebbistatin (Ableb) (F, G, I, J) with (G, J) or without irradiation (F, I) in the prospective RPE (F–G) or neural retina (NR) (I–J). Images in E’, F’, G’ H’, I’, and J’ are high power views of RPE morphology. Embryos were immunostained for GFP (green), β-catenin (white), and counterstained with Hoechst (blue). Note that the optic cup (OC) forms and the RPE flattens (white arrowhead in B) normally in all DMSO-treated embryos (B, E, E,’ H, H’) or in embryos incubated in Ableb without irradiation (F, F’, I, I’). In contrast, the RPE remains cuboidal (white arrowhead in C) and NR cells seem not undergo basal constriction (yellow arrowhead in C) in the presence of myosin inhibitors (C, D). Photoactivation of Ableb in the RPE prevents cell flattening (compare E’, F’, with G’) and impairs OV folding (G). When Ableb is photoactivated in the NR, folding of the OV is also impaired (J) but RPE cells undergo flattening (compare H’, I’, with J’). The number of embryos analysed and showing the illustrated phenotype is indicated on the top right corner of each panel and the average invagination angle and mean A–B on the left bottom corner. The yellow dashed line in (E, H) indicates how the invagination angle (α) was determined. (K, M) Normalized RPE height in DMSO- and Ableb-treated embryos, irradiated either in the RPE (K) or in the NR (M). (L, N) Normalized invagination angle in DMSO- and Ableb-treated embryos irradiated either in the RPE (L) or in the NR (N). Data represent mean ± SD; **p < 0.01 and ***p < 0.001. ns, non-significant. Scale bars: 50 µm in A–J and 25 µm in E’–J’.
-
Figure 4—source data 1
Quantification of A-P length and invagination angles reported in Figure 4K–N.
- https://cdn.elifesciences.org/articles/63396/elife-63396-fig4-data1-v2.xlsx
Figure 5 with 2 supplements

Microtubule dynamics is required for retinal pigment epithelium (RPE) cell flattening and optic vesicle (OV) folding.
(A–F) Confocal images of dorsally viewed Tg(E1-bhlhe40:GFP) embryos before (16 hpf A; 17 hpf D) and 2.5 hr after incubation (18.5 hpf B, C; 19.5 hpf E, F) with either DMSO (B, E) or nocodazolef (C, F). Embryos were immunostained for GFP (green, A–F), β-catenin (white, D–F) and counterstained with Hoechst (blue). Note that the optic cup (OC) forms and the RPE flattens (white arrowhead in B, E) normally in DMSO-treated embryos. RPE cells retain a columnar-like morphology in the presence of nocodazole (white arrowhead in C, F). In embryos treated at earlier stage, the neural retina (NR) seems to bend outward (yellow arrowhead in C), whereas some folding occurs when the embryos are treated at later stages (yellow arrowhead in F), although cells seem to accumulate at the hinge (thin white arrowhead, F). The number of embryos analysed and showing the illustrated phenotype is indicated on the top right corner of each panel. (G, H) Confocal images of dorsally viewed rx3:GAL4;UAS;RFP embryos injected with the UAS:GFP (G, n = 7) or UAS:STMN1 (H, n = 7) at one cell stage and fixed at 24 hpf. Embryos were labelled with anti-GFP (green) and counterstained with Hoechst (blue). Note that STMN1 overexpression but not GFP prevents RPE cell flattening and cells retain a cuboidal-like shape (white arrowheads in G–H). The average invagination angle and mean length of the A–B axis are indicated in the bottom left and right angles, respectively. (I, J) The graphs show the length of the A–B axis (I) and the invagination angle (J) in embryos overexpressing GFP or STMN1. Mean ± SD. **p < 0.01. Scale bar: 50 µm.
-
Figure 5—source data 1
Quantification of A-P length and invagination angle of the experimentes reported in Figure 5I,J.
- https://cdn.elifesciences.org/articles/63396/elife-63396-fig5-data1-v2.xlsx
Figure 5—figure supplement 1
EB3-GFP dynamics during retinal pigment epithelium (RPE) cell remodelling.
(A–C) Frames from representative Video 1 showing the orientation of microtubule dynamics in RPE cells with a neuroepithelial (A, continuous acquisition, n = 9), cuboidal (B, continuous acquisition, n = 10), and squamous conformation (C, continuous acquisition, n = 15). Insets provide higher power view of the three images. Scale bar: 25 µm.
Figure 5—figure supplement 2
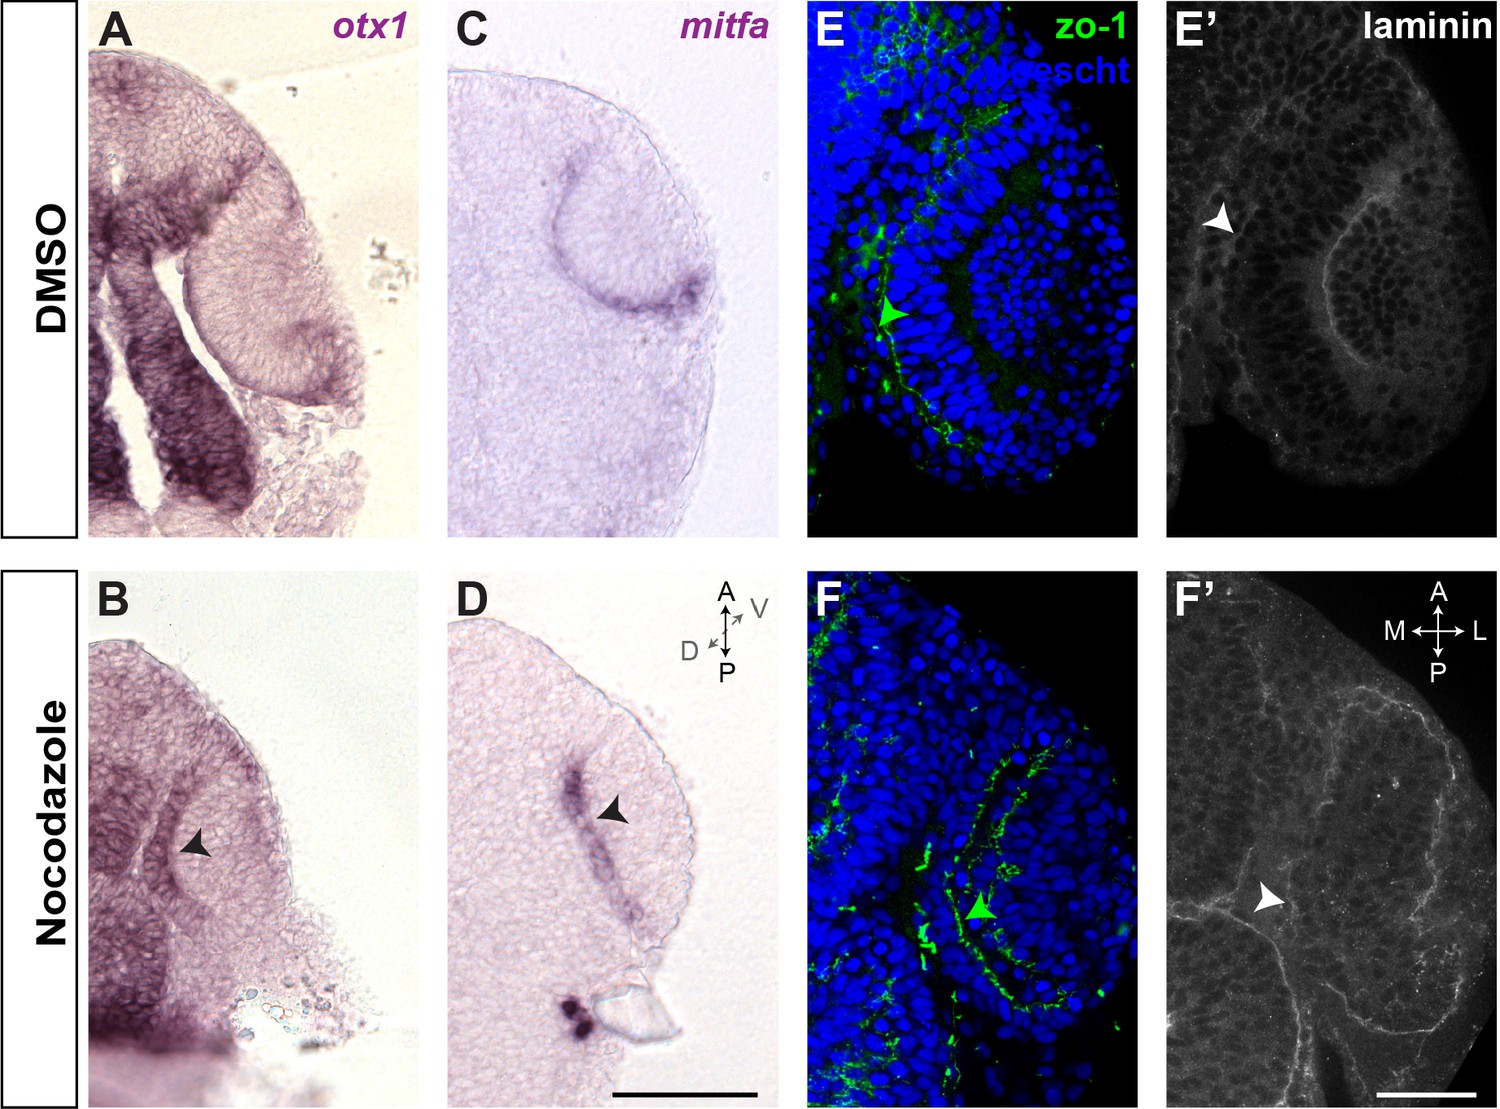
Nocodazole treatment does not alter retinal pigment epithelium (RPE) specification and polarity.
(A) DMSO and (B) nocodazole-treated embryos (2.5 hr incubation from 17 to 19.5 hpf, as reported in Figure 5) hybridized with otx1-specific probe. (C) DMSO or (D) nocodazole-treated embryos with mitfa-specific probe. After nocodazole treatment, both mRNAs are specifically detected in the RPE (black arrowheads) despite its morphogenesis is impaired. (E, E’) Wild-type embryos labelled with laminin (green/basal), zo-1 (white/apical), and Hoechst (blue) after DMSO or (F, F’) nocodazole treatment. In both cases apico-basal polarity is maintained (white and green arrowheads), even after depolymerizing microtubules when RPE cells do not flatten correctly. A–D images are dorsal views of flat-mounted embryos. E–F’ images are frontal sections of one eye. Scale bars: 100 µm in A–D and 50 µm in E–F’.
Figure 6
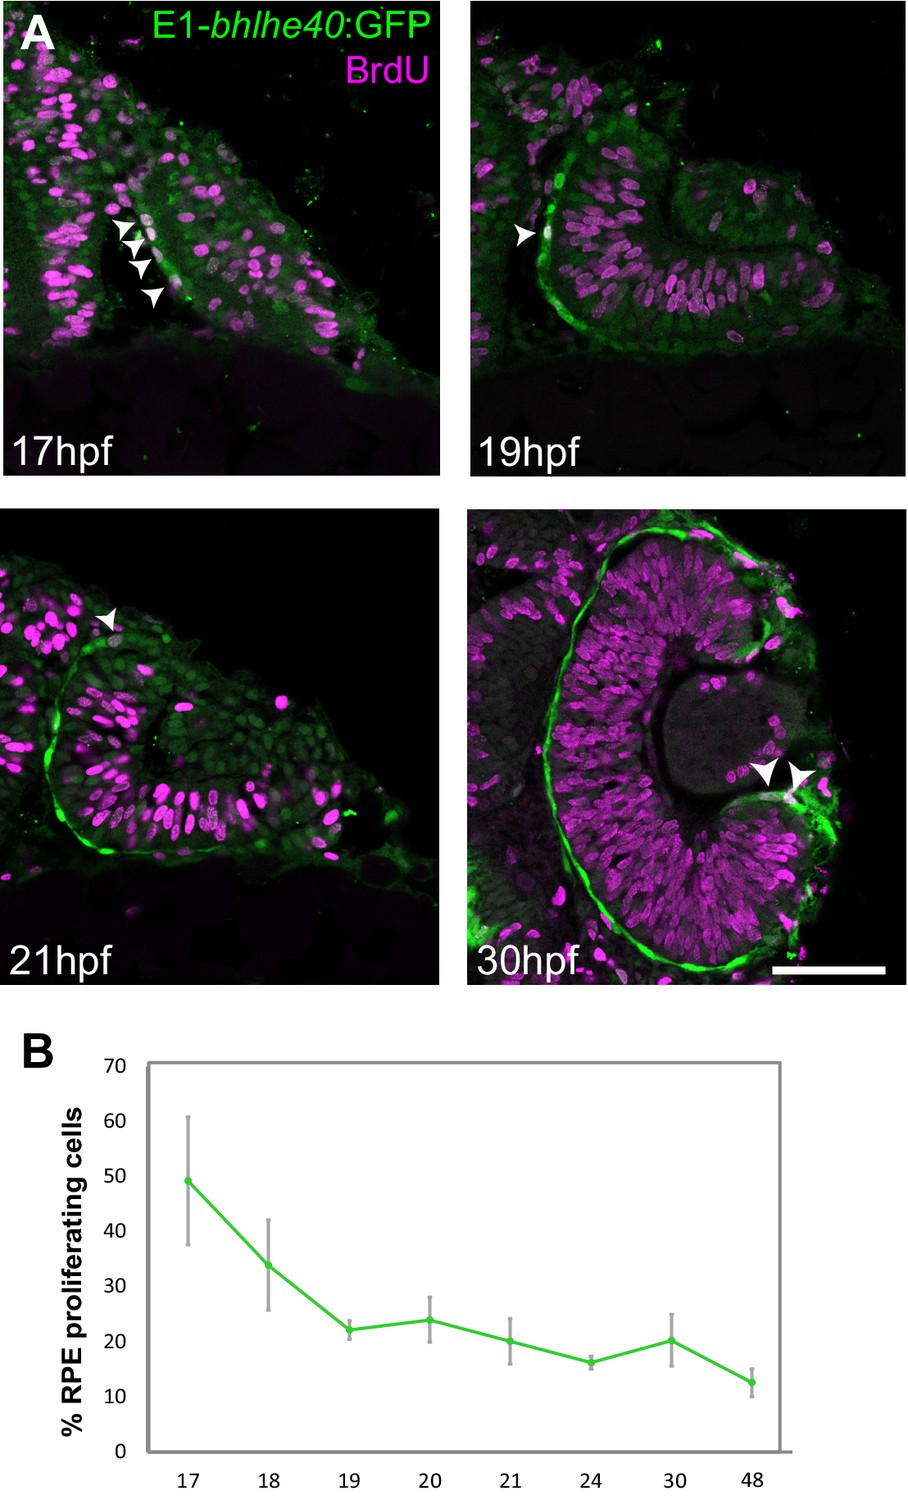
Zebrafish retinal pigment epithelium (RPE) flattening is associated with an abrupt decrease of cell proliferation.
(A) Confocal images of dorsally viewed Tg(E1-bhlhe40:GFP) embryos exposed to 5-bromo-2′-deoxyuridine (BrdU) at different developmental stages as indicated in the panel and immunostained for BrdU (magenta) and GFP (green). (B) Percentage of RPE proliferating cells (BrdU+/total Hoechst +) in 17–48 hpf Tg(E1-bhlhe40:GFP) embryos. Mean ± SD; n = 5 embryos per stage. Scale bar: 100 µm.
-
Figure 6—source data 1
Quantification of the RPE proliferating cells at diffrent developmental stages as reported in Figure 6B.
- https://cdn.elifesciences.org/articles/63396/elife-63396-fig6-data1-v2.xlsx
Figure 7 with 1 supplement
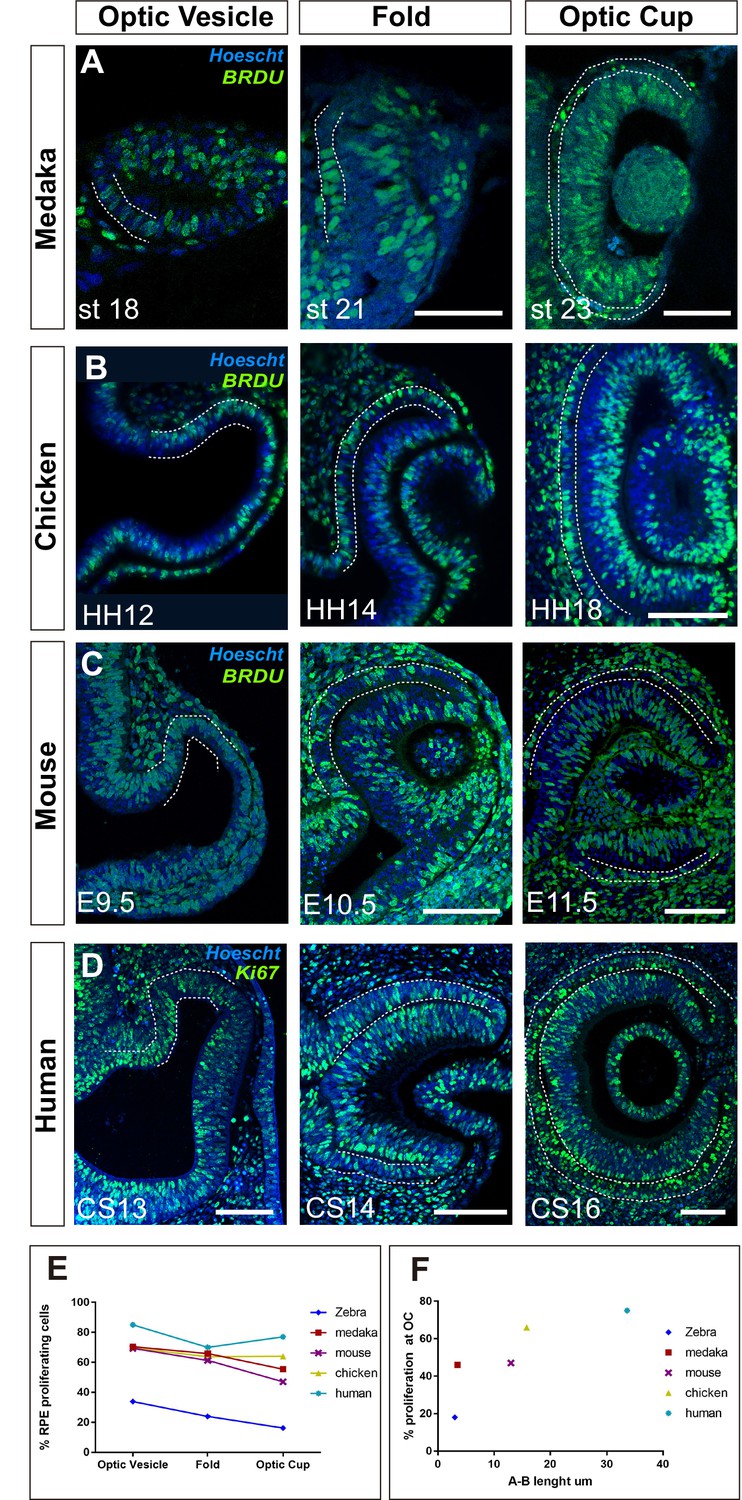
Proliferation accounts for retinal pigment epithelium (RPE) surface increase during amniotes optic vesicle (OV) folding.
(A–C) Confocal images of frontal sections from medaka, chick, and mouse embryos exposed to 5-bromo-2′-deoxyuridine (BrdU) at equivalent stages of OV folding into optic cup (OC), as indicated in the panels. Sections were immunostained for BrdU (green) and counterstained with Hoeschst (blue). In all panels, the prospective RPE has been highlighted with dotted white lines on the basis of the Otx2 immunostaining illustrated in Figure 7—figure supplement 1. (D) Confocal images of horizontal sections from human embryos at equivalent stages of OV folding into OC. Sections were immunostained for Ki67 (green) and counterstained with Hoeschst (blue). (E) Percentage of RPE proliferating cells (BrdU+/total Hoechst+) in the analysed period and compared to those reported in Figure 6B for zebrafish. Data represent mean ± SD; the number of embryos analysed for each stage varied between 3 and 10. (F) Relationship between proliferation rate and apico-basal axis length at OC stage in the different species. Note that there is a positive correlation between the two parameters. Scale bars: 50 µm in A and 100 µm in B–D.
-
Figure 7—source data 1
Data supporting graphs in Figure 7E,F.
- https://cdn.elifesciences.org/articles/63396/elife-63396-fig7-data1-v2.xlsx
Figure 7—figure supplement 1

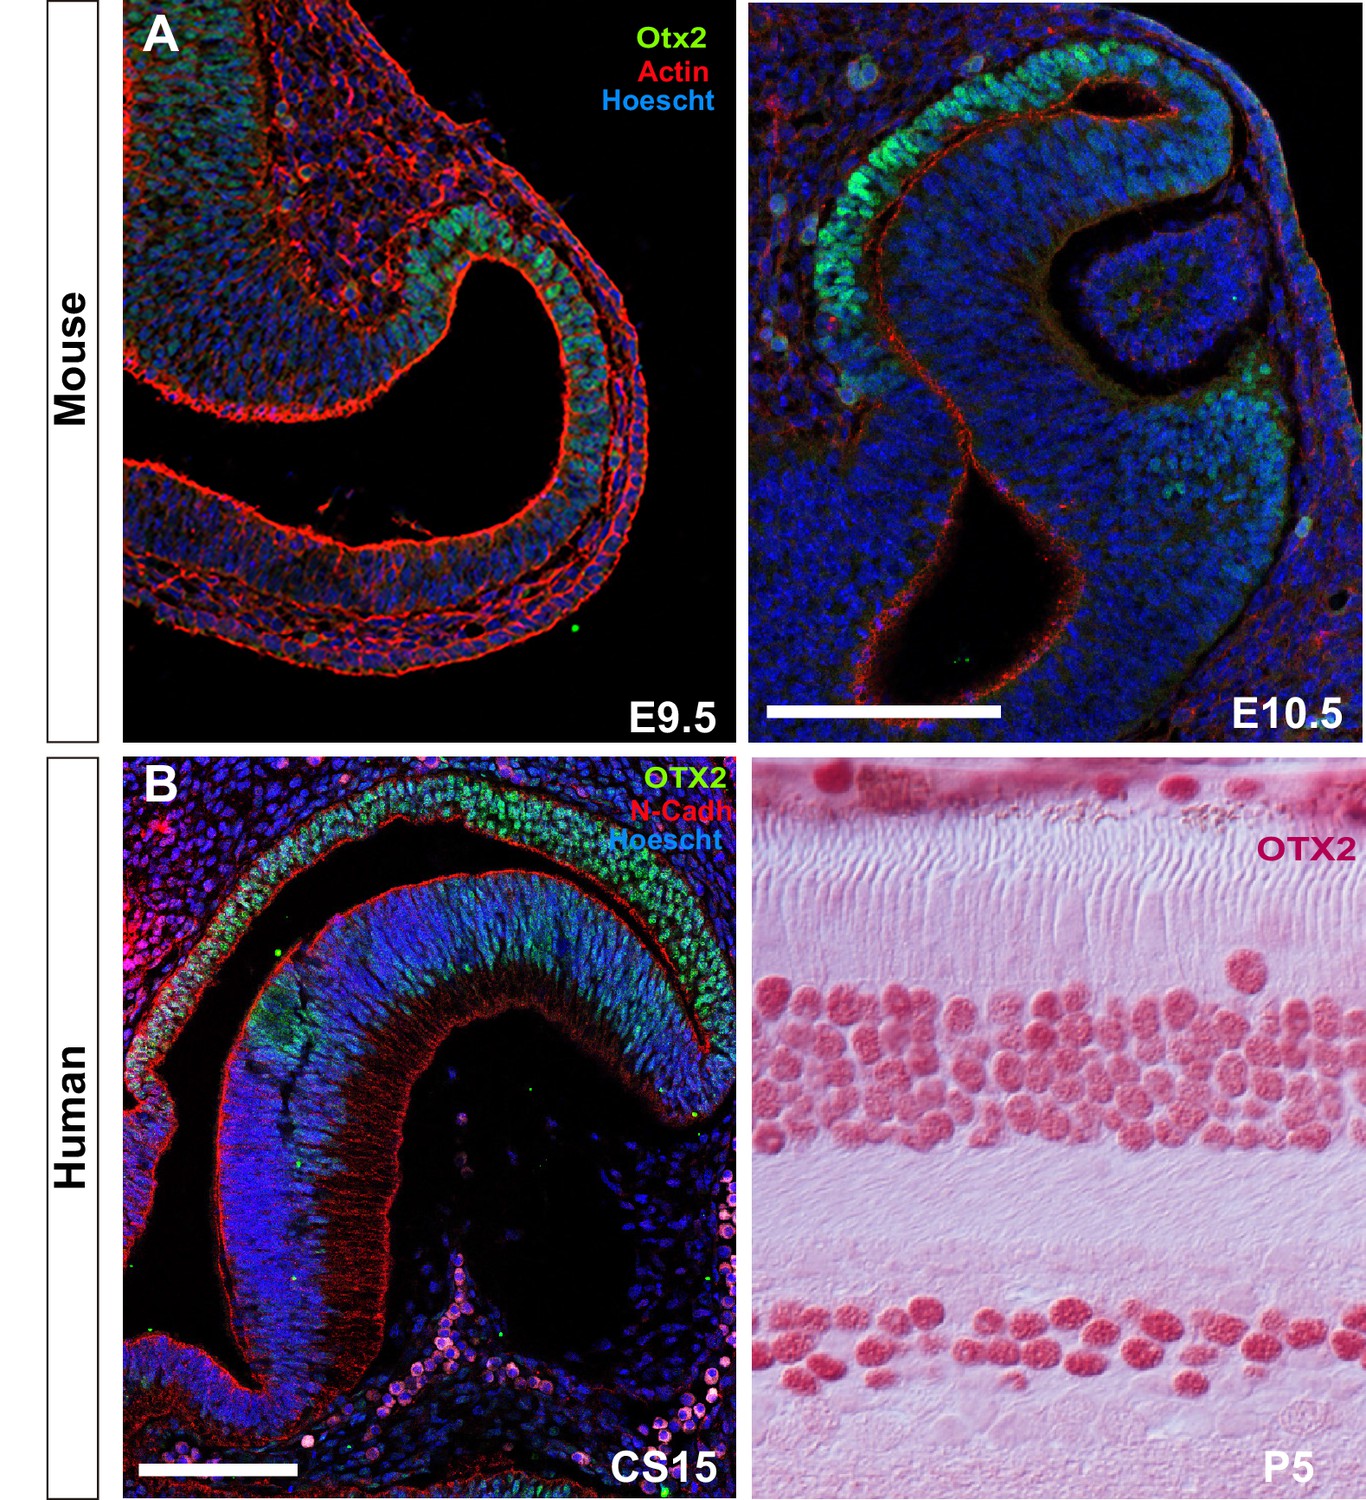
Identification of the RPE domain and RPE cell shape in amniotes.
(A) Confocal images of frontal sections from E9.5 and E10.5 mouse embryos co-immunostained for the RPE-specific marker OTX2 (green) and actin (red). Sections were counterstained with Hoeschst (blue). (B) Confocal images of horizontal sections from human embryos at CS15 and P5. The embryonic sections were immunostained for OTX2 (green) and N-cadherin (red) counterstained with Hoeschst (blue). Postnatal sections were immunostained for OTX2 (red). The distribution of OTX2 was used to define the prospective RPE region whereas actin/N-cadherin distribution was used to identify the apico-basal axis of the cells. Scale bars: 100 µm in A and left B panel; 30 µm in B right panel.
Figure 8

Summary of species-specific modes of retinal pigment epithelium (RPE) differentiation and its contribution to optic vesicle (OV) folding.
(A) The drawing on the top represent the dynamic of OV folding into an optic cup (OC). Green double arrow indicated RPE flattening, blue arrow rim involution whereas pink arrows indicate retinal basal constriction. Bottom row summarizes the alterations in OV folding observed after localized interference with RPE and neural retina (NR) cytoskeleton. (B) Schematic representation of the differential mechanisms by which the RPE in zebrafish (upper row) and in amniotes (lower row) expands its surface during OV folding morphogenesis. In zebrafish, the RPE enlarges its surface by cell stretching; in amniotes, including in humans, the RPE instead expands by cell proliferation with a less pronounced need of cell flattening.
Author response image 1
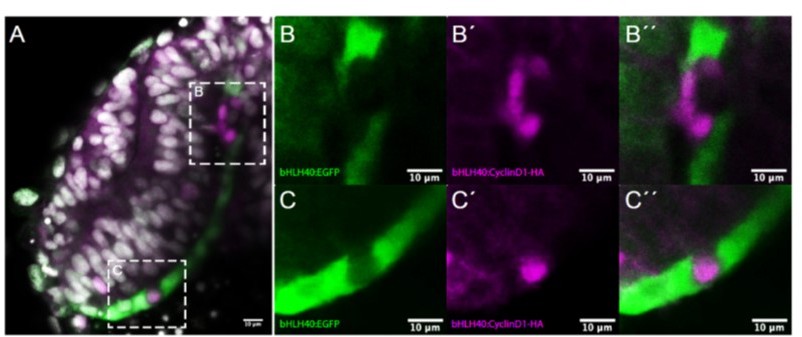
Effects observed after tissue specific overexpression of ccnd1 in the RPE.
(A) Frontal cryostat section of 21 hpf Tg(E1-bhlhe40:GFP) embryo injected with the E1-bhlhe40:ccnd1-HA construct and immunestained for HA (magenta). (B-C’’) High power views of the regions boxed in A. Note the absence of reporter expression (green) in cells that express cyclinD1-HA (B, C). Note also the presence of isolated HA+ cells (C’, C’’) or that of a small HA+ clone that disrupts the flat morphology of the RPE (B’, B’’).
Videos
Video 1
eb3GFP dynamics 14, 17, and 23 hpf, when retinal pigment epithelium (RPE) cells have a neuroepithelial (continuous acquisition, n = 9), cuboidal (continuous acquisition, n = 10), or squamous conformation (continuous acquisition, n = 9).
Tables
Key resources table
| Reagent type (species) or resource | Designation | Source or reference | Identifiers | Additional information |
|---|---|---|---|---|
| Gene (Danio rerio) | bhlhe40 | ENSEMBL | ENSDARG0000004060 | Ref. 28 |
| Strain, strain background (Oryzias latipes) | Wild-type, adult cab strain | CBMSO fish room | NBRP Medaka (https://shigen.nig.ac.jp/medaka/) | |
| Strain, strain background (Mus musculus) | Wild-type BALB/c | CBMSO animal facility | https://www.jax.org/jax-mice-and-services | |
| Strain, strain background (Danio rerio) | Adult wild-type AB/tupl strain | CBMSO fish room | ZIRC (https://zebrafish.org/home/guide.ph) | |
| Genetic reagent (Danio rerio) | Tg(E1-bhlhe40:GFP) | Transgenic line generated in this study | Details in Materials and methods, ‘Generation of the Tg(E1-bhlhe40:GFP) line’ section | |
| Genetic reagent (Danio rerio) | Tg(rx3:Gal4-VP16;UAS:GFP) | PMID:22819672 | ZFIN Cat# ZDB-GENO-121105-83, RRID:ZFIN_ZDB-GENO-121105-83 | Ref. 48 |
| Biological sample (Homo sapiens) | Paraffin sections of human embryonic eye primordia | Human Dev. Biology Resource (http://www.hdbr.org/) | ||
| Recombinant DNA reagent | ZED vector | PMID:19653328 | Ref. 31 | |
| Recombinant DNA reagent | Bidirectional UAS:GFP | PMID:19363289 | Ref. 45 | |
| Recombinant DNA reagent | pQTEV-STMN1 | Addgene# 31326 | RRID:Addgene_31326 | |
| Recombinant DNA reagent | UAS: STMN1 | Construct generated in this study | Details in Materials and methods, ‘Gal4-UAS-mediated expression’ | |
| Recombinant DNA reagent | pCS2-Kaede | PMID:17406330 | Ref. 34 | |
| Recombinant DNA reagent | pCS2-H2b-mRFP | Addgene# 53745 | RRID:Addgene_53745 | |
| Recombinant DNA reagent | pCS2-EB3-GFP | PMID:12684451 | Ref. 43 | |
| Antibody | Anti-BrdU (mouse) | Becton-Dickinson | IF(1:200), | |
| Antibody | Anti-GFP (chicken polyclonal) | Abcam | Cat# ab13970, RRID:AB_300798 | IF(1:2000) |
| Antibody | Anti-βcatenin (mouse monoclonal) | BD Transduction Laboratories | Cat# 610153, RRID:AB_397554 | IF(1:400) |
| Antibody | Anti-ZO1 (rabbit monoclonal) | Invitrogen | IF(1:400) | |
| Antibody | Anti-laminin (rabbit polyclonal) | Sigma | Cat# L9393, RRID:AB_477163 | IF(1:200) |
| Antibody | Anti-otx2 (rabbit polyclonal) | Abcam | Cat# ab76748, RRID:AB_1524130 | IF(1:1000) |
| Antibody | Anti-Ki67 (rabbit polyclonal) | Abcam | Cat# ab15580, RRID:AB_443209 | IF(1:500) |
| Commercial assay or kit | GatewayTM LR ClonaseTM Enzyme Mix | Invitrogen | 11791019 | |
| Commercial assay or kit | pCR8/GW/TOPO TA Cloning Kit | Invitrogen | K250020 | |
| Commercial assay or kit | mMessage mMachine SP6 transcription kit | Invitrogen | AM1340 | |
| Commercial assay or kit | NucleoSpin RNA Clean-up kit | Macherey Nagel | 740948.50 | |
| Chemical compound, drug | Blebbistatin | Calbiochem | Blebbistatin-CAS674289-55-5- Calbioche, | 100 µM |
| Chemical compound, drug | Paranitroblebbistatin | Optopharma | DR-N-111 | 20 µM |
| Chemical compound, drug | Azidoblebbistatin | Optopharma | DR-A-081 | 5 µM |
| Chemical compound, drug | Nocodazole | Sigma | M1404 | 10 ng/µl |
| Chemical compound, drug | BrdU | Roche | B23151 | 5 mg/ml |
| Software, algorithm | SPSS | CSIC bioinformatic resources | RRID:SCR_002865 | IBM (https://www.ibm.com/uk-en/products/spss-statistics) |
| Software, algorithm | MATLAB | CSIC bioinformatic resources | RRID:SCR_001622 | MathWorks (https://www.mathworks.com/products/get-matlab.htm) |
| Other | DAPI stain | Invitrogen | D1306 |
Additional files
-
Transparent reporting form
- https://cdn.elifesciences.org/articles/63396/elife-63396-transrepform1-v2.docx
-
Supplementary file 1
List of primers used in this study.
- https://cdn.elifesciences.org/articles/63396/elife-63396-supp1-v2.docx
Download links
A two-part list of links to download the article, or parts of the article, in various formats.
Downloads (link to download the article as PDF)
Open citations (links to open the citations from this article in various online reference manager services)
Cite this article (links to download the citations from this article in formats compatible with various reference manager tools)
Stretching of the retinal pigment epithelium contributes to zebrafish optic cup morphogenesis
eLife 10:e63396.
https://doi.org/10.7554/eLife.63396


