Respiratory depression and analgesia by opioid drugs in freely behaving larval zebrafish
- Keenan Research Centre for Biomedical Sciences. St. Michael’s Hospital Unity Health Toronto, Canada
- Department of Medicine, Faculty of Medicine, University of Toronto, Canada
Figures
Figure 1
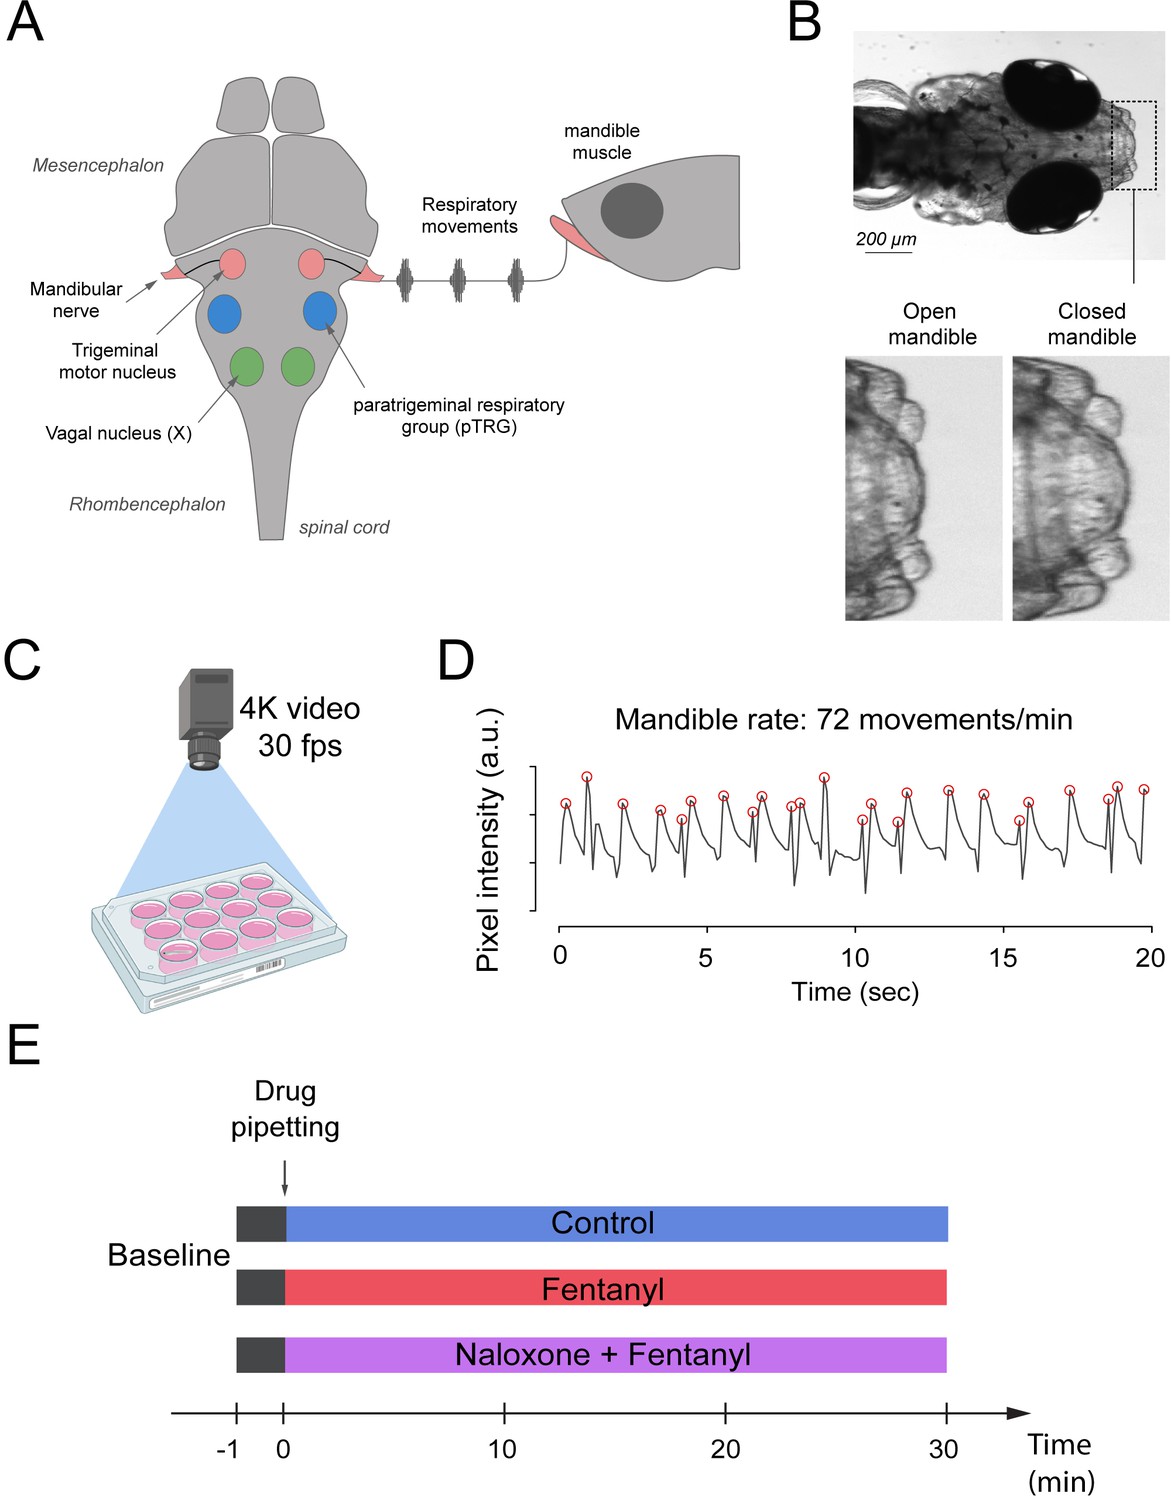
Respiratory network activity quantified using mandible movements in freely-moving larval zebrafish.
(A) The brainstem respiratory network of the larval zebrafish produces respiratory mandible movements. (B) Respiratory mandible movements are used as an index of respiratory network activity. (C) Mandible movements were quantified by looking at the pixel changes in the region of the mandible using a 4K high-definition camera. (D) Respiratory rate was quantified in 12–14 day post-fertilization larvae positioned in 12-well plates. Red circles indicate peaks of mandible movements. (E) To quantify respiratory rate depression induced by opioid drugs, fish were exposed to a drug treatment containing embryo medium only (control), fentanyl, or a combination of naloxone and fentanyl.
Figure 2
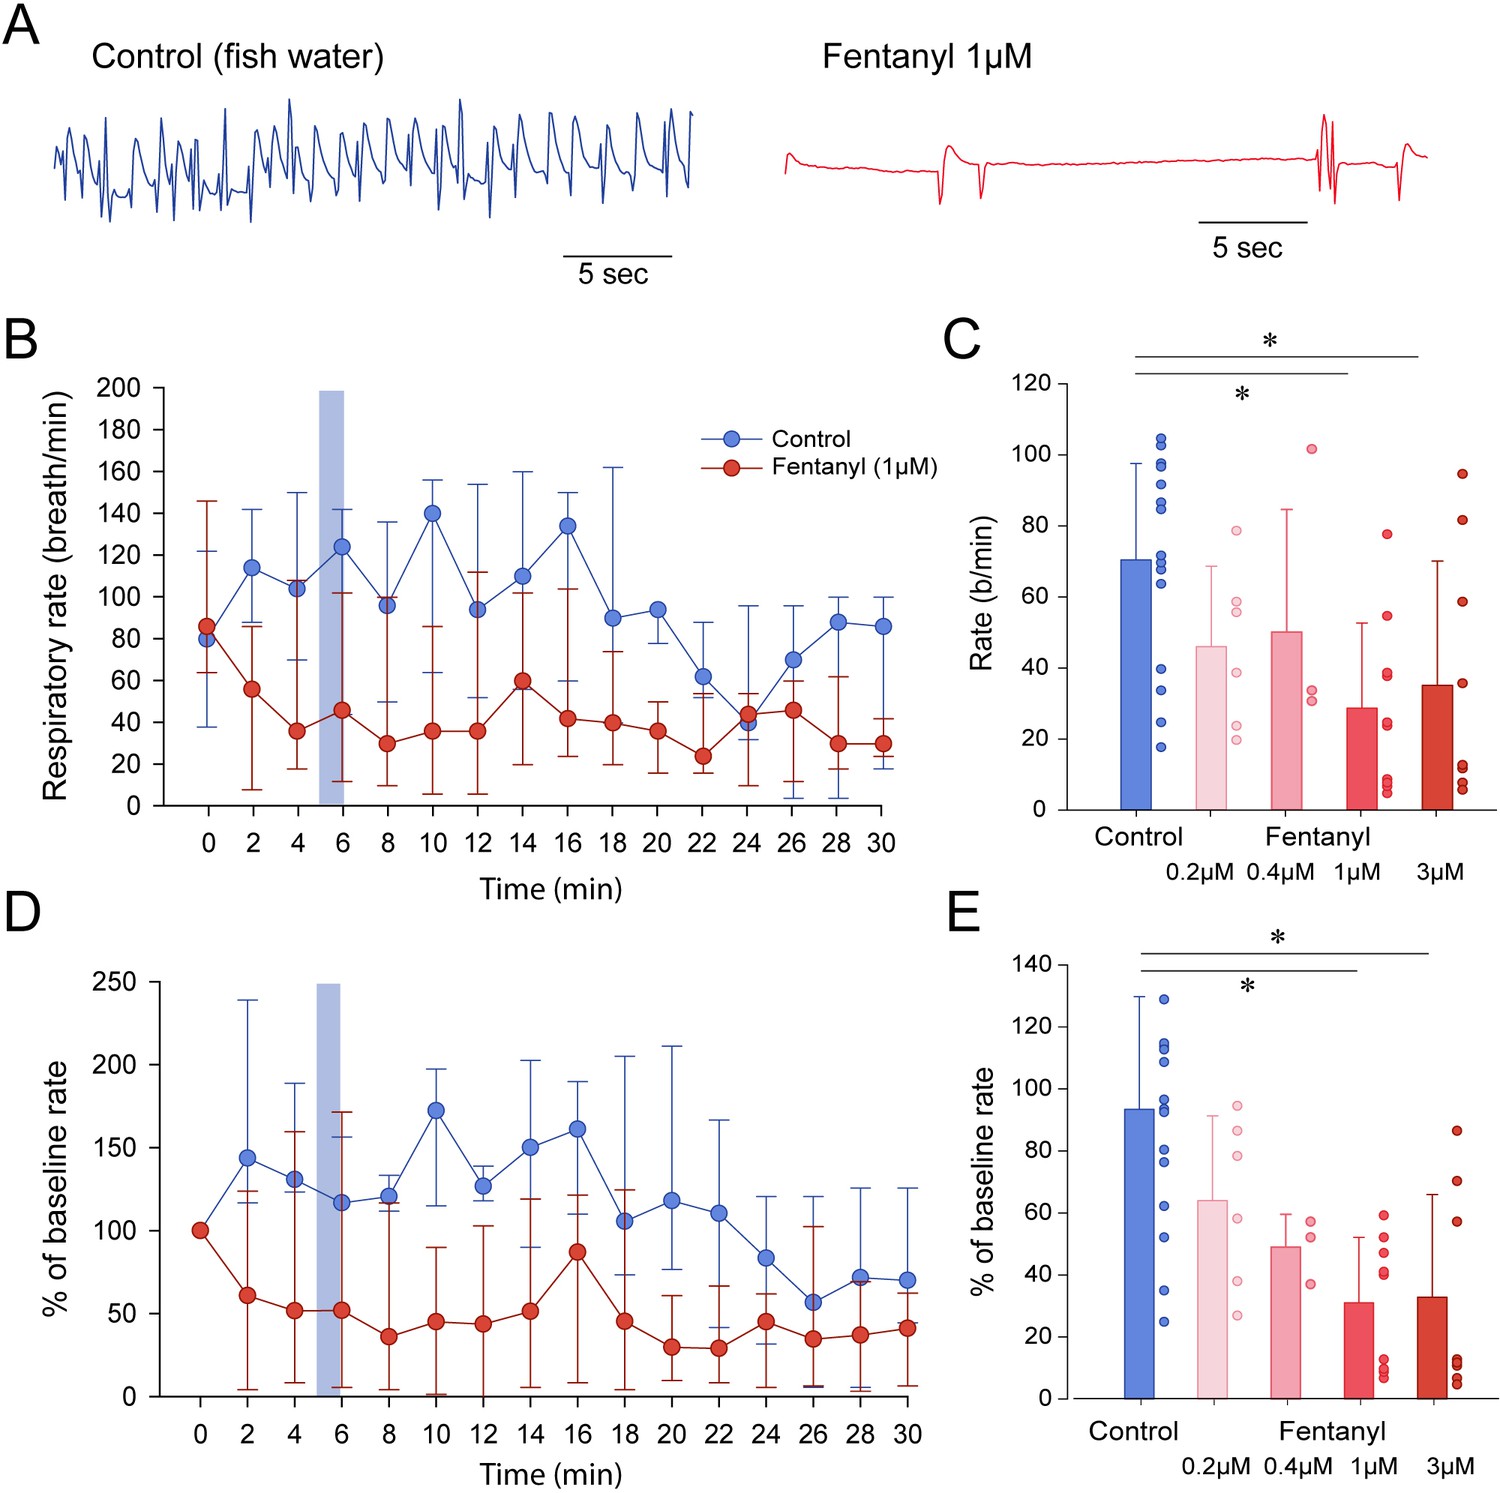
Respiratory rate depression by the opioid analgesic fentanyl in larval zebrafish.
(A) Representative mandible movements in larvae exposed to embryo medium or a solution of fentanyl (1 µM). The rate of mandible movements was significantly decreased by fentanyl. (B) Larvae were exposed to fentanyl over a period of 30 min. Significant respiratory rate depression was observed within 4 min following fentanyl application. Respiratory rate data did not follow a normal distribution and data are presented as medians with bars representing interquartile range. (C) Increasing the concentration of fentanyl induced dose-dependent decreases in respiratory rate. Fentanyl produced significant decreases in respiratory rate at 1 µM (n = 9) and 3 µM (n = 8), but not at 0.2 µM (n = 6) and 0.4 µM (n = 3) compared to controls (n = 17). (D) Rates of mandible movements were not normally distributed due to the high variability in respiratory rates. To present more homogenous data, respiratory rates were normalized according to the baseline rate measured before drugs were applied to better represent how drug exposure changed rate. (E) Fentanyl produced significant decreases in respiratory rate at 1 µM and 3 µM, but not at 0.2 µM and 0.4 µM compared to controls. Shading indicates time periods used to calculate average data in panel C and E. In panels B and C, data were presented as medians ± 75th and 25th percentile. In panels D and E, data were presented as means ± standard deviations. Circles indicate individual data points for each zebrafish measured. * indicate significantly different medians compared to control with p<0.05. Source data can be found in Figure 2—source data 1.
-
Figure 2—source data 1
Respiratory rate depression by the opioid analgesic fentanyl.
- https://cdn.elifesciences.org/articles/63407/elife-63407-fig2-data1-v2.xlsx
Figure 3

Opioid receptor pharmacology regulating respiratory depression in larval zebrafish.
(A) Representative tracings of mandible movements in larval zebrafish showing fentanyl (1 µM) reducing respiratory rate and reversal by the MOR antagonist naloxone (20 µM). (B) Fentanyl (1 µM) significantly decreased rate of mandible movements (n = 9) compared to the control group (n = 10), an effect significantly reversed by the MOR antagonist naloxone (20 µM, n = 7) but not the highly selective MOR antagonist CTAP (4 µM, n = 9). (C) CTAP and naloxone administered alone did not affect respiratory rate. (D) Fentanyl depressed respiratory rate (n = 7), an effect reversed by subsequent addition of naloxone (9 µM). (E) Respiratory rate depression due to fentanyl was observed in the AB strain (n = 9), but not in TU (n = 9) or crosses between AB x TU (n = 7). (F) Morphine did not induce a dose-dependent decrease in respiratory rate compared to controls but showed a significant decrease at 1 µM. * indicates significantly different medians compared to control with p<0.05. Normalized data are presented as means ± standard deviations. Circles indicate individual data points for each zebrafish measured. AB, AB zebrafish line. TU, Tübingen zebrafish line. Source data can be found in Figure 3—source data 1.
-
Figure 3—source data 1
Opioid receptor pharmacology regulating respiratory depression.
- https://cdn.elifesciences.org/articles/63407/elife-63407-fig3-data1-v2.xlsx
Figure 4
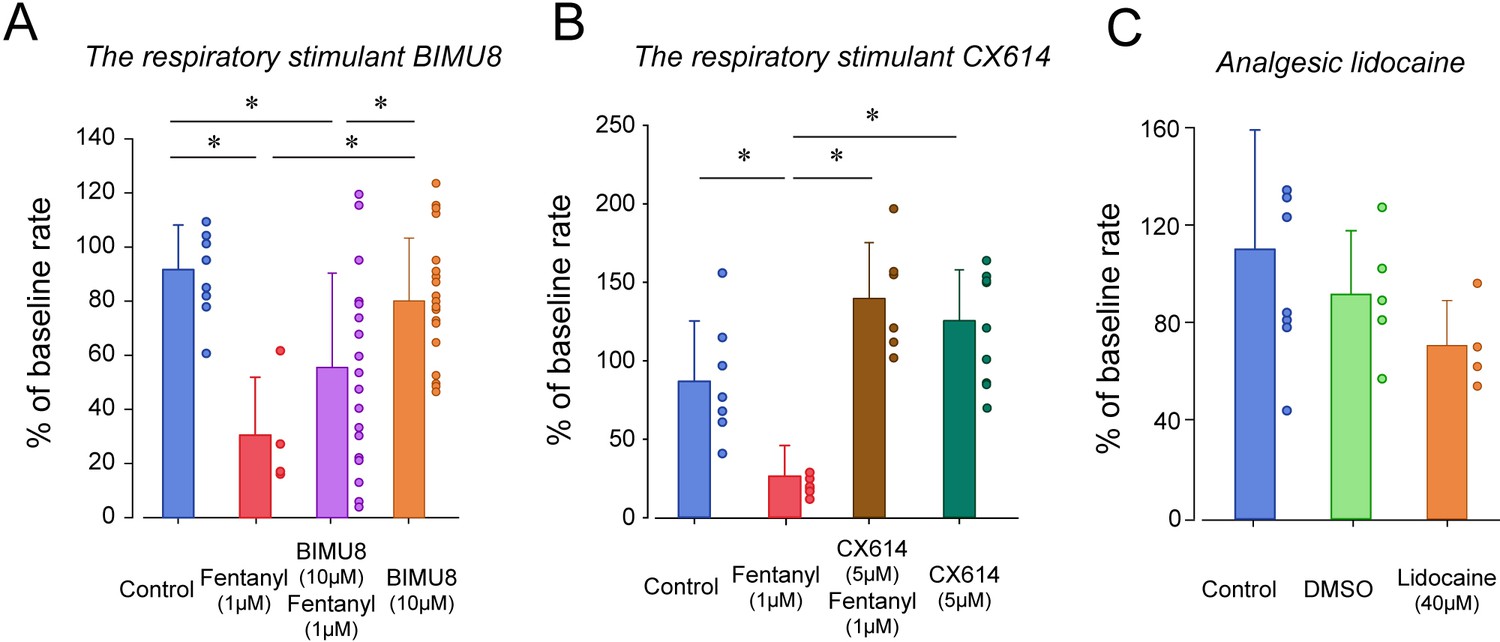
Respiratory depression and respiratory stimulants in larval zebrafish.
(A) The respiratory stimulant BIMU8 (10 µM), a 5-HT4A serotonin receptor agonist, in combination with fentanyl (n = 20) was compared to fentanyl alone (n = 4) or BIMU8 alone (n = 21). BIMU8 was not sufficient to reverse respiratory depression by fentanyl. (B) The AMPA positive allosteric modulator CX614 (5 µM) and fentanyl (n = 6) were also compared to fentanyl alone (n = 7) or control (n = 7). CX614 + fentanyl group showed significantly higher respiratory rate than fentanyl, DMSO, and control. (C) The analgesic lidocaine (n = 4) was compared to DMSO (0.0016%) (n = 5) and control (n = 5) and showed lower respiratory rate than the control group. Normalized data are presented as means ± standard deviations. Circles indicate individual data points for each zebrafish measured. Black lines and * indicate groups significantly different with p<0.05. Source data can be found in Figure 4—source data 1.
-
Figure 4—source data 1
Respiratory depression and respiratory stimulants.
- https://cdn.elifesciences.org/articles/63407/elife-63407-fig4-data1-v2.xlsx
Figure 5 with 1 supplement
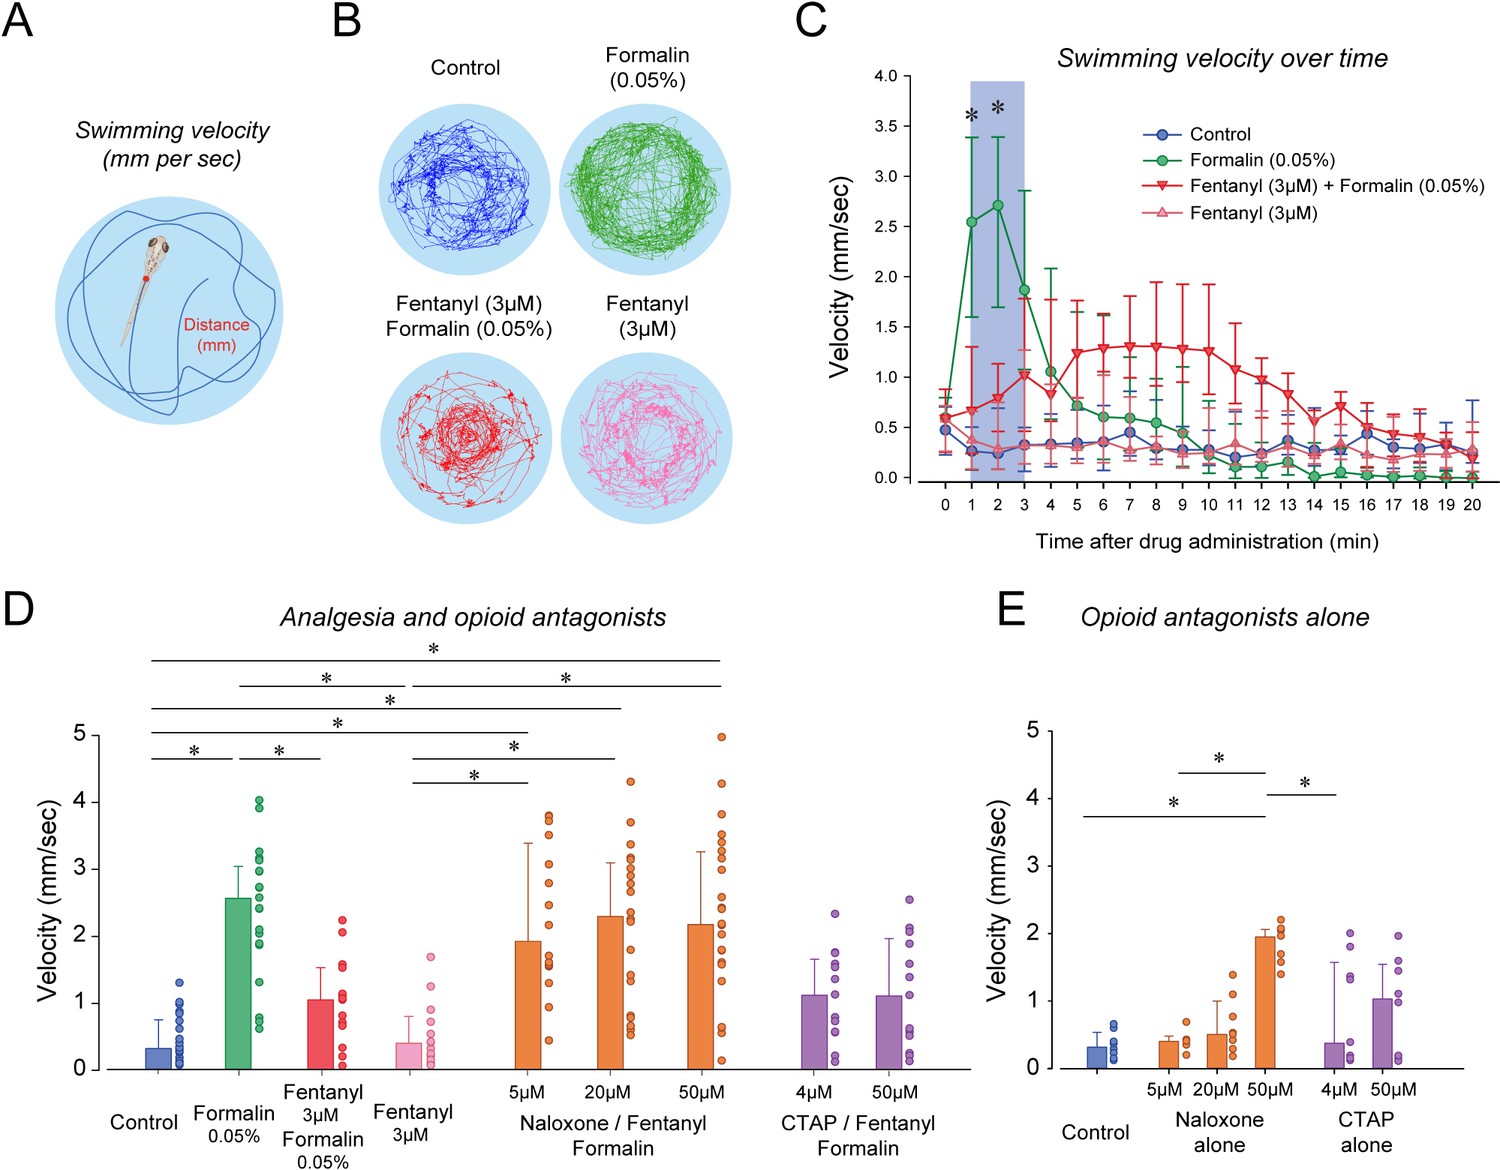
Nociception by formalin and analgesia by fentanyl in larval zebrafish.
(A) As an index of nociception in larval zebrafish, we measured behavioral responses to the nociceptive stimulus formalin. We quantified swimming velocity in freely-moving larvae. Swimming velocity was quantified as the distance swam per second. (B) Control fish swam at a velocity ranging from 0.1 to 1.3 mm/sec, whereas swimming velocity was increased to 0.7–4.1 mm/sec with formalin. Addition of fentanyl reduced swimming velocity to 0.1–2.3 mm/s. (C) Following exposure to embryo medium only, formalin, or formalin/fentanyl, swimming velocity was strongly increased by formalin within 3 min and was only moderately increased by fentanyl and formalin compared to controls. (D) In separate groups of fish, comparison of averaged velocities for the first 3 min (shaded blue) after baseline (time = 0) showed that formalin (n = 21) significantly increased velocity compared to the control (n = 22), whereas fentanyl (n = 13) reduced the formalin response. Naloxone or CTAP did not block the effect of fentanyl at various concentrations. (E) Naloxone alone increased velocity at 50 µM, but not at 5 and 20 µM. CTAP alone did not increase velocity by itself. Data are presented as medians with error bars showing 25th and 75th percentile or interquartile range. Circles indicate individual data points for each zebrafish. * indicates groups significantly different with p<0.05. Source data can be found in Figure 5—source data 1.
-
Figure 5—source data 1
Nociception by formalin and analgesia by fentanyl.
- https://cdn.elifesciences.org/articles/63407/elife-63407-fig5-data1-v2.xlsx
Figure 5—figure supplement 1
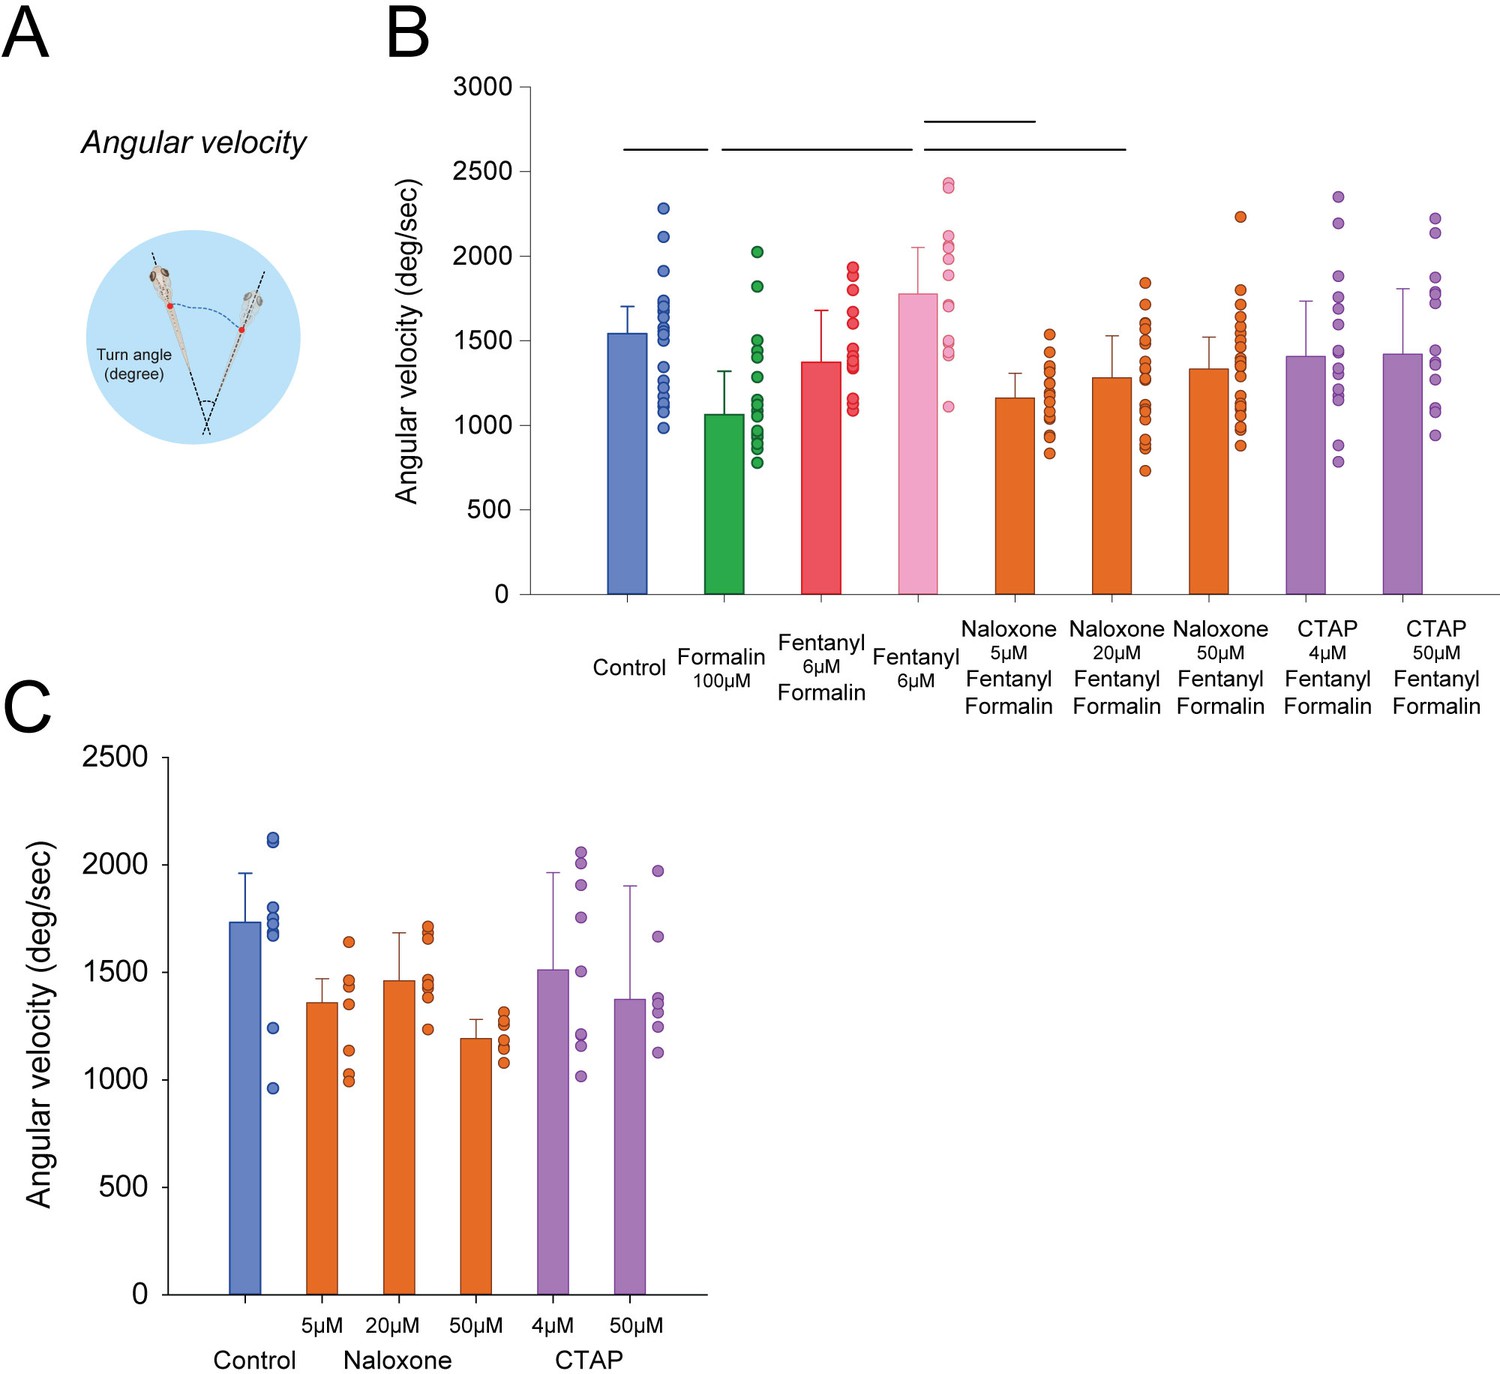
Angular velocity in response to formalin and opioid drugs.
(A) Angular velocity is calculated as the number of degrees by unit of time. (B) Formalin reduced angular velocity (n = 21, p=0.011) compared to controls (n = 22), an effect not reversed by fentanyl (n = 12, p=0.151). Naloxone at 5, 20 and 50 µM (n = 16, 20, and 23 respectively) or CTAP at 4 and 50 µM (n = 15 and 13) had no effects on fentanyl/formalin combination (p>0.05). (C) Naloxone or CTAP administered alone had no effect on angular velocity. Data are presented as medians ± 75% and 25% percentiles. Black bars represent medians significantly different with p<0.05. Source data can be found in Figure 5—source data 1.
Figure 6 with 1 supplement
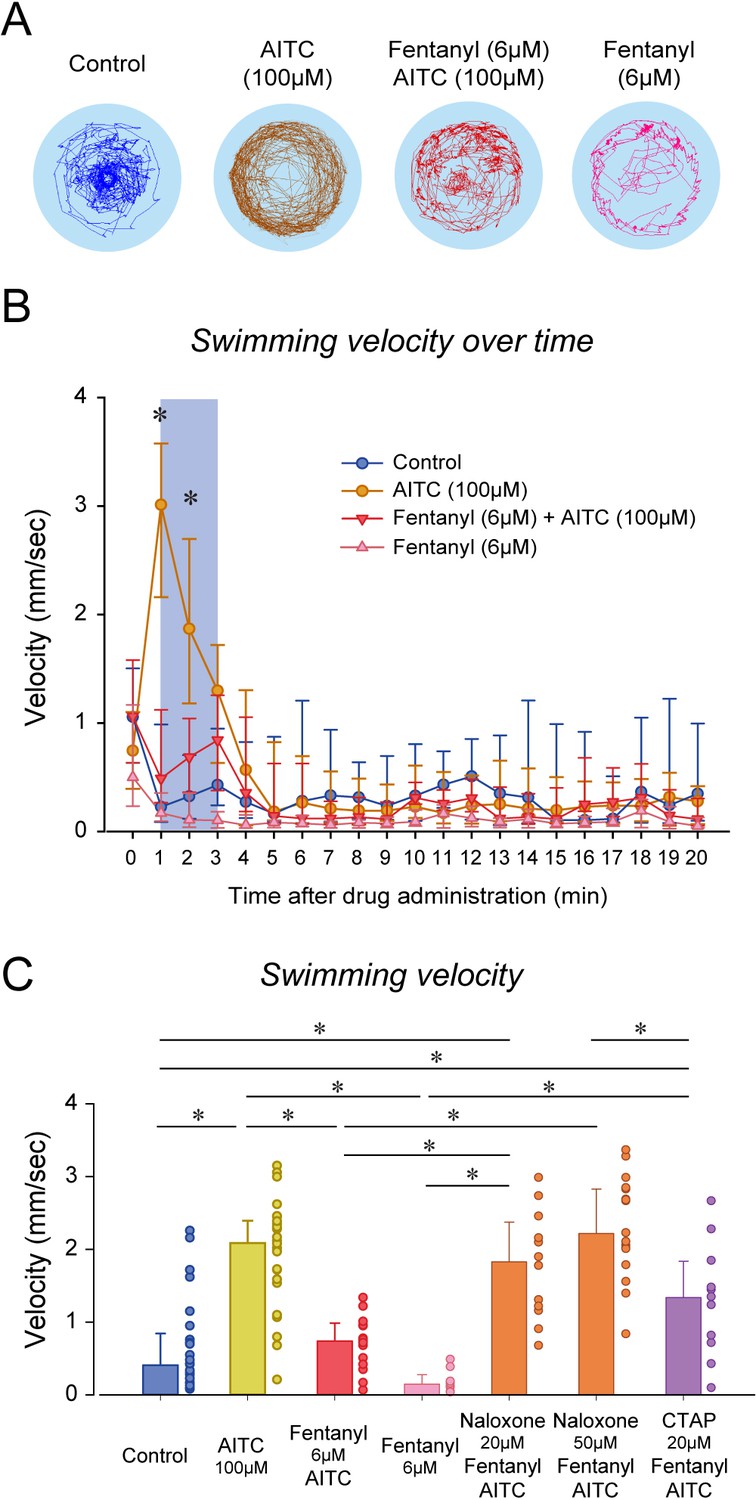
Nociception by AITC and analgesia by fentanyl in larval zebrafish.
(A) As an index of nociception in larval zebrafish, we measured behavioral responses to the nociceptive stimulus AITC. We quantified swimming in freely-moving larvae. Swimming velocity was higher in zebrafish exposed to AITC (100 µM) compared to controls. (B) In fish exposed to fentanyl (6 µM) combined with AITC, swimming velocity was lower than in fish exposed to AITC alone. Larvae exposed to AITC showed an initial increase in velocity during the first 3 min of the recording, whereas larvae with AITC and fentanyl did not show a significant increase during the initial minutes. (C) Comparison of averaged velocities for the first 3 min (shaded blue in Bb) after baseline (time = 0) showed that AITC (n = 26) significantly increased velocity compared to the control (n = 26), whereas fentanyl (n = 9) reduced the formalin response. Fentanyl alone did not significantly affect swimming velocity. Naloxone blocked the effect of fentanyl at 20 µM (n = 12) and 50 µM (n = 17). CTAP did not block the effect of fentanyl on nociception (n = 11). All data are presented as medians with error bars showing 25th and 75th percentile or interquartile range. Circles indicate individual data points for each zebrafish measured. * indicates groups significantly different with p<0.05. Source data can be found in Figure 6—source data 1.
-
Figure 6—source data 1
Nociception by AITC and analgesia by fentanyl.
- https://cdn.elifesciences.org/articles/63407/elife-63407-fig6-data1-v2.xlsx
Figure 6—figure supplement 1
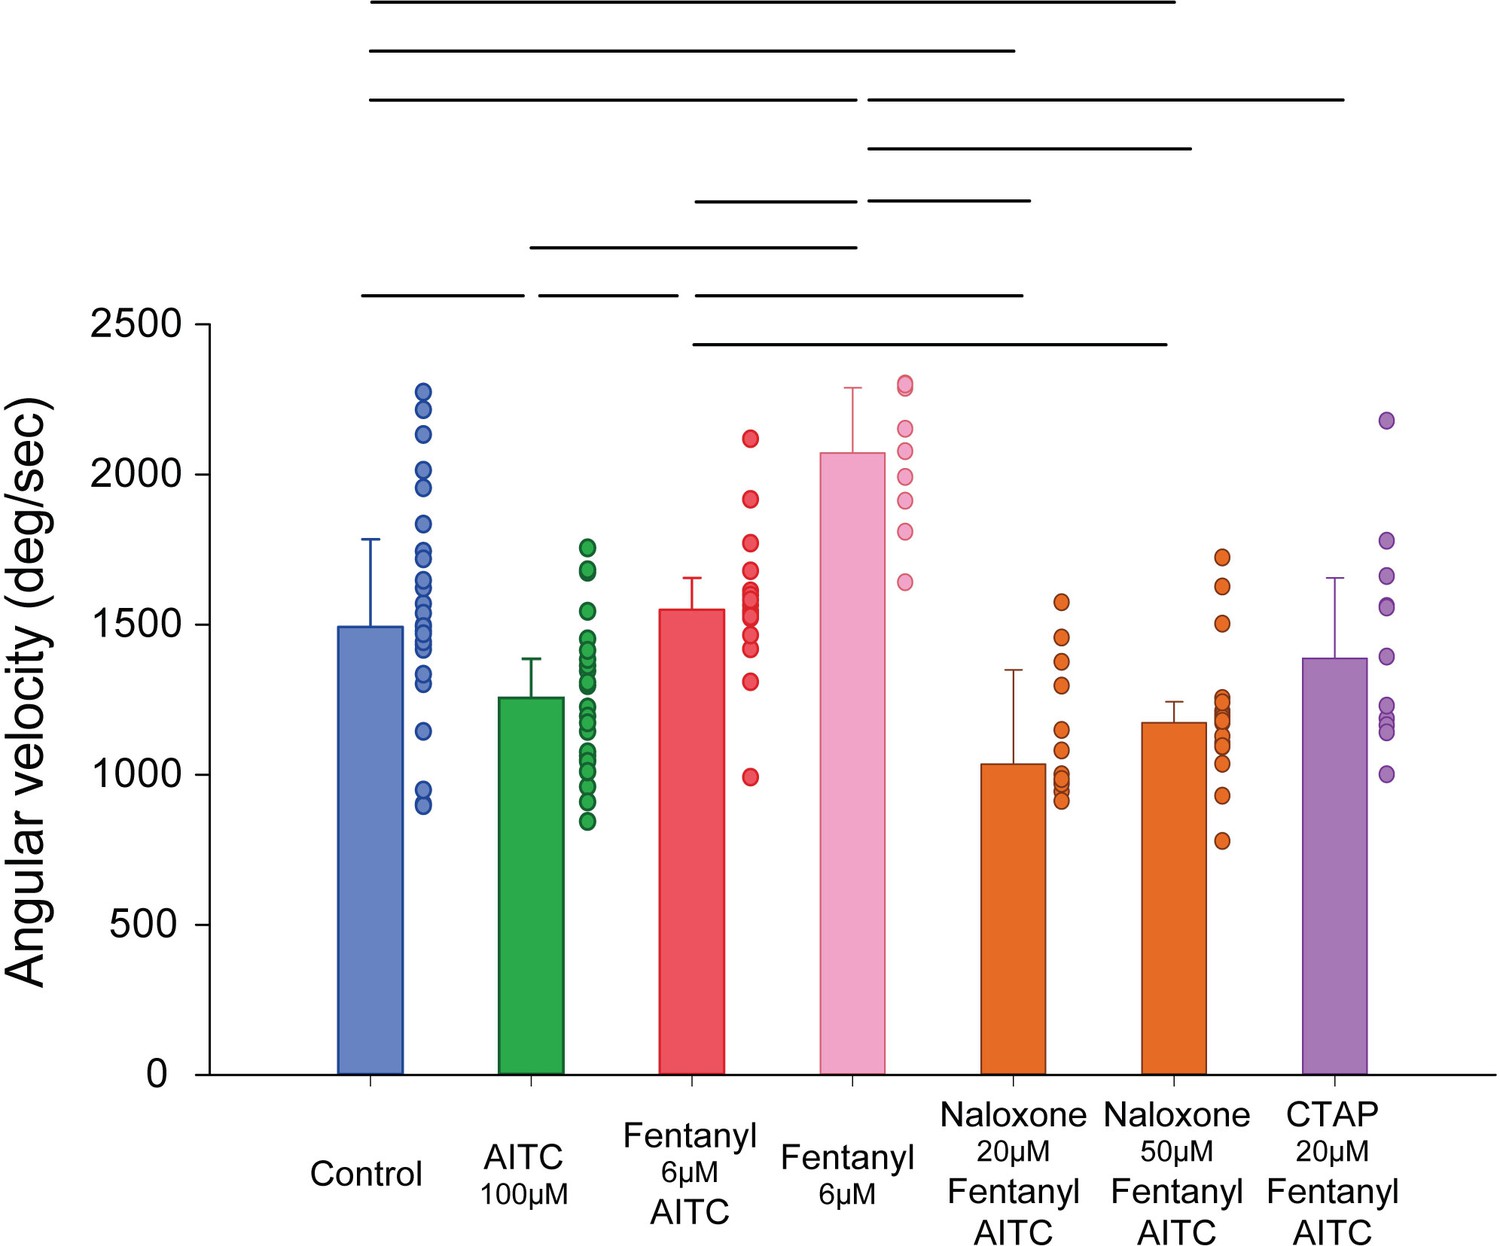
Angular velocity in response to AITC and opioid drugs.
AITC fish (n = 26) presented a lower angular velocity compared to controls (n = 25, p=0.002), an effect reversed in fentanyl/AITC group (n = 16, p=0.001). This effect was blocked by naloxone at 20 and 50 µM (n = 12 and 17, p=0.002 and p=0.004), but not by CTAP (n = 11, p=0.812). Angular velocity in fentanyl group (n = 9) was significantly higher than AITC, fentanyl/AITC, naloxone/AITC/fentanyl, and CTAP/AITC/fentanyl (all p>0.05). Data are presented as medians ± 75% and 25% percentiles. Black bars represent medians significantly different with p<0.05. Source data can be found in Figure 6—source data 1.
Figure 7 with 1 supplement
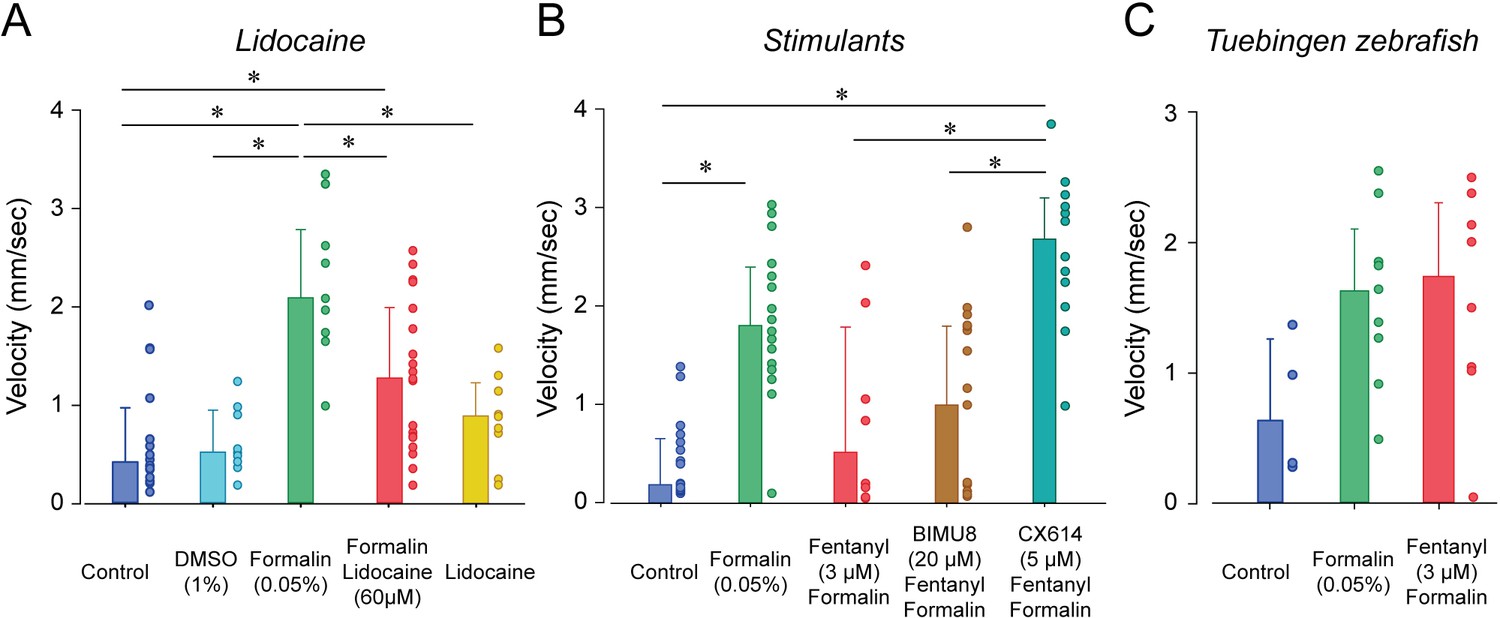
Analgesic profiles of larval zebrafish.
(A) To determine whether the analgesia assay can be replicated with non-opioid analgesics, we used lidocaine, an analgesic widely used in the clinic. Lidocaine with formalin (n = 19) only moderately reduced swimming velocity compared to formalin alone (n = 10). (B) The respiratory stimulant BIMU8 administered with fentanyl and formalin (n = 17) did not significantly affect swimming velocity when compared to formalin/fentanyl (n = 8). On the other hand, CX614/formalin/fentanyl (n = 12) presented significant differences compared to the control (n = 21). (C) We also looked at the analgesic properties of fentanyl in Tübingen zebrafish. As observed with the respiratory assays, fentanyl (n = 10) did not reduce the swimming response compared to formalin alone (n = 9) as it did with AB zebrafish. All data are presented as medians with error bars showing 25th and 75th percentile or interquartile range. Circles indicate individual data points for each zebrafish measured. * indicates groups significantly different with p<0.05. Source data can be found in Figure 7—source data 1.
-
Figure 7—source data 1
Analgesic profiles of larval zebrafish.
- https://cdn.elifesciences.org/articles/63407/elife-63407-fig7-data1-v2.xlsx
Figure 7—figure supplement 1
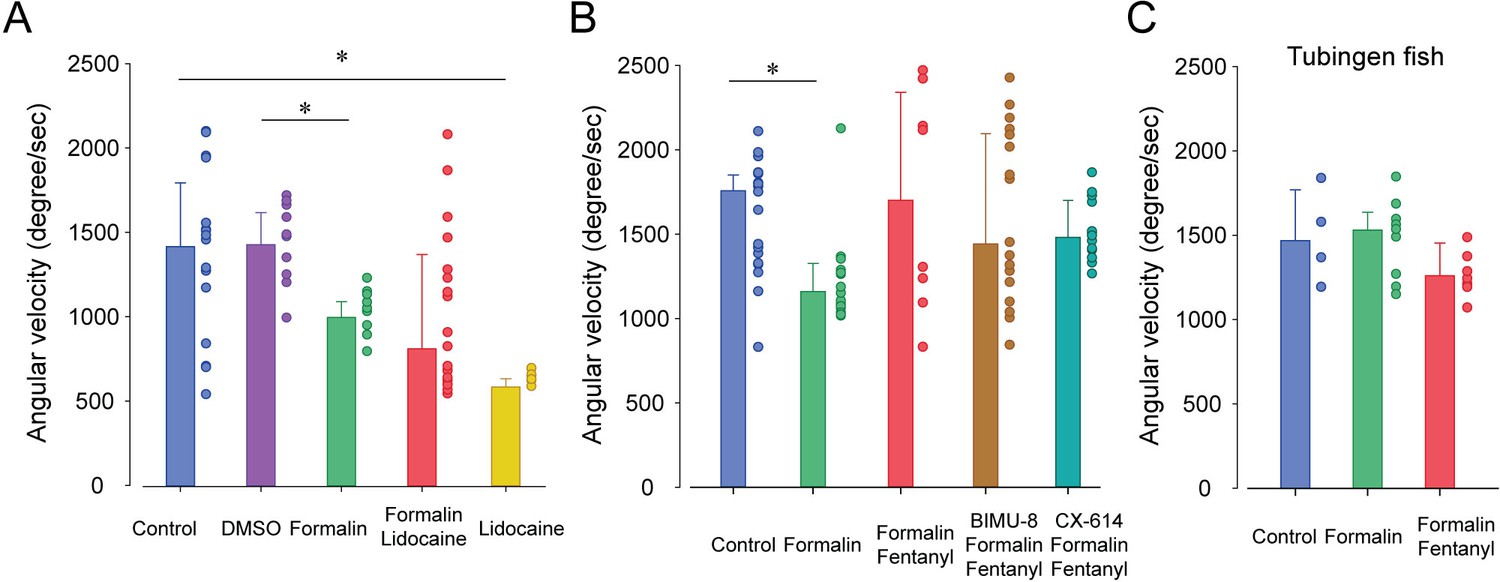
Angular velocity in response to formalin, lidocaine, and stimulants.
(A) Formalin reduced angular velocity when compared to DMSO (n = 16, all p>0.05), an effect not reversed by lidocaine. (B) BIMU8 (n = 17) and CX614 (n = 12) had no effects on fentanyl/formalin combination (n = 8, all p>0.05). (C) In Tubingen strain, formalin (n = 10) and fentanyl (n = 8) had no effects on angular velocity compared to controls (n = 4, p=0.132). Data are presented as medians ± 75% and 25% percentiles. Black bars represent medians significantly different with p<0.05. Source data can be found in Figure 7—source data 1.
Tables
Key resources table
| Reagent type (species) or resource | Designation | Source or reference | Identifiers | Additional information |
|---|---|---|---|---|
| Strain, strain background (Danio rerio) | AB Zebrafish | Hospital for Sick Children and the University of Toronto Mississauga (ON, Canada) | ||
| Strain, strain background (Danio rerio) | Tübingen (TU) Zebrafish | Hospital for Sick Children and the University of Toronto Mississauga (ON, Canada) | ||
| Strain, strain background | AB, TU cross zebrafish | Crossed at St. Michael’s Hospital (ON, Canada) | ||
| Chemical compound, drug | Fentanyl citrate | Sandoz (QC, Canada) | Cat. No. 2520 | |
| Chemical compound, drug | Morphine sulfate | Sandoz (QC, Canada) | Cat. No. 5642 | |
| Chemical compound, drug | Naloxone hydrochloride | Omega (QC, Canada) | Cat. No. L0010224 | |
| Chemical compound, drug | CTAP (D-Phe-Cys-Tyr-D-Trp-Arg-Thr-Pen-Thr-NH2) | Tocris (ON, Canada) | Cat. No. 1560/1 | |
| Chemical compound, drug | Lidocaine | Tocris (ON, Canada) | Cat. No. 3057 | |
| Chemical compound, drug | CX 614 | Tocris (ON, Canada) | Cat. No. 5149 | |
| Chemical compound, drug | BIMU 8 | Tocris (ON, Canada) | Cat. No. 4374/5 | |
| Chemical compound, drug | Allyl isothiocyanate (AITC) | Sigma-Aldrich (ON, Canada) | Cat. No. 36682 | |
| Chemical compound, drug | Formalin | VWR | Cat. No. 89370/094 | |
| Chemical compound, drug | Dimethyl sulfoxide (DMSO) | Sigma-Aldrich (ON, Canada) | Cat. No. 472301 | |
| Software, algorithm | Sigmaplot | Version 14, SAS | ||
| Software, algorithm | Adobe Illustrator | Creative Suite 5, Adobe | ||
| Software, algorithm | EthoVision XT | v15, Noldus Information Technology, Netherlands | ||
| Software, algorithm | Matlab | Mathworks, US |
Additional files
Download links
A two-part list of links to download the article, or parts of the article, in various formats.
Downloads (link to download the article as PDF)
Open citations (links to open the citations from this article in various online reference manager services)
Cite this article (links to download the citations from this article in formats compatible with various reference manager tools)
Respiratory depression and analgesia by opioid drugs in freely behaving larval zebrafish
eLife 10:e63407.
https://doi.org/10.7554/eLife.63407


