Calcium signaling through a transient receptor channel is important for Toxoplasma gondii growth
- Center for Tropical and Emerging Global Diseases, University of Georgia, United States
- Department of Cell and Molecular Physiology, Stritch School of Medicine, Loyola University Chicago, United States
- Department of Cellular Biology, University of Georgia, United States
Figures
Figure 1 with 1 supplement
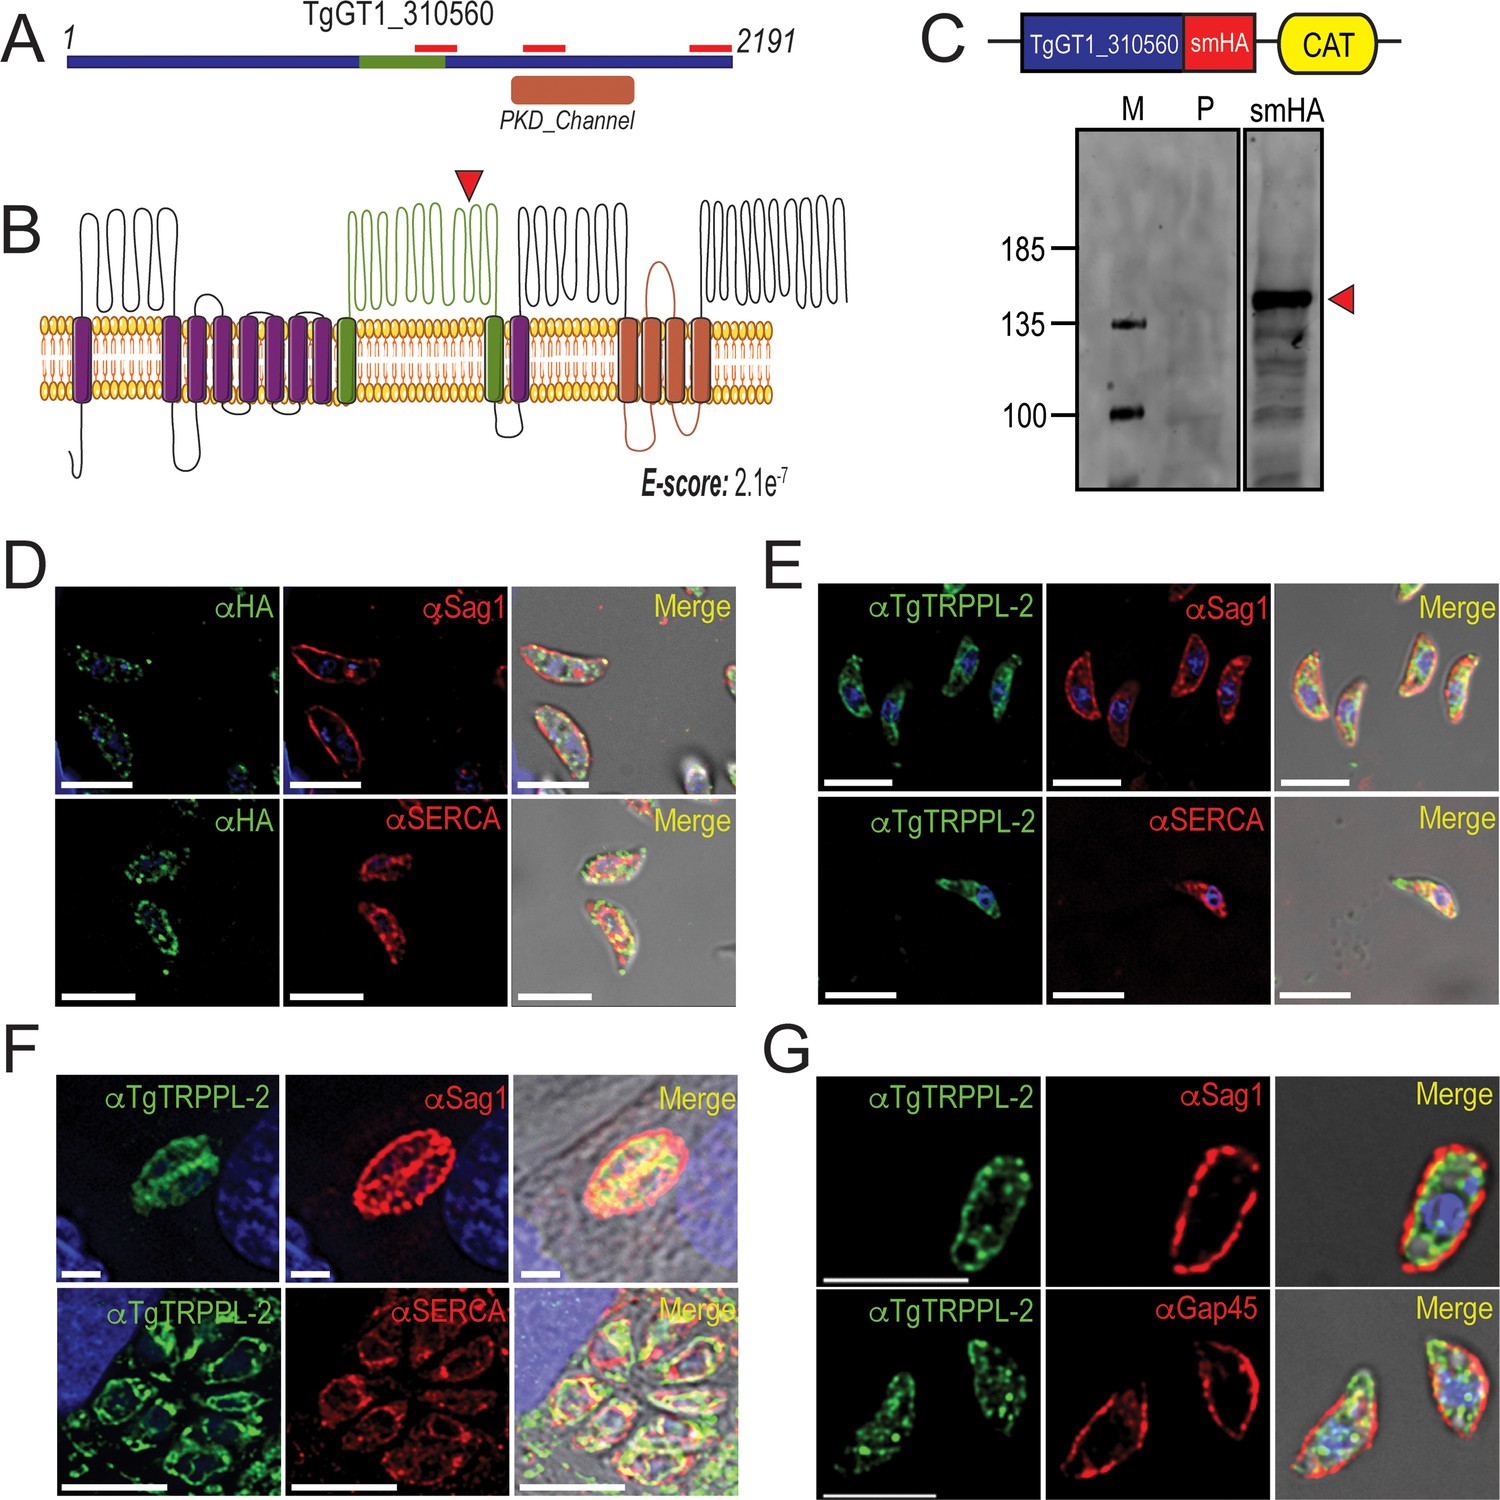
TgTRPPL-2 localizes to the endoplasmic reticulum and periphery of T. gondii.
(A) Schematic representation of the InterPro Domain annotation of TgTRPPL-2 in the GT1 strain. Red line indicates coverage of the sequence by mass spectrometry. (B) Predicted topology for TgTRPPL-2 in GT1 strain. Model was generated with the Protter application (Omasits et al., 2014). The PKD domain is shown in orange. The domain used to generate antibodies is highlighted in green. Predicted Transmembrane Domains (TMDs) are highlighted in purple. The red arrowhead indicates the predicted cleavage site for TgTRPPL2. (C) Schematic representation of C-terminal tagging of TgTRPPL-2 in TatiΔKu80 parasites and western blots of TgTRPPL-2-smHA membranes using αHA (1:1000) showing a major band at approximately 150 kDa (red arrowhead). (D) Immunofluorescence analysis (IFA) of extracellular tachyzoites using αHA antibody and co-localization with αSAG1 (1:1000) and αSERCA (1:1000) showing partial co-localization with both markers. (E) IFAs of extracellular and intracellular (F) tachyzoites respectively with αTgTRPPL-2 (1:100) showing labeling of the protein at the periphery, co-localized with αSAG1 (1:1000) and with αTgSERCA (1:1000). (G) Super-resolution of extracellular IFAs using αTgTRPPL-2 (1:100) co-localized with αSAG1 (1:1000) but not with αGAP45 (1:1000). Scale bars in D-G represent 5 µm.
-
Figure 1—source data 1
Mass spectrometry results.
- https://cdn.elifesciences.org/articles/63417/elife-63417-fig1-data1-v2.xlsx
Figure 1—figure supplement 1
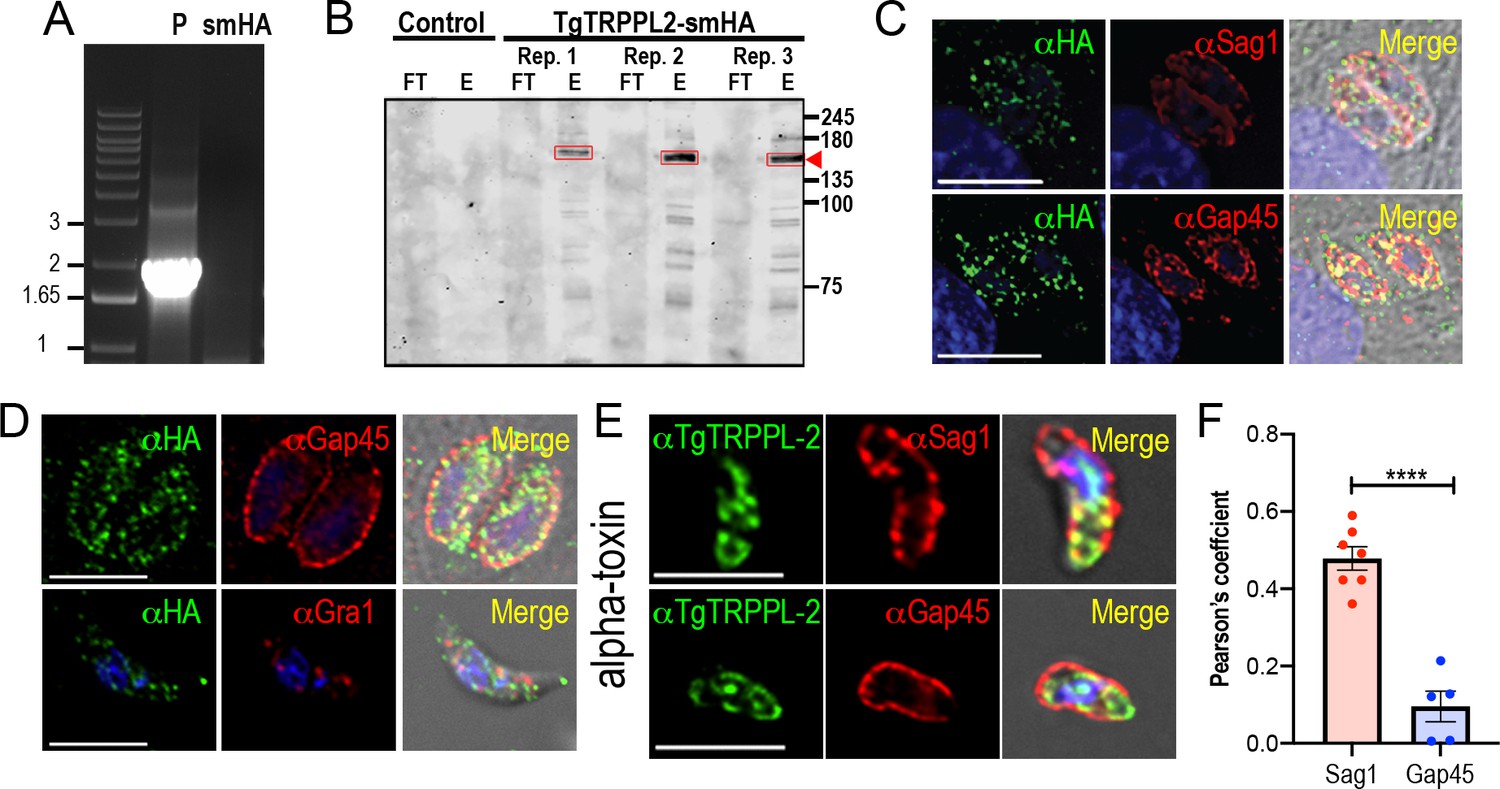
Validation of C-terminal tagging of TgTRPPL-2-smHA.
(A) Amplification of ~2 kB in the TgTRPPL-2-smHA cell line validating the correct integration of TgTRPPL-2-smHA. (B) Western blot of three biological replicates of immunoprecipitated TgTRPPL-2-smHA using αHA antibody (1:1000) shows a band of ~150 kDa (highlighted by red boxes and arrow). No band is present in the control cell line. (C) Immunofluorescence analysis (IFA) of intracellular tachyzoites with αHA (1:100), αSAG1 (1:1000), and αGAP45 (1:1000) . (D) IFAs of intracellular and extracellular tachyzoites with αHA (1:100) show that TgTRPPL-2 did not co-localize with either αGAP45 (1:1000) or αGra1 (1:500). (E) IFAs of extracellular tachyzoites preincubated with α-toxin showing co-localization of TgTRPPL-2 with αSag1 (1:1000) but not with αGap45. (F) Quantification of Pearson’s coefficient of the co-localization of TgTRPPL2 with SAG1 or GAP45.
-
Figure 1—figure supplement 1—source data 1
Summary statistics of Pearson's coefficient analysis.
- https://cdn.elifesciences.org/articles/63417/elife-63417-fig1-figsupp1-data1-v2.xlsx
Figure 2 with 1 supplement
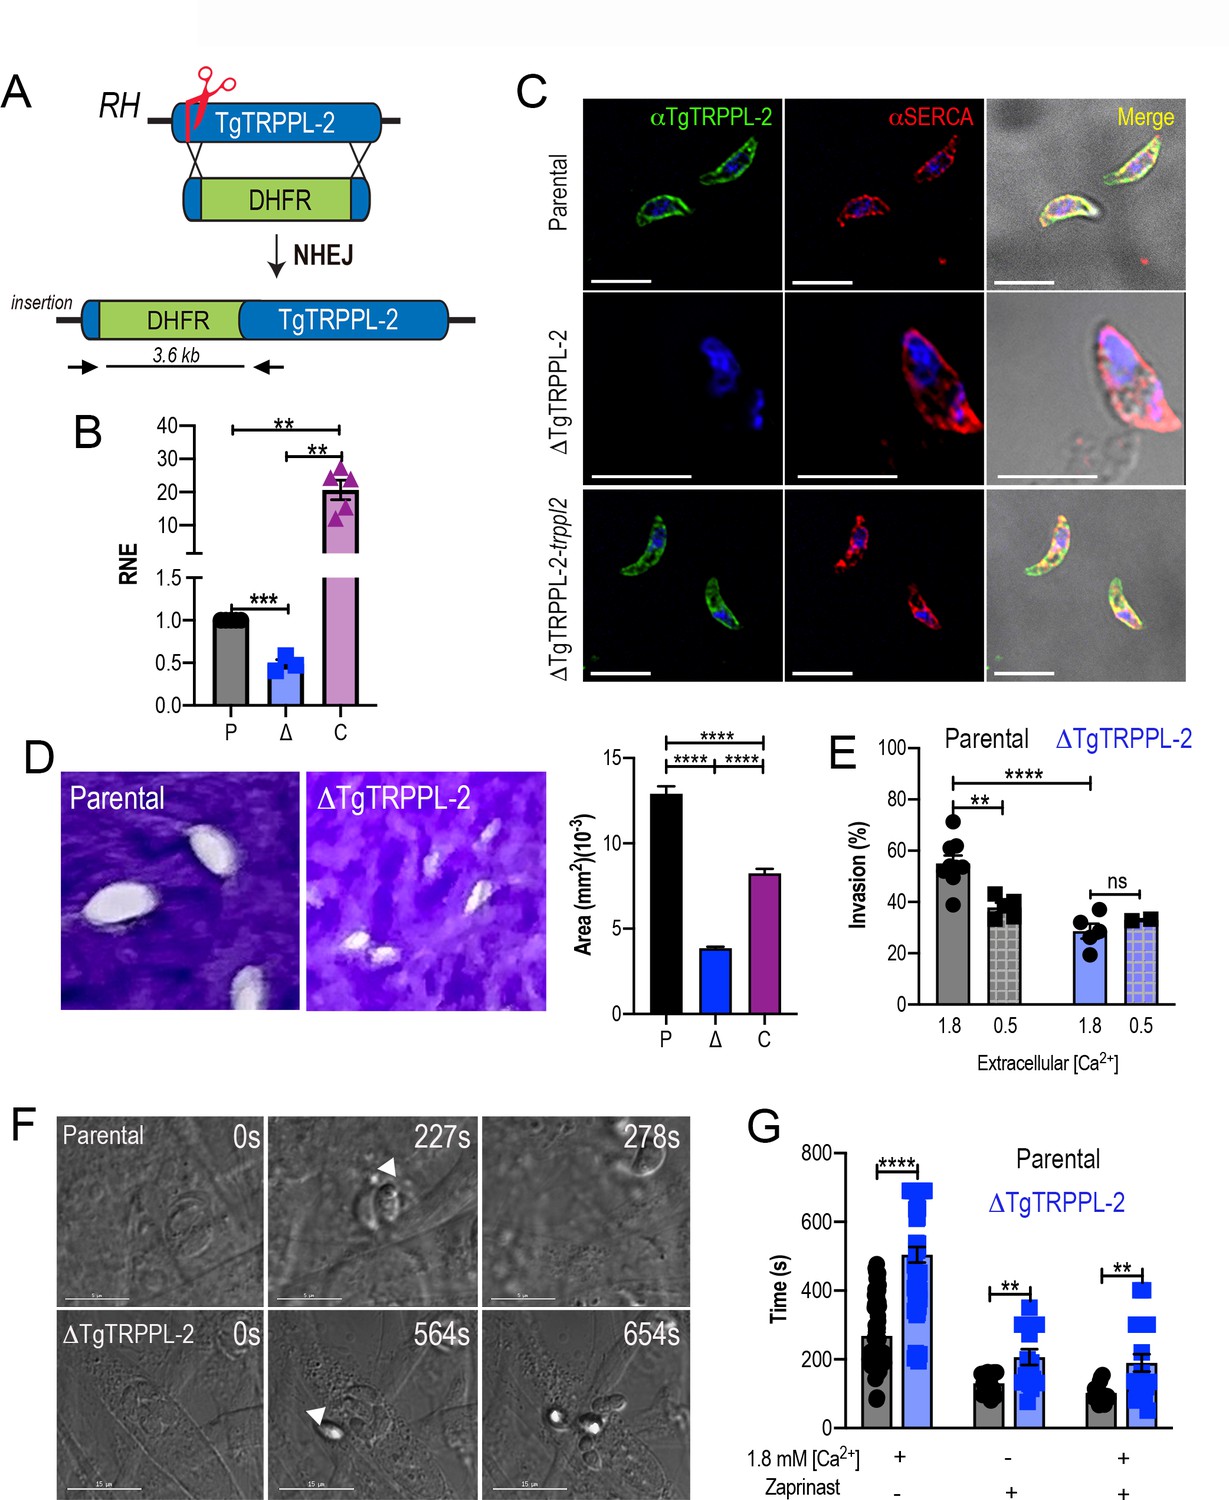
The role of TgTRPPL-2 in T. gondii growth.
(A) Schematic representation of the generation of ΔTgTRPPL-2 in the T. gondii RH strain. (B) qPCR of total RNA from ΔTgTRPPL-2 (Δ), ΔTgTRPPL-2-trppl2 (C), and parental strains (P) using primers upstream and downstream of the insertion site of the dihydrofolate reductase-thymidylate synthase cassette. (C) Immunofluorescence analysis of extracellular parasites showing plasma membrane labeling with αTgTRPPL-2 (1:1000) and co-localization with αSERCA (1:1000). (D) Plaque assays of parental (P), ΔTgTRPPL-2 (Δ), and ΔTgTRPPL-2-trppl2 (C) parasites. Quantification of plaque sizes from three independent biological experiments using Student’s t-test. Values are means ± SEM. ****p<0.0001. (E) Red green assays of parental, and ΔTgTRPPL-2 cells quantifying invaded and attached intracellular parasites. Assays were done at two concentrations of extracellular Ca2+: 0.5 and 1.8 mM. Values are means ± SEM. **p<0.001, ****p<0.0001. (F) Time to egress stimulated by saponin/Ca2+ at 1.8 mM extracellular Ca2+ of both parental and the ΔTgTRPPL-2 mutant. (G) Statistical analysis of average egress time stimulated by saponin or Zaprinast in the presence or absence of extracellular Ca2+. Analysis was performed from three independent biological replicates using Student’s t-test. Values are means ± SEM, **p<0.003, ****p<0.0001. Black bars represent parental strain, blue bars represent ΔTgTRPPL-2. Scale bars for C represent 5 µm.
-
Figure 2—source data 1
Statistical analysis of data.
- https://cdn.elifesciences.org/articles/63417/elife-63417-fig2-data1-v2.xlsx
Figure 2—figure supplement 1
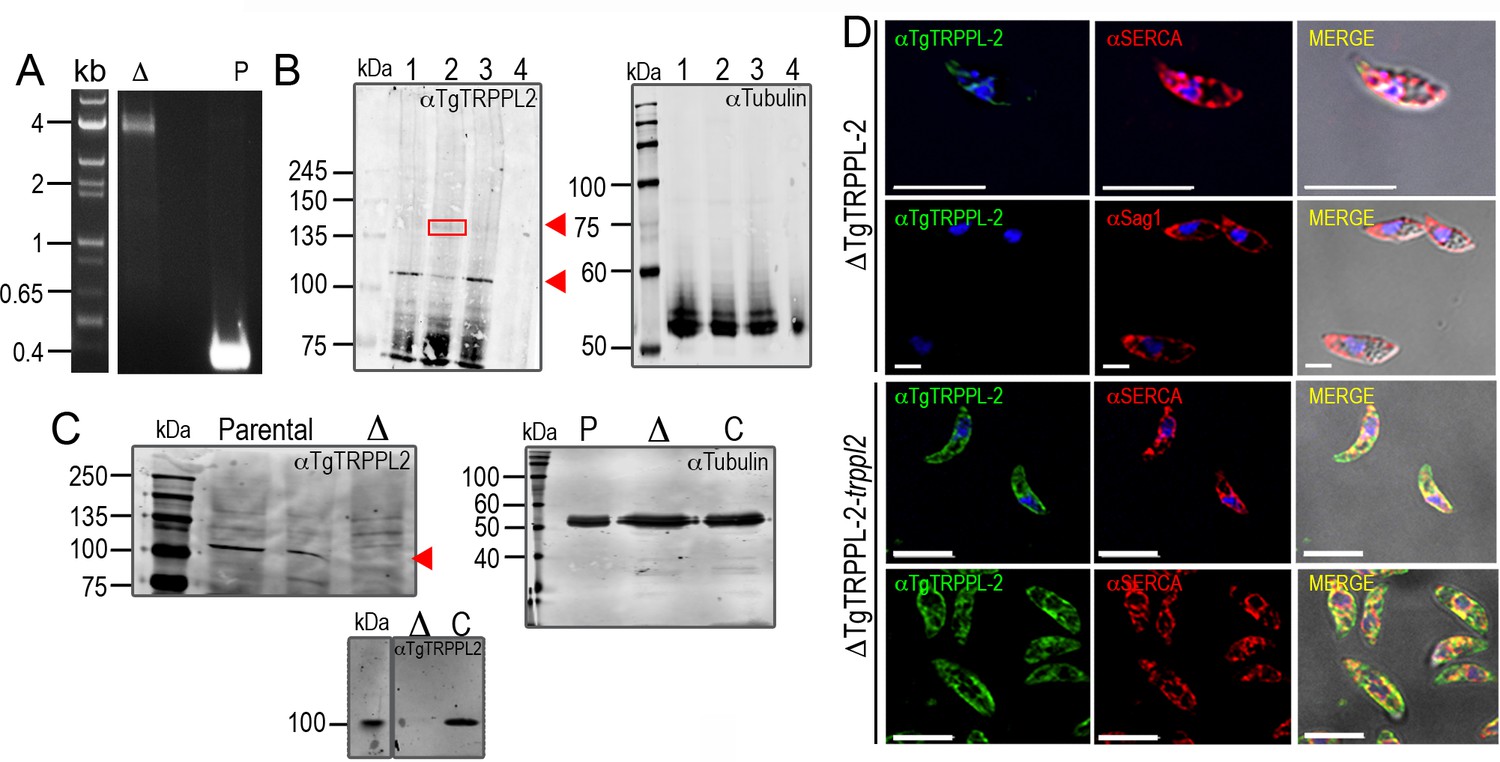
Validation of the anti-TgTRPPL-2 antibody.
(A) Genomic validation of the insertion of the dihydrofolate reductase-thymidylate synthase cassette in the ΔTgTRPPL-2 locus. Primers used are shown in Figure 2A. (B) Western blot analysis of total lysates from different cells lines were run in an SDS-PAGE and developed with αTgTRPPL2 (1:1000) and αTubulin (1:10,000) (1: ΔKu80Tati; 2: TgTRPPL2-smHA; 3: RH; 4: ΔTgTRPPL-2). Note that all cell lines show a band at ~115–120 kDa and lane 2 (tagged line) shows two bands one at ~115–120 kDa and an additional band of ~150 kDa due to the presence of the smHA tag, which adds approximately 39 kDa to the protein. The sum of these two bands (120 + 150 kDa) represents the size predicted for TgTRPPL2 tagged with the smHA tag in ToxoDB. (C) Western blots of lysates from parental, ΔTgTRPPL-2 (Δ) and ΔTgTRPPL-2-trppl2 (C) cells were run in an SDS-PAGE cell and developed with the anti-TgTRPPL-2 antibody at 1:1000. αTubulin (1:10,000) was used as loading control. (D) Immunofluorescence analysis of extracellular tachyzoites with αTgTRPPL-2 (1:1000) co-localized with αSERCA (1:1000) in ΔTgTRPPL-2 and ΔTgTRPPL-2-trppl2. Scale bars represent 5 μm. Images were taken with equivalent time and laser power.
Figure 3 with 1 supplement

The role of TgTRPPL-2 in PM Ca2+ influx.
(A) Scheme showing the mechanism of Ca2+ influx and how cytosolic Ca2+ may activate the PM channel (Ca2+-activated calcium entry). NSC: nifedipine-sensitive channel; PKG: protein kinase G; PDE: phosphodiesterase; Thap: thapsigargin; Zap: Zaprinast.(B) Cytosolic Ca2+ measurements of Fura-2 loaded tachyzoites of the parental (RH), ΔTgTRPPL-2 and ΔTgTRPPL-2-trppl2 lines. The buffer contains 100 μM ethylene glycol-bis(β-aminoethyl ether)-N,N,N′,N′-tetraacetic acid (EGTA) to chelate contaminating Ca2+ and at 300 s, 1.8 mM Ca2+ were added to the suspension. The pink box indicates the area used for the quantification presented in (C). (C) Quantification and statistical analysis of the change in cytosolic Ca2+ during the first 20 s after addition of extracellular Ca2+. ***p<0.0002. (D) Constitutive Ca2+ influx into the cytosol of parasites suspended in a buffer with 1.8 mM Ca2+. (E) Quantification and statistical analysis of the slopes from (D). ****p<0.0001. (F) Cytosolic Ca2+ increase after adding Thap (1 µM) followed by Ca2+ influx after the addition of 1.8 mM extracellular Ca2+ at 400 s. The pink boxes indicate the area used for the quantification presented in (G) and (H). (G) Quantification and statistical analysis of the change in cytosolic Ca2+(Δ[Ca2+]cyt) at 50 s after the addition of Thap. (H) Quantification of the Δ[Ca2+]cyt 20 s after the addition of 1.8 mM of Ca2+. ***p<0.0008, ****p<0.0001. (I) Cytosolic Ca2+ increase stimulated by Zaprinast (100 µM) in the presence of 1.8 mM extracellular Ca2+. (J) Quantification and statistical analysis of the Δ[Ca2+]cyt during the first 15 s after adding Zaprinast (100 µM) (pink box, in I). **p<0.001, ****p<0.0001. (K) Quantification and statistical analysis of the Δ[Ca2+]cyt during the 20 s after adding Ca2+ without additions (ND) or after adding Thap or Zap. *p<0.02, **p<0.005, ***p<0.0008. Statistical analysis for all experiments was done from a minimum of three independent trials using Student’s t-test.
-
Figure 3—source data 1
Quantification and statistics of calcium measurements.
- https://cdn.elifesciences.org/articles/63417/elife-63417-fig3-data1-v2.xlsx
Figure 3—figure supplement 1
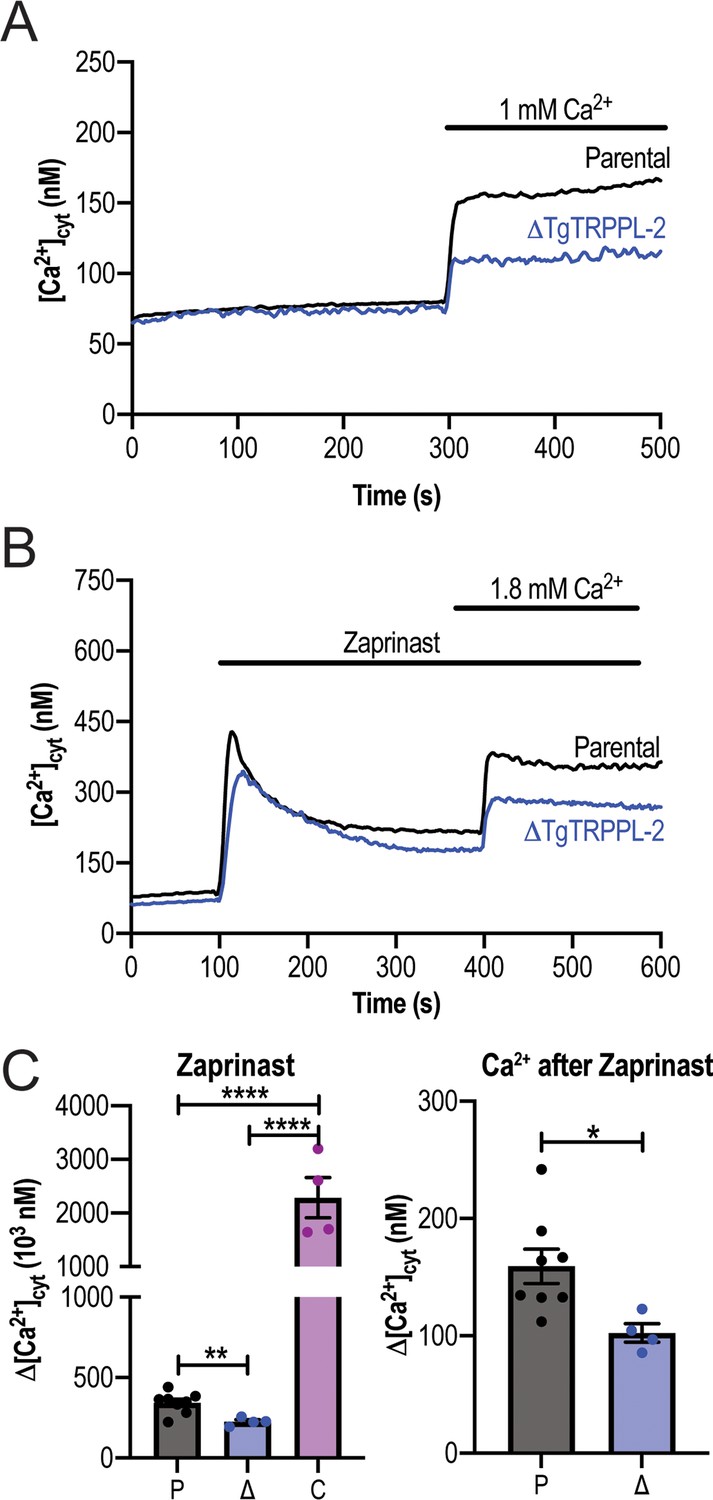
TgTRPPL-2 regulates Ca2+in T. gondii.
(A) Cytosolic Ca2+ measurements of Fura-2-loaded tachyzoites of the parental and ΔTgTRPPL-2 mutant after addition of 1 mM extracellular Ca2+ at 300 s. (B) Cytosolic Ca2+ measurement after the addition of Zaprinast (100 µM) at 100 s and Ca2+ influx stimulated by the addition of 1.8 mM extracellular Ca2+ at 400 s. (C) Change in cytosolic Ca2+ 15 s after the addition of Zaprinast (labeled Zaprinast) and 20 s after the addition of 1.8 mM of extracellular Ca2+ (labeled Ca2+after Zaprinast). Values are means ± SEM, n = 3, **p<0.007, ****p<0.0001. Measurements of the complemented strain are not shown as the concentration of calcium goes outside the Fura 2 range.
-
Figure 3—figure supplement 1—source data 1
Quantification and statistics of calcium measurements.
- https://cdn.elifesciences.org/articles/63417/elife-63417-fig3-figsupp1-data1-v2.xlsx
Figure 4
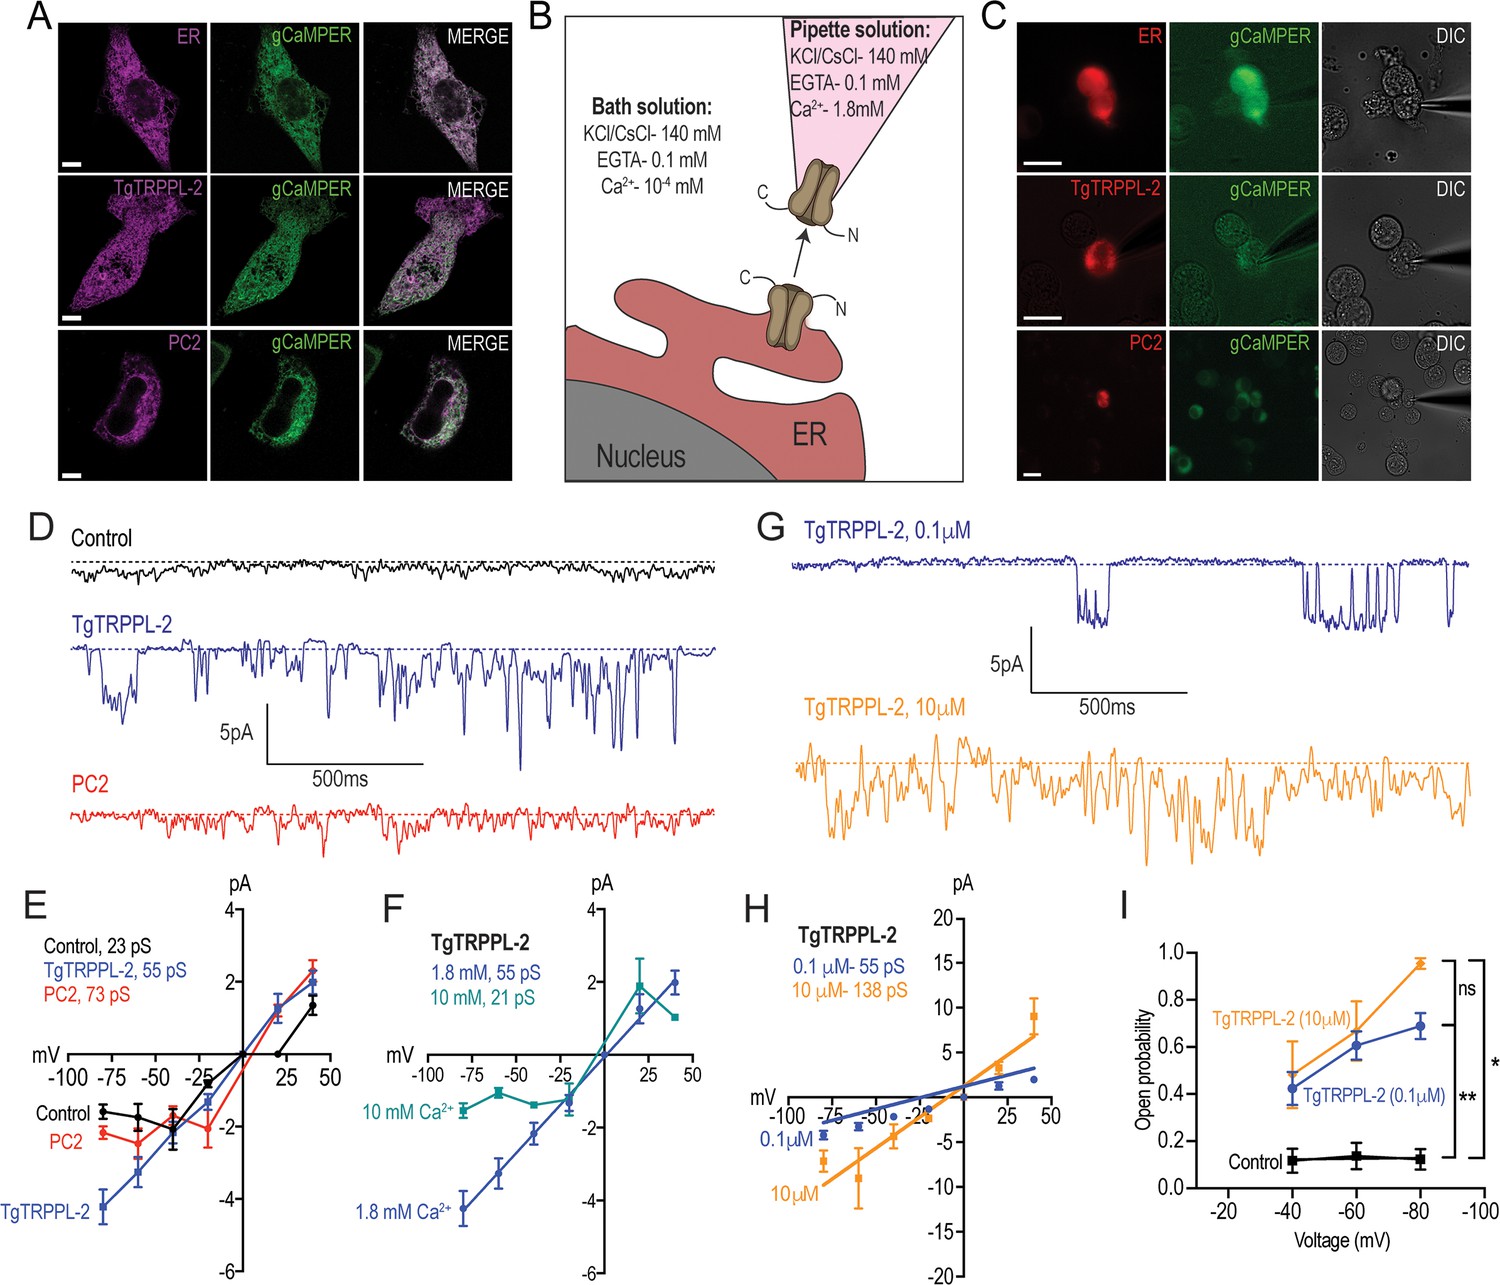
Characterization of TgTRPPL-2 expressed in HEK-3KO cells.
(A) Images of HEK-3KO cells expressing an endoplasmic reticulum (ER)-marker, polycystin 2 (PC2), or TgTRPPL-2 with the genetic calcium indicator gCaMPer. (B) Schematic representation of nuclear-patch clamp in the outside (cytosolic-side) out configuration. Ionic composition and concentration for bath and pipette solutions are shown. (C) Patched nuclear-extract expressing ER-marker, PC2, and TgTRPPL-2 with the genetic calcium indicator gCaMPer. (D) Representative tracing from control, TgTRPPL-2 or PC2-expressing cells showing the currents recorded in the presence of 1.8 mM luminal Ca2+ in a symmetrical potassium chloride solution. Tracings represent approximately 2 s. (E) Current-voltage relationship comparing single-channel current amplitude of control, PC2, and TgTRPPL-2-expressing cells from (D). Inset: calculated slope conductance for control, TgTRPPL-2, and PC2. (F) Current-voltage relationship comparing single-channel current amplitude of TgTRPPL-2-expressing cells at 1.8 and 10 mM [Ca2+] inside the pipette. Inset: calculated slope conductance for the conditions analyzed. (G) Representative traces of currents recorded from TgTRPPL-2-expressing cells using different concentration of [Ca2+] in the bath solution (Solution A vs. Solution C) (Supplementary file 4). Tracings represent approximately 2 s. (H) Current-voltage relationship comparing single-channel current amplitude of TgTRPPL-2-expressing cells at 0.1 and 10 μM [Ca2+] in the bath solution. Inset: calculated slope conductance for the different [Ca2+]. (I) Open probability of control and TgTRPPL-2-expressing cells in the presence of different [Ca2+] in the bath solution in comparison to the control. *p<0.01, **p<0.001. Scale bars in A and C represent 10 µm.
-
Figure 4—source data 1
Open probability measurements and statistics.
- https://cdn.elifesciences.org/articles/63417/elife-63417-fig4-data1-v2.xlsx
Figure 5 with 1 supplement
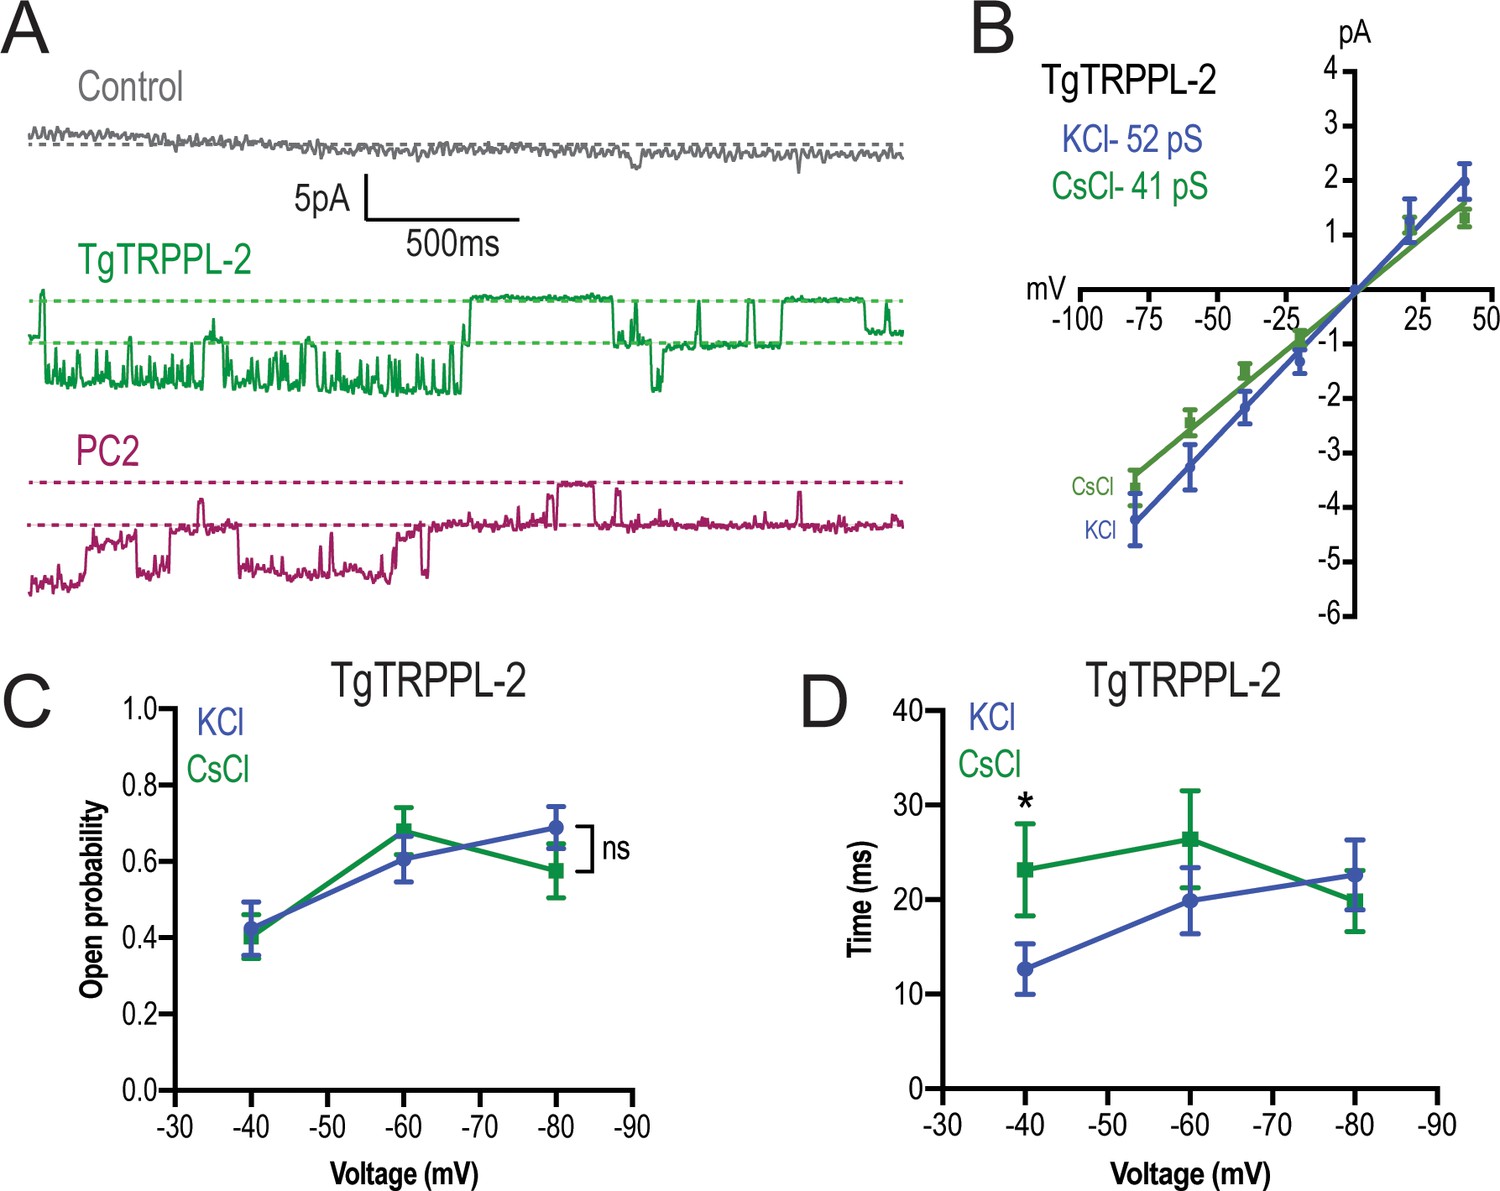
TgTRPPL-2 permeates Ca2+.
(A) Representative traces of currents recorded at −80 mV in the presence of 1.8 mM Ca2+ inside the pipette (Solution D, Supplementary file 4) of nuclear extracts from control, TgTRPPL-2-, or polycystin 2 (PC2)-expressing cells. Traces are a representation of 2 s. (B) Current-voltage relationship comparing single-channel current amplitude of TgTRPPL-2 cells in 1.8 mM in KCl (blue) or CsCl (green) buffer. Inset: slope conductance of TgTRPPL-2 in the different conditions analyzed. (C) Calculated open probability of TgTRPPL-2-expressing cells in the presence of 1.8 mM Ca2+ in a KCl (blue) or CsCl (green) buffer. (D) Average time of channel openings (dwell time) of TgTRPPL-2-expressing cells in the presence of 1.8 mM Ca2+ in a KCl (blue) or CsCl (green). *p<0.04. Values are means ± SEM.
-
Figure 5—source data 1
Channel amplitude measurements, open probability, and statistics.
- https://cdn.elifesciences.org/articles/63417/elife-63417-fig5-data1-v2.xlsx
Figure 5—figure supplement 1
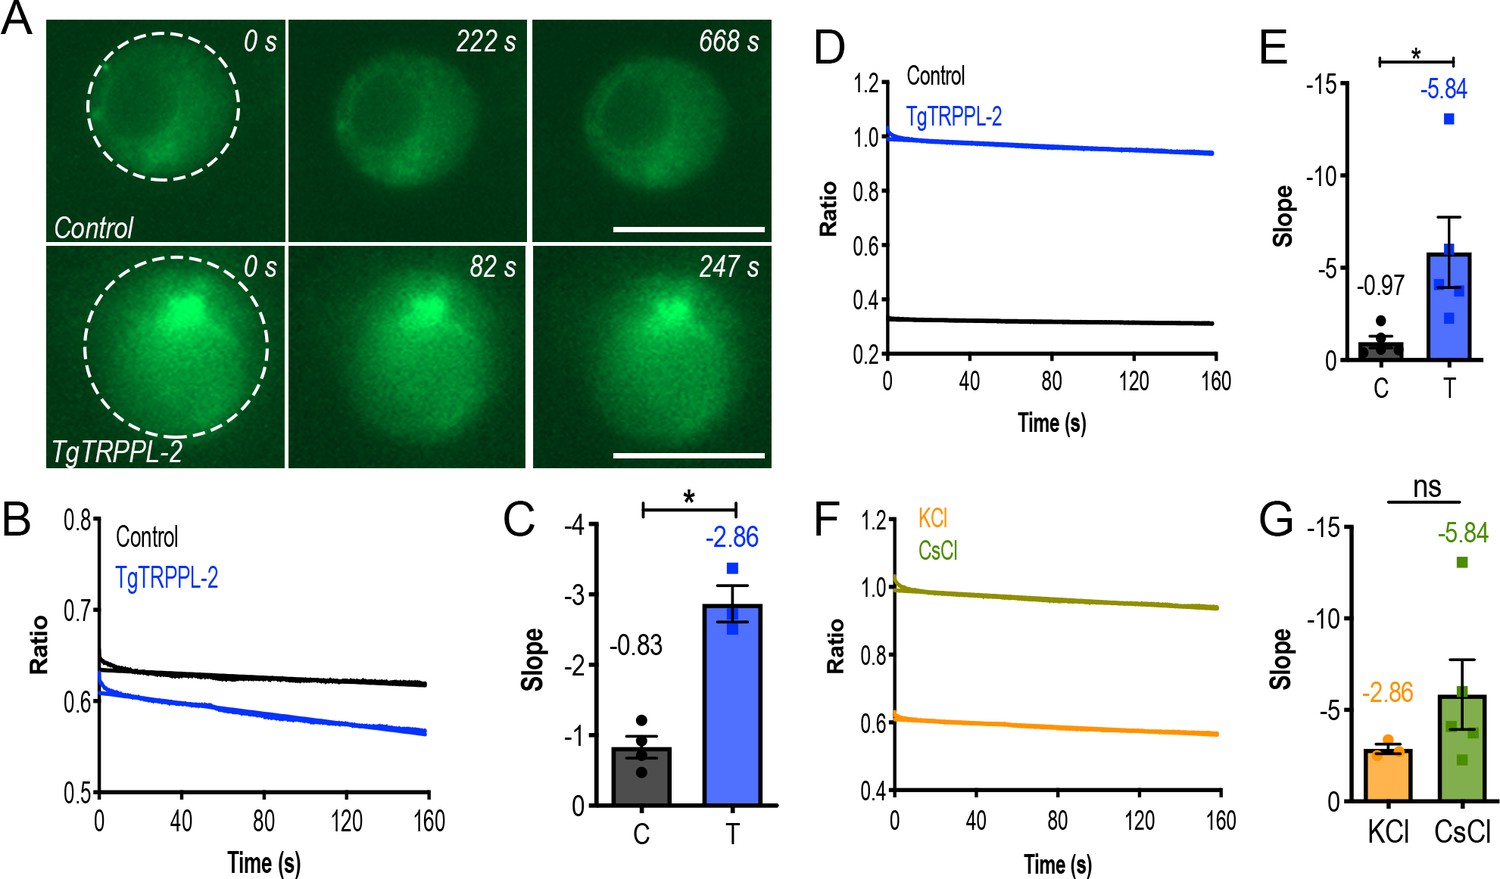
Measurement of endoplasmic reticulum (ER) calcium of HEK-3KO cells expressing TgTRPPL-2.
(A) Fluorescence of ER calcium in ER-RFP-HEK (Control) vs. TgTRPPL-2-HEK (TgTRPPL-2) in a high calcium-potassium solution of patched nuclear membranes while the membrane is depolarized. (B) Quantification of fluorescence of patched cells while the membrane is depolarized from −80 to +40 mV in a high calcium-potassium solution. (C) Quantification of the slope of fluorescence in (B) comparing TgTRPPL-2-HEK-3KO cells versus control cells. Slope of the fluorescence was quantified based on the five technical replicates of the artificial membrane depolarization in each cell analyzed. Asterisk indicate p-value for significant difference. Values represent the mean of the slope shown in (B). *p<0.01. (D) Quantification of fluorescence of patched cells while the membrane is depolarized from −80 to +40 mV in a high calcium-cesium solution. (E) Quantification of the slope of fluorescence in (D) comparing TgTRPPL-2-HEK-3KO cells versus control cells. The slope was quantified for the five technical replicates of patched membranes. Asterisk indicates p-value for significant difference. Values represent the mean of the slope shown in (D). *p<0.03. (F) Comparison of the fluorescence of patched nuclear extract of TgTRPPL-2-HEK cells while the membrane was artificially depolarized. (G) Quantification of the slope of fluorescence of patched TgTRPPL-2-HEK-3KO nuclear extracts in different experimental conditions. Slope of the fluorescence was quantified based on the five technical replicates of the artificial membrane depolarization in each cell analyzed.
-
Figure 5—figure supplement 1—source data 1
Calcium fluorescence measurements and statistics.
- https://cdn.elifesciences.org/articles/63417/elife-63417-fig5-figsupp1-data1-v2.xlsx
Figure 6
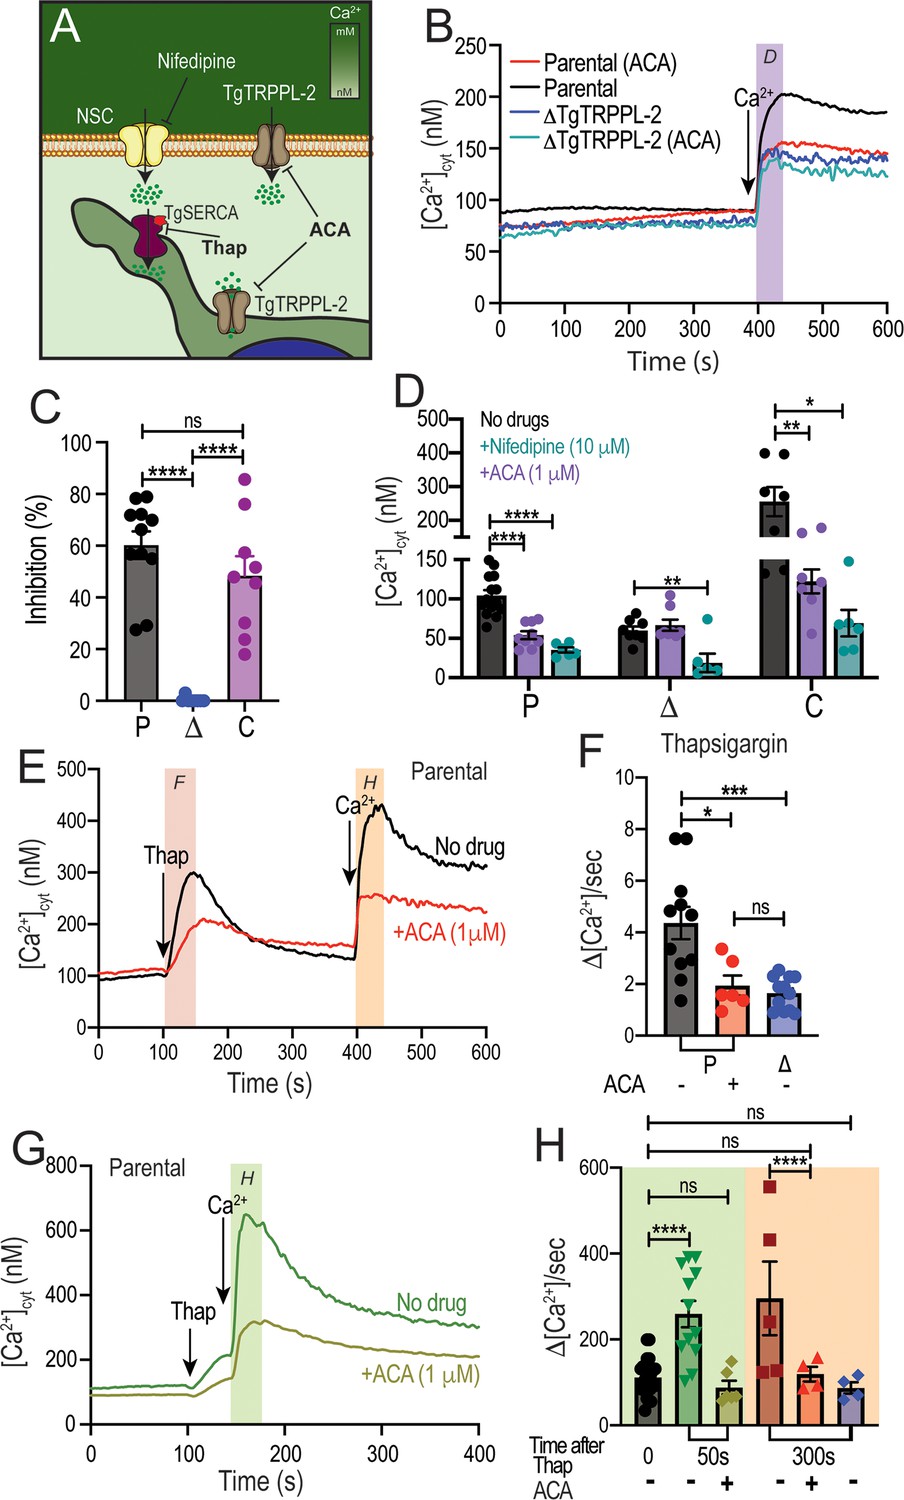
Regulation of TgTRPPL-2 by Ca2+and inhibition by transient receptor potential inhibitors.
(A) Scheme showing TgTRPPL-2 at the PM and endoplasmic reticulum. (B) Cytosolic Ca2+ measurements of Fura-2-loaded tachyzoites preincubated with 1 µM anthranilic acid (ACA). 1.8 mM Ca2+ was added where indicated. The purple box indicates the area used for the quantification presented in (D). (C) Percentage inhibition of Ca2+ influx in the presence of 1 µM of ACA: P: parental, Δ: ΔTgTRPPL-2 and C: ΔTgTRPPL-2-trppl2. (D) Change in cytosolic Ca2+ during the first 20 s after addition of Ca2+ in the presence of 10 µM of nifedipine or 1 µM ACA. P: parental, Δ: ΔTgTRPPL-2 and C: ΔTgTRPPL-2-trppl2. *p<0.01, **p<0.003, ****p<0.0001. (E) Cytosolic Ca2+ increase after adding Thap (1 µM) to a suspension of wild-type tachyzoites (RH). The red line shows a similar experiment, but the cells were preincubated with 1 µM ACA for 3 min. The pink and orange boxes show the areas used for the quantifications presented in (F) and (H). (F) Quantification and statistical analysis of the slope 50 s after the addition of Thap in the presence or absence of ACA in parental (P) and the ΔTgTRPPL-2 mutant (Δ). *p<0.01, ***p<0.0003. (G) Stimulation of Ca2+ influx 50 s after addition of Thap in the presence or absence of 1 µM ACA. The green box shows the area used for the quantifications presented in (H). (H) Quantification of change of cytosolic Ca2+ 20 s after the addition of 1.8 mM Ca2+ following the addition of Thap under different conditions. ****p<0.00001. The statistical analysis for all experiments was done from at least three independent trials using Student’s t-test. Values are means ± SEM.
-
Figure 6—source data 1
Quantification and statistics of calcium measurements.
- https://cdn.elifesciences.org/articles/63417/elife-63417-fig6-data1-v2.xlsx
Figure 7
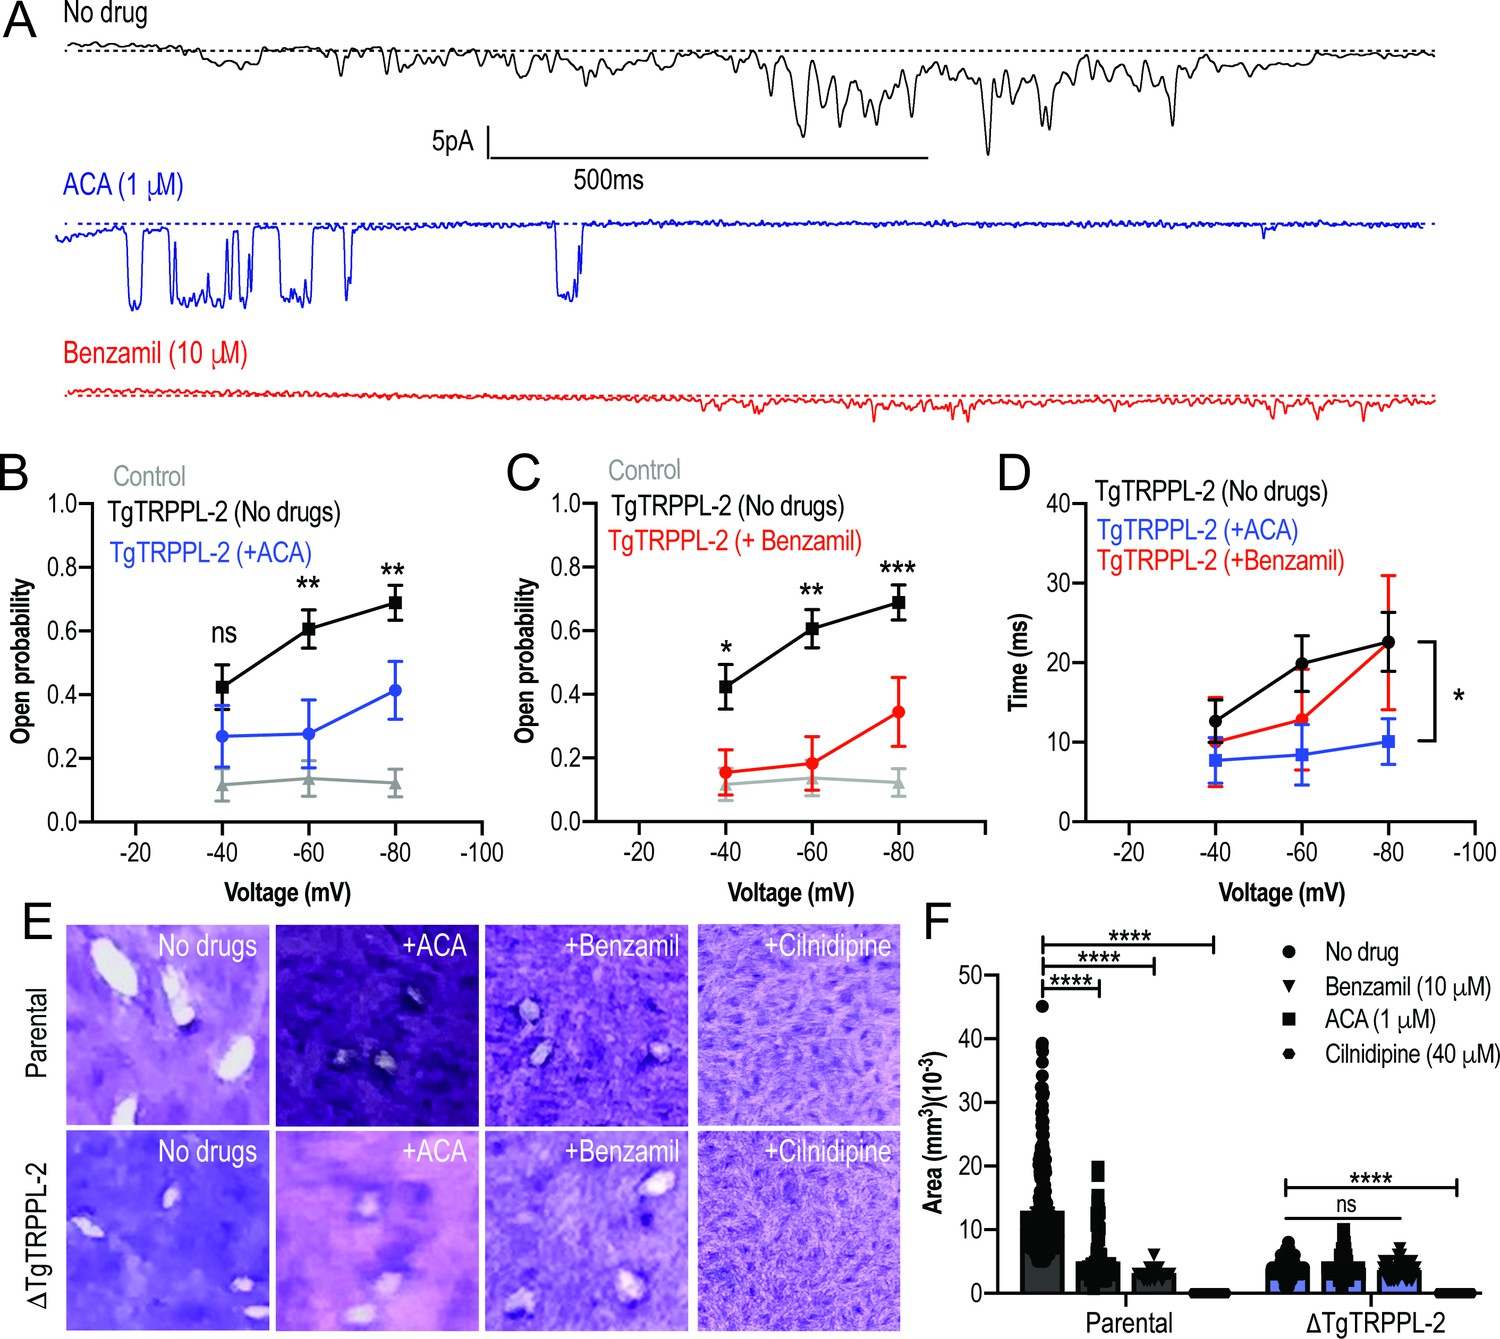
Transient receptor potential (TRP) inhibitors decreased the activity of TgTRPPL-2.
(A) Example of currents recorded of TgTRPPL-2-expressing cells at –80 mV without inhibitors (black trace) compared with the currents in the presence of 1 μM of anthranilic acid (ACA) (blue trace) or 10 μM of benzamil (red trace). (B) Calculated open probability of TgTRPPL-2-expressing cells (black) or in the presence of ACA (blue). **p<0.006–0.007. (C) Calculated open probability of TgTRPPL-2-expressing cells (black) or in the presence of benzamil (red). Asterisks indicate p-values for significance. *p<0.02, **p<0.002, ***p<0.0002. (D) Average time of channel opening (dwell time) of TgTRPPL-2-expressing cells in the presence of TRP inhibitors. Asterisks indicate p-values for significance, *p<0.02. (E) Plaque assay of the ΔTgTRPPL-2 mutant and the parental strain in the presence of ACA (1 μM), benzamil (10 μM), and cilnidipine (40 μM) after 7 days of growth. (F) Statistical analysis of plaque sizes done from three independent biological replicates using Student’s t-test. Values are means ± SEM, ****p<0.0001.
-
Figure 7—source data 1
Inhibition measurements.
- https://cdn.elifesciences.org/articles/63417/elife-63417-fig7-data1-v2.xlsx
Figure 8

Model of the role of TgTRPPL-2 in Ca2+influx into the cytosol of T. gondii.
Ca2+ entry is mediated by two independent Ca2+ channels at the PM, a nifedipine-sensitive channel (NSC) and TgTRPPL-2. TgTRPPL-2 is a cation-permeable channel that mediates Ca2+ entry at the PM by a pathway that is activated by high [Ca2+] and can be inhibited by broad transient receptor potential inhibitors like anthranilic acid and benzamil. TgA1 is shown as the PM Ca2+ ATPase that pumps Ca2+ outside the cell. TgTRPPL-2 also localizes to the endoplasmic reticulum (ER) where it may function as a Ca2+ efflux channel. Increase in cytosolic [Ca2+] can modulate TgTRPPL-2 by allowing the channel to open for longer time, thus allowing more Ca2+ to enter the cell. Also shown is the IP3-responsive channel in the ER. The molecular identity of this channel is not known. Ca2+ activates the phosphatidyl inositol phospholipase C (PLC), which is also activated through protein kinase G signaling. PLC synthesizes IP3, which stimulates Ca2+ release from the ER.
Tables
Key resources table
| Reagent type (species) or resource | Designation | Source or reference | Identifiers | Additional information |
|---|---|---|---|---|
| Antibody | Mouse- αTgTRPPL-2 | This work | Silvia Moreno (University of Georgia) | Recognizes TgGT1_310560 in T. gondii tachyzoites IFA (1:100) WB (1:1000) |
| Antibody | Rabbit-αSag1 | Mineo et al., 1993 | IFA (1:1000) WB (1:1000) | |
| Antibody | Rabbit-αSERCA | Nagamune et al., 2007 | IFA (1:1,000) WB (1:1000) | |
| Antibody | Rabbit-αGap45 | Gaskins et al., 2004 | IFA (1:1000) WB (1:1000) | |
| Antibody | Mouse-αTubulin | Sigma Aldrich | Cat#11867423001 | WB (1:10,000) |
| Antibody | Mouse-αHA | Roche | Cat#11867423001 | IFA (1:1000) |
| Antibody | Alexa Fluor 488 | Thermo Fisher Scientific | Cat#A20181 | IFA (1:1000) |
| Antibody | Alexa Fluor 546 | Thermo Fisher Scientific | Cat#A20183 | IFA (1:1000) |
| Cell line | ΔTgTRPPL-2 | This work | Silvia Moreno (University of Georgia) | Clonal cell line with the TgGT1_310560 disrupted Validated through genomic amplification, qPCR, IFAs, and WB |
| Cell line | TgTRPPL-2-smHA | This work | Silvia Moreno (University of Georgia) | Clonal cell line with the TgGT1_310560 gene locus tagged Validated through genomic amplification, IFAs, and WB |
| Cell line | ΔTgTRPPL-2-trppl2 | This work | Silvia Moreno (University of Georgia) | Clonal cell line with the TgGT1_310560 disrupted and expressing an extra copy of the same gene Validated through genomic amplification, qPCR IFAs, and WB |
| Cell line | RHTatiΔku80 | Sheiner et al., 2011 | Parental line used for tagging | |
| Recombinant DNA reagent | TgTRPPL-2-smHA | This work | Plasmid used to C-terminally tag TgGT1_310560 | |
| Recombinant DNA reagent | pMOS003-lenti-CMV-gCaMPer | Henderson et al., 2015 | RRID:Addgene #65227 |
Additional files
-
Source data 1
Original blots.
- https://cdn.elifesciences.org/articles/63417/elife-63417-data1-v2.zip
-
Supplementary file 1
Top 10 hits resulting from the analysis of the TgGT1_310560 gene with the HHPRED server.
- https://cdn.elifesciences.org/articles/63417/elife-63417-supp1-v2.docx
-
Supplementary file 2
Mass spectrometry results of the sliced band after immunoprecipitation of TgTRPPL-2.
- https://cdn.elifesciences.org/articles/63417/elife-63417-supp2-v2.docx
-
Supplementary file 3
Primers used in this work.
- https://cdn.elifesciences.org/articles/63417/elife-63417-supp3-v2.docx
-
Supplementary file 4
Composition of the solutions used for the electrophysiological analysis.
- https://cdn.elifesciences.org/articles/63417/elife-63417-supp4-v2.docx
-
Transparent reporting form
- https://cdn.elifesciences.org/articles/63417/elife-63417-transrepform-v2.pdf
Download links
A two-part list of links to download the article, or parts of the article, in various formats.
Downloads (link to download the article as PDF)
Open citations (links to open the citations from this article in various online reference manager services)
Cite this article (links to download the citations from this article in formats compatible with various reference manager tools)
Calcium signaling through a transient receptor channel is important for Toxoplasma gondii growth
eLife 10:e63417.
https://doi.org/10.7554/eLife.63417


