Structural basis for human TRPC5 channel inhibition by two distinct inhibitors
- State Key Laboratory of Membrane Biology, College of Future Technology, Institute of Molecular Medicine, Beijing Key Laboratory of Cardiometabolic Molecular Medicine, Peking University, China
- Peking-Tsinghua Center for Life Sciences, Peking University, China
- Academy for Advanced Interdisciplinary Studies, Peking University, China
Figures
Figure 1 with 7 supplements
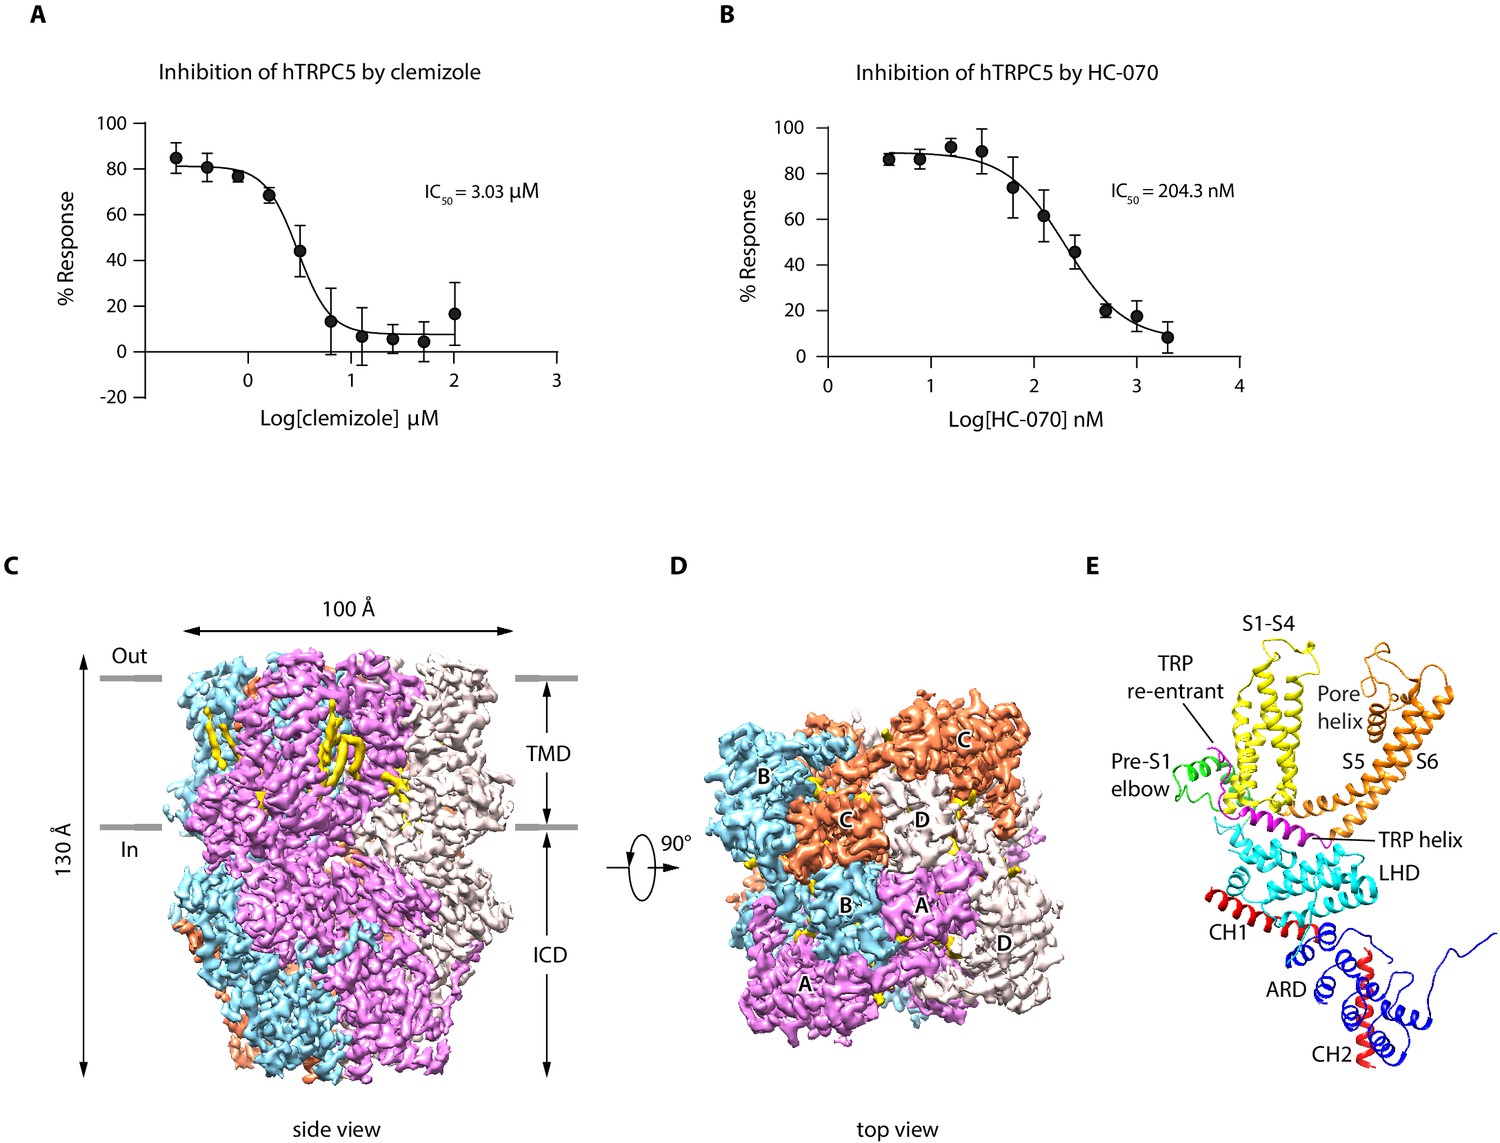
Overall structure of human TRPC5 (hTRPC5).
(A, B) Inhibitory effect of clemizole (CMZ) (A) and HC-070 (B) on the extracellular calcium-induced intracellular calcium increase of cells with wild-type hTRPC5 over-expression measured by FLIPR calcium assay (data are shown as means ± standard error, n = 3 independent experiments). (C, D) Cryo-EM density maps of CMZ-bound hTRPC5 shown in side view (C) and top view (D). Subunits A, B, C, and D are colored in purple, light blue, orange, and gray, respectively. Lipids are colored in gold. The approximate boundary of the cell membrane is indicated by gray lines. TMD, transmembrane domain; ICD, intracellular cytosolic domain. (E) Ribbon diagram of a single subunit with secondary structure elements represented in different colors. ARD, ankyrin repeats domain; LHD, linker-helix domain; CH1, C-terminal helix 1; CH2, C-terminal helix 2.
-
Figure 1—source data 1
Inhibition of WT hTRPC5 by clemizole or by HC-070.
- https://cdn.elifesciences.org/articles/63429/elife-63429-fig1-data1-v2.xlsx
Figure 1—figure supplement 1
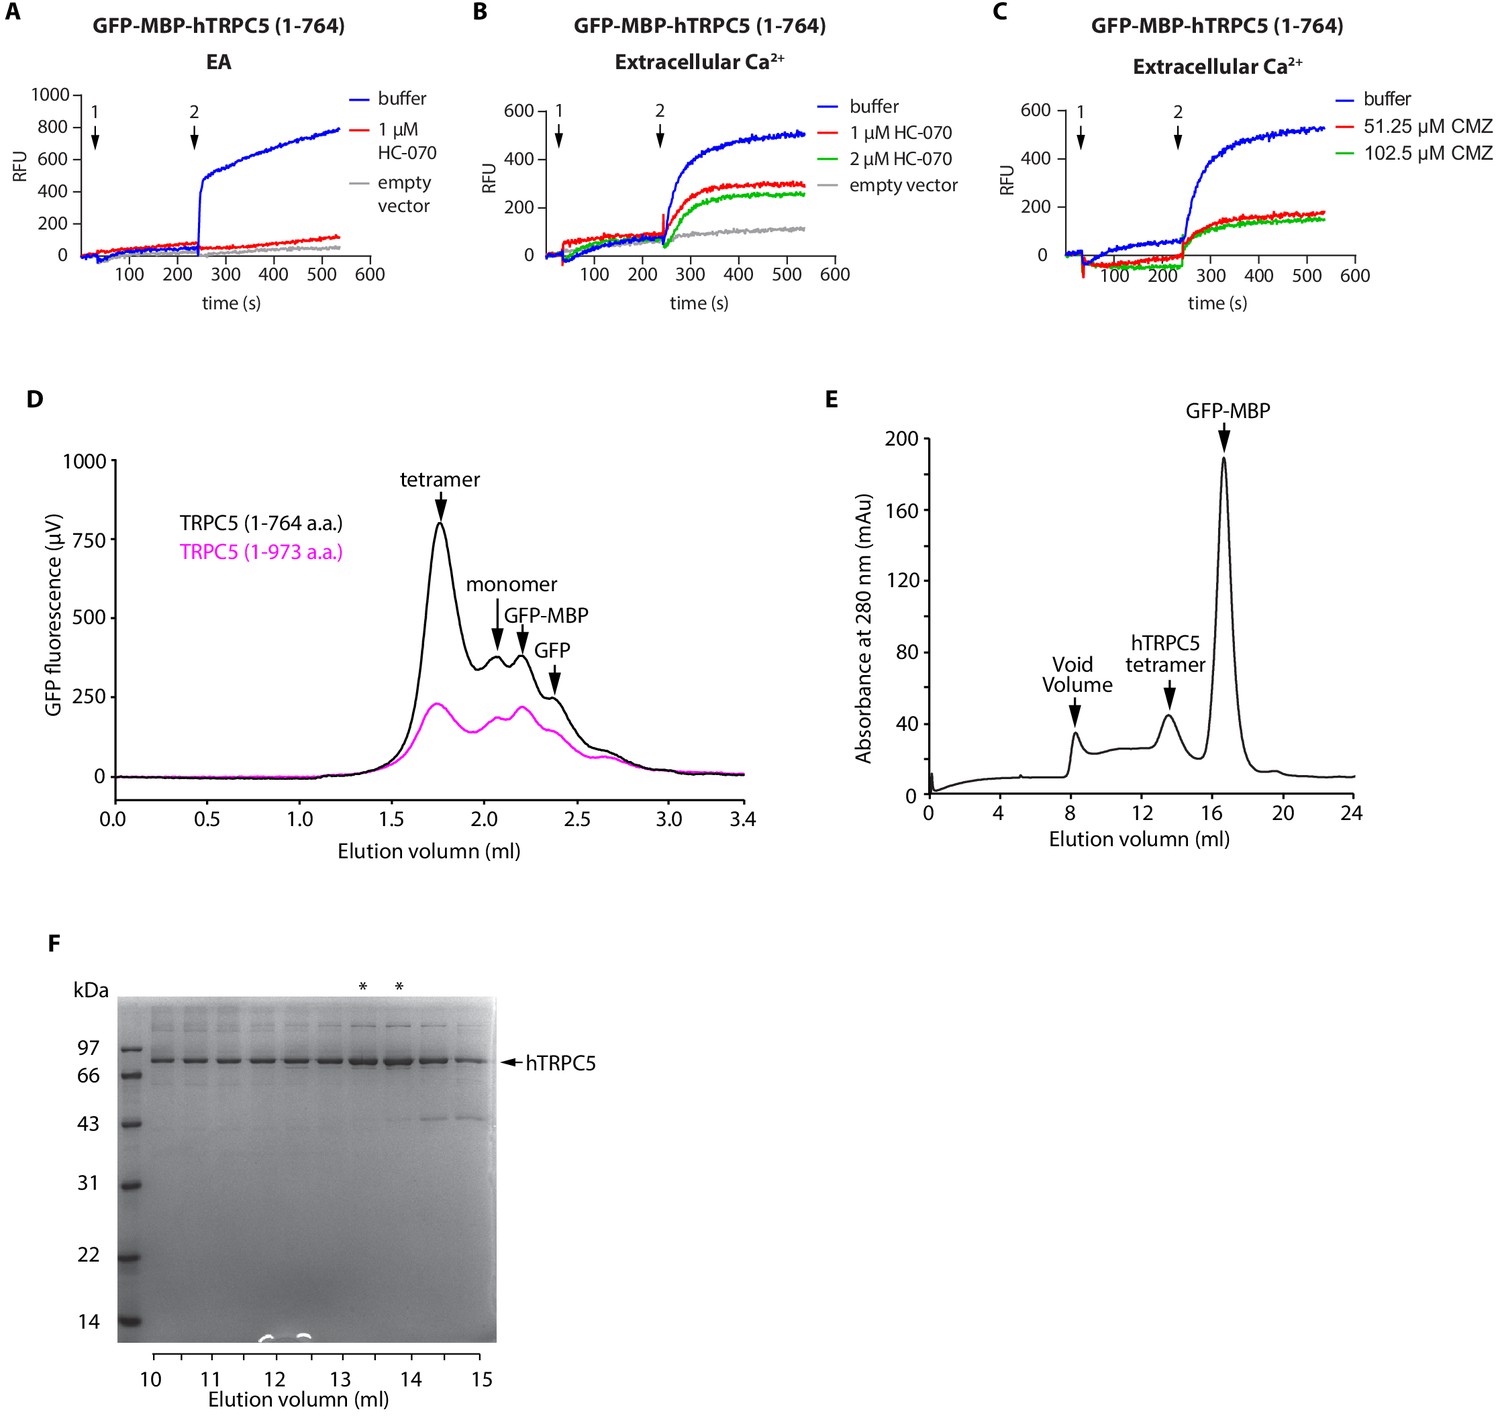
Biochemical and functional characterization of human TRPC5 (hTRPC5) constructs.
(A–C) Representative intracellular calcium signal of AD293 cells transfected with hTRPC5(1-764) evoked by 256 nM EA (A) or 14 mM extracellular calcium (B, C), and inhibited by different concentrations of HC-070 (B) or clemizole (CMZ) (C), measured by FLIPR calcium assay. Arrow 1 denotes the time point for application of buffer alone or buffer with inhibitors; arrow 2 denotes the time point for application of the activators. (D) Fluorescence size exclusion chromatography profile of full-length hTRPC5 and hTRPC5(1-764). (E) Representative size exclusion chromatography of hTRPC5(1-764) purified in glycol-diosgenin (GDN) micelles. (F) SDS-PAGE gel of hTRPC5(1-764) eluted from size exclusion chromatography. The position of TRPC5 is labeled. Fractions that were pooled for cryo-EM analysis are denoted by asterisks.
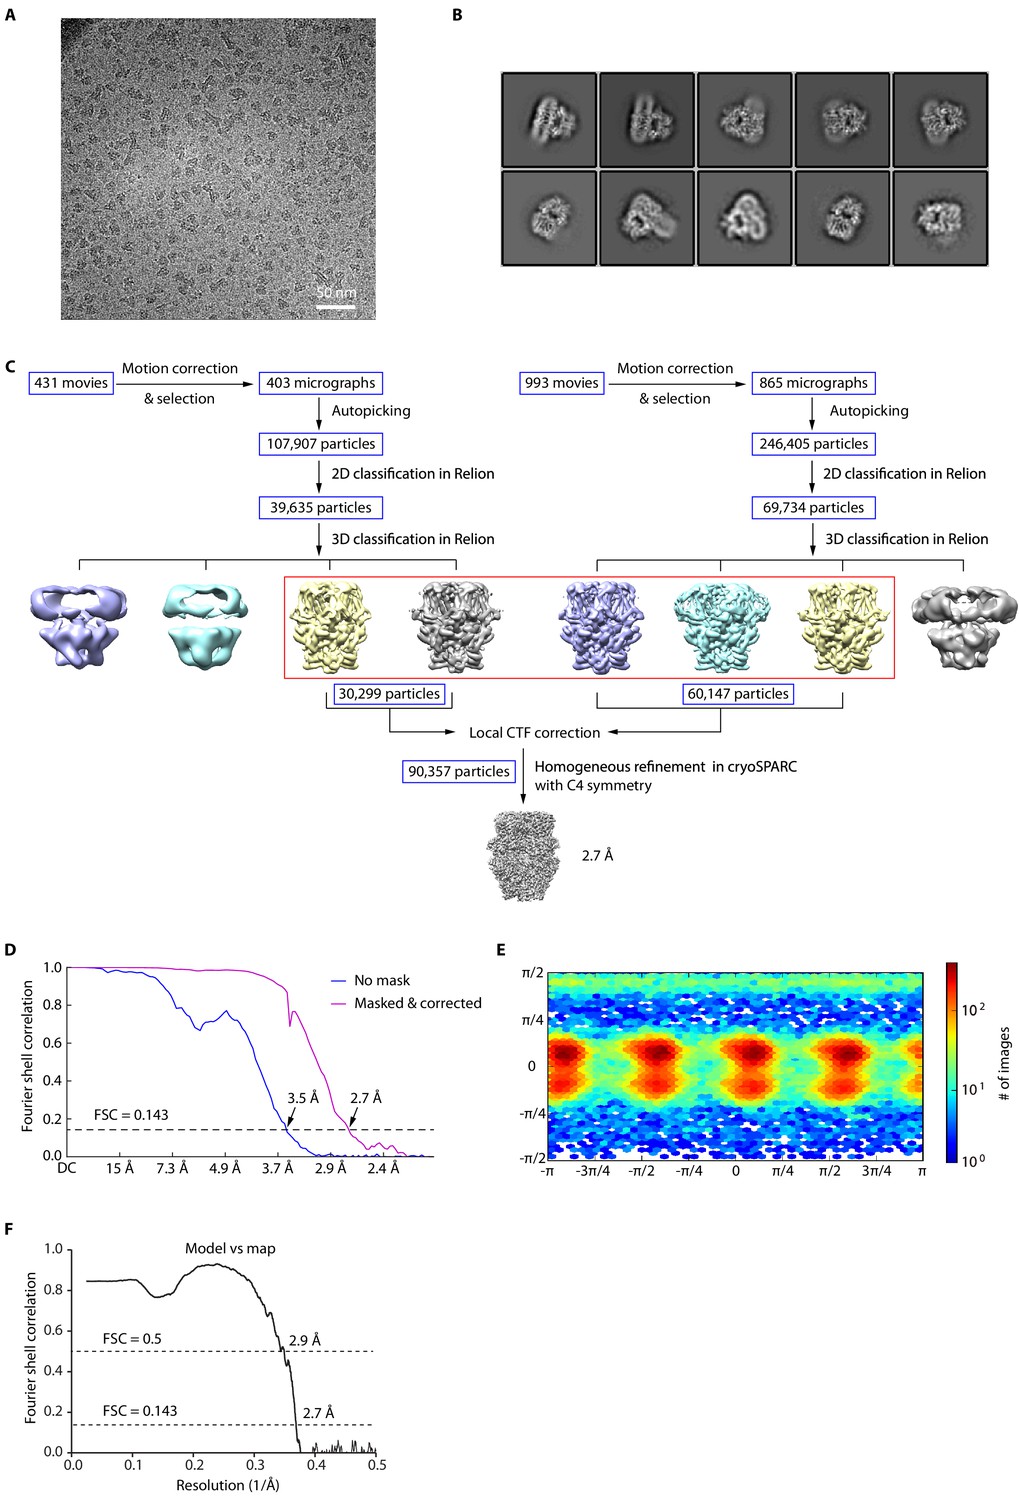
Figure 1—figure supplement 2

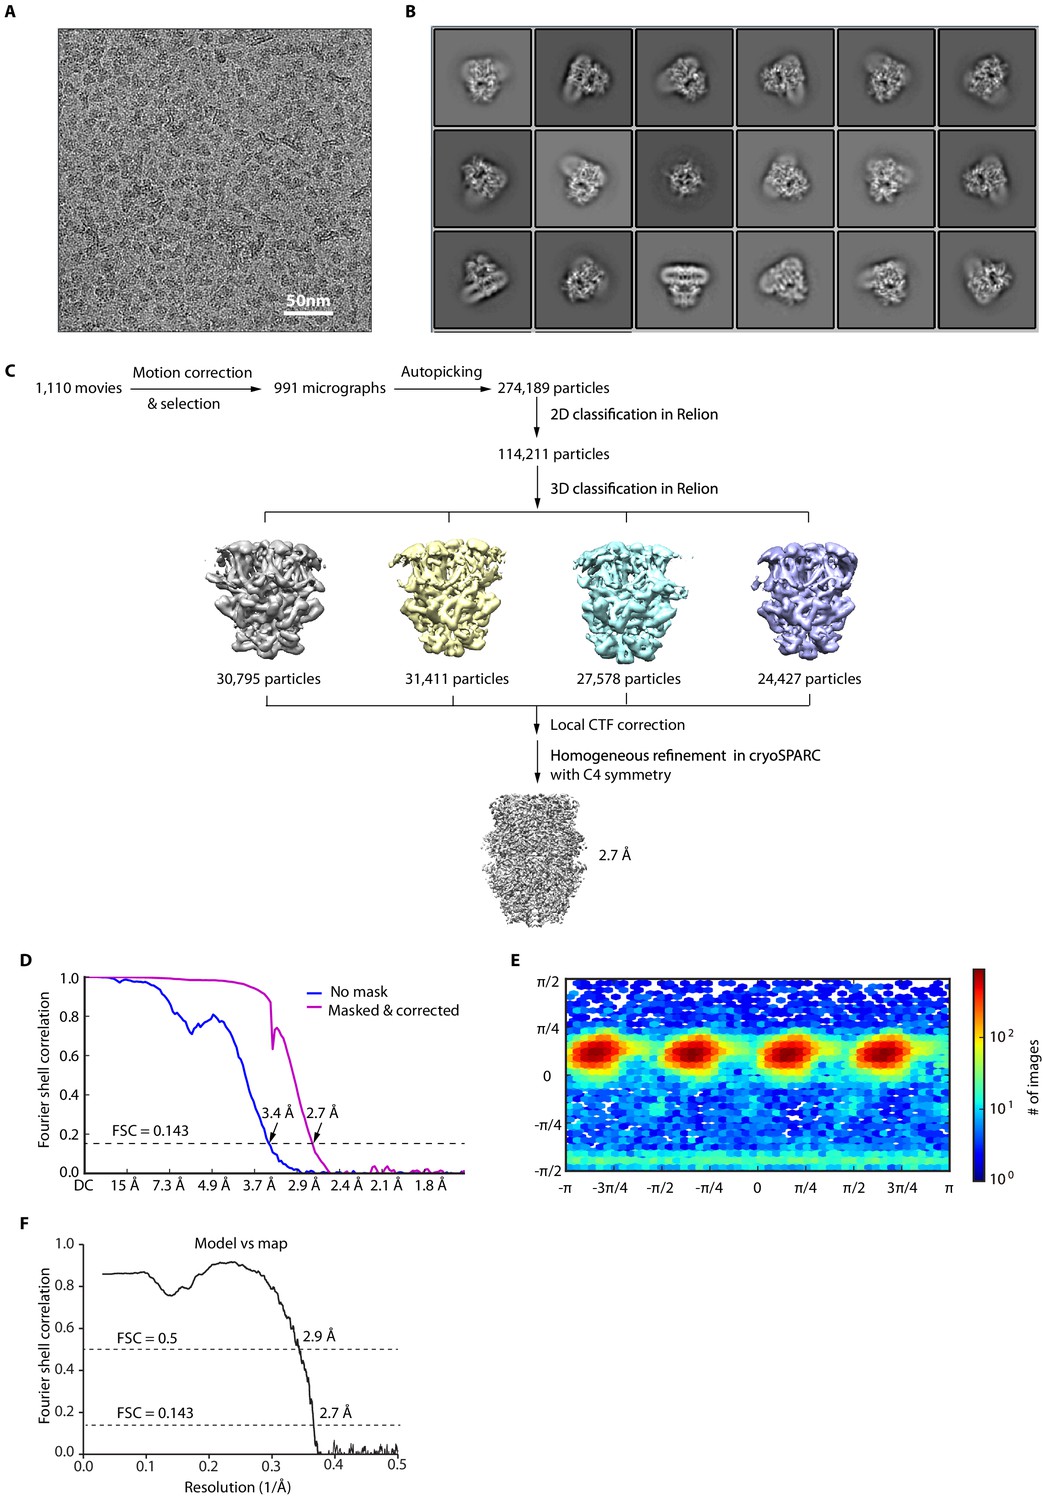
Cryo-EM image analysis of apo human TRPC5 (hTRPC5).
(A) Representative raw micrograph recorded on K2 Summit camera. (B) Representative 2D class averages of apo hTRPC5. (C) Flowchart for cryo-EM data processing of apo hTRPC5. (D) Fourier shell correlation (FSC) curves of the two independently refined maps for unmasked (blue line, 3.9 Å) and corrected (purple line, 3 Å). Resolution estimation was based on the criterion of FSC 0.143 cut-off. (E) Angular distribution of clemizole (CMZ)-bound hTRPC5. This is a standard output from cryoSPARC. (F) FSC curve of the refined model versus EM map.
Figure 1—figure supplement 3
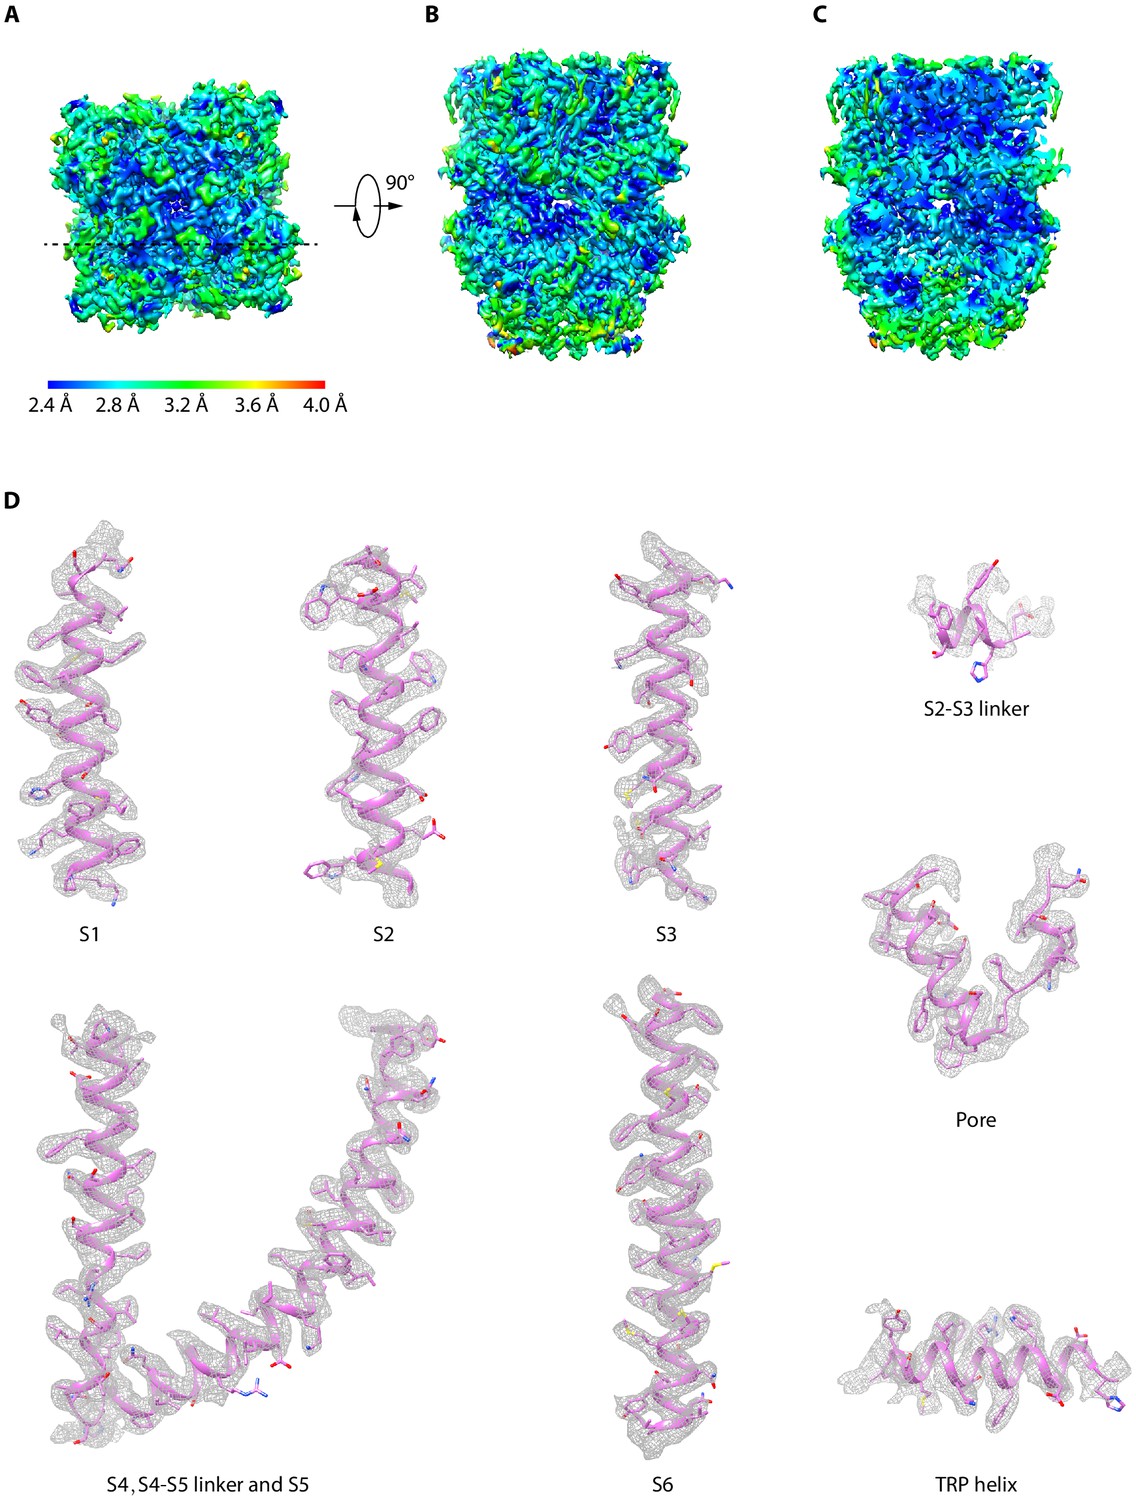
Cryo-EM map of apo human TRPC5 (hTRPC5).
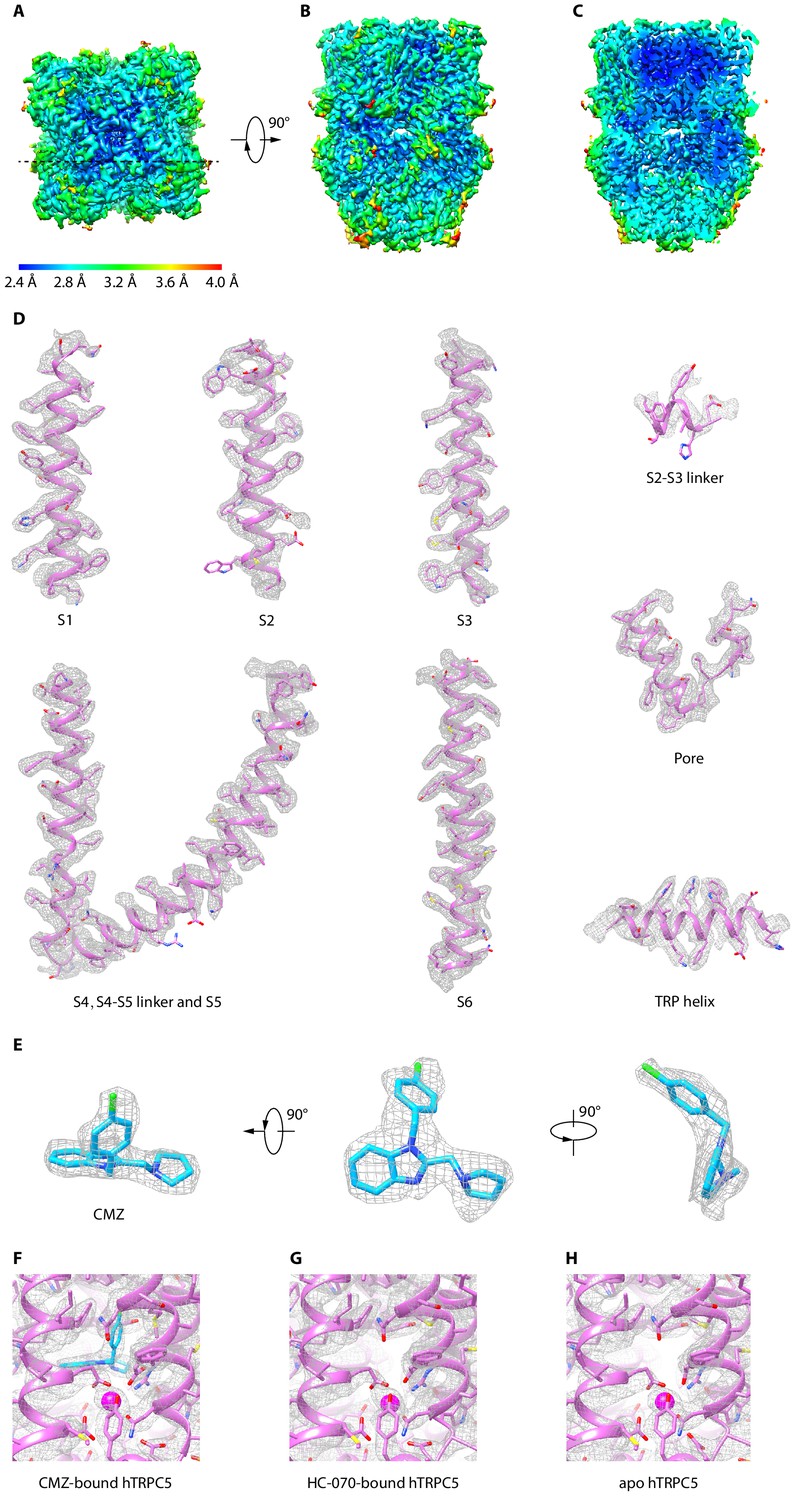
(A–C) Cryo-EM map of apo hTRPC5 colored by local resolution, shown in top view (A), side view (B), and cross-section (C). The position of cross-section is shown as a dashed line in (A). (D) Cryo-EM density map (contoured at 4.1 σ, gray mesh) with atomic models superimposed.
Figure 1—figure supplement 4
Cryo-EM image analysis of clemizole (CMZ)-bound human TRPC5 (hTRPC5).
(A) Representative raw micrograph recorded on K2 Summit camera. (B) Representative 2D class averages of CMZ-bound hTRPC5. (C) Flowchart for cryo-EM data processing of CMZ-bound hTRPC5. (D) Fourier shell correlation (FSC) curves of the two independently refined maps for unmasked (blue line, 3.5 Å) and corrected (purple line, 2.7 Å). Resolution estimation was based on the criterion of FSC 0.143 cut-off. (E) Angular distribution of CMZ-bound hTRPC5. This is a standard output from cryoSPARC. (F) FSC curve of the refined model versus EM map.
Figure 1—figure supplement 5
Cryo-EM map of clemizole (CMZ)-bound human TRPC5 (hTRPC5).
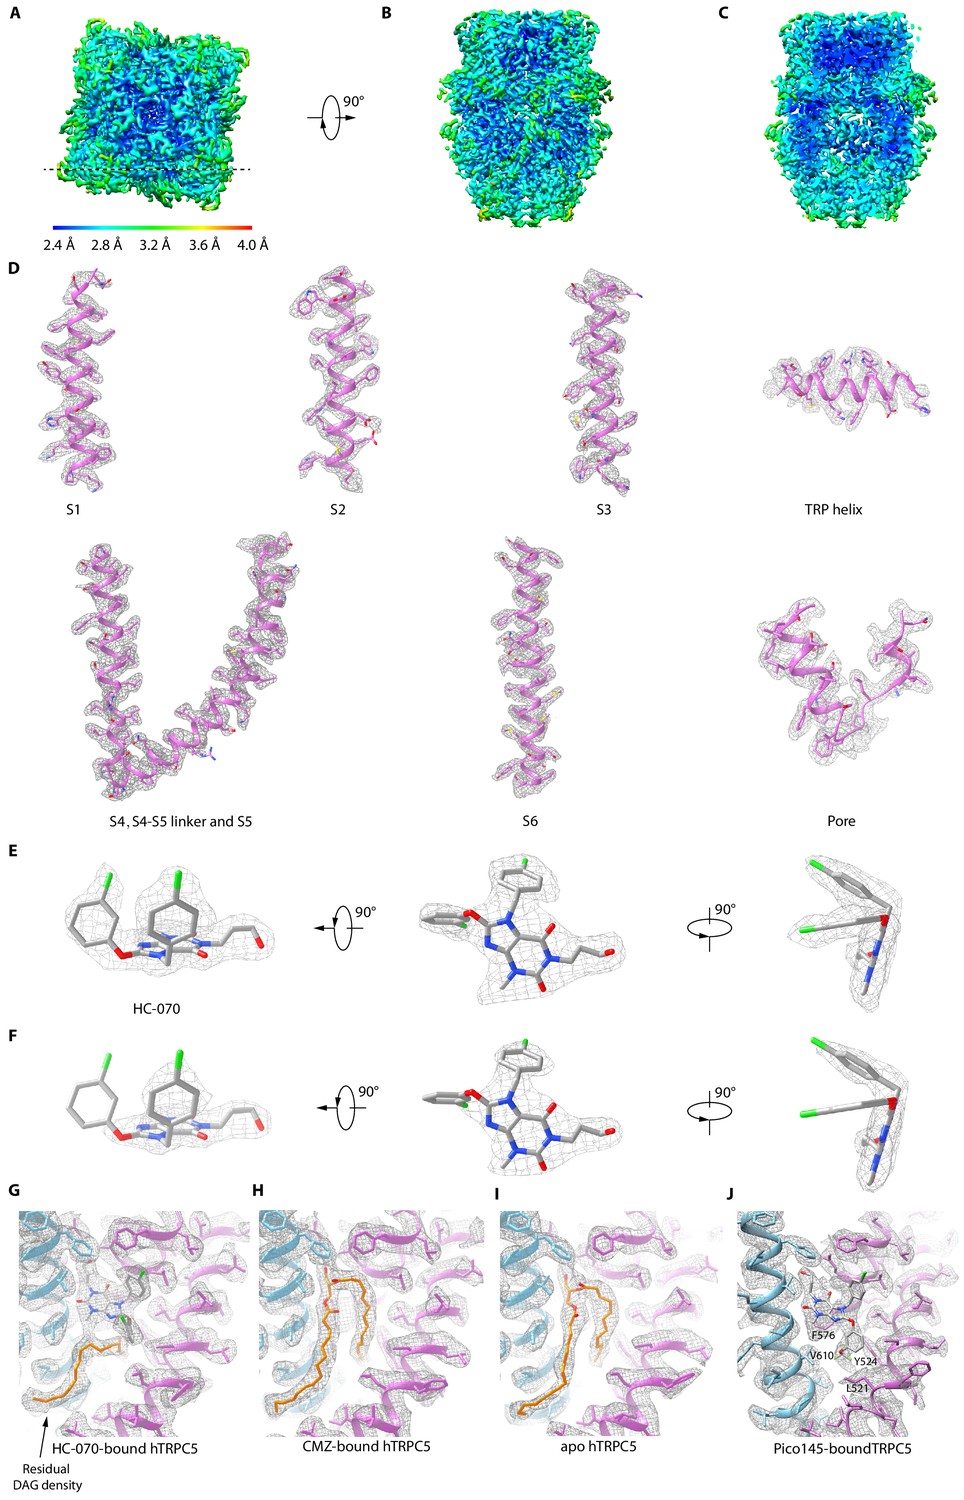
(A–C) Cryo-EM map of CMZ-bound hTRPC5 colored by local resolution, shown in top view (A), side view (B), and cross-section (C). The position of cross-section is shown as a dashed line in (A). (D) Cryo-EM density map (contoured at 3.8 σ, gray mesh) with atomic models superimposed. (E) Cryo-EM density of CMZ shown in different views (contoured at 3.7 σ). (F) Cryo-EM densities of CMZ-binding pocket in CMZ-bound hTRPC5 map (contoured at 4.6 σ). (G, H) Cryo-EM densities in HC-070-bound hTRPC5 and apo hTRPC5 maps corresponding to the CMZ-binding pocket contoured at the same σ as in (F).
Figure 1—figure supplement 6
Cryo-EM image analysis of HC-070-bound human TRPC5 (hTRPC5).
(A) Representative raw micrograph recorded on K2 Summit camera. (B) Representative 2D class averages of HC-070-bound hTRPC5. (C) Flowchart for cryo-EM data processing of HC-070-bound hTRPC5. (D) Fourier shell correlation (FSC) curves of the two independently refined maps for unmasked (blue line, 3.4 Å) and corrected (purple line, 2.7 Å). Resolution estimation was based on the criterion of FSC 0.143 cut-off. (E) Angular distribution of HC-070-bound hTRPC5. This is a standard output from cryoSPARC. (F) FSC curve of the refined model versus EM map.
Figure 1—figure supplement 7
Cryo-EM map of HC-070-bound human TRPC5 (hTRPC5).
(A–C) Cryo-EM map of HC-070-bound hTRPC5 colored by local resolution, shown in top view (A), side view (B), and cross-section (C). The position of cross-section is shown as dashed line in (A). (D) Cryo-EM density map (contoured at 3 σ, gray mesh) with atomic model superimposed. (E–F) Cryo-EM density map of HC-070 shown in different views contoured at 3 and 7 σ, respectively. (G–J) Cryo-EM densities of HC-070-binding pocket in (G) HC-070-bound, (H) clemizole (CMZ)-bound, (I) apo, and (J) Pico145-bound hTRPC5 maps, contoured at 3.8 σ.
Figure 2 with 2 supplements
Clemizole (CMZ) binding site in human TRPC5 (hTRPC5).
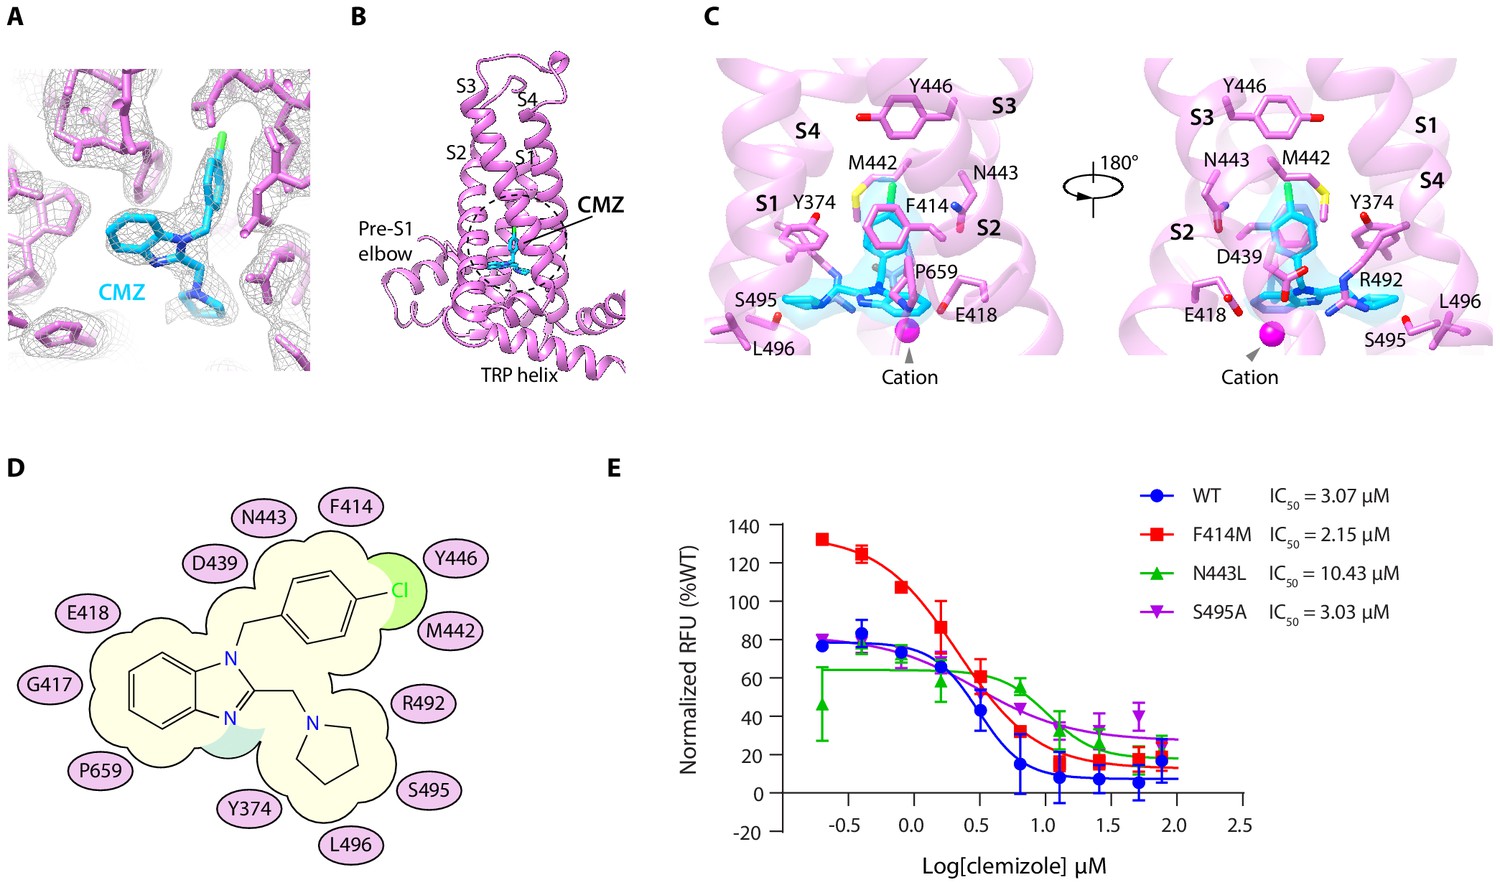
(A) Densities of CMZ and nearby residues. The map is contoured at 5.0 σ (gray mesh). CMZ and hTRPC5 are shown as sticks, colored in sky blue and purple, respectively. (B) Overview of the CMZ-binding site in hTRPC5. The dashed region denotes the binding pocket of CMZ. (C) Close-up view of the CMZ-binding site. CMZ is shown as transparent surface superimposed with sticks. Side chains of residues that interact with CMZ are shown as sticks. A cation near CMZ is shown as a magenta sphere. (D) Cartoon representation of the interactions between CMZ and hTRPC5. S1-S4 of subunit A are represented as purple ovals. Residues that interact with CMZ are labeled inside the ovals. (E) Inhibitory effect of CMZ on various hTRPC5 mutants, measured by FLIPR calcium assay (data are shown as means ± standard error, n = 3 independent experiments).
-
Figure 2—source data 1
Inhibitory effect of CMZ on various hTRPC5 mutants.
- https://cdn.elifesciences.org/articles/63429/elife-63429-fig2-data1-v2.xlsx
Figure 2—figure supplement 1
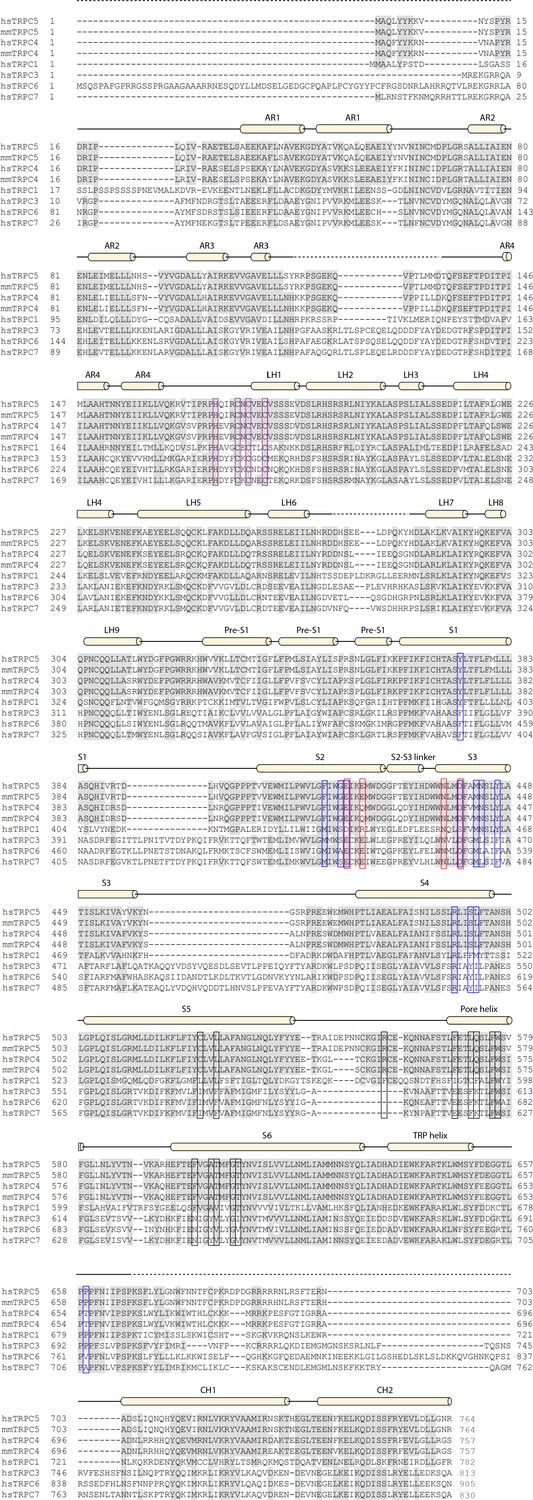
Sequence alignments of the transient receptor potential canonical (TRPC) channels.
Conserved residues are colored in gray. Secondary structures are indicated as cylinders (α helices) and lines (loops). Unmodeled residues are indicated as dashed line. Residues of clemizole (CMZ)-binding site, HC-070-binding site, voltage sensor-like domain (VSLD’s) cation-binding site, and zinc-binding site in CTD are indicated with blue boxes, black boxes, red boxes, and purple boxes, respectively.
Figure 2—figure supplement 2
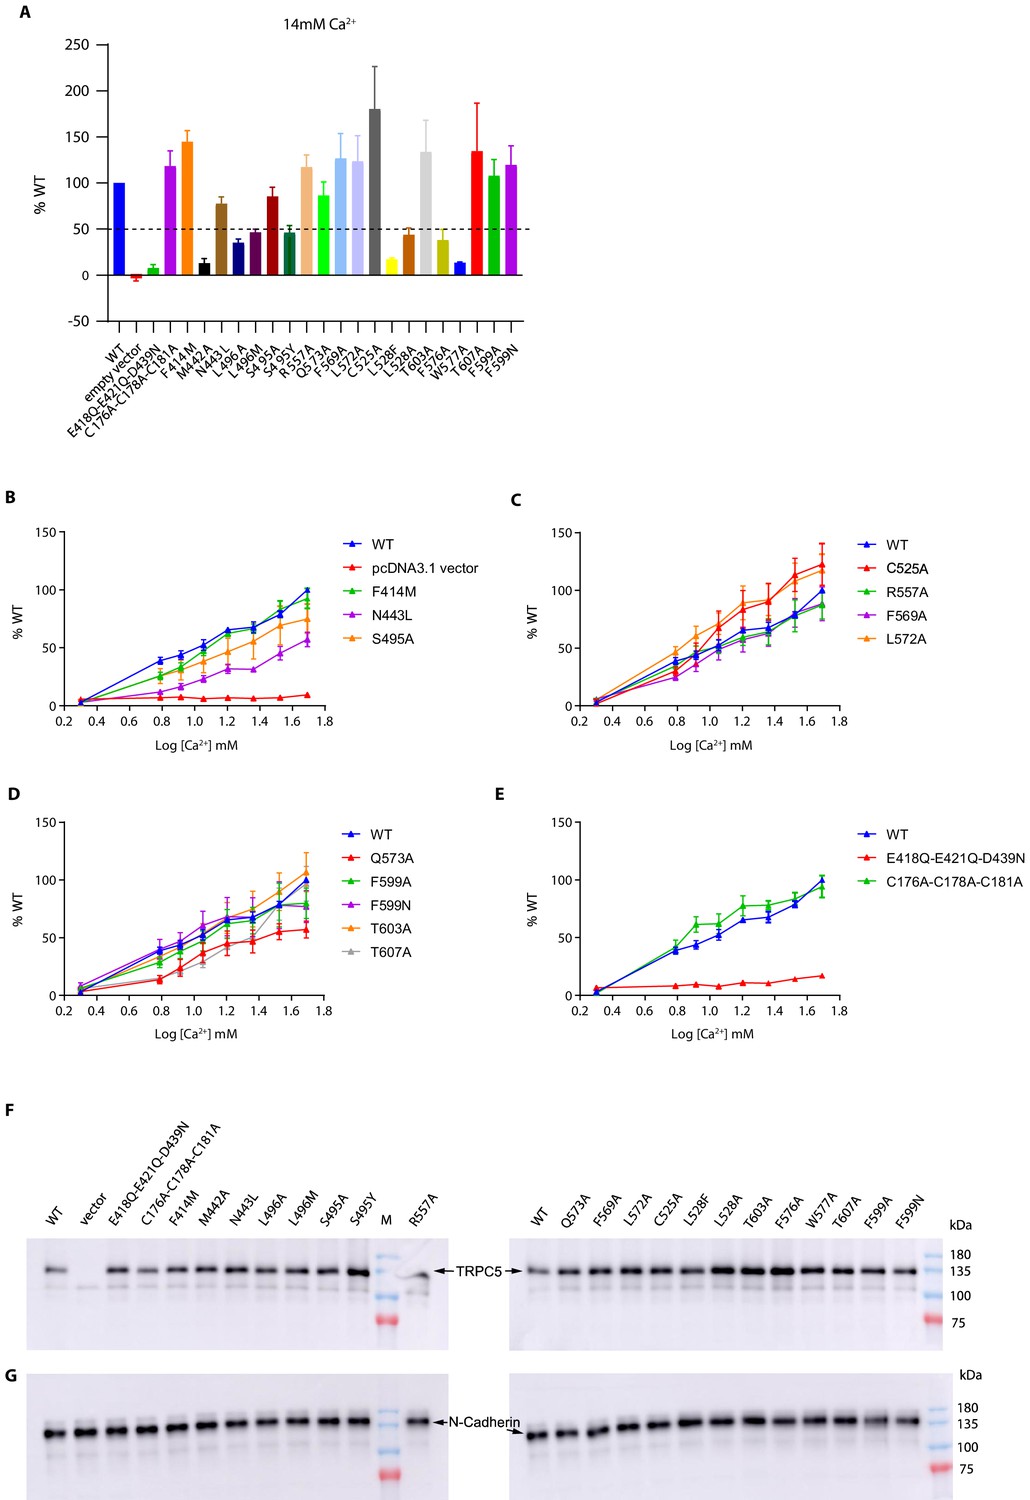
Functional characterization of human TRPC5 (hTRPC5) mutants.
(A) The activation of hTRPC5 mutants by 14 mM Ca2+ were normalized to wild-type channel (data are shown as means ± standard error, n = 3 independent experiments). (B–E) The dose-response curve of hTRPC5 mutants by extracellular Ca2+ were normalized to wild-type channel (data are shown as means ± standard error, n = 3 independent experiments). (F–G) Surface expression levels of wild-type and hTRPC5 mutants by western blot. The biotinylated protein was detected by anti-TRPC5 antibody in (F) and anti-N-cadherin antibody in (G).
-
Figure 2—figure supplement 2—source data 1
Activation of hTRPC5 mutants by 14 mM Ca2+ normalized to wild type hTRPC5.
- https://cdn.elifesciences.org/articles/63429/elife-63429-fig2-figsupp2-data1-v2.xlsx
-
Figure 2—figure supplement 2—source data 2
Activation of hTRPC5 mutants by extracellular Ca2+ normalized to wild type hTRPC5.
- https://cdn.elifesciences.org/articles/63429/elife-63429-fig2-figsupp2-data2-v2.xlsx
Figure 3

HC-070 binding site in human TRPC5 (hTRPC5).
(A) Densities within the HC-070-binding site. The map is contoured at 3 σ (gray mesh). HC-070 and hTRPC5 are shown in sticks, with HC-070 colored in gray. Subunits A and B are colored in purple and light blue, respectively. (B) Overview of the HC-070-binding site in hTRPC5. The dashed region marks the binding pocket of HC-070. (C) Close-up view of the HC-070-binding site. HC-070 is shown as transparent surface superimposed with stick model. Side chains of residues that interact with HC-070 are shown as sticks. (D) Cartoon representation of the interactions between HC-070 and hTRPC5. S5 of subunit A and S6 of subunit B are represented as purple and light blue ovals, respectively. Residues that interact with HC-070 are labeled inside the ovals. (E, F) Inhibitory effect of HC-070 on various hTRPC5 mutants, measured by FLIPR calcium assay (data are shown as means ± standard error, n = 3 independent experiments).
-
Figure 3—source data 1
Inhibitory effect of HC-070 on various hTRPC5 mutants.
- https://cdn.elifesciences.org/articles/63429/elife-63429-fig3-data1-v2.xlsx
Figure 4 with 3 supplements

Ion conduction pore and other nonprotein densities in human TRPC5 (hTRPC5) maps.
(A) Side view of the pore region of nonconductive hTRPC5 (clemizole [CMZ]-bound). Subunits A and C are shown as ribbon and colored the same as in Figure 1. Subunits B and D are omitted for clarity. Ion conduction pathway along the pore is shown as dots with key residues labeled, calculated by HOLE. Purple, green, and red dots define pore radii of >2.8, 1.4–2.8, and <1.4 Å, respectively. (B) Calculated pore radii of CMZ-bound hTRPC5, HC070-bound hTRPC5, and apo hTRPC5 are shown vertically. (C) Close-up view of the putative cation-binding site in transmembrane domain (TMD). Densities of the cation and the related residues are contoured at 4.6 σ and shown as gray mesh. The side chains of the residues that interact with the cation are shown as sticks. (D) Close-up view of the putative zinc-binding site in hTRPC5. Densities of the zinc ion and interacting residues are contoured at 4.3 σ and shown as gray mesh. (E) Other modeled nonprotein densities in TMD in CMZ-bound hTRPC5 are shown as sticks and colored the same as in Figure 1. (F) Close-up view of the putative diacylglycerol (DAG)-binding sites in hTRPC5. Densities of the DAG and interacting residues are contoured at 5 σ and shown as gray mesh. Residues that interact with DAG were labeled.
Figure 4—figure supplement 1
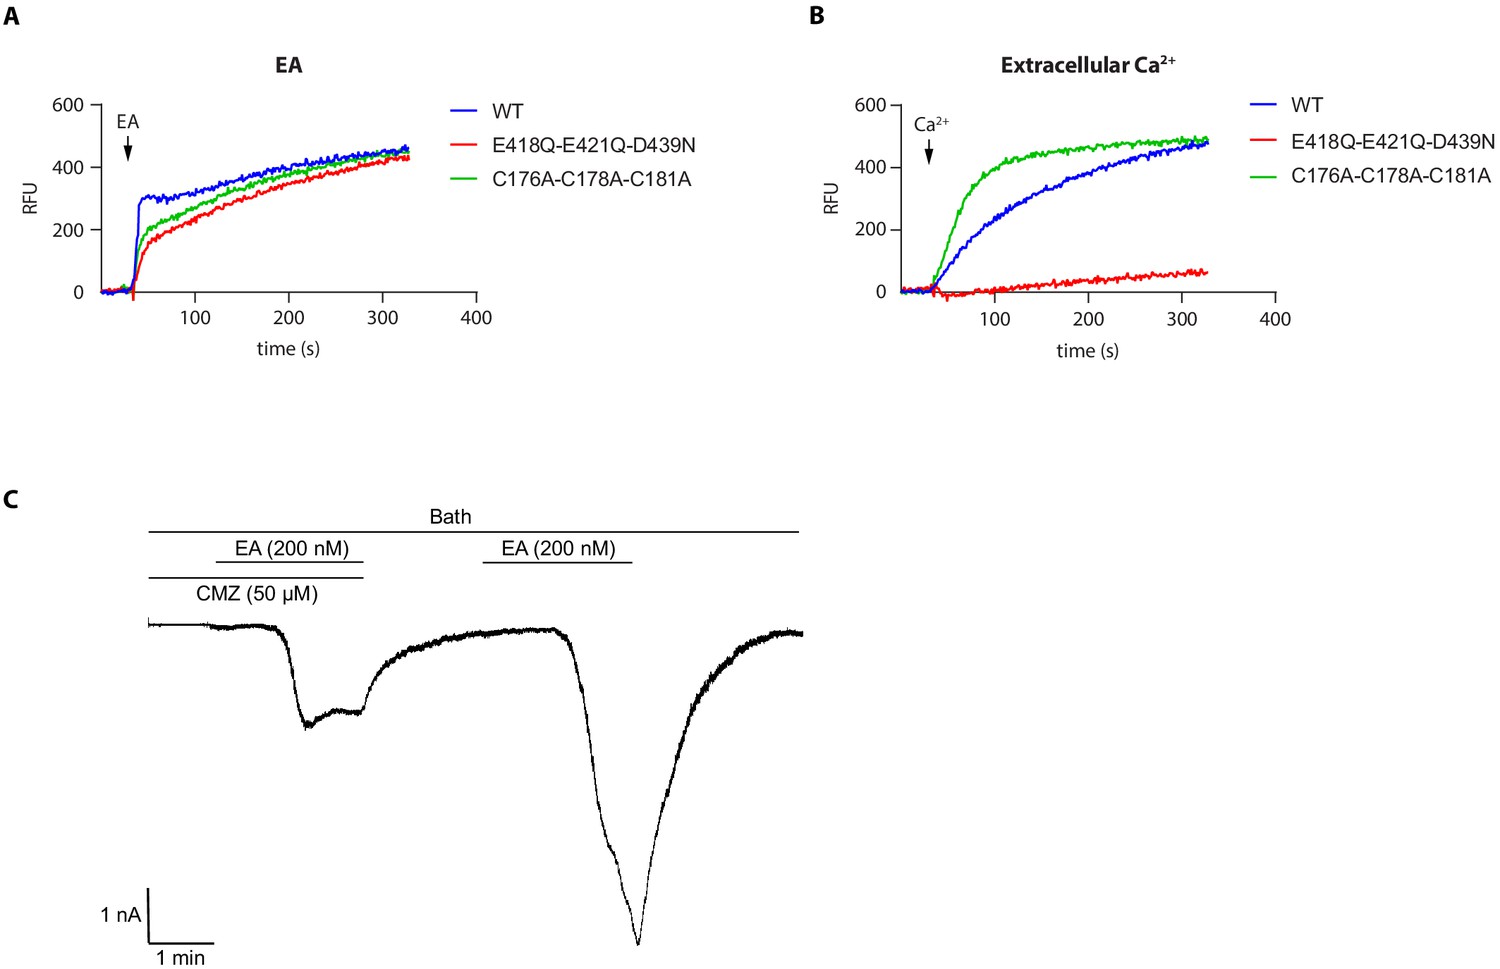
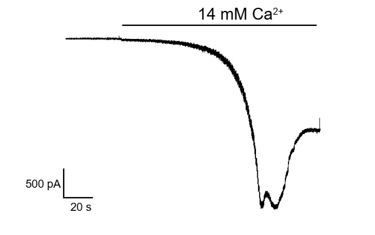
Functional characterization of various human TRPC5 (hTRPC5) mutants related to ion-binding sites.
(A–B) Representative intracellular calcium signal of AD293 cells transfected with wild-type or hTRPC5 mutant evoked by 256 nM EA (A) or 14 mM extracellular calcium (B), measured by FLIPR calcium assay. (C) Macroscopic currents of hTRPC5 recorded in whole-cell mode in calcium-free condition.
Figure 4—figure supplement 2
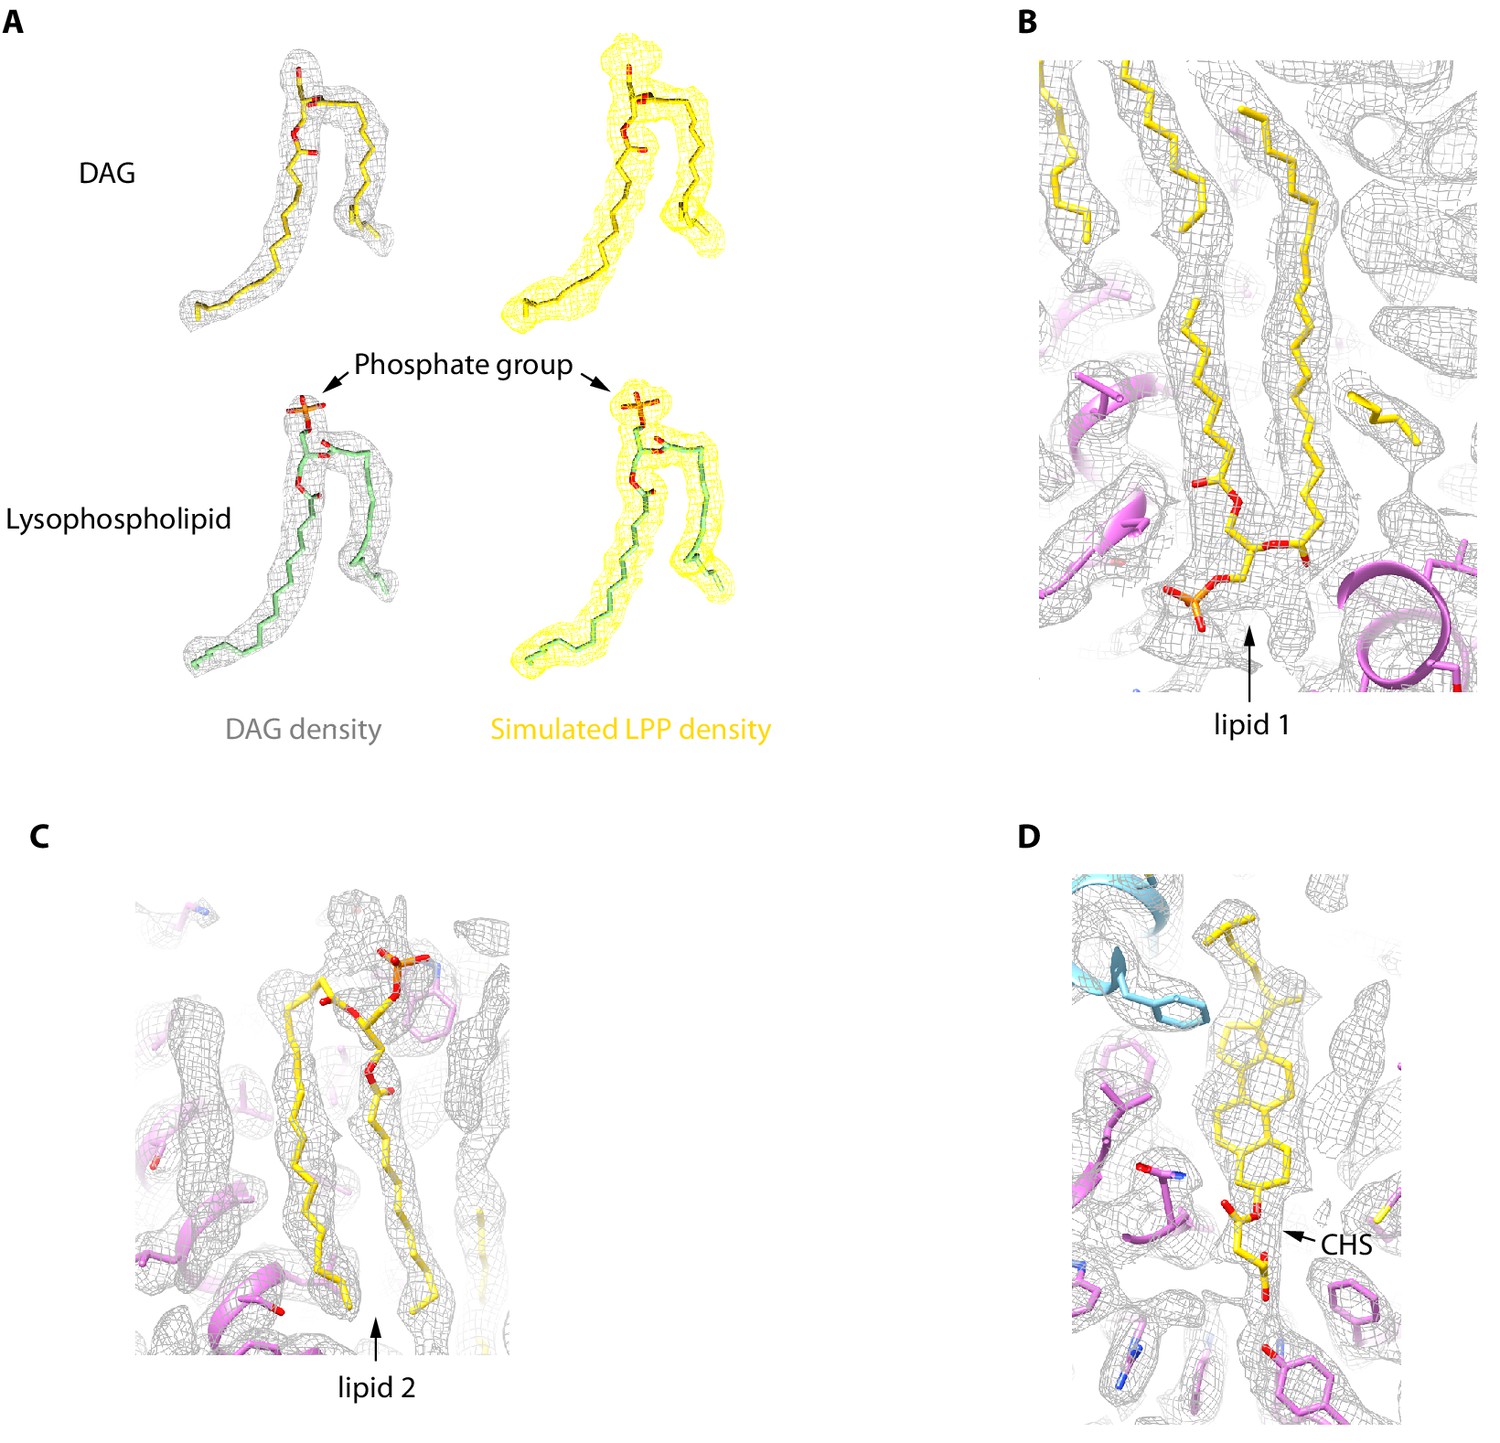
Lipid densities in human TRPC5 (hTRPC5) map.
(A) Comparison of experimental density map of diacylglycerol (DAG) (gray) (contoured at 3.2 σ) and simulated density map of lysophospholipid (yellow). Please note, the density for electron-dense phosphate head group is absent in the cryo-EM maps obtained experimentally. (B–D) Close-up views of lipid 1 (B), lipid 2 (C), and cholesteryl hemisuccinate (CHS) (D) binding sites. Subunits A and B are colored in purple and light blue, respectively. Residues that interact with lipids are shown as sticks. Insets show cryo-EM densities of these lipids, contoured at 2.3, 3.1, and 3.1 σ, respectively.
Figure 4—figure supplement 3
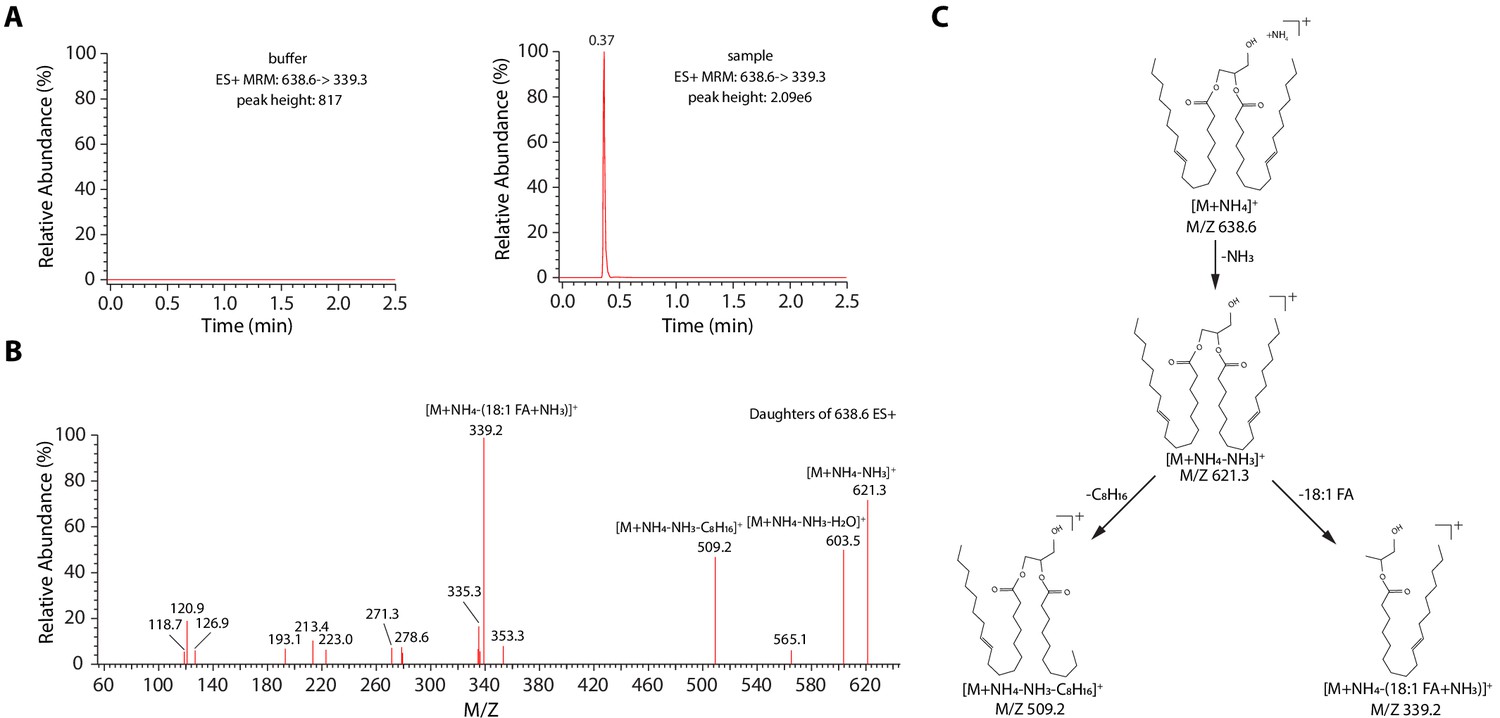
The identification of diacylglycerol (DAG) molecule in protein sample.
(A) The HPLC chromatography of DAG (18:1-18:1) under the MRM transition 638.6 -> 339.3 from buffer (left), and human TRPC5 (hTRPC5) sample (right). (B) MS/MS spectrum of lipid extractants from hTRPC5 sample. (C) Potential MS/MS fragmentation pattern of DAG, using 1,2-DAG as an example.
Figure 5
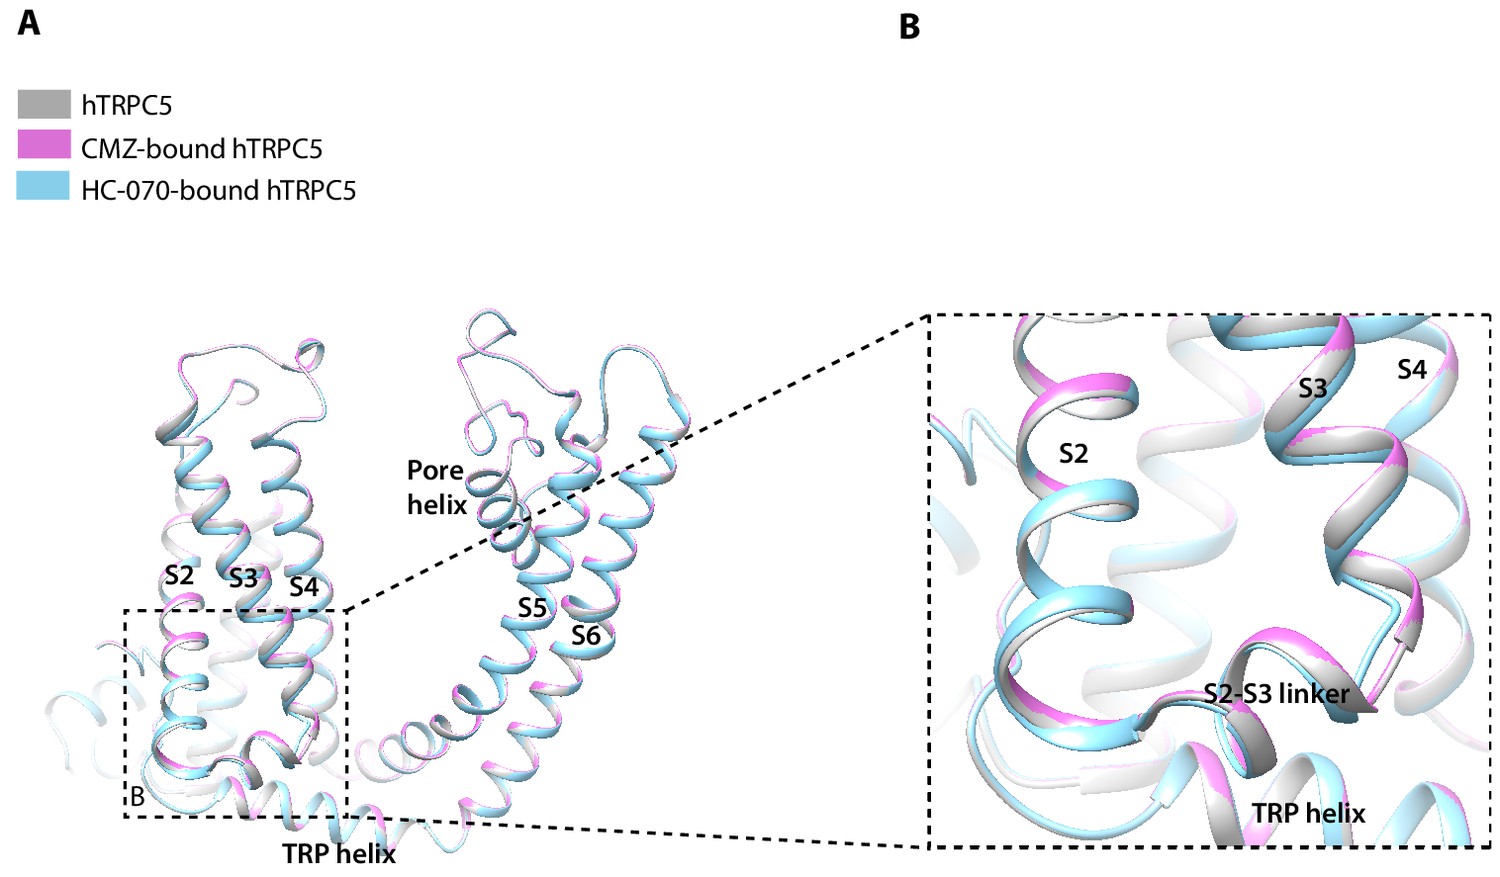
Structure comparison between clemizole (CMZ)-bound human TRPC5 (hTRPC5), HC-070-bound hTRPC5, and apo hTRPC5 in transmembrane domain (TMD).
(A) The overall conformational difference in TMD between these three structures. All the structures are shown as cartoon, with apo hTRPC5 colored in gray, CMZ-bound hTRPC5 in purple, and HC-070-bound hTRPC5 in light blue. (B) Close-up view of the structure variations of bottom of S3 segment and the S2-S3 linker between HC-070-bound and apo hTRPC5 structures.
Figure 6 with 2 supplements
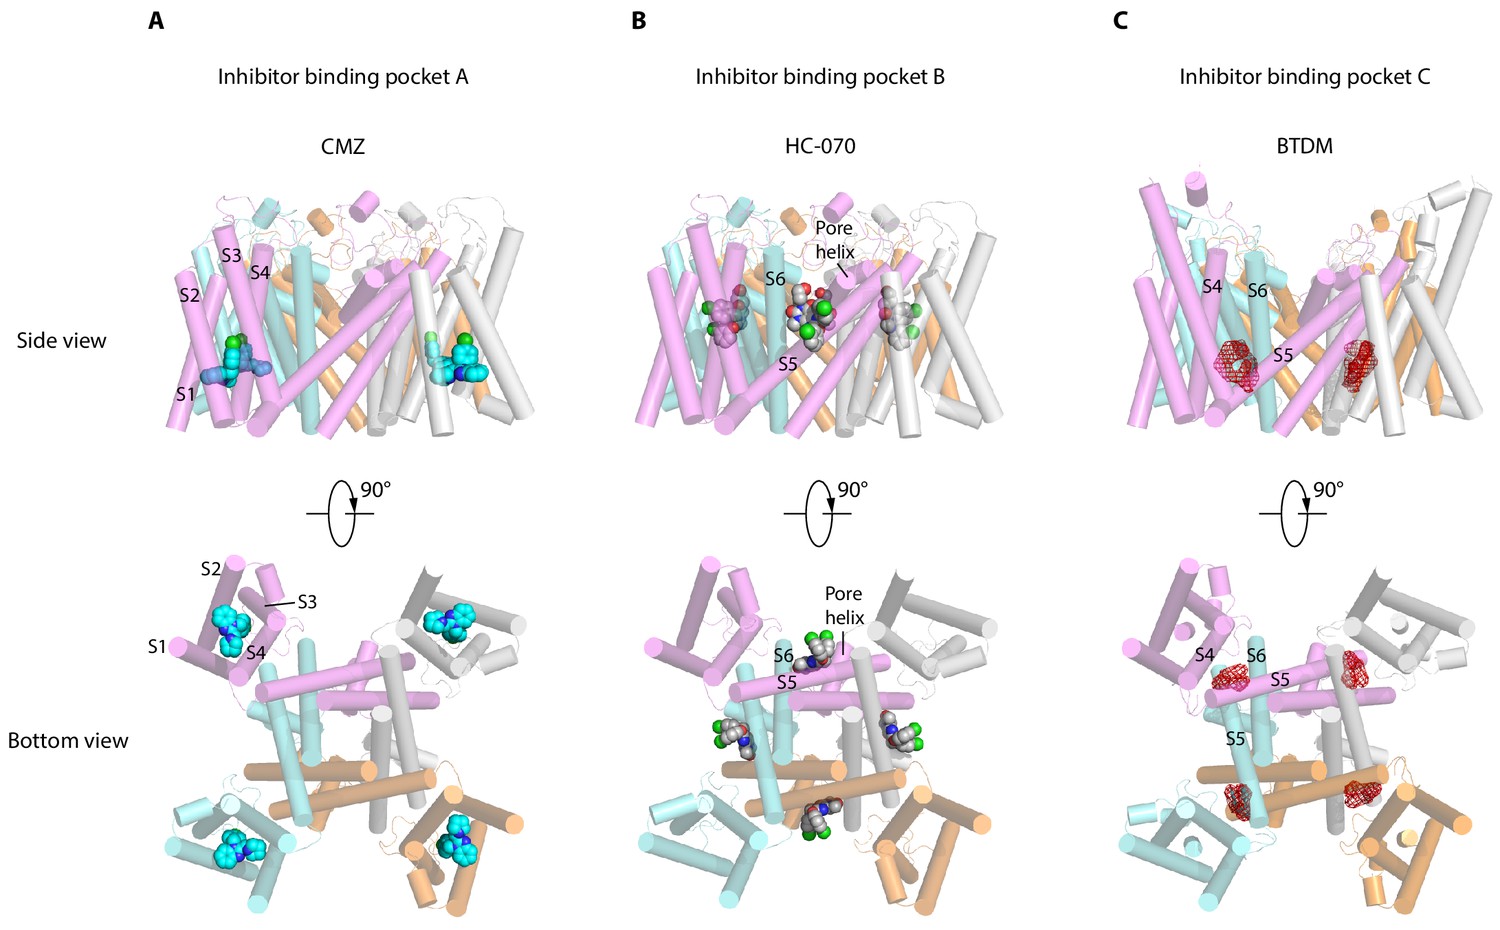
Inhibitor-binding pockets of transient receptor potential canonical (TRPCs) in transmembrane domain (TMD).
(A) Clemizole (CMZ)-binding pocket in human TRPC5 (hTRPC5) is shown in side view and bottom view. The TRPC5 structure is shown as cylinder with CMZ compound shown as spheres and colored in sky blue. Each subunit of TRPC5 is colored the same as in Figure 1. (B–C) HC-070-binding pocket in hTRPC5 structure and BTDM-binding pocket in TRPC6 structure are shown in side view and bottom view. HC-070 is shown as spheres and colored in gray. The densities of BTDM are shown as red mesh.
Figure 6—figure supplement 1
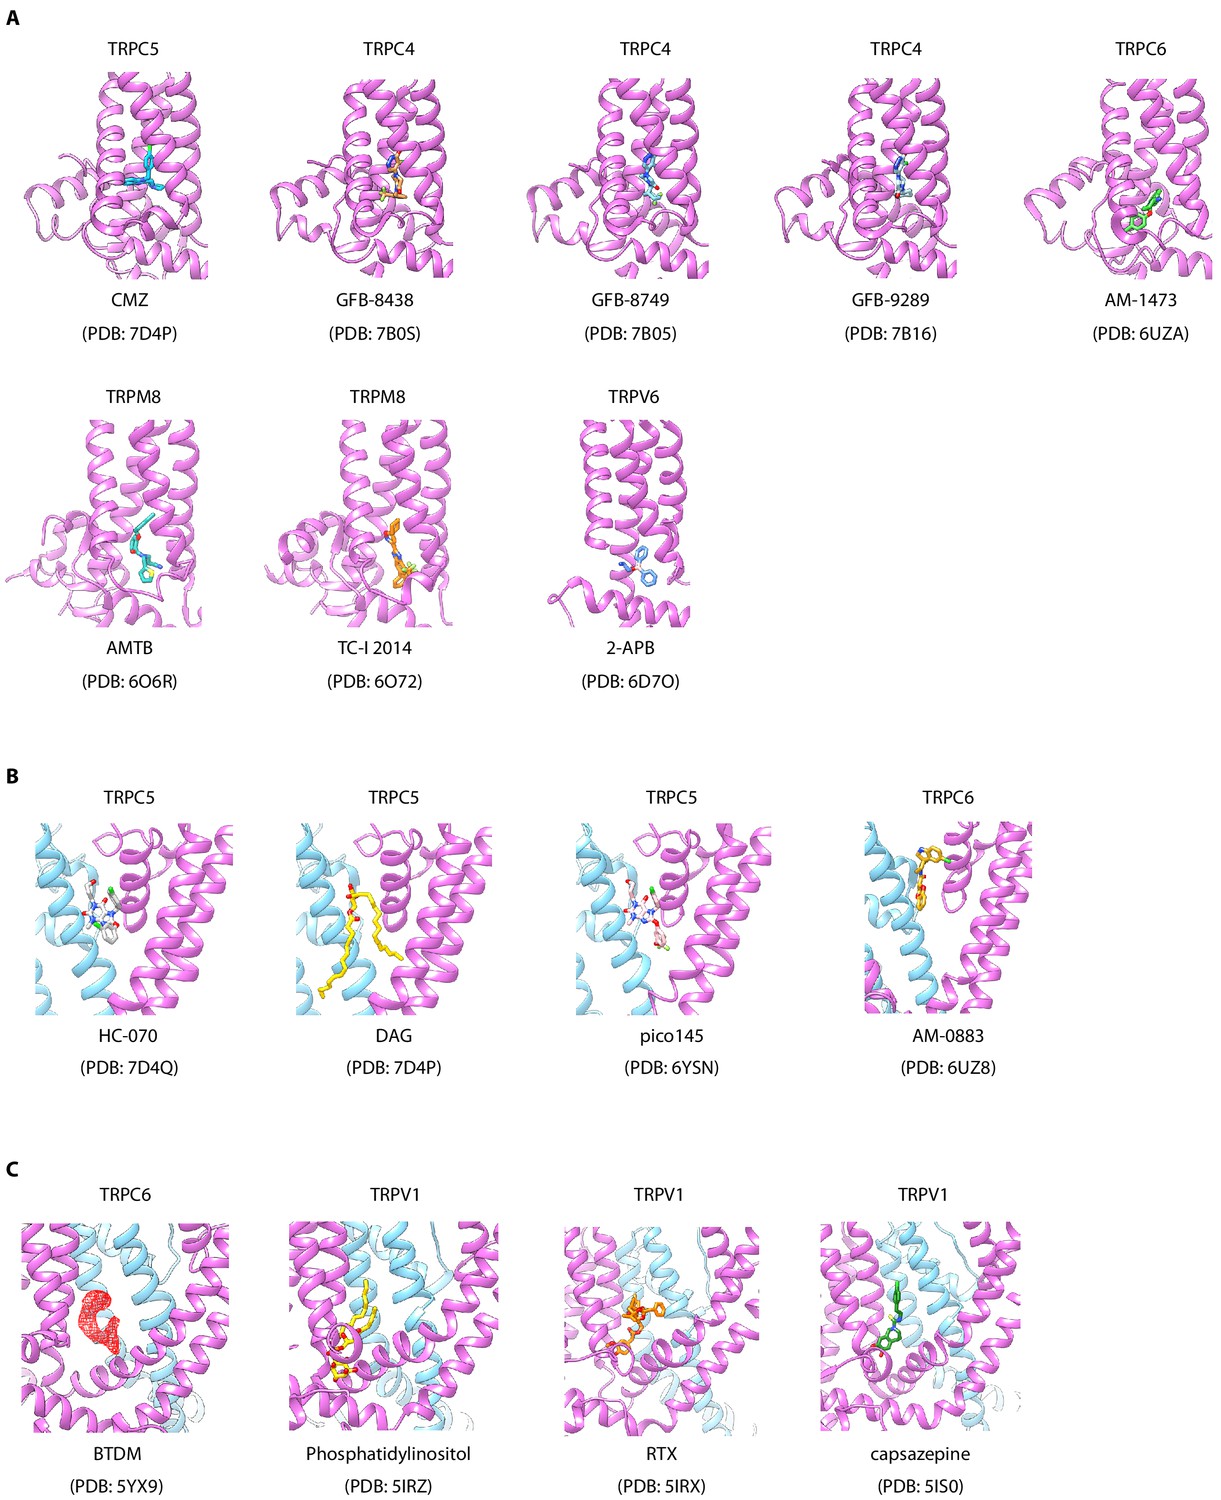
Ligand-binding sites in transient receptor potential (TRP) family.
(A) Different ligands bind in IBP-A of TRPC4, TRPC5, TRPC6, TRPM8, and TRPV6. One subunit of different transient receptor potential canonicals (TRPCs) is shown as cartoon and colored in purple. Different ligands are shown as sticks and in various colors. (B) Different ligands bind in IBP-B of TRPCs. One subunit and the adjacent subunit are colored in purple and light blue, respectively. (C) Different ligands bind in IBP-C of TRPC6 and TRPV1. The density of BTDM is shown as red mesh and other modeled ligands are shown as sticks.
Figure 6—figure supplement 2
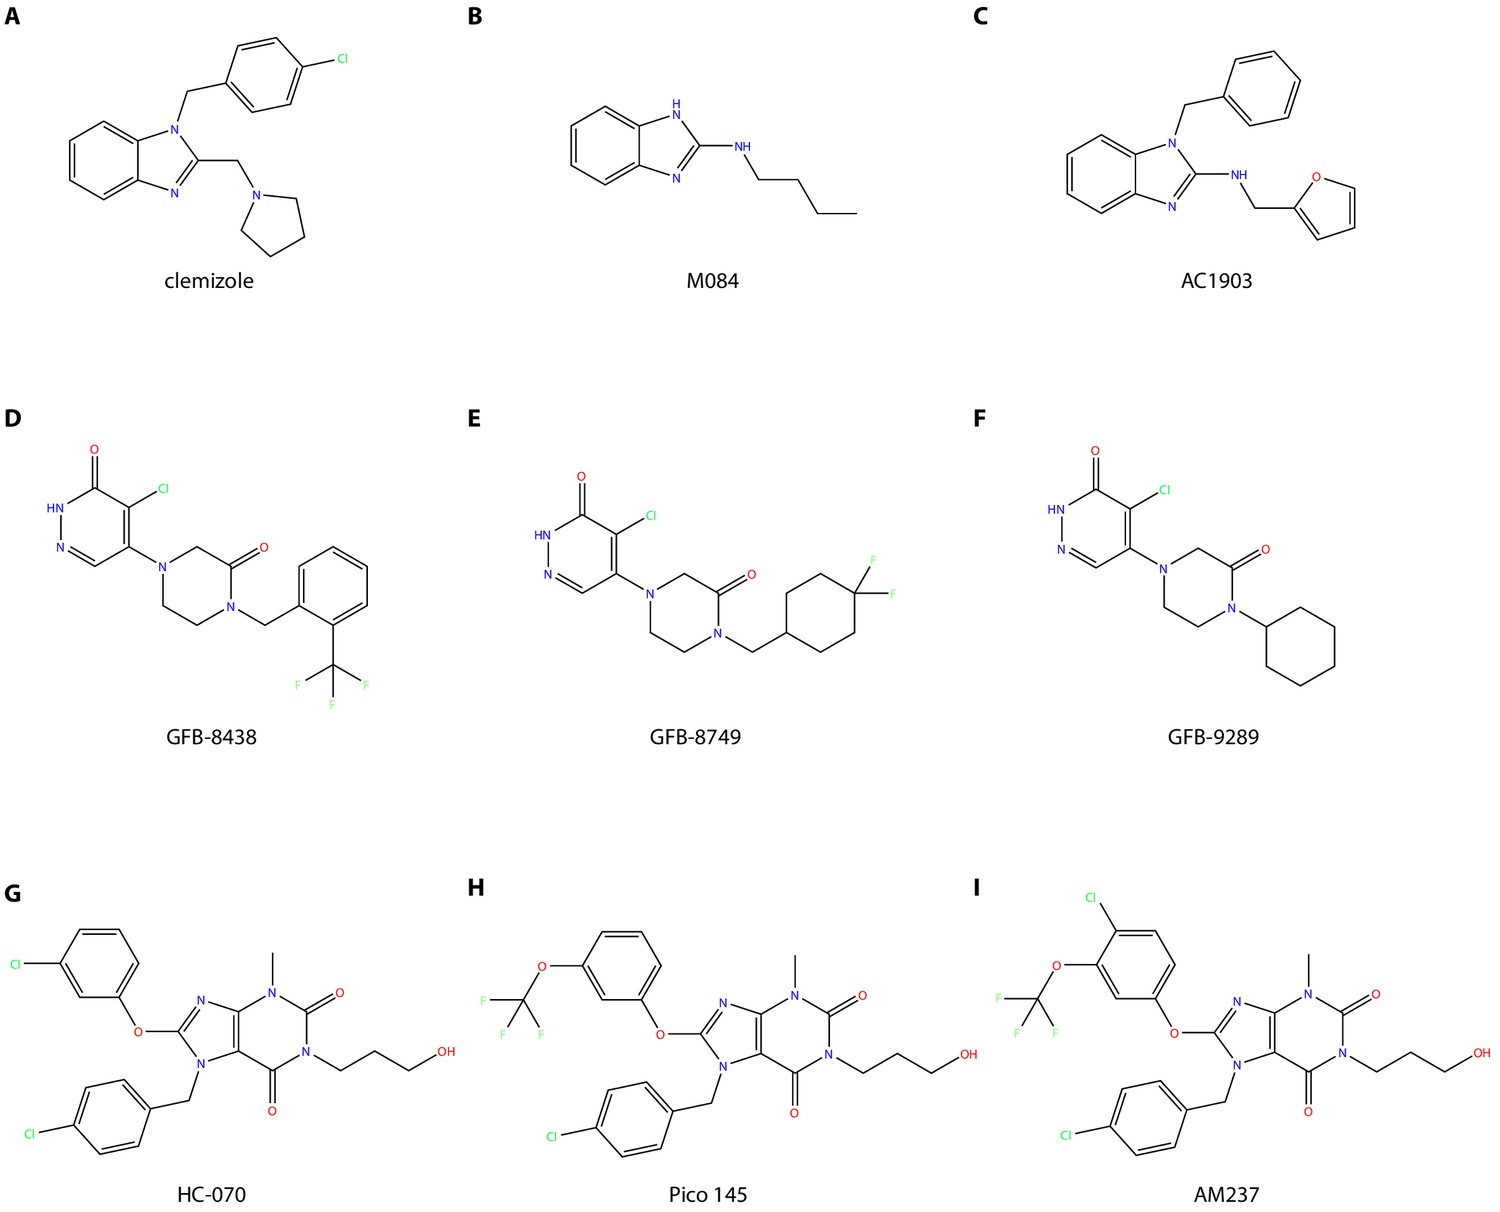
Comparison of chemical structures of different TRPC5 ligands.
(A–C) Benzimidazole derivatives inhibitors: clemizole (CMZ) (A), M084 (B), and AC1903 (C). (D–F) Piperazinone/pyridazinone derivatives inhibitors: GFB-8438 (D), GFB-8749 (E), and GFB-9289 (F). (G–I) Xanthine derivatives ligands: inhibitors HC-070 (G), Pico145 (H), and activator AM237 (I).
Author response image 1
Author response image 2
Tables
Table 1
Cryo-EM data collection, refinement, and validation statistics.
| PDB ID EMDB ID | CMZ-bound hTRPC5 7D4P EMD-30575 | HC-070-bound hTRPC5 7D4Q EMD-30576 | apo_hTRPC5 |
|---|---|---|---|
| 7E4T | |||
| EMD-30987 | |||
| Data collection and processing | |||
| Magnification | 130,000× | 165,000× | 130,000× |
| Voltage (kV) | 300 | 300 | 300 |
| Electron exposure (e-/Å2) | 50 | 50 | 50 |
| Defocus range (μm) | −1.5 to −2.0 | −1.5 to −2.0 | −1.5 to −2.0 |
| Pixel size (Å) | 1.045 | 0.821 | 1.045 |
| Symmetry imposed | C4 | C4 | C4 |
| Initial particle images (no.) | 354,312 | 274,189 | 64,918 |
| Final particle images (no.) | 90,357 | 114,211 | 29,156 |
| Map resolution (Å) Fourier shell correlation threshold | 2.7 0.143 | 2.7 0.143 | 3.0 0.143 |
| Map resolution range (Å) | 250–2.7 | 250–2.7 | 250–3.0 |
| Refinement | |||
| Initial model used (PDB code) | 5Z96 | 5Z96 | 5Z96 |
| Model resolution (Å) Fourier shell correlation threshold | 2.7 0.143 | 2.7 0.143 | 3.0 0.143 |
| Model resolution range (Å) | 250–2.7 | 250–2.7 | 250–3.0 |
| Map sharpening B factor (Å2) | −119.0 | −118.1 | −119.0 |
| Model composition | |||
| Nonhydrogen atoms Protein residues Ligands | 22,472 2680 28 | 22,388 2672 24 | 22,276 2656 24 |
| B factors (Å2) | |||
| Protein ligand | 95.86 91.34 | 120.29 124.44 | 140.20 133.98 |
| Root-mean-square deviations | |||
| Bond lengths (Å) Bond angles (°) | 0.004 0.914 | 0.004 0.918 | 0.004 0.906 |
| Validation | |||
| Validation MolProbity score Clashscore Poor rotamers (%) | 1.21 4.33 0.67 | 1.32 5.80 0.67 | 1.30 5.52 1.01 |
| Ramachandran plot | |||
| Favored (%) Allowed (%) Disallowed (%) | 98.78 1.22 0.00 | 98.63 1.37 0.00 | 98.93 1.07 0.00 |
Table 2
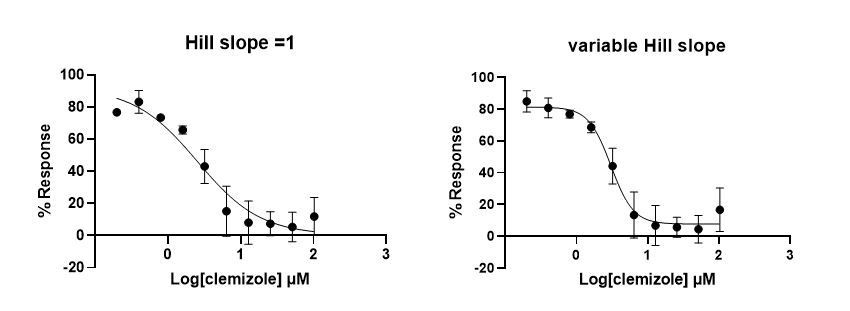
The potency of clemizole (CMZ) on various human TRPC5 (hTRPC5) constructs.
| TRPC5 constructs | CMZ | ||
|---|---|---|---|
| LogIC50* | Hill slope | IC50 (μM) | |
| hTRPC5 WT | 0.49 ± 0.08 | −2.52 | 3.07 |
| Mutations in CMZ-binding pocket | |||
| F414M | 0.33 ± 0.06 | −1.45 | 2.15 |
| N443L | 1.02 ± 0.15 | −2.42 | 10.43 |
| S495A | 0.48 ± 0.15 | −1.21 | 3.03 |
-
* Data were expressed as logIC50 ± SEM, n = 3.
Table 3
The potency of HC-070 on various human TRPC5 (hTRPC5) constructs.
| TRPC5 constructs | HC-070 | |||
|---|---|---|---|---|
| LogIC50* | Hill slope | IC50 (nM) | ||
| hTRPC5 WT | 2.31 ± 0.10 | −1.52 | 204.3 | |
| Mutations in HC-070-binding pocket | ||||
| C525A | 2.16 ± 0.15 | −1.03 | 145.8 | |
| R557A | 2.52 ± 0.07 | −1.45 | 329.7 | |
| F569A | 2.86 ± 0.15 | −1.21 | 727.4 | |
| L572A | 2.74 ± 0.17 | −1.58 | 552.7 | |
| Q573A | 3.10 ± 0.61 | −1.75 | >1000 | |
| F599A | 2.67 ± 0.29 | −1.09 | 467.9 | |
| F599N | 3.57 ± 1.55 | −0.86 | >1000 | |
| T603A | 2.68 ± 0.16 | −1.20 | 472.7 | |
| T607A | 2.43 ± 0.12 | −3.13 | 268.4 | |
-
* Data were expressed as logIC50 ± SEM, n = 3.
Key resources table
| Reagent type (species) or resource | Designation | Source or reference | Identifiers | Additional information |
|---|---|---|---|---|
| Gene (Homo sapiens) | hTRPC5 | This paper | NCBI Reference sequence: NM_012471 | Provided by Dr. Xiaolin Zhang, Dizal Pharmaceutical Company |
| Recombinant DNA reagent | hTRPC5 | This paper | Subcloned into a pBM Bacmam vector with N-terminal GFP-MBP tag | |
| Recombinant DNA reagent | hTRPC5 | This paper | Subcloned into a pCDNA3.1 vector with no tag | |
| Recombinant DNA reagent | hTRPC51-764 | This paper | Subcloned into a pBM Bacmam vector with N-terminal GFP-MBP tag | |
| Cell line (FreeStyle 293 F) | FreeStyle 293 F | Thermo Fisher Scientific | R79007 | RRID:CVCL_D603 |
| Cell line (AD-293) | AD-293 | Agilent | 240085 | RRID:CVCL_9804 |
| Cell line (Sf9) | Sf9 | Thermo Fisher Scientific | 12659017 | RRID:CVCL_0549 |
| Antibody | Anti-TRPC5 (rabbit polyclonal) | Proteintech | 25890–1-AP | 1:1000 RRID:AB_2880285 |
| Antibody | Anti-N-Cadherin (rabbit polyclonal) | Proteintech | 22018–1-AP | 1:3000 RRID:AB_2813891 |
| Chemical compound, drug | Clemizole | CAYMAN | 17695 | |
| Chemical compound, drug | HC-070 | MedChemExpress (MCE) | 31244 | |
| Chemical compound, drug | (-)-Englerin A | PanReac AppliChem | A8907 | |
| Software, algorithm | Gctf_v1.18 | Zhang, 2016 PMID:26592709 | ||
| Software, algorithm | Gautomatch v0.56 | K. Zhang, MRC LMB (https://www2.mrc-lmb.cam.ac.uk/research/locally-developed-software/zhang-software/) | ||
| Software, algorithm | RELION-3.0 | Zivanov et al., 2018 PMID:30412051 | ||
| Software, algorithm | PHENIX 1.18.1–3865 | Adams et al., 2010 PMID:20124702 | ||
| Software, algorithm | HOLE2 v2.2.005 | Smart et al., 1996 PMID:9195488 | ||
| Software, algorithm | cryoSPARC v3.1 | Punjani et al., 2017 PMID:28165473 | ||
| Software, algorithm | Chimera-1.13 | Pettersen et al., 2004 PMID:15264254 | ||
| Other | Rhod-2/AM | AAT Bioquest | 21062 |
Additional files
Download links
A two-part list of links to download the article, or parts of the article, in various formats.
Downloads (link to download the article as PDF)
Open citations (links to open the citations from this article in various online reference manager services)
Cite this article (links to download the citations from this article in formats compatible with various reference manager tools)
Structural basis for human TRPC5 channel inhibition by two distinct inhibitors
eLife 10:e63429.
https://doi.org/10.7554/eLife.63429


