tRNA sequences can assemble into a replicator
- Systems Biophysics, Physics Department, Center for NanoScience, Ludwig-Maximilians-Universität München, Germany
Figures
Figure 1 with 1 supplement

Heat-driven replication by hybridization using hairpin structures inspired from transfer RNA.
(a) Transfer RNA folds into a double-hairpin conformation upon very few base substitutions. In that configuration, the 3’-terminal amino acid binding site (green) is close to the anticodon (blue) and a double hairpin structure forms. A set of pairwise complementary double hairpins can encode and replicate sequences of information. A binary code implemented in the position of the anti-codon, the information domain, allows to encode and replicate binary sequences (red vs blue). Each strand (82-84 nt) comprises two hairpin loops (gray) and an interjacent unpaired information domain of 15 nt length (blue/red, here: ). The displayed structure of eight strands shows replication of a template corresponding to the binary code 0010. Note, that no covalent linkage is involved in the process. (b) Replication is driven by thermal oscillations in four steps: (0) The hairpins are activated into their closed conformation by fast cooling indicated by triangles. (1) Strands with matching information domain bind to the template. (2) Fluctuations in the bound strands’ hairpins facilitate the hybridization of neighboring strands. (3) Subsequent heating splits replica from template, while keeping the longer hairpin sequences connected, freeing both as templates for the next cycle.
Figure 1—figure supplement 1
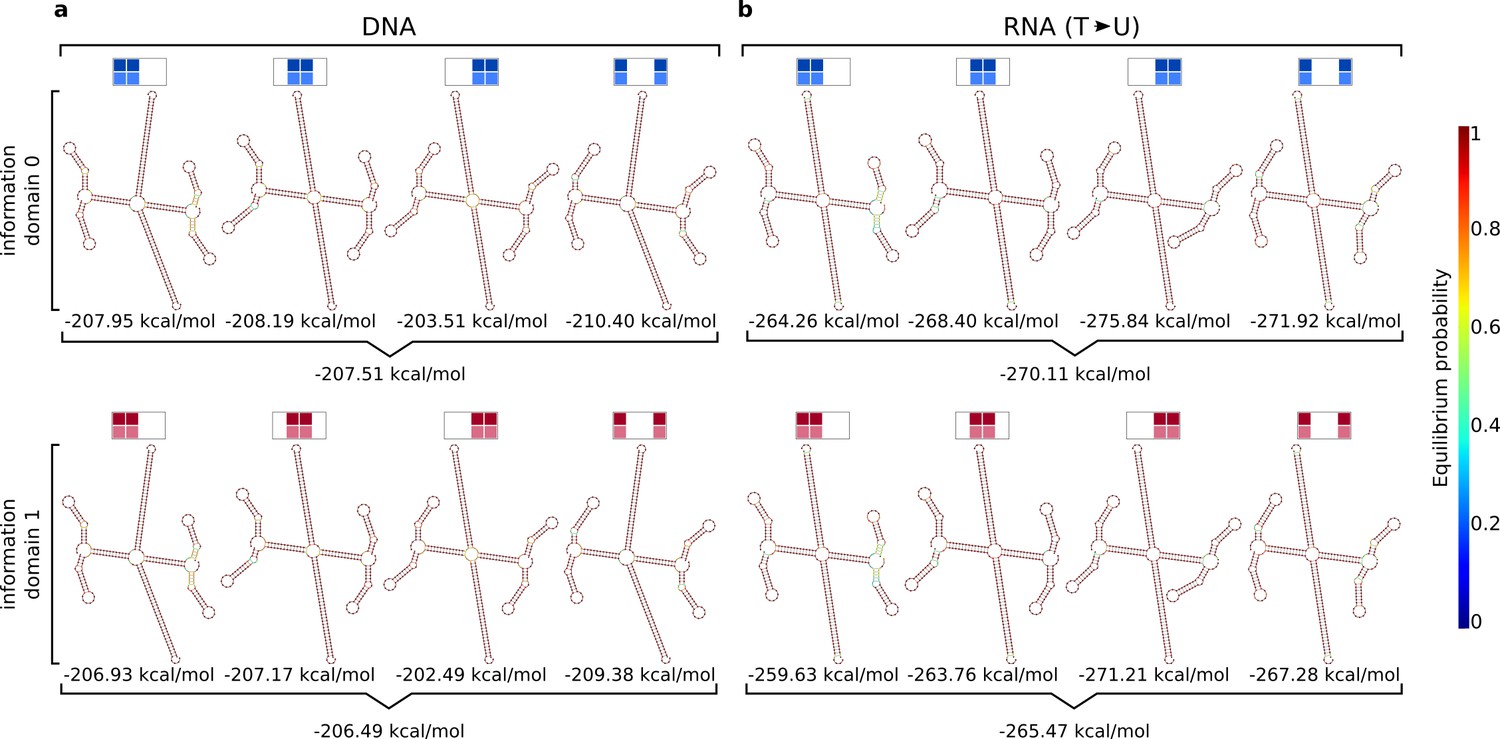
Secondary structure predictions and free energy calculations for the replicator in DNA and RNA using NUPACK.
Combinations of sets of four complementary double hairpins are displayed for (a) DNA and (b) RNA at 25 °C, 1 M Na+ and 0.625 mM per strand. For (b) every 'T' in the DNA sequence is substituted by a 'U'. Due to computational limitations the only four strands could be calculated at a time. The predicted structures look as expected, forming the backbone (top and bottom from center) and the information domain bonds (left and right from center), which are flanked by the closed hairpins. The DNA (a) and RNA (b) version are identical. Also, there is no difference in structure or free energy between information domain '0' and information domain '1'. The calculated free energies are given below each structure and are averaged over each complete set.
Figure 2 with 1 supplement
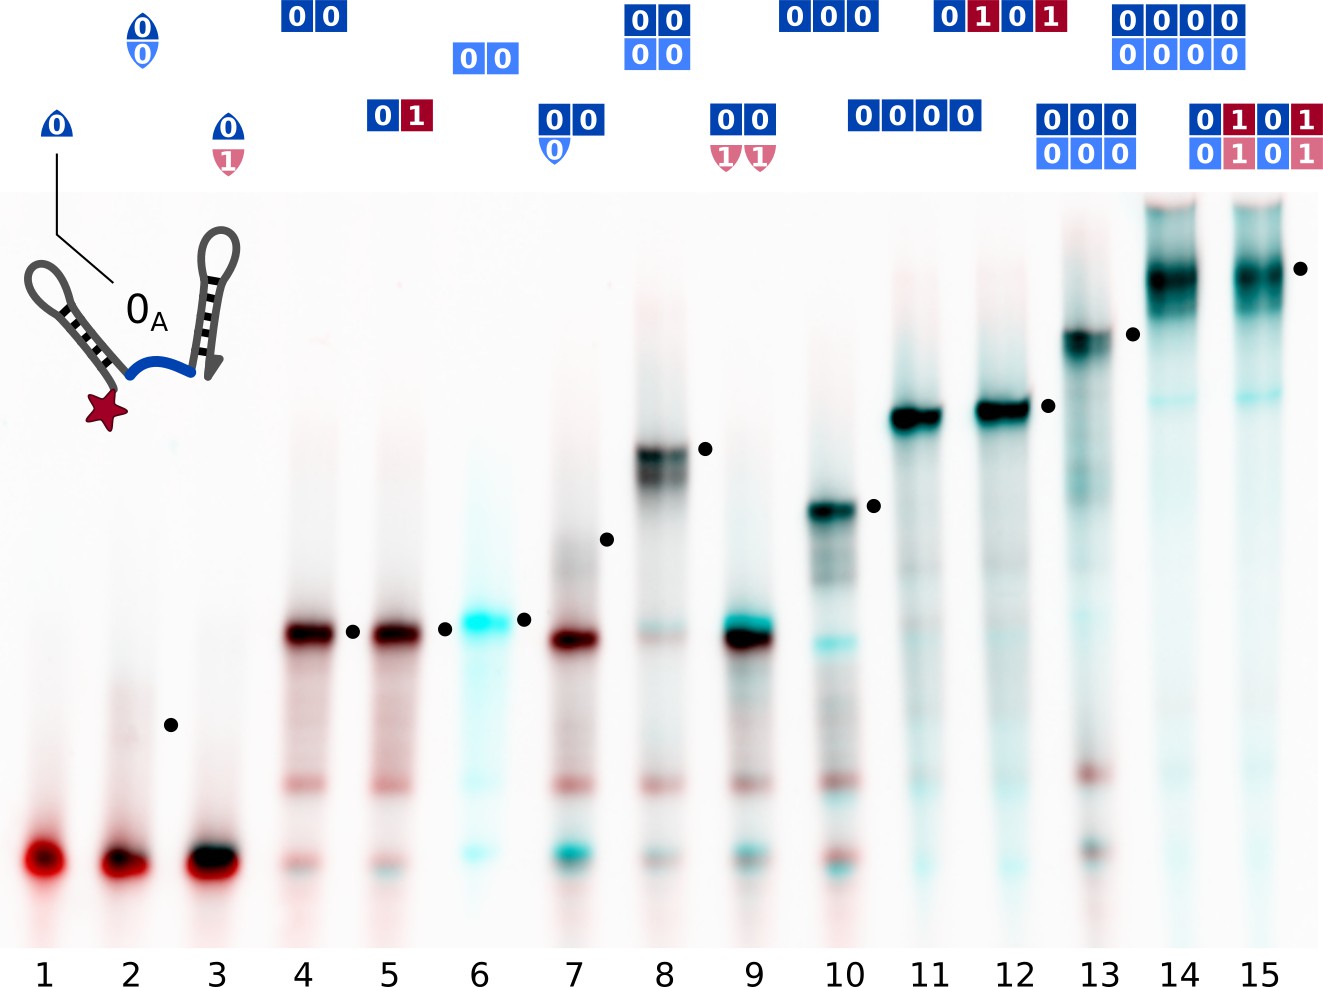
Assembly of different subsets of the cross-replicating system of strands observed by native gel electrophoresis.
Samples contained strands at 200 nM concentration each and were slowly annealed as described in Materials and methods. Lane contents are indicated at the top of each lane. Comparison of different lanes allowed for the attribution of bands to complexes. Complexes incorporating all present strands are marked (•). The red channel shows the intensity -Cy5, the cyan channel shows SYBR Green I fluorescence. Single information domain bonds (lane 2, 7) break during gel electrophoresis.
-
Figure 2—source data 1
Source data for assembly of different subsets of the cross-replicating system of strands observed by native gel electrophoresis.
- https://cdn.elifesciences.org/articles/63431/elife-63431-fig2-data1-v1.zip
Figure 2—figure supplement 1

Gel mobilities of different complexes compared to linear dsDNA.
(a) Ferguson plot of differently sized complexes compared to linear dsDNA (gray lines) of comparable mass. The slopes of log(mobility) vs. gel concentration are proportional to the friction constants of the molecules (Rodbard and Chrambach, 1970). (b) Linear dsDNA shows significantly lower friction constants than any of the complexes of at least two molecules. Symbolic complexes are indicated next to the data points. This is due to the branched structure of the complexes and conforms with the suggested assembly geometry. Idealized tertiary structures of complexes and :, and 100 bp dsDNA are given as size reference.
-
Figure 2—figure supplement 1—source data 1
Source data for gel mobilities of different complexes compared to linear dsDNA.
- https://cdn.elifesciences.org/articles/63431/elife-63431-fig2-figsupp1-data1-v1.zip
Figure 3 with 3 supplements
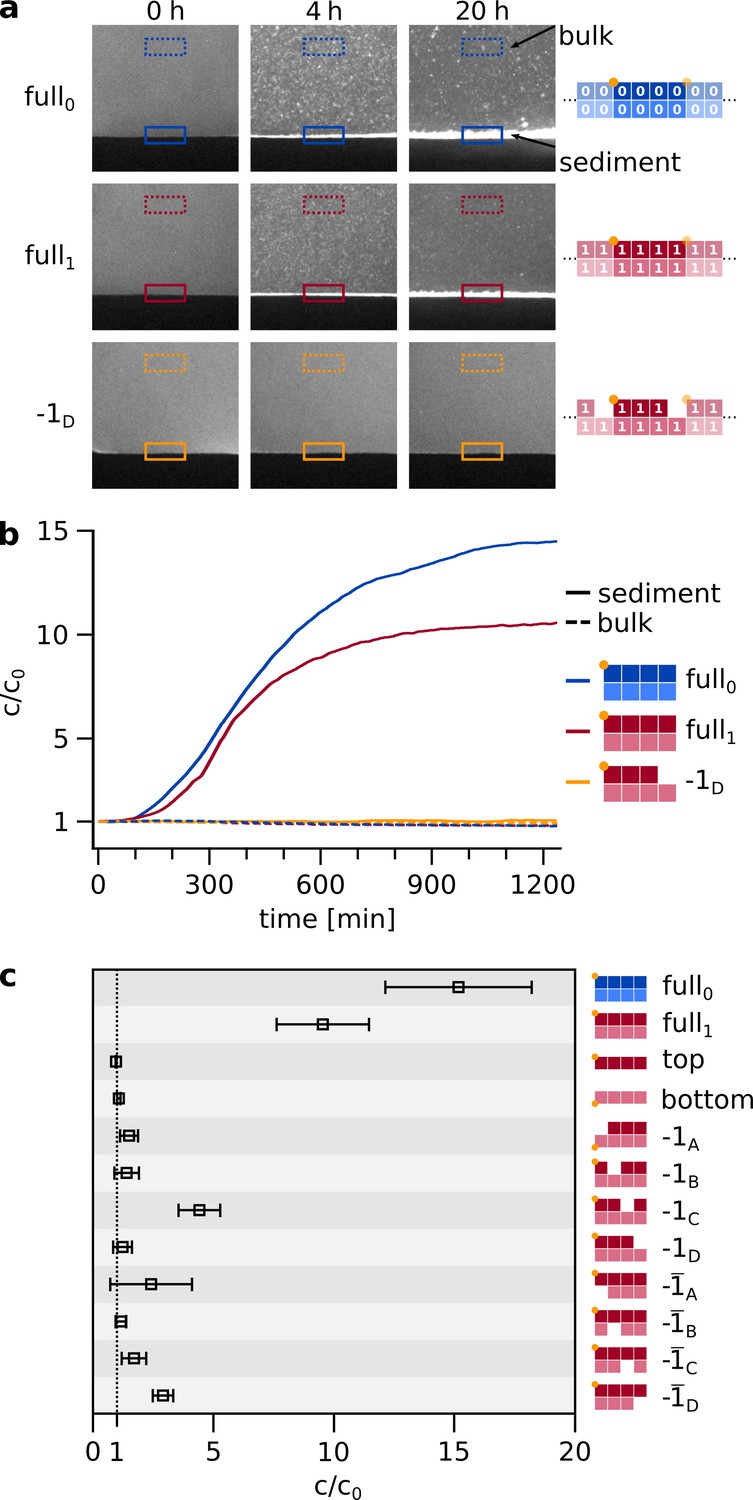
Spontaneous self-assembly and sedimentation of matching hairpins.
(a) In a simple, sealed microfluidic chamber (Figure 3—figure supplement 2), the hairpin strands can self-assemble into agglomerates and sediment on a timescale of hours. The sample was initially heated to 95 °C for 10 s to ensure an unbound initial state, then rapidly (within 30 s) cooled to 25 °C, where self-assembly and sedimentation occured. Note, that agglomeration and sedimentation only occured if all eight matching hairpins were provided (top two rows) but not in the case of a knockout (-, bottom row). For quantification, the bulk and sediment intensities were normalized by the first frame after heating. Samples contained strands at total concentration of 5 µM, about threefold higher than in Figure 2 and the following replication experiments. (b) Time traces of concentration increase for sediment and bulk of different configurations, same examples as shown in a. The time traces of all further knockout permutations are shown in Figure 3—figure supplement 1b. (c) Final concentration increase of sediment, relative to first frame after heating, for all configurations. The final values (N≥3) for c/c0 are retrieved from fitting the time traces. For the full set of complementary hairpins, self-assembly and sedimentation is most pronounced.
-
Figure 3—source data 1
Source data for spontaneous self-assembly and sedimentation of matching hairpins.
- https://cdn.elifesciences.org/articles/63431/elife-63431-fig3-data1-v1.zip
Figure 3—figure supplement 1
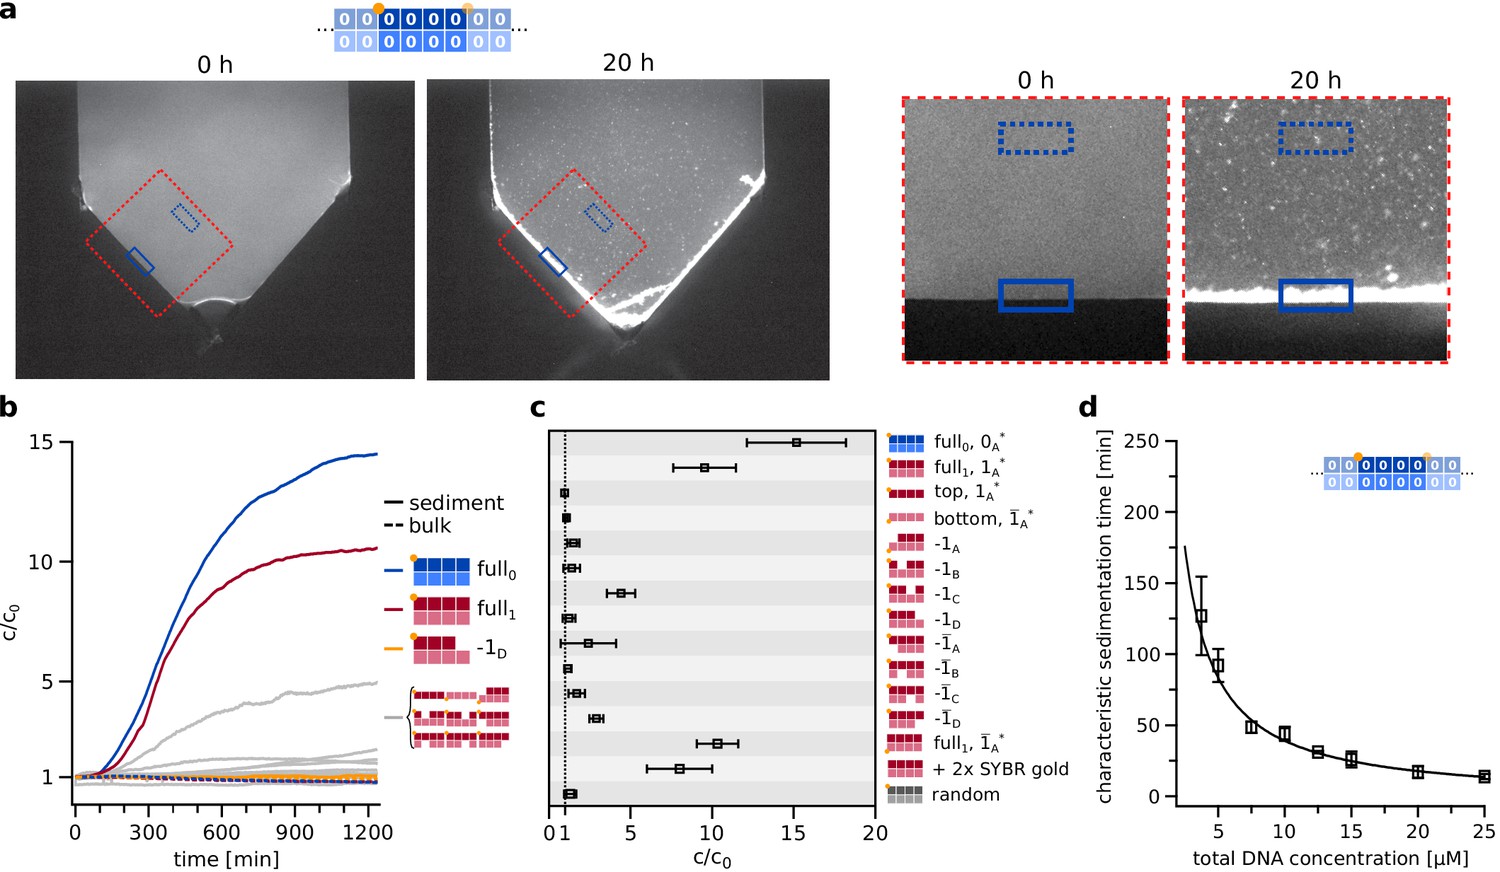
Extended data on self-assembly and sedimentation.
(a) Original fluorescence microscopy images (left) and cuttings (right) as shown in Figure 3a. To calculate c/c0 time traces (Figure 3b), (c) the image stacks were stabilized and the whole flank was integrated, the cuttings serve barely illustrative purpose. (b) Time traces of concentration increase for sediment and bulk of all different configurations, including all knockout permutations. (c) Final concentration increase of sediment, relative to first frame after heating, for all configurations including labeling and random-sequence controls (bottom three rows). The sedimentation of the full system is independent of the label and its position. Random sequences do not show agglomeration nor sedimentation. (d) Concentration dependence of the sedimentation kinetics. The characteristic sedimentation time is determined by fitting the initial increase of c/c0 over time with an exponential function. The concentration dependence can be fitted with a power law function y(c) = a1+a2*cp, which yields an exponent of p = –1.06, fit with weighted error bars displayed.
-
Figure 3—figure supplement 1—source data 1
Source data for extended data on self-assembly and sedimentation.
- https://cdn.elifesciences.org/articles/63431/elife-63431-fig3-figsupp1-data1-v1.zip
Figure 3—figure supplement 2
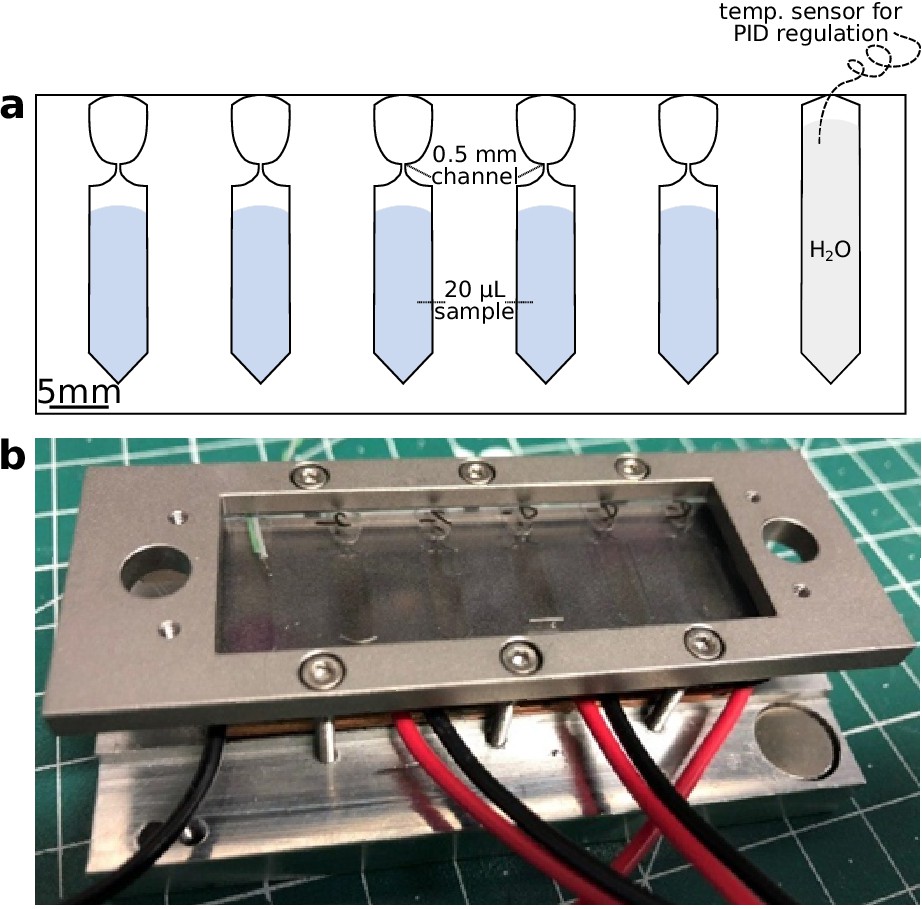
Sketch of microfluidic chamber.
(a) One chamber contained five independent pockets of 20 µL capacity, which were accessed through a 0.5 mm channel. After inserting the sample, the pockets were sealed with Parafilm. An additional pocket contained a temperature sensor in water, which was used for the PID temperature regulation. (b) Image of one chamber. The chamber design is cut out of a 500 µm FEP foil and fit between two plane sapphires. Three Peltier elements are attached to the backside of the chamber which allow quick heating and cooling of the sample at rates > 2 K/s. This package is then screwed onto an aluminum base by a steel top frame. The sapphire allowed full visual access to the sample.
Figure 3—video 1
Sedimentation of DNA agglomerates.
Fluorescence movie of DNA hairpin assemblies in microfluidic chamber over 20 hr timespan of experiment as shown in Figure 3. Agglomeration and subsequent sedimentation only occur when all eight matching hairpins are present (left), but not in the case of a knockout (right, -). The temperature protocol is described in Materials and methods. The short dip in fluorescence signal in the beginning is due to the 10 s heating step at 95 °C.
Figure 4 with 1 supplement
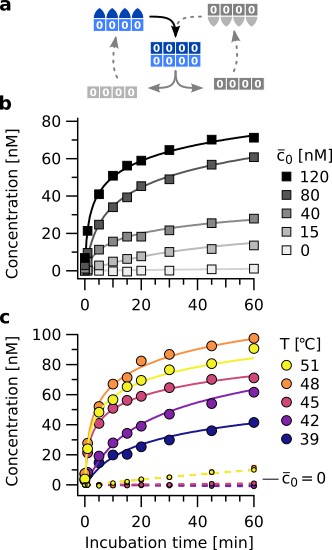
Isothermal template assisted product formation.
(a) Schematic representation of the templating step at constant temperature. (b) Kinetics of tetramer formation at 45 °C with different starting concentrations of template (). Data includes concentrations of all complexes containing tetramers. (c) Templating observed over a broad temperature range. Large circles show data for reactions at nM of template , small circles show the spontaneous formation (). The latter increases at T > 45 °C. Above 48 °C, binding of monomers to the template gets weaker, slowing down the rate of template assisted formation. This is consistent with the melting temperatures of the information domains (see Figure 4—figure supplement 1).
-
Figure 4—source data 1
Source data for determination of thermal oscillation temperatures.
- https://cdn.elifesciences.org/articles/63431/elife-63431-fig4-data1-v1.zip
Figure 4—figure supplement 1
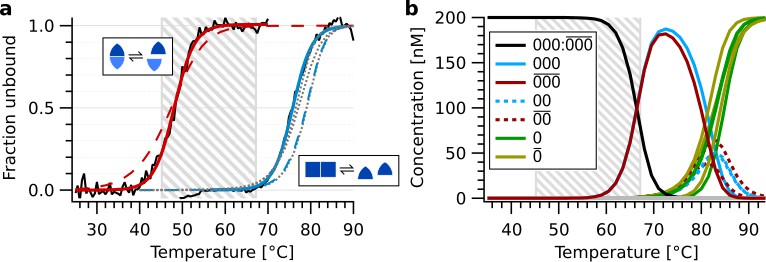
Determination of thermal oscillation temperatures.
(a) Melting temperatures of complementary information domains (red, strands , determined via quenching of -Cy5) and backbone domains (blue, strands , determined via UV absorption). Dashed lines show simulation data. Dotted gray lines depict simulated melting curves for , , . The hatched area indicates the thermal oscillation range of 45–67 °C. (b) Simulated equilibrium concentrations in a reaction mixture containing 200 nM of each of , , , , , . The peak temperature of the thermal oscillations mostly melts the bond between the trimers and but is below the melting transition of or (yellow, green).
-
Figure 4—figure supplement 1—source data 1
Source data for isothermal template assisted product formation.
- https://cdn.elifesciences.org/articles/63431/elife-63431-fig4-figsupp1-data1-v1.zip
Figure 5
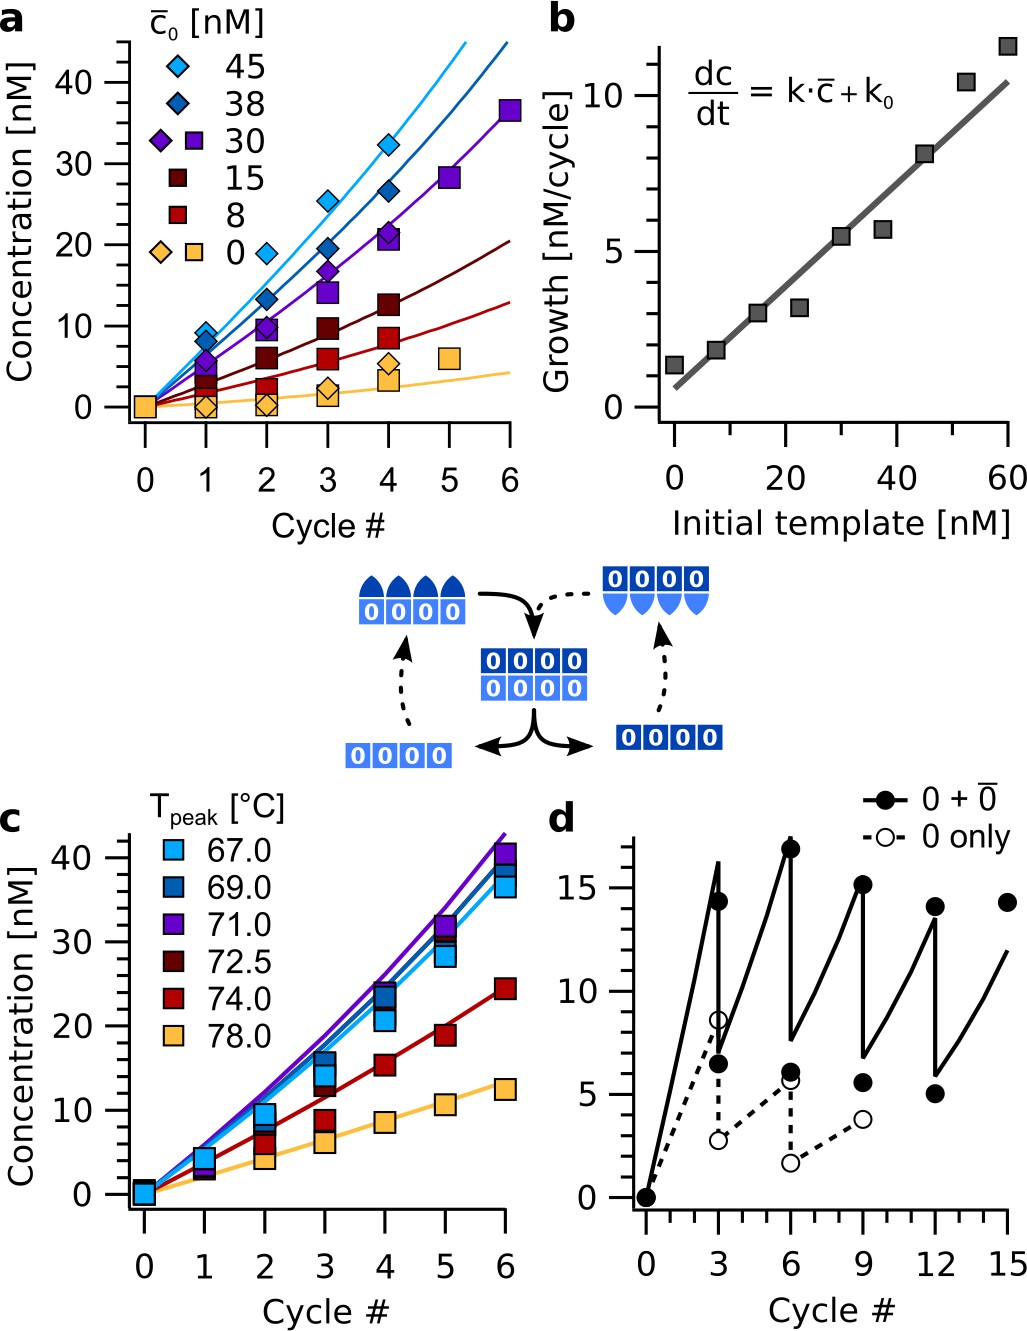
Exponential amplification of a restricted sequence subset with thermal oscillations.
(a) Amplification time traces for concentration c for sequence 0000 during the first four to six cycles (Tpeak = 67 °C) for template () concentrations from 0 to 45 nM. The data was fitted using the cross-catalytic model from equation (1). Strands , , , …, were used at 200 nM concentration each. Data points show concentrations of complexes 4:4. (b) Initial reaction velocity as a function of initial template concentration . The data points show good agreement with the line calculated from the fits in panel a. (c) Amplification proceeded for peak temperatures below 74 °C. Above, backbone duplexes start to melt, and the complexes are no longer stable. The base temperature was 45 °C, reactions initially contained 30 nM of complex as template. (d) Serial transfer experiment. The reaction containing strands , , , …, (black circles) survived successive dilution by a factor of 1/2 every three cycles at almost constant concentration. In contrast, a reaction with the same amount of template , but lacking monomers , fades out (open circles). The solid line shows the model from Equation 1.
-
Figure 5—source data 1
Source data for exponential amplification of a restricted sequence subset with thermal oscillations.
- https://cdn.elifesciences.org/articles/63431/elife-63431-fig5-data1-v1.zip
Figure 6 with 1 supplement

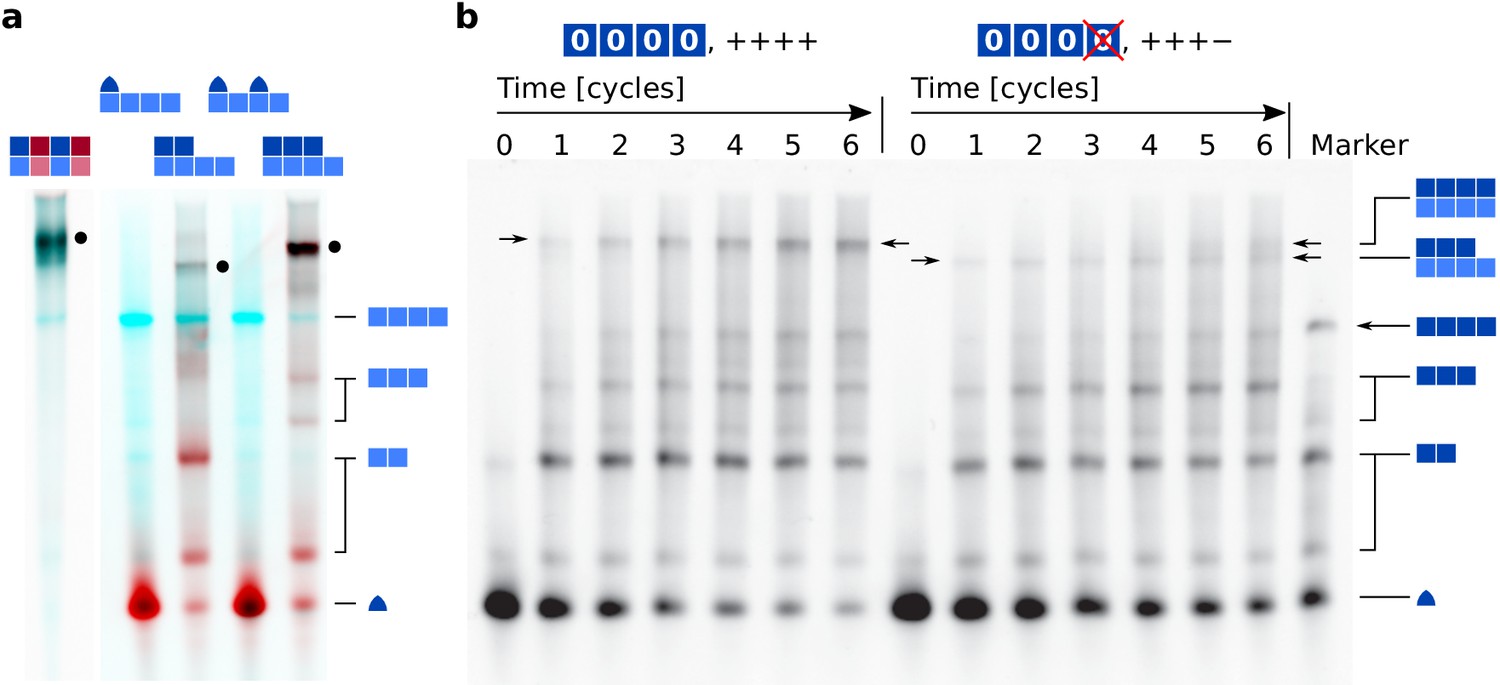
Sequence replication with thermal oscillations and fidelity check by forcing mutations from '0' to '1' at different locations.
(a) Replication of sequence . Reactions were started with 15 nM initial template . All strands (, , , …, ) were present at 100 nM each. Native-PAGE results comparing the reaction of all 16 strands ('++++') with the reaction lacking strand ('+++−'). The defective set '+++−' mostly produced 3:4 complexes instead of 4:4 complexes (see schematics on the right). The overall yield of tetramer-containing complexes was greatly reduced. As size reference, the marker lane contained complexes , , , and monomers . The complete gel is presented in Figure 6—figure supplement 1. (b) Product concentration over time for the complete sequence network (yellow) and three defective sets with missing strands. Data was integrated by quantitative image analysis from electrophoresis gels using covalent markers on the -strand counting all product complexes containing tetramers. Mutations of information in the product from '0' to '1' were induced by defective reactions that lacked strands ('+++−'), ('++−−'), and ('+−+−'). All reactions were initiated with 15 nM of . The solid line shows data from reaction '++++' without template. (c) End point comparison of reactions with templates (panels a, b), , and after six cycles. Horizontal lines indicate averages of the three template sequences. A single missing strand reduced product yield to about 40 %, two missing strands to 15–20 %.
-
Figure 6—source data 1
Source data for sequence replication with thermal oscillations and fidelity check by forcing mutations from '0' to '1' at different locations.
- https://cdn.elifesciences.org/articles/63431/elife-63431-fig6-data1-v1.zip
Figure 6—figure supplement 1
Extended electrophoresis gel image data.
(a) Assembly yields of different strands bound to tetramer template . Lane contents are given above each lane, complexes are identified on the right. Samples were annealed as for Figure 2 and described in Materials and methods. The red channel shows the intensity of -Cy5, the cyan channel shows SYBR Green I. Single or unconnected strands (lanes 2, 4) detached from the template during electrophoresis. Complexes of size 2:4, 3:4, and 4:4 were resolved. (b) Full PAGE result from Figure 6a. The gel shows replication of template in a reaction containing all strands ('++++', left) with a reaction lacking strand ('+++−', right). The marker lane contained complexes , , , and monomer , and was prepared as described in Materials and methods.
-
Figure 6—figure supplement 1—source data 1
Source data for extended electrophoresus gel image data.
- https://cdn.elifesciences.org/articles/63431/elife-63431-fig6-figsupp1-data1-v1.zip
Figure 7 with 1 supplement
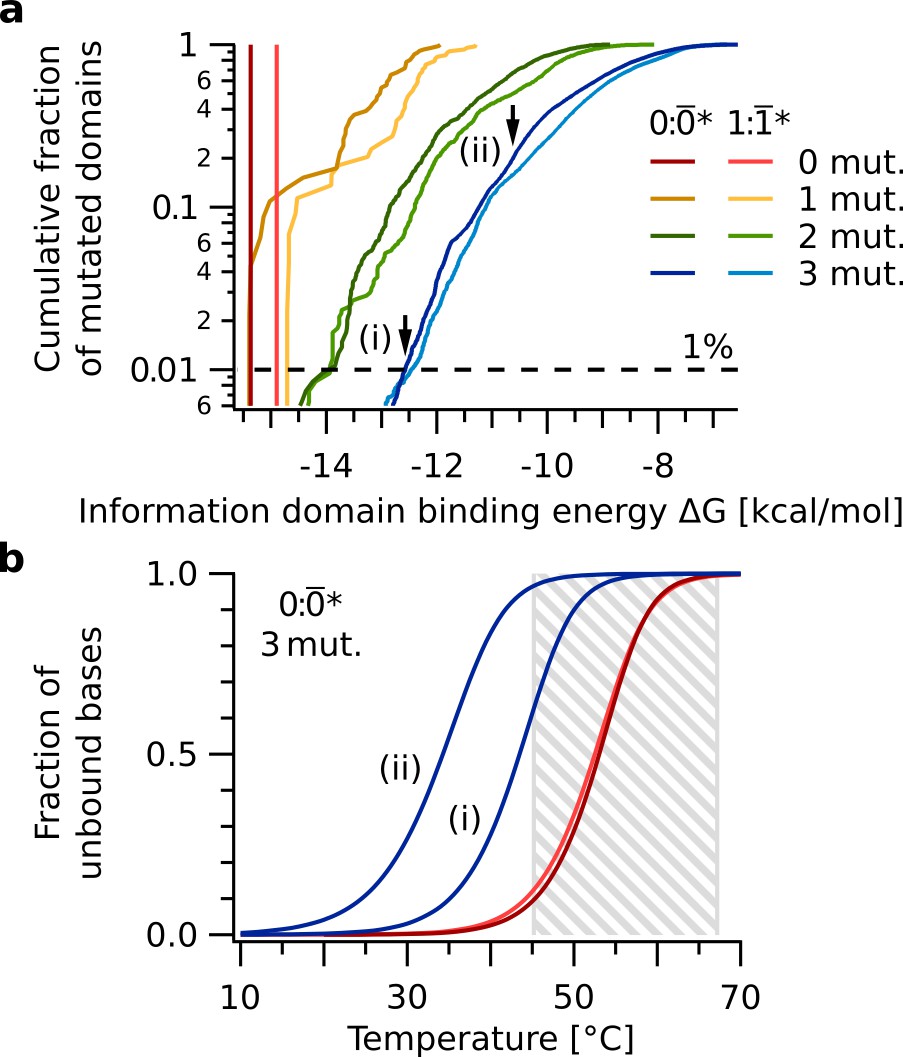
Sequence space analysis of information domain binding.
The binding energies quantify the ability of the replication mechanism to discriminate nucleotide mutations. (a) Cumulative free energy distributions of information domain duplexes 0: (red), : (light red), as well as all 0:* and :* with up to three point mutations in * and * (yellow, green, blue). 99 % of duplexes 0:* with three point mutations have free energies ΔG ≥ -12.5 kcal/mol (dashed line), significantly weaker than that of 0: (ΔG = -15.4 kcal/mol). (b) Melting curves of information domain duplexes 0: (red), : (light red), and the two duplexes 0:* indicated by arrows in panel a. Even the 0:* duplex (i) at the low end of the ΔG distribution has a melting temperature of about 10 °C below that of 0:. This difference in melting temperature destabilizes binding of the information domain and causes the replication mechanism to reject these sequences in the thermal oscillation regime between Tbase = 45 °C and Tpeak = 67 °C (gray box).
-
Figure 7—source data 1
Source data for information domain binding energy statistics split into information domains containing terminal mutations and those with internal mutations only.
- https://cdn.elifesciences.org/articles/63431/elife-63431-fig7-data1-v1.zip
Figure 7—figure supplement 1
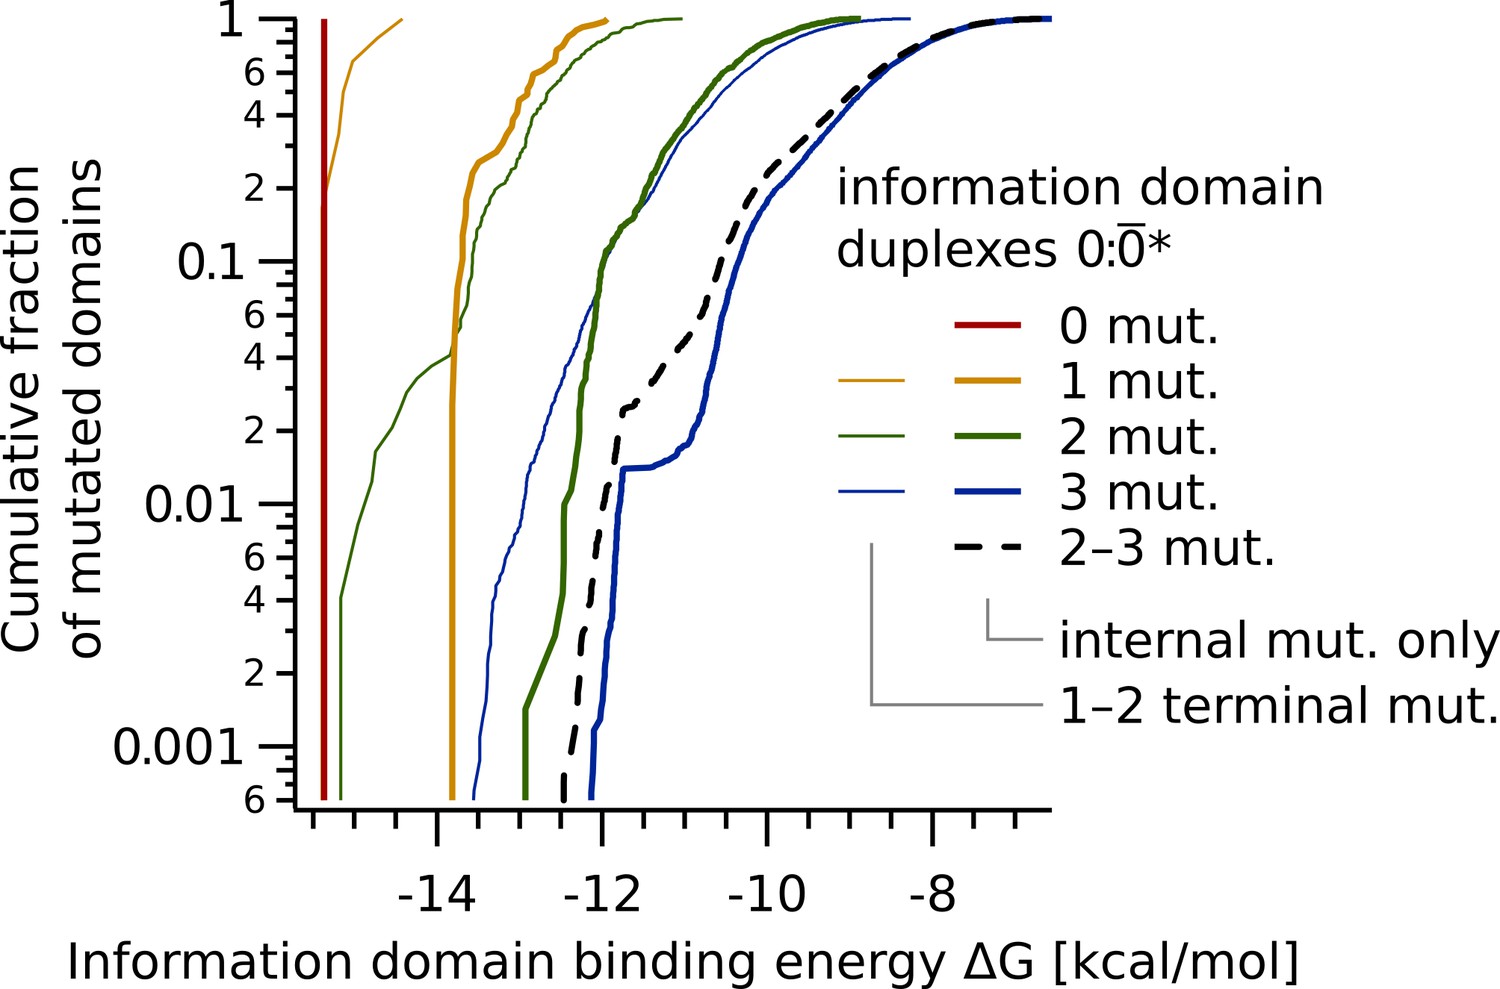
Information domain binding energy statistics split into information domains containing terminal mutations and those with internal mutations only.
Cumulative free energy distribution of duplexes 0:* (as in Figure 7), split into information domains * containing mutations at terminal bases (thin lines) and those with internal mutations only (thick lines). The dashed line shows combined data for two to three internal mutations. The logarithmic plot shows the fast drop and thus small influence by special mutations in the energy landscape.
-
Figure 7—figure supplement 1—source data 1
Source data for sequence space analysis of information domain binding.
- https://cdn.elifesciences.org/articles/63431/elife-63431-fig7-figsupp1-data1-v1.zip
Tables
Key resources table
| Reagent type (species) or resource | Designation | Source or reference | Identifiers | Additional information |
|---|---|---|---|---|
| Sequence-based reagent | Biomers | P - GCAGCGTTAATTCCCGC GCCTATCGGGAATGTAA CGCAGTGGGTAATAATG ACGATAGCCGTTCGGGA AAAGCGAACGGTATCG | ||
| Sequence-based reagent | Biomers | P - GCAGCGATACCGTTCG CTTTTCCCGAACGGCT ATCGCAGTGGGTAATA ATGAGCGAACTGTCGG TGCTTGCGACAGTGTCGC | ||
| Sequence-based reagent | Biomers | P - GCAGGCGACACTGTCG CAAGCACCGACAGTTC GCCAGTGGGTAATAAT GAGCGGTTCCTTGCGG AGTAGGCAAGGAATCCGC | ||
| Sequence-based reagent | Biomers | P - GCAGGCGGATTCCTTG CCTACTCCGCAAGGAA TCGCCAGTGGGTAATA ATGACGTTACATTCCC GATAGGCGCGGGAATTAACG | ||
| Sequence-based reagent | Biomers | P - GCTGCGCATTAACGCG CTTGTCCCGCGTTAAT TGCGCTCATTATTACC CACTCGCTCTCGGCTG TTTTGCCCAGCCGAGCAGCG | ||
| Sequence-based reagent | Biomers | P – GCTGCGTTGCATTGGC GATCAAAGCCAATGCG AACGCTCATTATTACC CACTCGCAATTAACGC GGGACAAGCGCGTTAATGCG | ||
| Sequence-based reagent | Biomers | P - GCTGGTTGGAGAAGGC GAACAGCACGCCTTCC CAACCTCATTATTACCC ACTCGTTCGCATTGGC TTTGATC GCCAATGCAACG | ||
| Sequence-based reagent | Biomers | P - GCTGCGCTGCTCGGCT GGGCAAAACAGCCGAG AGCGCTCATTATTACCC ACTGTTGGGAAGGCGT GCTGTTCGCCTTCTCCAAC | ||
| Sequence-based reagent | Biomers | P - GCAGCGTTAATTCCCG CGCCTATCGGGAATGT AACGCAAAAGAAGAGA AAGACGATAGCCGTTC GGGAAAAGCGAACGGTATCG | ||
| Sequence-based reagent | Biomers | P - GCAGCGATACCGTTCG CTTTTCCCGAACGGCT ATCGCAAAAGAAGAGA AAGAGCGAACTGTCGG TGCTTGCGACAGTGTCGC | ||
| Sequence-based reagent | Biomers | P - GCAGGCGACACTGTCG CAAGCACCGACAGTTC GCCAAAAGAAGAGAAA GAGCGGTTCCTTGCGG AGTAGGCAAGGAATCCGC | ||
| Sequence-based reagent | Biomers | P - GCAGGCGGATTCCTTG CCTACTCCGCAAGGAA TCGCCAAAAGAAGAGA AAGACGTTACATTCCC GATAGGCGCGGGAATTAACG | ||
| Sequence-based reagent | Biomers | P - GCTGCGCATTAACGCG CTTGTCCCGCGTTAAT TGCGCTCTTTCTCTTC TTTTCGCTCTCGGCTG TTTTGCCCAGCCGAGCAGCG | ||
| Sequence-based reagent | Biomers | P - GCTGCGTTGCATTGGC GATCAAAGCCAATGCG AACGCTCTTTCTCTTC TTTTCGCAATTAACGC GGGACAAGCGCGTTAATGCG | ||
| Sequence-based reagent | Biomers | P - GCTGGTTGGAGAAGGC GAACAGCACGCCTTCC CAACCTCTTTCTCTTC TTTTCGTTCGCATTGG CTTTGATCGCCAATGCAACG | ||
| Sequence-based reagent | Biomers | P- GCTGCGCTGCTCGGCT GGGCAAAACAGCCGAG AGCGCTCTTTCTCTTC TTTTGTTGGGAAGGCG TGCTGTTCGCCTTCTCCAAC | ||
| Sequence-based reagent | – Cy5 | Biomers | Cy5 -GCAGCGTTAATTCCCGC GCCTATCGGGAATGTAA CGCAGTGGGTAATAATG ACGATAGCCGTTCGGGA AAAGCGAACGGTATCG | |
| Sequence-based reagent | – Cy5 | Biomers | Cy5 - GCAGCGTTAATTCCCG CGCCTATCGGGAATGT AACGCAAAAGAAGAGA AAGACGATAGCCGTTC GGGAAAAGCGAACGGTATCG | |
| Sequence-based reagent | R (random) | Biomers | NNNNNNNNNNNNNNNN NNNNNNNNNNNNNNNN NNNNNNNNNNNNNNNN NNNNNNNNNNNNNNNN NNNNNNNNNNNNNNNNNNNN | |
| Sequence-based reagent | R (random) – Cy5 | Biomers | Cy5 - NNNNNNNNNNNNNNNN NNNNNNNNNNNNNNNN NNNNNNNNNNNNNNNN NNNNNNNNNNNNNNNN NNNNNNNNNNNNNNNNNNNN | |
| Software, algorithm | NUPACK | nupack.org | https://doi.org/10.1002/jcc.21596 | |
| Software, algorithm | ImageJ | ImageJ http://imagej.nih.gov/ij/ | RRID:SCR_002285 | |
| Software, algorithm | ImageJ stabilization plugin | http://www.cs.cmu.edu/~kangli/code/Image_Stabilizer.html |
Additional files
-
Source data 1
Nupack script used for the sequence design.
- https://cdn.elifesciences.org/articles/63431/elife-63431-data1-v1.zip
-
Supplementary file 1
Sequences of all DNA strands used.
Strand is 5’-labeled with Cy5, all other strands have a 5’-terminal phosphate. Solid underlines highlight hairpin loops, information domains are indicated by dashed underlines.
- https://cdn.elifesciences.org/articles/63431/elife-63431-supp1-v1.docx
-
Transparent reporting form
- https://cdn.elifesciences.org/articles/63431/elife-63431-transrepform-v1.pdf
Download links
A two-part list of links to download the article, or parts of the article, in various formats.
Downloads (link to download the article as PDF)
Open citations (links to open the citations from this article in various online reference manager services)
Cite this article (links to download the citations from this article in formats compatible with various reference manager tools)
tRNA sequences can assemble into a replicator
eLife 10:e63431.
https://doi.org/10.7554/eLife.63431


