Temporal evolution of single-cell transcriptomes of Drosophila olfactory projection neurons
- Department of Biology, Howard Hughes Medical Institute, Stanford University, United States
- Neurosciences Graduate Program, Stanford University, United States
- Department of Computer Science, Stanford University, United States
- Department of Bioengineering, Stanford University, United States
- Biophysics Graduate Program, Stanford University, United States
- Department of Applied Physics, Stanford University, United States
- Chan Zuckerberg Biohub, United States
Figures
Figure 1 with 1 supplement

Overview of single-cell transcriptomic profiling of Drosophila olfactory projection neurons (PNs).
(A) Schematic of the adult Drosophila olfactory system. Approximately 50 types of olfactory receptor neurons (ORNs) form one-to-one synaptic connections with 50 types of excitatory PNs at 50 glomeruli in the antennal lobe. Illustrated are two types each of ORNs (brown) and PNs (green), as well as two glomeruli to which their axons and dendrites target. (B) Schematic of the developmental process of the adult Drosophila olfactory system. The ~50 types of uniglomerular excitatory PNs are from either anterodorsal (adPN) or lateral (lPN) neuroblast lineages. PNs with cell body on the ventral side are inhibitory ventral PNs (vPNs). (C) Representative confocal images of PNs from four different developmental stages, 0 hr APF, 24 hr APF, 48 hr APF, and adult. APF: after puparium formation. Images are shown as maximum z-projections of confocal stacks. Antennal lobes are outlined. Scale bars, 40 μm. (D) Workflow of the single-cell RNA sequencing using plate-based SMART-seq2. FACS: fluorescence-activated cell sorting. (E) Summary of the number of high-quality PNs sequenced at each timepoint and driver lines used. Most PNs refer to PNs sequenced using either GH146-GAL4 or VT033006-GAL4. (F) Visualization of all sequenced PNs from four different developmental stages using tSNE plot. Dimensionality reduction was performed using the top 500 overdispersed genes identified from all sequenced PNs.
Figure 1—figure supplement 1
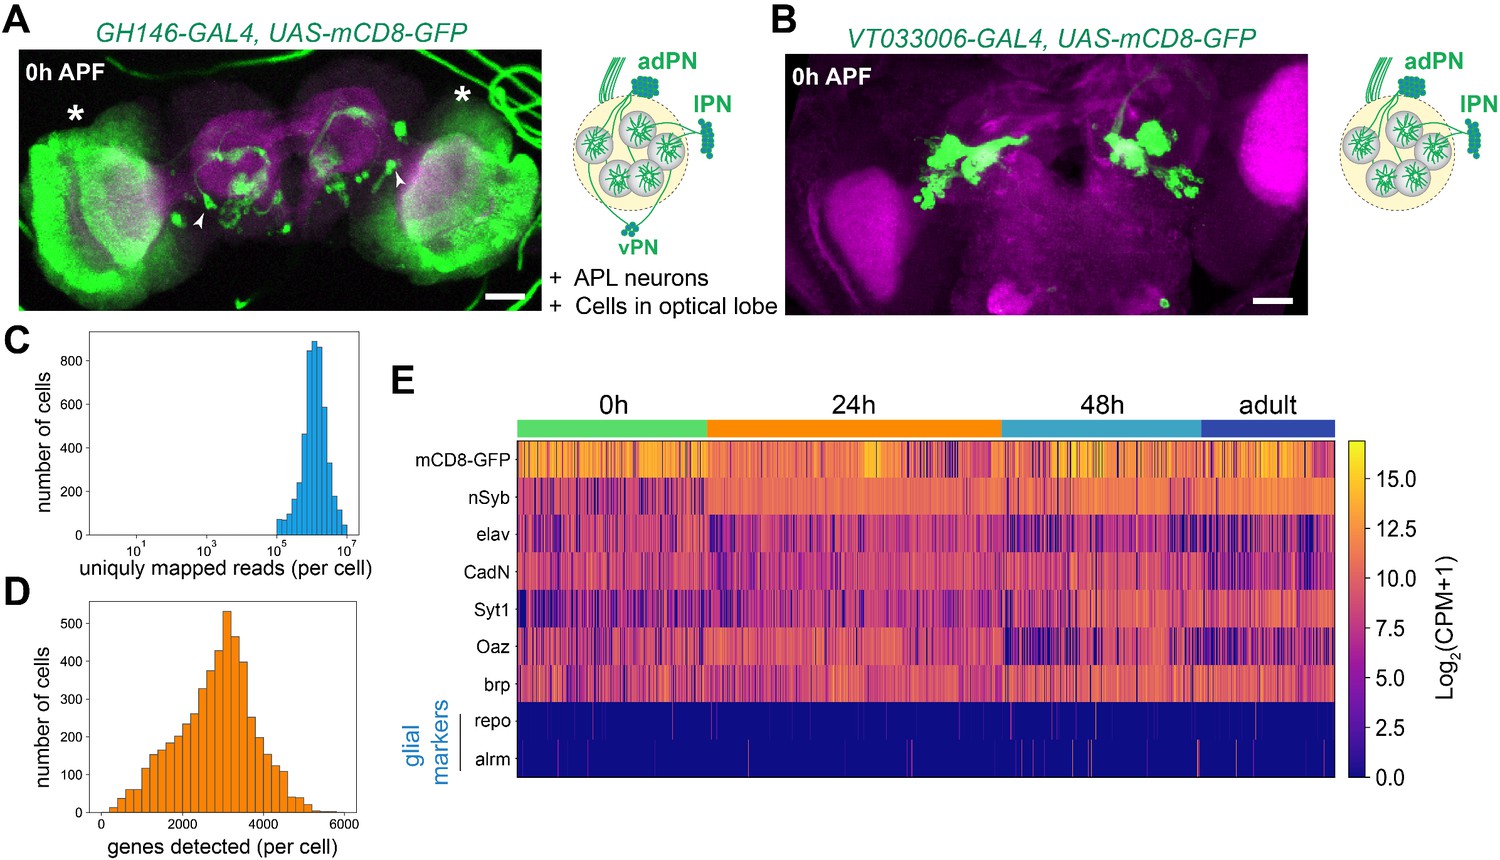
Technical characteristics of projection neuron (PN) scRNA-seq.
(A) Representative confocal image and illustration of cells labeled by GH146-GAL4 at 0 hr APF. Other than PNs and a pair of APL neurons in the central brain (arrowheads), many cells in the optic lobes (*) are also labeled. (B) Representative confocal image and illustration of cells labeled by VT033006-GAL4 at 0 hr APF. This driver labels excitatory PNs, but not cells in the optic lobes or vPN or APL neurons. Scale bars, 40 μm. (C) Distribution of the number of uniquely mapped reads per cell. (D) Distribution of the number of detected genes per cell. (E) Heatmaps showing the expression of: mCD8-GFP, pan-neuronal makers (nSyb, elav, CadN, Syt1, and brp), PN marker (Oaz), and glial markers (repo and alrm). Expression levels are indicated by the color bar (CPM, transcript counts per million).
Figure 2 with 3 supplements
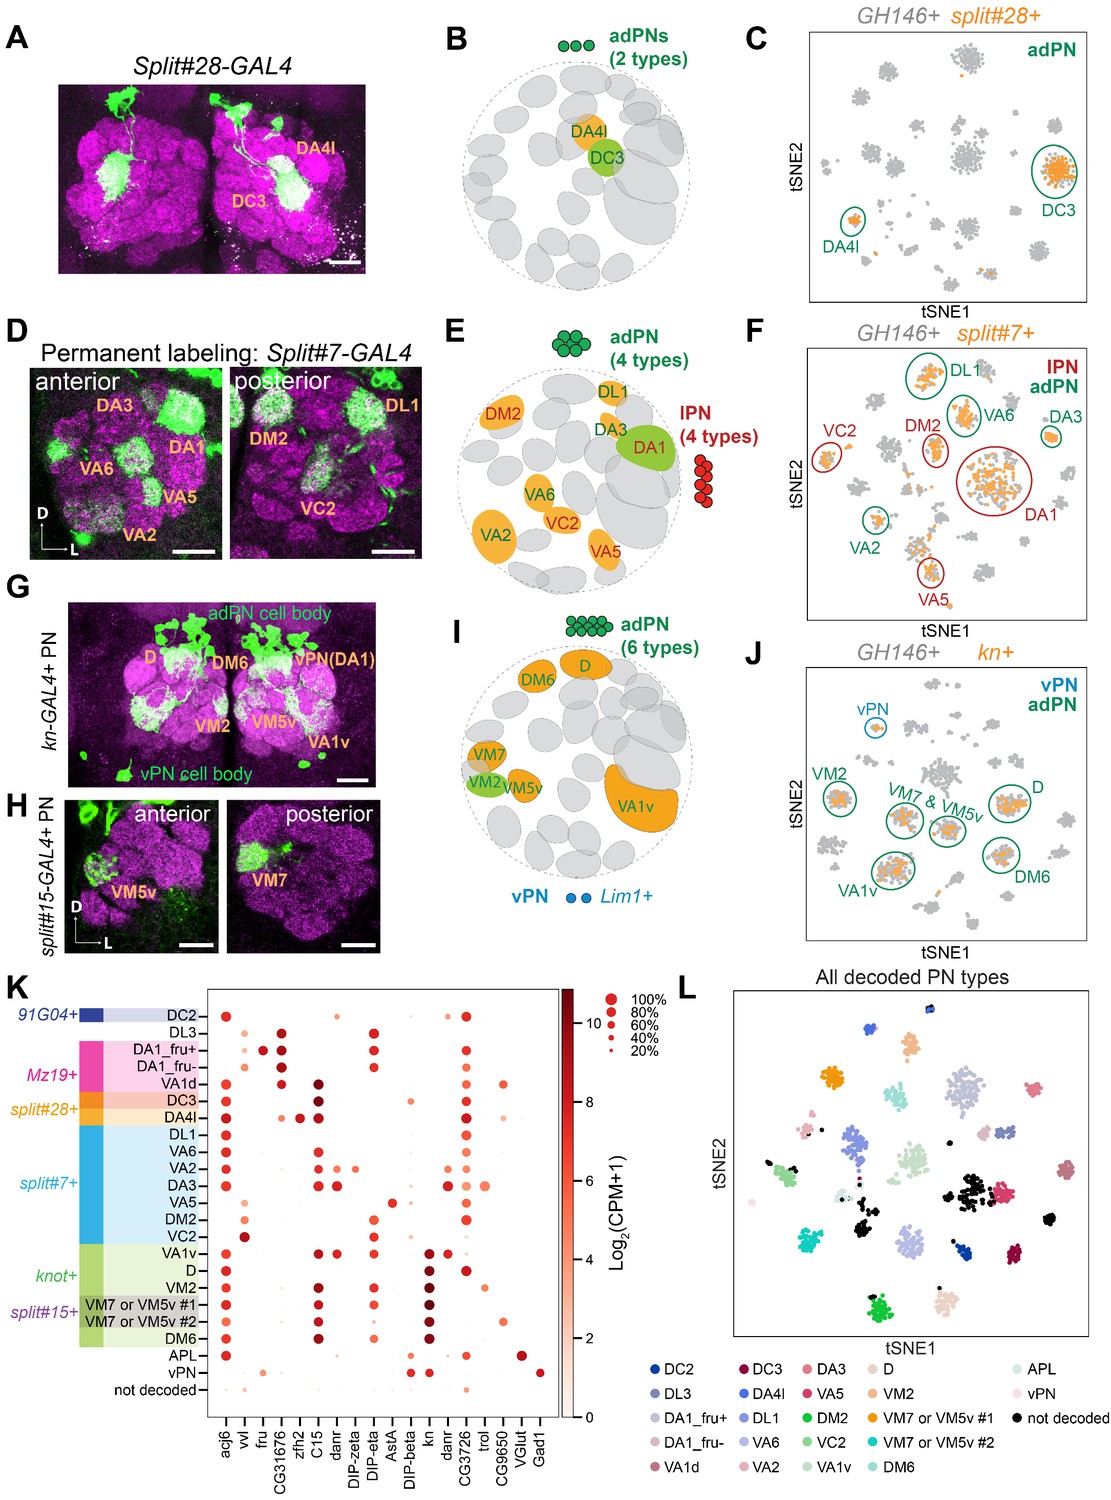
Matching 15 transcriptomic clusters to specific projection neuron (PN) types at 24 hr APF.
(A) Representative maximum z-projection of confocal stacks of split#28 GAL4 in adults. Dendrites of split#28 GAL4+ PNs target the DC3 and DA4l glomeruli. (B) Diagram of split#28-GAL4+ PNs. (C) tSNE plot showing newly sequenced split#28-GAL4+ PNs, which form two clusters that can be assigned to DC3 and DA4l PNs (see also Figure 2—figure supplement 1). (D) Representative confocal images of split#7 GAL4 labeled PNs using permanent labeling strategy. One anterior section and one posterior section of the antennal lobe are shown. Using permanent labeling, we found that this driver is expressed in eight PN types. Genotype: split#7-GAL4, UAS-Flp, Actin promoter-FRT-STOP-FRT-GAL4, UAS-mCD8-GFP. (E) Diagram of split#7-GAL4+ PNs. split#7 GAL4 labels eight types of PNs. four from the adPN lineage (green letters) and four from the lPN lineage (red letters). (F) tSNE plot of split#7 GAL4 PNs with GH146+ PNs (see Figure 2—figure supplement 2 for details on the decoding procedure). (G) Representative maximum z-projection of confocal stacks of kn+ PNs in the adult. kn-GAL4 was intersected with GH146-Flp to restrict the expression of GAL4 in only PNs. (H) Representative confocal images of split#15 GAL4 in adults, which labels two kn+ PN types. (I) Diagram showing that kn+ PNs include six types of adPNs and two vPNs. (J) tSNE plot of kn-GAL4 PNs with GH146+ PNs (see Figure 2—figure supplement 3 for details on the decoding procedure). (K) Dot plot summarizing drivers and marker genes we used to map 21 transcriptomic clusters to 20 PN types [14 adPNs, 5 lPNs—DA1 PNs form two clusters, one fru+ and one fru– (Li et al., 2017)—and 1 vPNs] and the anterior paired lateral (APL) neurons at 24 hr APF. Gene expression level [log2(CPM+1)] is shown by the dot color, and percentages of cells expressing a marker are shown by dot size. (L) tSNE plot showing 24 hr APF PNs colored by PN types (GH146+ PNs with split#7+/ split#28 PNs to increase cell number in some less abundant PN types). Scale bars, 20 μm. Axes, D (dorsal), L (lateral). In panel B, E, and I, orange glomeruli represent PN types of unknown transcriptomic identity prior to this study. Green glomeruli represent PN types whose transcriptomic identity were previously decoded. Note that the positions of cells on a tSNE plot are dependent on the random initialization of the program as well as every cell present in the dataset, therefore the position of GH146+ PNs clusters are different when we plot them with different set of newly sequenced PNs (gray in panels C, F, and J).
Figure 2—figure supplement 1
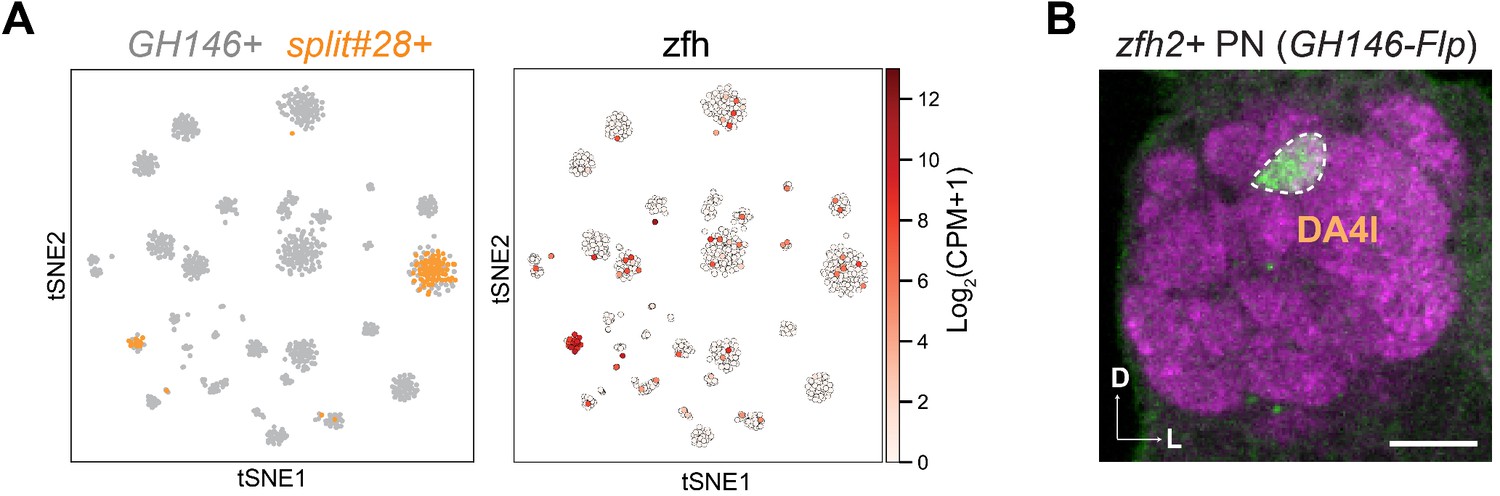
Validation of DA4l projection neuron (PN) identity.
(A) Visualization of GH146+ and split#28-GAL4+ PNs using tSNE. Cells are colored according to driver genotypes (left) or by the expression of zfh2 (right). (B) zfh2-GAL4, after intersecting with GH146-Flp, labels DA4l PNs. Scale bars, 20 μm. Axes, D (dorsal), L (lateral).
Figure 2—figure supplement 2
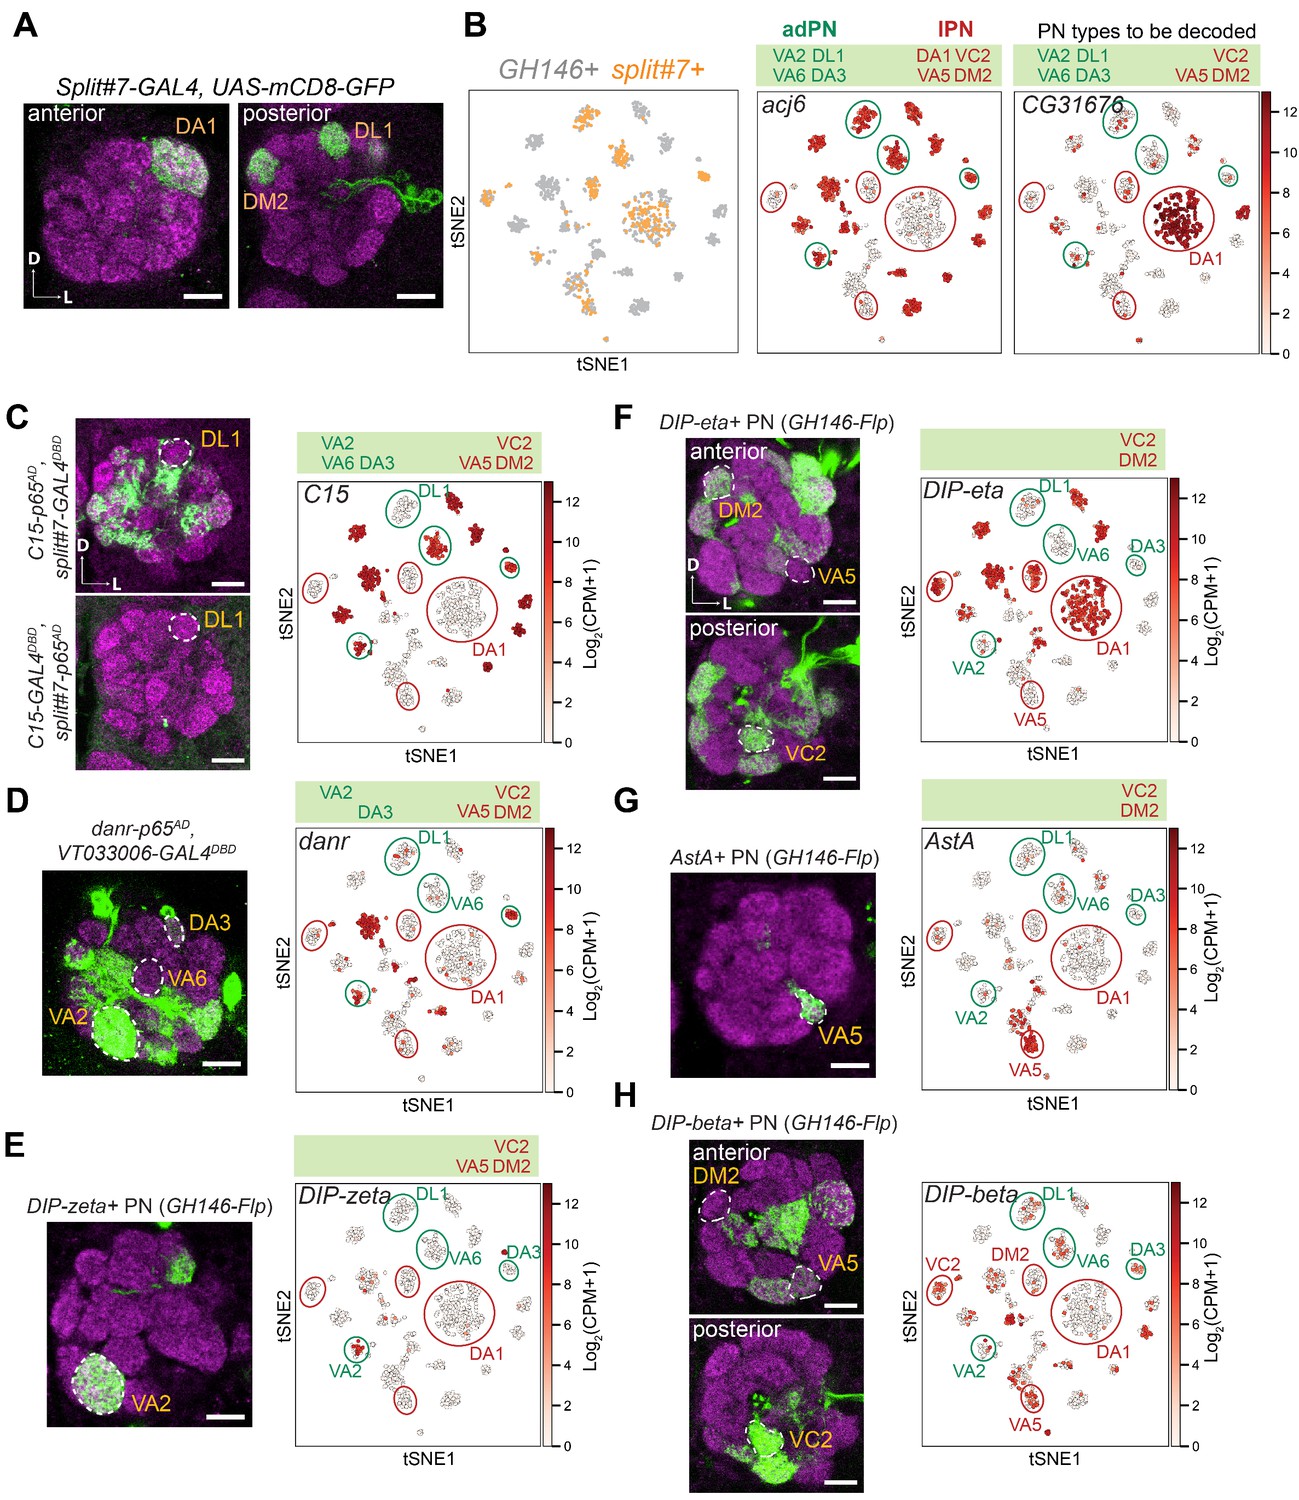
Decoding the identity of split#7+ projection neurons (PNs).
(A) Representative confocal images of split#7+ PNs. Without permanent labeling, this driver is strongly expressed in three PN types in adults. Permanent labeling showed that it can label eight adult PN types (Figure 2D), suggesting that this driver is expressed in eight PN types during development and turned off in five of them in adult stage. (B) Visualization of GH146+ and split#7+ PNs colored according to genotype (left), acj6 (middle), and CG31676 (right) expression. Previously, we know among those split#7+ PNs, the cells with CG31676 expression are DA1 PNs (Li et al., 2017). (C) Among split#7+ adPN clusters (circled in green), only one cluster does not express C15. Intersection between C15-p65AD and the GAL4 DNA-binding domain (DBD) from split#7 (top) as well as intersection between C15-GAL4DBD and the p65-activating domain (AD) from split#7 (bottom) revealed that the C15-negative cluster represents DL1 PNs. (D) Among split#7+ adPNs (circled in green), two clusters are danr–. One of those cluster represents DL1 PNs. Intersection between danr-p65AD and VT033006-GAL4DBD (split-GAL4 with PN specific expression) revealed the other danr– adPN is VA6 PNs. (E) One split#7+ cluster specifically expresses DIP-zeta. Intersection between DIP-zeta-GAL4 and GH146-Flp revealed this cluster represents VA2 PNs. As three out of four adPN clusters are assigned, we assigned the last unassigned to be DA3 PNs. (F) Among split#7+ lPNs (circled in red), only one cluster is DIP-eta-. Intersection between DIP-eta-GAL4 and GH146-Flp revealed the identity of this cluster as VA5 PNs. (G) The DIP-eta– cluster also specifically expresses AstA. Intersection between AstA-GAL4 and GH146-Flp labels VA5 PNs, further confirming its identity. (H) Among the last two unmapped clusters, one is DIP-beta+. Intersection between DIP-beta-GAL4 and GH146-Flp revealed the cluster negative for DIP-beta is DM2 PNs. And we assigned the remaining split#7+ lPN cluster to be VC2 PNs. Scale bars, 20 μm. Axes, D (dorsal), L (lateral).
Figure 2—figure supplement 3
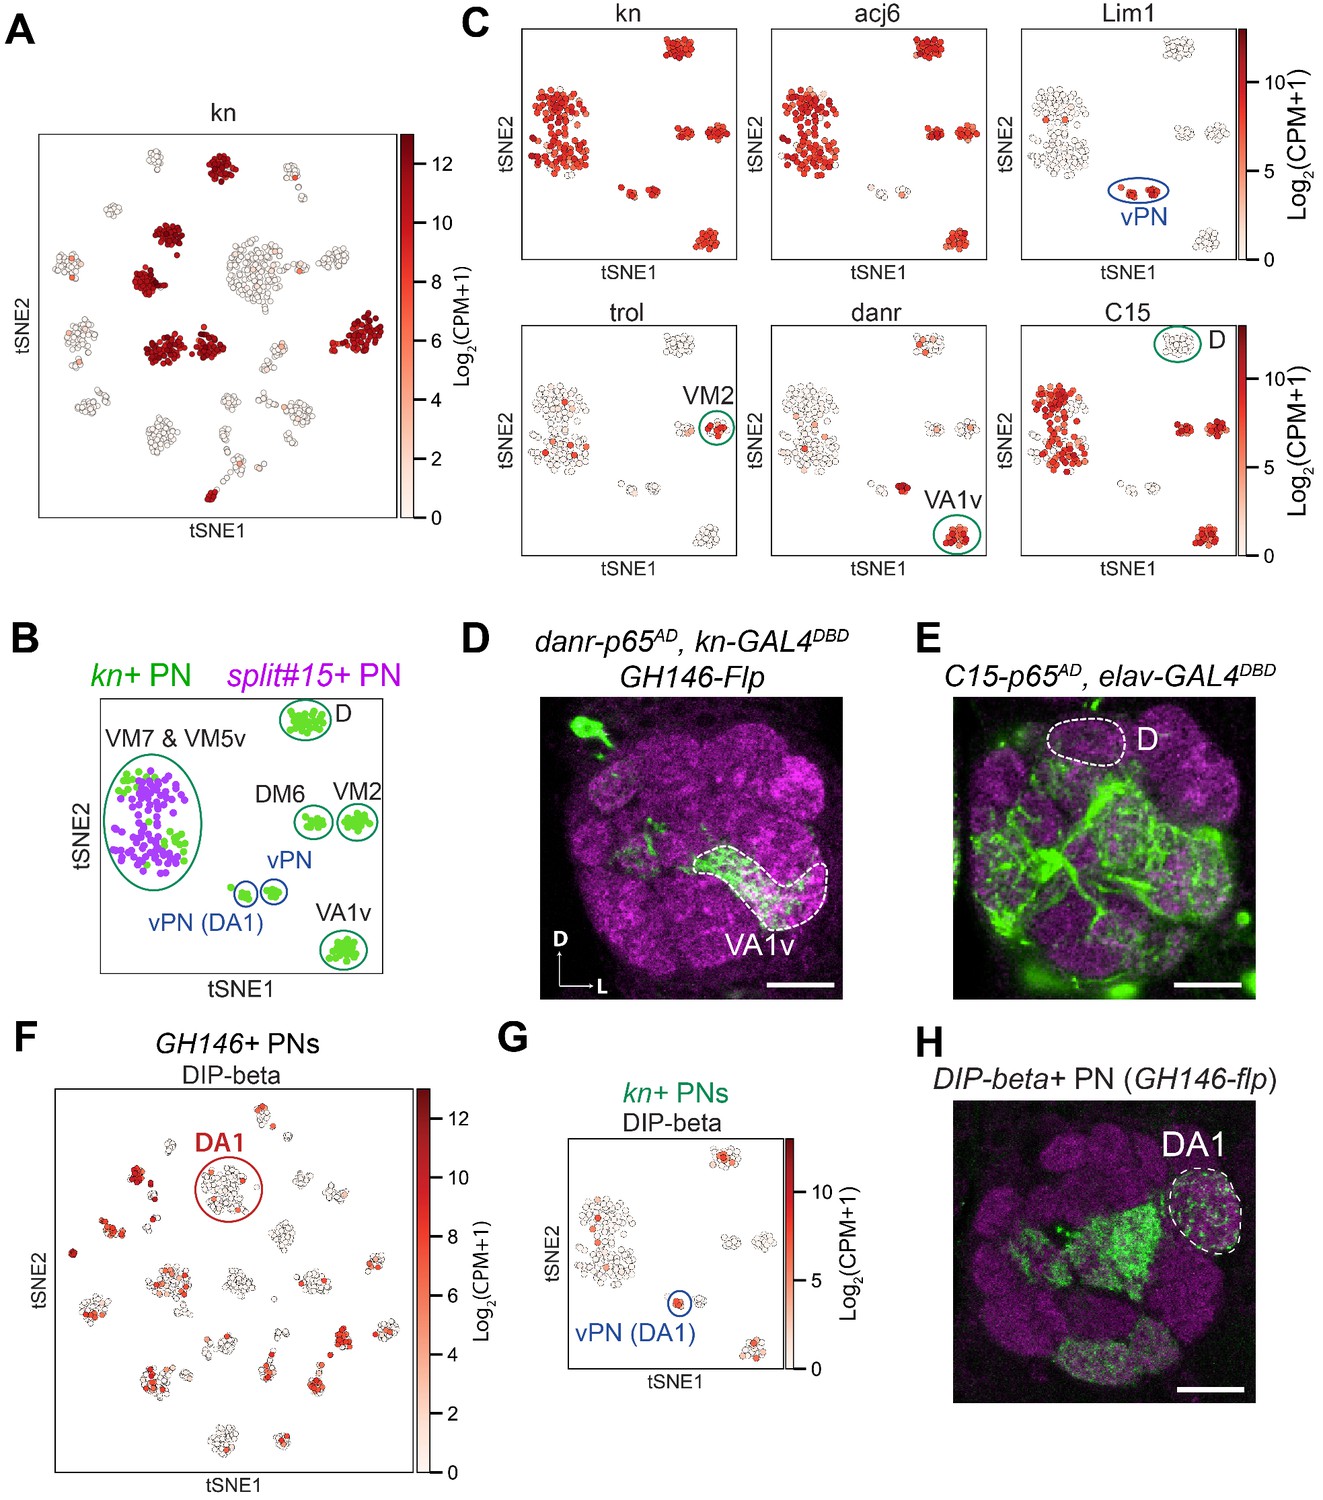
Decoding the identity of kn+ projection neurons (PNs).
(A) kn is expressed in seven transcriptomic cluster in GH146+ PNs at 24 hr APF. (B) Visualization of kn+ and split#15-GAL4+ PNs at 24 hr APF using tSNE. kn+ PNs (green) form eight clusters, two of them intermingled with split#15-GAL4+ PNs (purple). These eight clusters are assigned to specific PN types using information in the following panels. (C) Summary of marker genes used to decode the identity of kn-GAL4+ PNs. trol+ cluster represents VM2 PNs (Li et al., 2017). (D) Intersection between kn-GAL4DBD and danr-p65AD with GH146-Flp revealed that the cluster positive for both kn and danr is VA1v PNs. (E) Intersection between C15-p65AD and elav-GAL4DBD revealed that the cluster positive for acj6 but negative for C15 is D PNs. (F) Visualization of DIP-beta expression among GH146+ PNs. DA1 lPNs does not express DIP-beta. (G) Visualization of DIP-beta expression among kn+ PNs. One vPN cluster expresses DIP-beta. (H) Representative confocal image of DIP-beta-GAL4 after intersecting with GH146-Flp. Innervation of the DA1 glomerulus indicated the DIP-beta+ vPN cluster is vPN (DA1). Scale bars, 20 μm. Axes, D (dorsal), L (lateral).
Figure 3
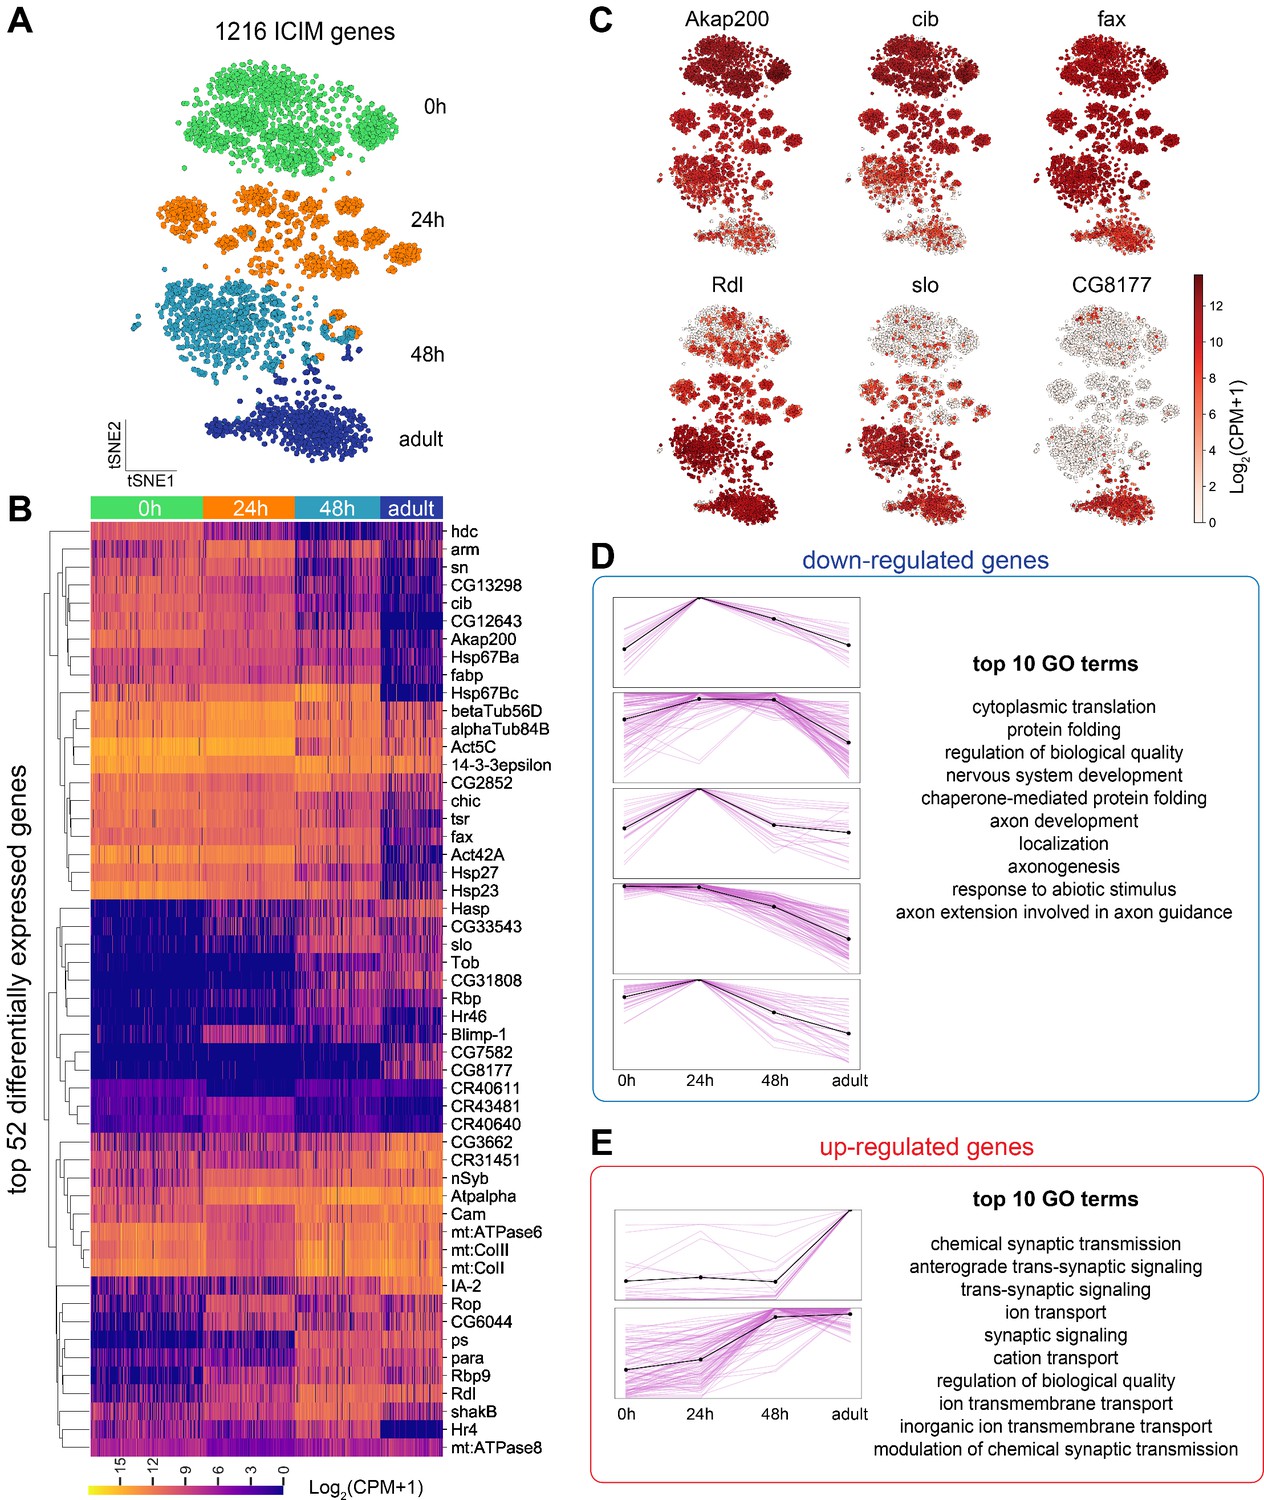
Global gene expression dynamics of projection neurons (PNs).
(A) Visualization of PNs from four different developmental stages: 0 hr APF, 24 hr APF, 48 hr APF, and adult sequenced using either VT033006-GAL4 or GH146-GAL4. tSNE dimensionality reduction was performed using 1216 genes identified by iterative clustering for identifying markers (ICIM) among them. (B) Hierarchical heatmap showing the expression of the top 52 out of 474 differentially expressed genes identified among PNs of different developmental stages. (C) Examples of the expression of the dynamic genes. Cells are colored according to the expression level of each gene. Akap200 (A kinase anchor protein 200, encodes a scaffolding protein that contributes to the maintenance and regulation of cytoskeletal structure), cib (ciboulot, encodes an actin binding protein), and fax (failed axon connections, a gene involved in axon development) have the highest expression in early pupal stage and are downregulated gradually. Rdl (Resistant to dieldrin, encodes a chloride channel), slo (slowpoke, encodes a subunit of calcium-activated potassium channel), and CG8177 (Anion exchanger 2), are upregulated as PNs develop. (D, E) Top 474 differentially expressed genes can be divided into eight groups based on their dynamic profiles—two groups without obvious developmental trend (not shown), five groups of down-regulated genes (D), and two groups of upregulated genes (E). Pink lines represent individual genes and the black line shows mean expression of genes in each group. The highest expression is normalized as one for all genes. The top 10 Gene Ontology (GO) terms for upregulated and downregulated genes are shown on right.
Figure 4 with 2 supplements
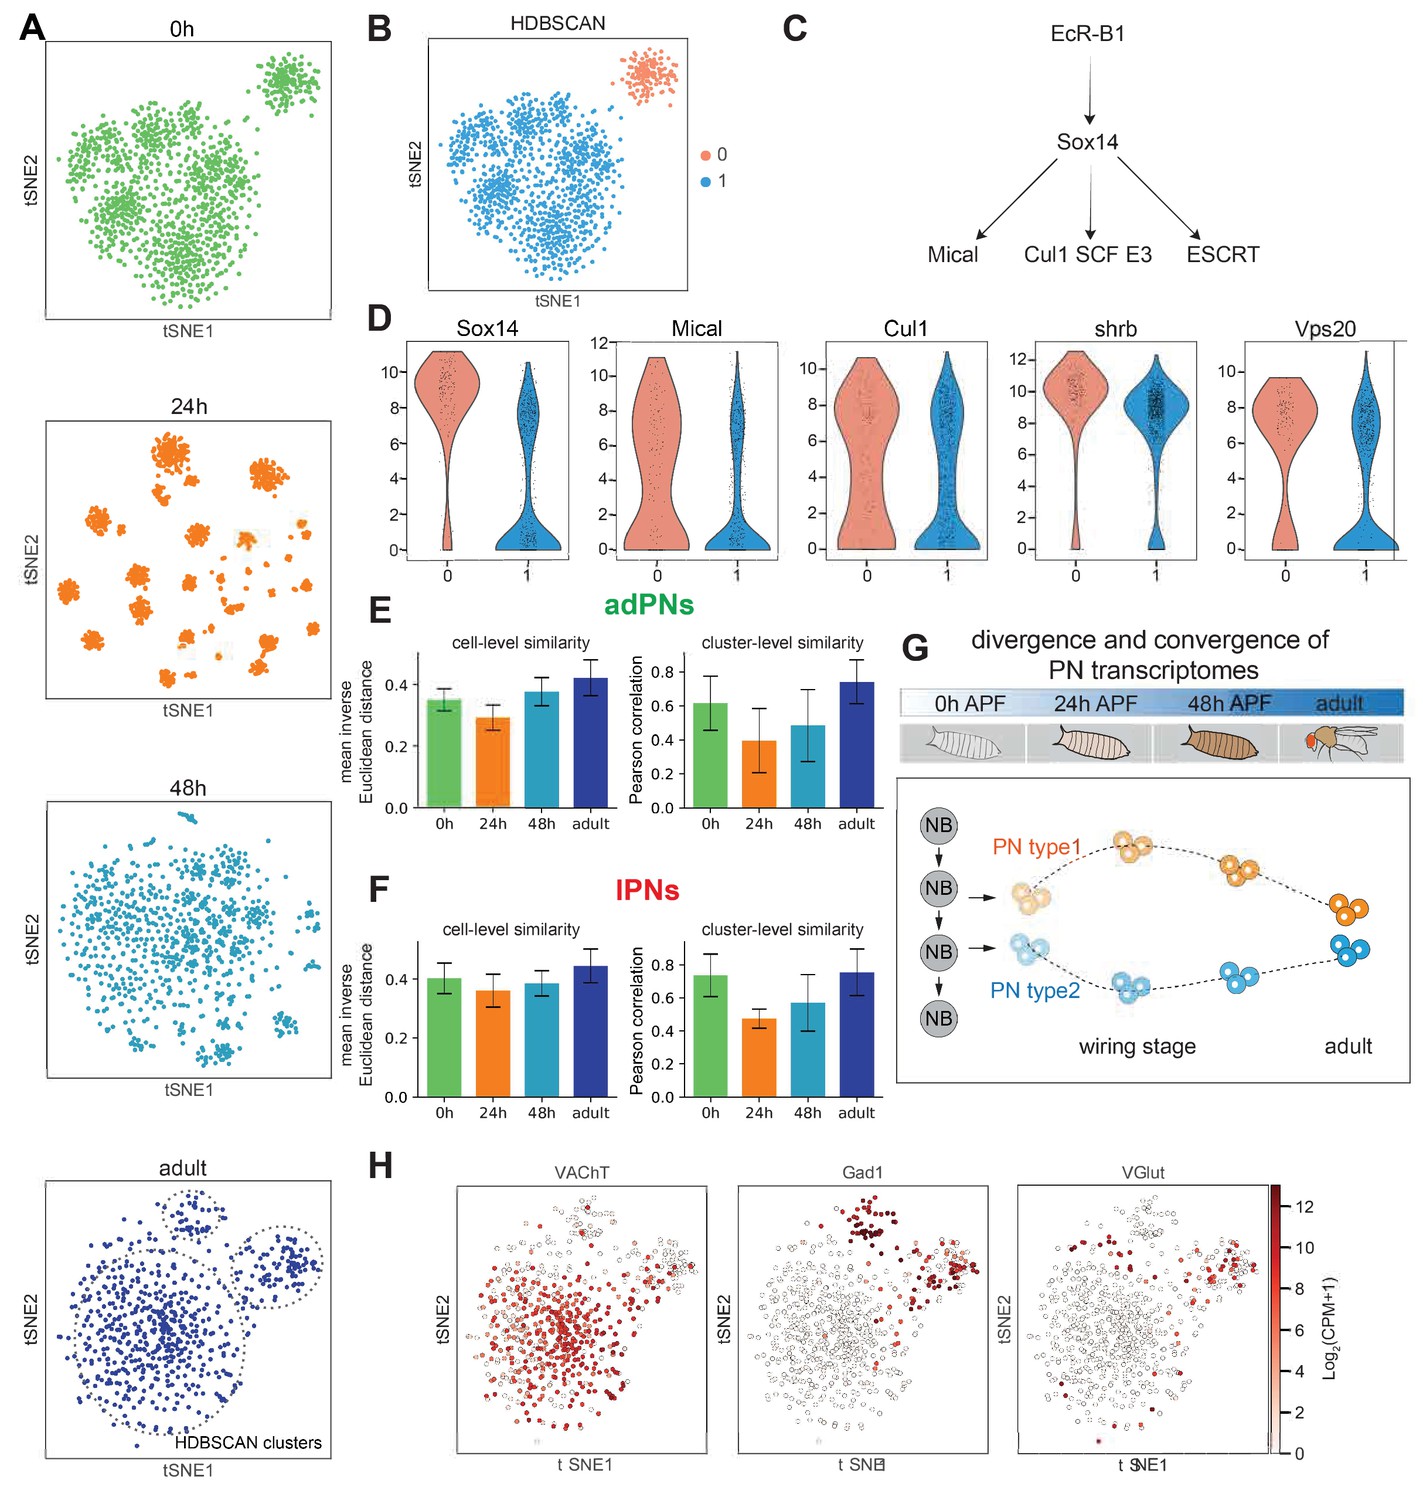
PN transcriptomes show distinct features at different stages of development.
(A) Visualization of most projection neurons (PNs) from 0 hr APF, 24 hr APF, 48 hr APF, and adults using tSNE based on genes identified by ICIM at each stage. Adult clusters (circled) are identified using HDBSCAN. (B) Clustering of 0 hr APF PNs using HDBSCAN identified two clusters. (C) Part of the molecular pathways critical for neurite pruning in Drosophila. (D) Genes whose function have been implicated in neurite pruning have higher expression in cluster 0: Sox14 (p-value: 5.01E-51), Mical (p-value: 1.49E-09), Cul1 (p-value: 8.15E-4), shrb (p-value: 6.37E-19), and Vps20 (p-value: 1.23E-17) (Mann-Whitney U test). (E, F). PN transcriptomic similarity calculated at the cell level (mean inverse Euclidean distance calculated using 1216 ICIM genes identified from PNs of all four stages) and the cluster level (Pearson correlation calculated using differentially expressed genes identified from 24 hr PN clusters) for adPNs (E) (0 hr APF: 587 cells, cell-level similarity [mean ± standard deviation]: 0.350 ± 0.036, 15 clusters, cluster-level similarity [mean ± standard deviation]: 0.615 ± 0.160; 24 hr APF: 547 cells, cell-level similarity: 0.292 ± 0.041, 15 clusters, cluster-level similarity: 0.395 ± 0.189; 48 hr APF: 301 cells, cell-level similarity: 0.377 ± 0.046, 13 clusters, cluster-level similarity: 0.484 ± 0.212; adult stage: 209 cells, cell-level similarity: 0.422 ± 0.058, 15 clusters, cluster-level similarity: 0.741 ± 0.129) and lPNs (F) (0 hr APF: 484 cells, cell-level similarity: 0.402 ± 0.052, 10 clusters, cluster-level similarity: 0.736 ± 0.129; 24 hr APF: 354 cells, cell-level similarity: 0.360 ± 0.056, 10 clusters, cluster-level similarity: 0.474 ± 0.057; 48 hr APF: 296 cells, cell-level similarity: 0.385 ± 0.043, 10 clusters, cluster-level similarity: 0.570 ± 0.171; adult stage: 191 cells, cell-level similarity: 0.444 ± 0.057, eight clusters, cluster-level similarity: 0.754 ± 0.141). (G) Schematic summary of PN transcriptome similarity changes from early pupal stage to adulthood. PN diversity peaks during circuit assembly around 24 hr APF and gradually diminishes as they develop into mature neurons. (H) Expression of VAChT, Gad1, and VGlut in adult PNs.
Figure 4—figure supplement 1
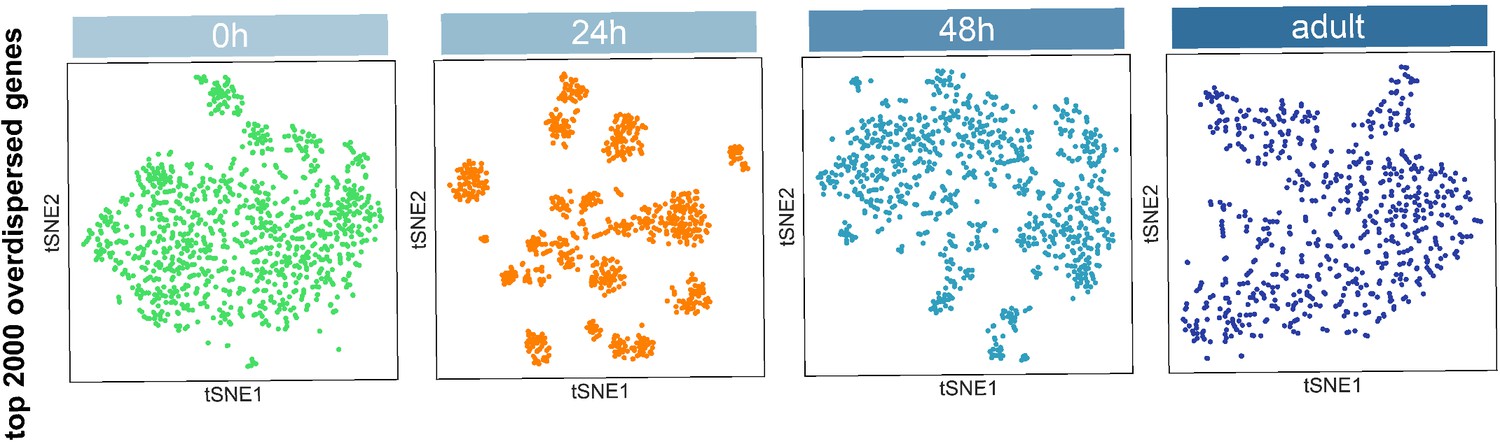
Visualization of most projection neurons (PNs) at different stages using tSNE.
Dimensionality reduction was computed using top 2000 overdispersed genes found at each stage.
Figure 4—figure supplement 2
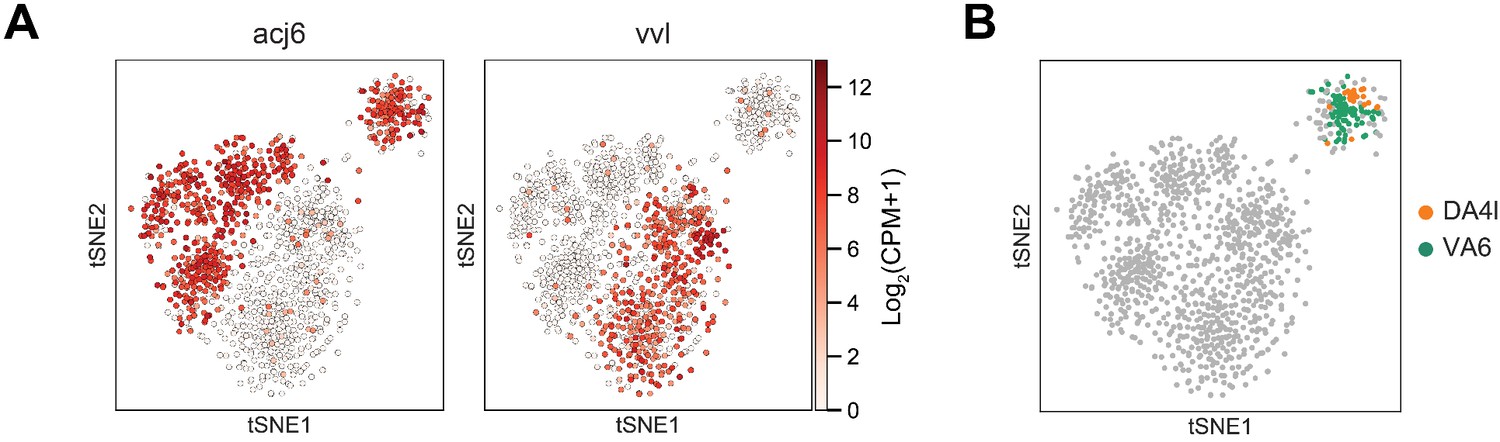
Embryonically born and larval born projection neurons (PNs) at 0 hr APF.
(A) The larger cluster at 0 hr APF consists of both adPNs (acj6+) and lPNs (vvl+) while the smaller cluster contains only adPNs. (B) Two types of embryonically born PNs, DA4l and VA6 PNs, are both mapped to the smaller cluster (details in Figure 7).
Figure 5 with 1 supplement
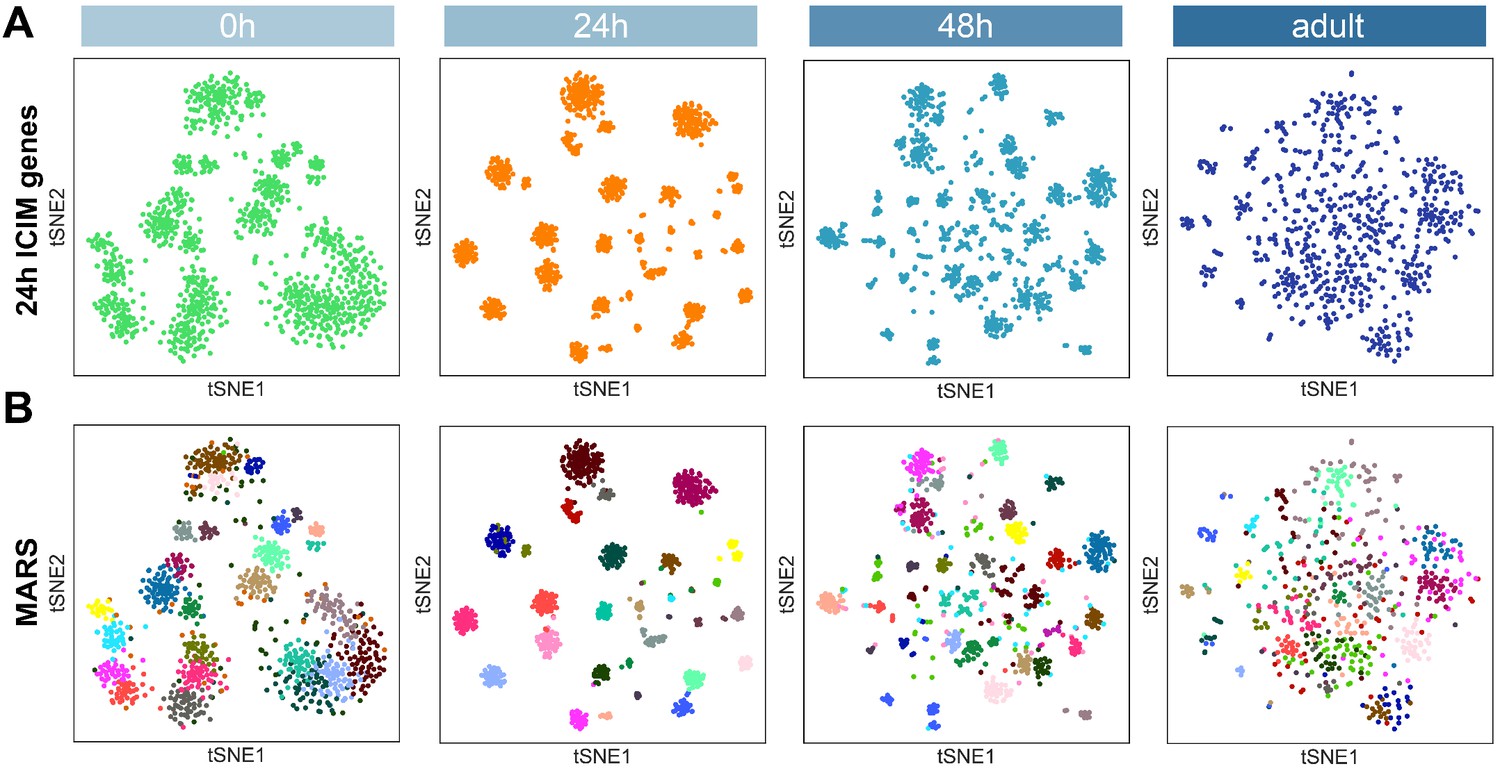
Projection neuron (PN) type identification by MARS.
(A) Dimensionality reduction of most PNs at four developmental stages by 561 ICIM genes found at 24 hr APF. (B) PN types identified by MARS. Different MARS clusters are illustrated in different colors.
Figure 5—figure supplement 1
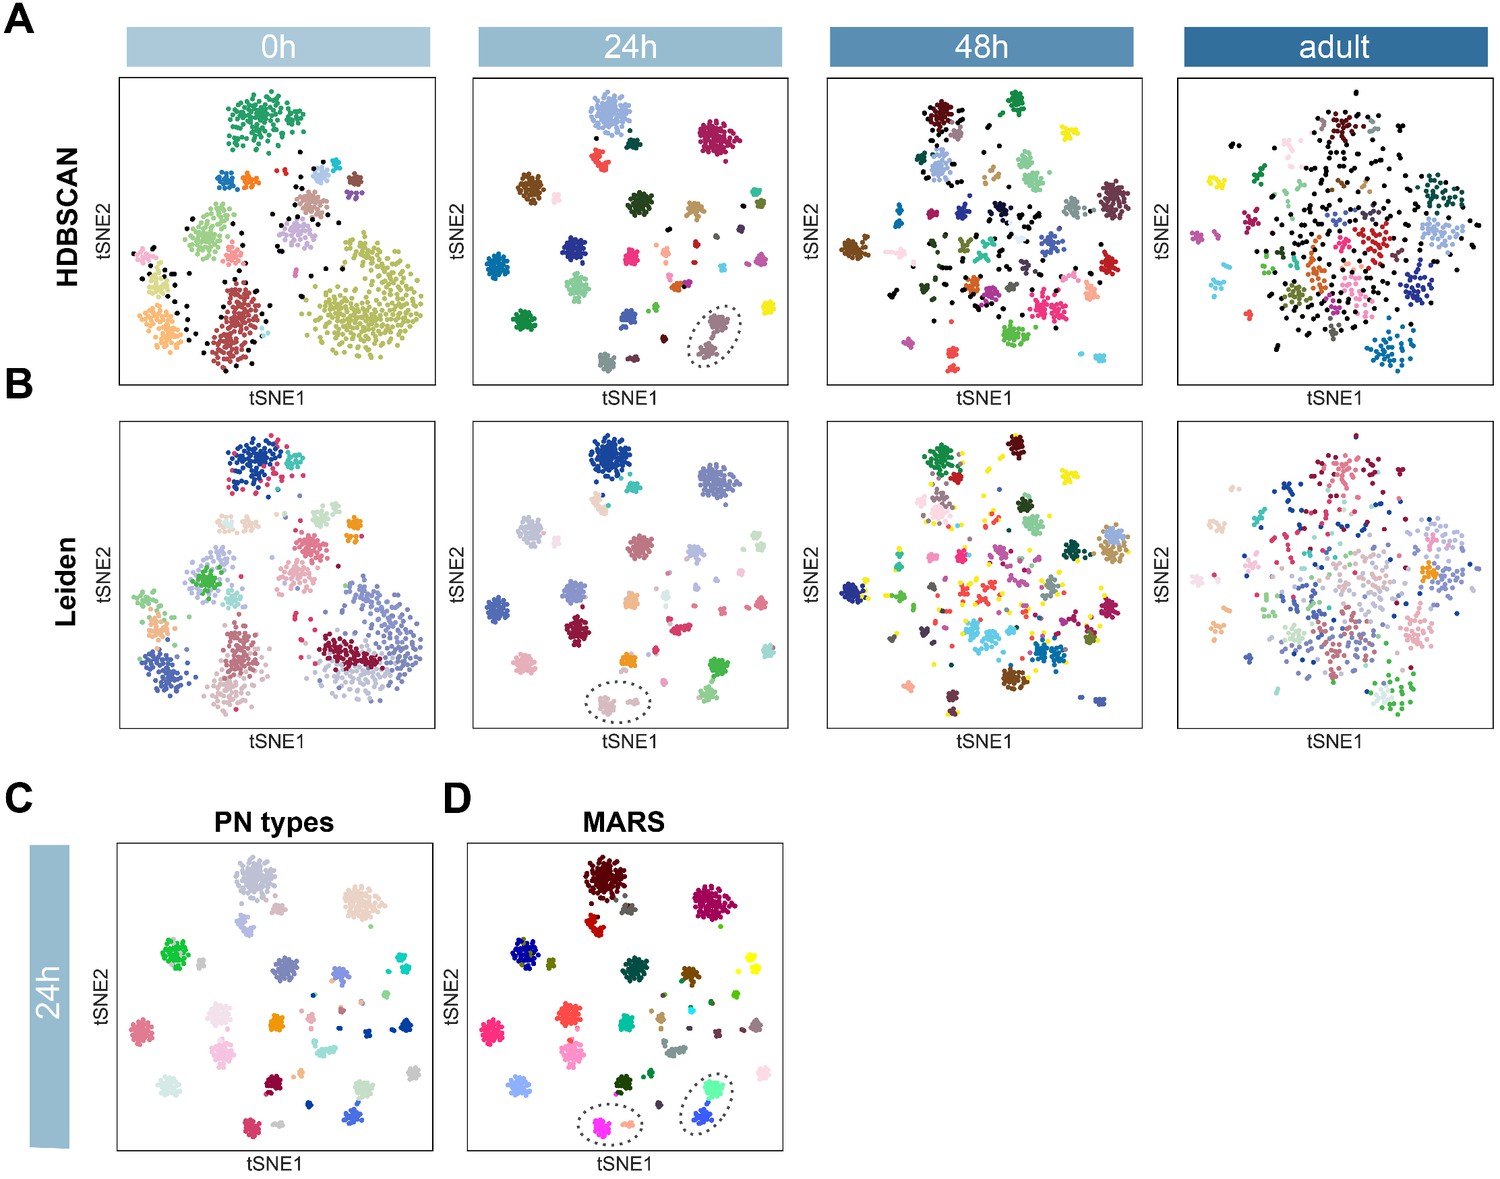
Projection neuron (PN) type identification using two other independent methods.
(A) Dimensionality reduction by 24 hr ICIM genes followed by cluster identification using HDBSCAN. Circled cells belong to two PN types but are assigned to the same cluster using HDBSCAN. (B) Cluster identification by Leiden based on neighborhood graph computed on 24 hr ICIM genes. Circled cells belong to two PN types but are assigned to the same cluster using Leiden. (C) 24 hr APF PNs colored according to PN types validated in Figure 2. (D) PN types identified using MARS (same as Figure 5B). Some PN types which are incorrectly annotated by HDBSCAN or Leiden are correctly annotated as distinct clusters by MARS.
Figure 6 with 1 supplement
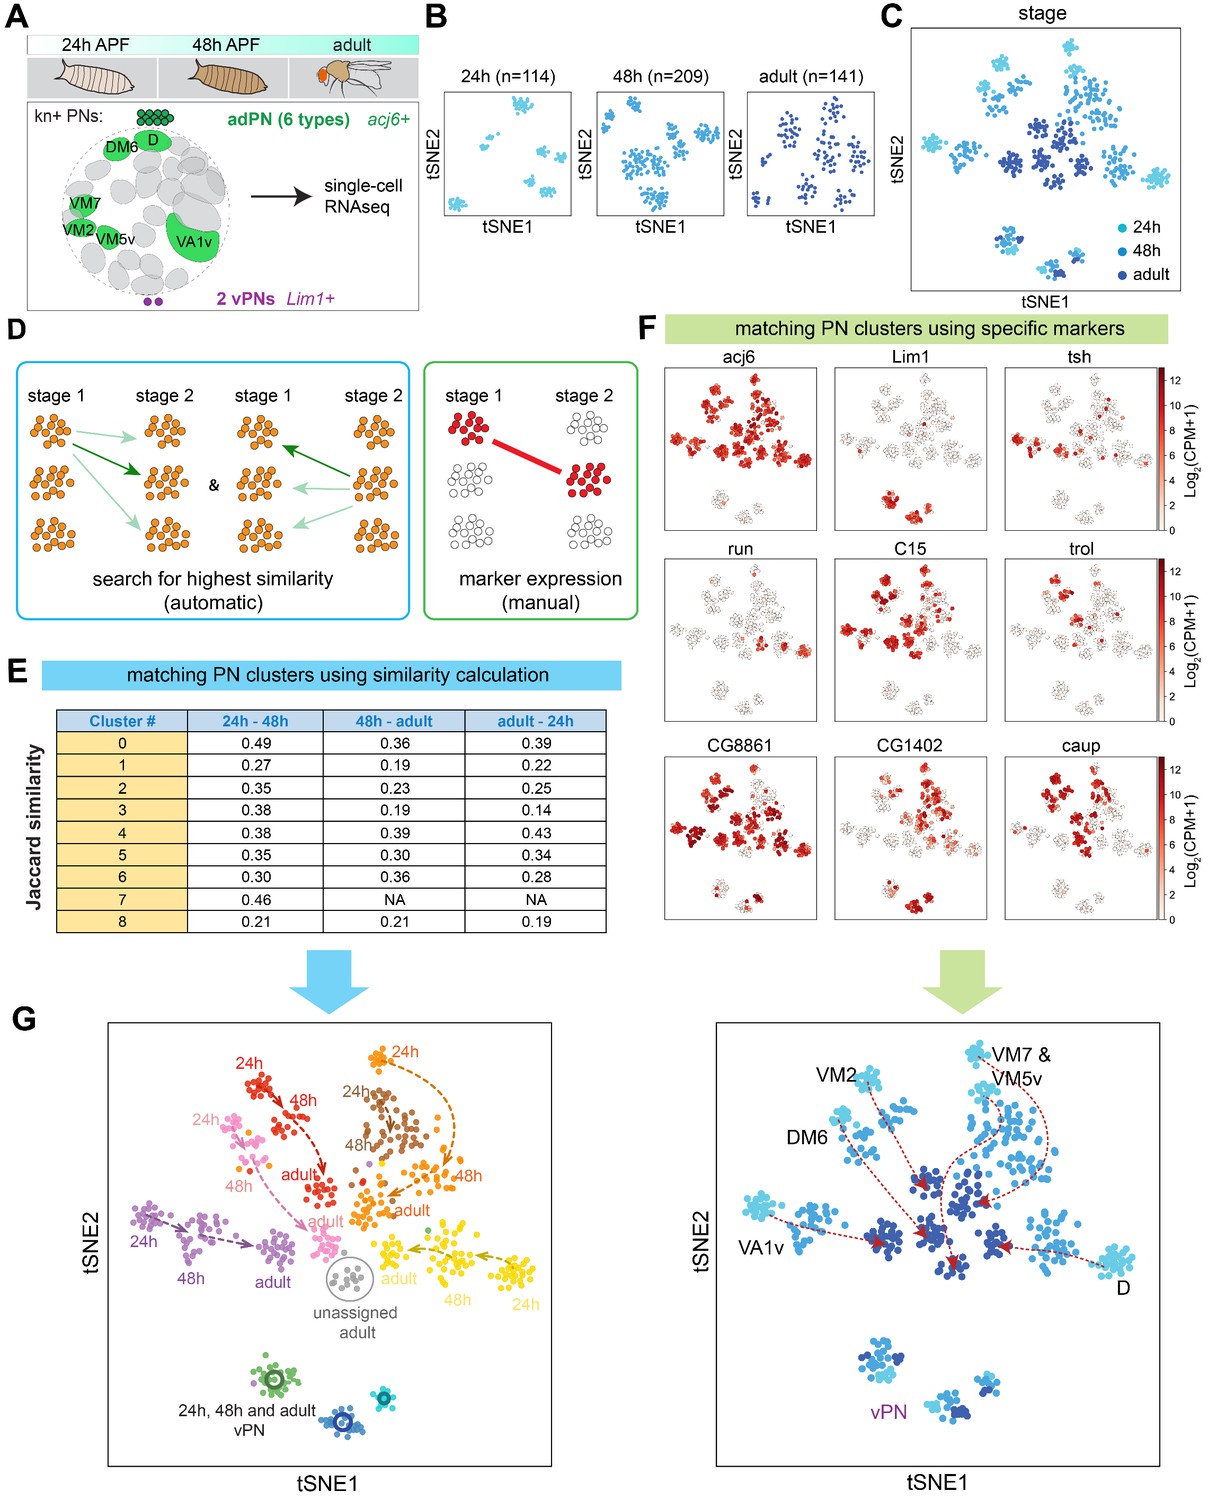
Two complementary approaches to match transcriptomic clusters representing same projection neuron (PN) types at different developmental stages.
(A) scRNA-seq was performed for kn+ PNs from three different developmental stages: 24 hr APF, 48 hr APF, and adult. (B) tSNE plots showing kn+ PNs from three different stages, plotted separately. Cells are clustered according to 24 hr ICIM genes. Cell numbers are indicated. (C) kn+ PNs from three different stages plotted in the same tSNE plot. Cells are clustered according to 24 hr ICIM genes. (D) Two approaches were used for matching the same PN types at different stages: (1) automatic prediction by calculating the transcriptomic similarity between clusters at two stages (2) manual matching of clusters using specific markers or marker combinations. (E) Jaccard similarity index of automatically matched transcriptomic clusters from different stages. Clusters #7 (brown cells in panel G) in 24 hr and 48 hr APF do not match with any cluster in the adult stage; therefore, the similarity calculation is left as not applicable (NA). (F) Examples of markers used to manually match transcriptomic clusters representing the same PN types across different stages. (G) All kn+ PN types (six adPNs and three vPNs) are matched from three different stages. Two independent approaches (automatic and manual) produced similar results.
Figure 6—figure supplement 1
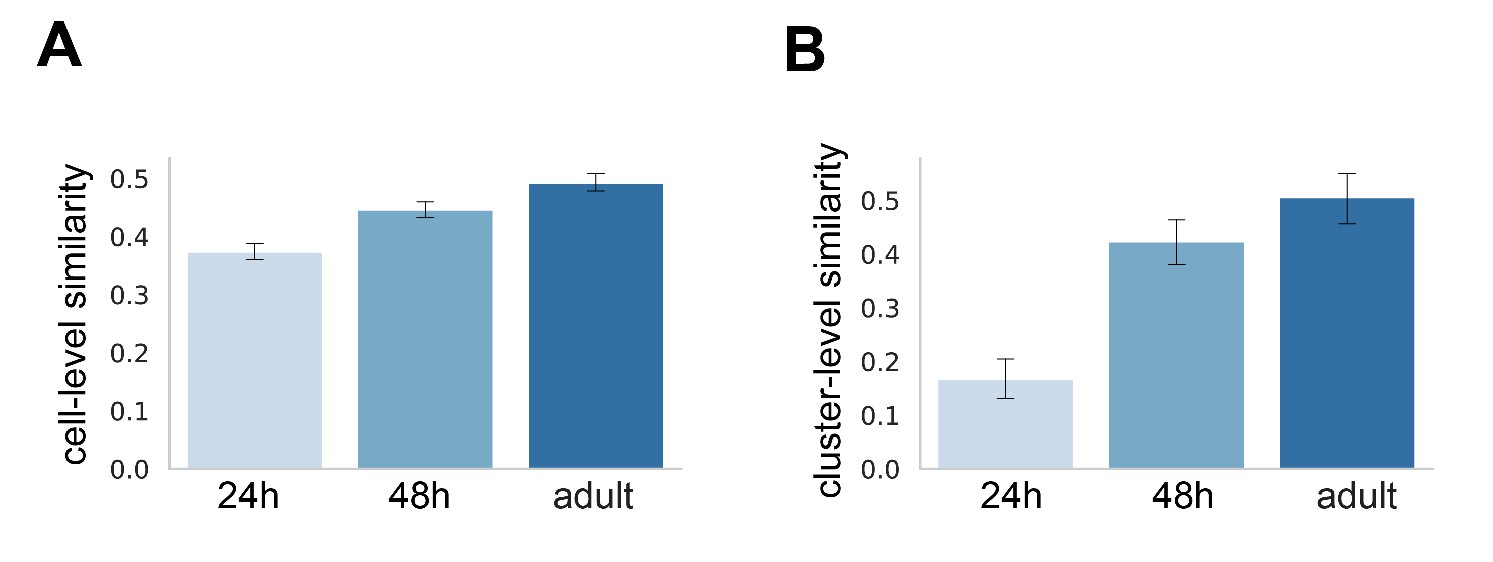
kn+ adPN transcriptomes become more similar as development proceeds.
(A) Bar plot of Euclidean distance between all pairs of kn+ cells using ICIM genes identified among them. kn+ vPNs are excluded from this analysis. 24 hr APF: 98 cells, mean ± standard deviation: 0.374 ± 0.066; 48 hr APF: 174 cells, mean ± standard deviation (std): 0.446 ± 0.912; adult: 124 cells, mean ± std: 0.493 ± 0.085 (B) Bar plot of Pearson's correlation between all pairs of kn+ adPN clusters. 24 hr APF: six clusters, mean ± std: 0.167 ± 0.141; 48 hr APF: six clusters, mean ± std: 0.424 ± 0.170; adult: six clusters, mean ± std: 0.506 ± 0.187.
Figure 7 with 2 supplements
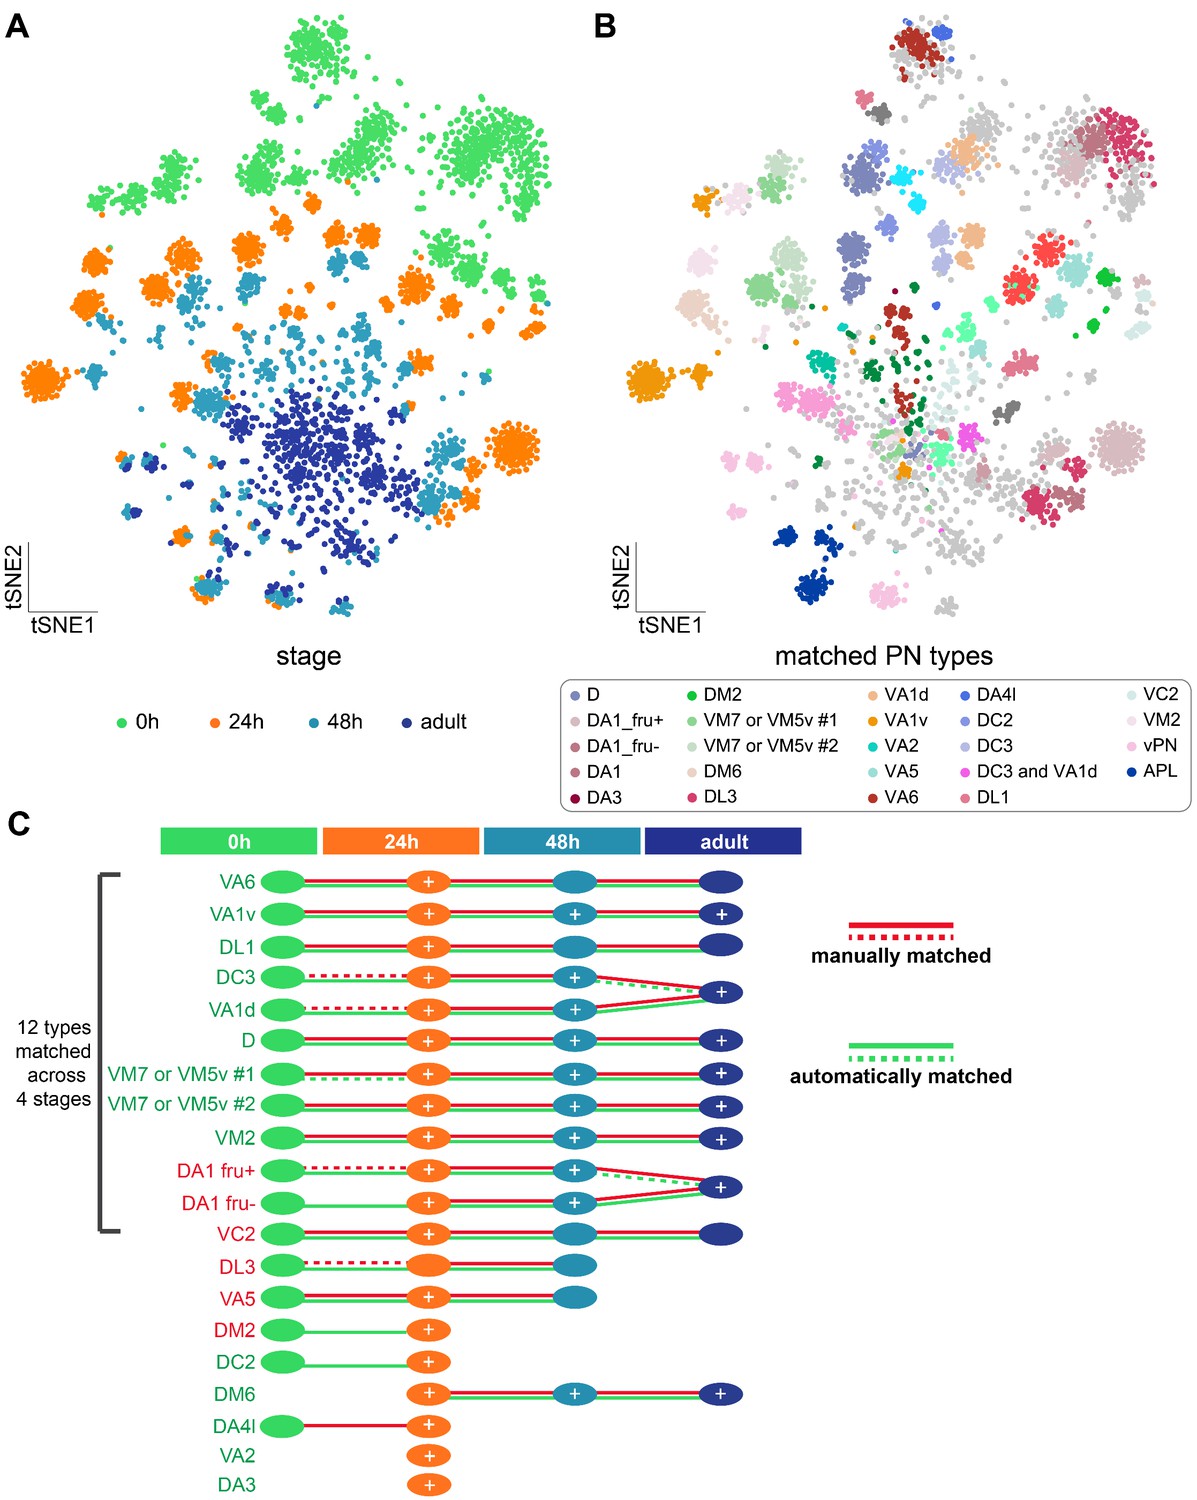
Matching transcriptomic cluster representing the same projection neuron (PN) types across four developmental stages.
(A) Visualization of most PNs at four different developmental stages: 0 hr APF, 24 hr APF, 48 hr APF, and adult. A total of 561 ICIM genes at 24 hr APF PNs were used for dimensionality reduction. (B) Visualization of the same types of PNs at all developmental stages. Clusters with the same color represent same neuronal type. Light gray dots indicate cells that have neither been decoded nor matched. (C) Summary of transcriptomic clusters mapped to known PN types at different developmental stages. Solid red-lines indicate clusters we can unambiguously match using marker combinations; dashed red-lines indicate PN types we can narrow down to less than three transcriptomic clusters. Solid green-lines indicate clusters that are two-way matched automatically (two clusters from two stages are the most similar to each other); dashed green-lines indicates clusters that are one-way matched automatically (one cluster is the most similar with the other but not the other way around). Circles with white '+' indicate PN types that have been sequenced and confirmed at that stage using additional GAL4 lines (see Figure 7—figure supplement 1).
Figure 7—figure supplement 1
Supporting evidence for matching projection neuron (PN) types across developmental stages.
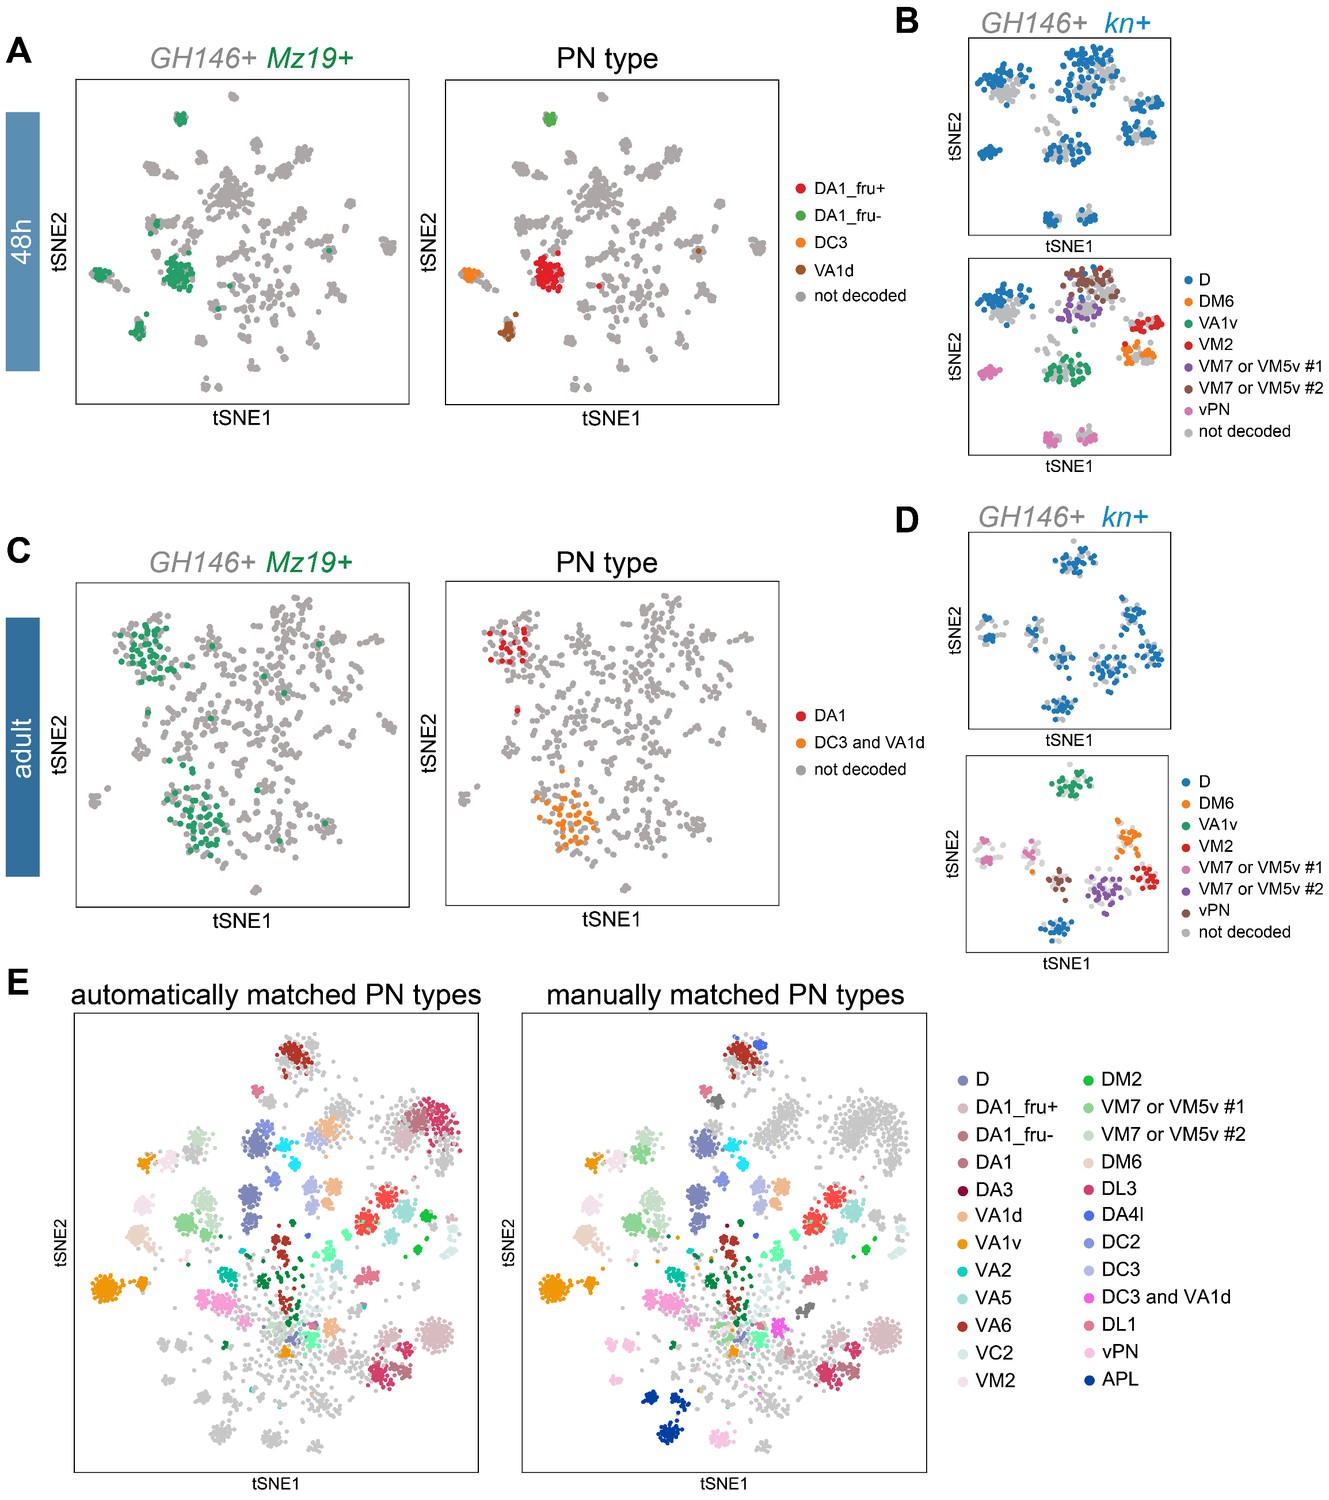
(A, C) Visualization of GH146+ PNs (gray) with Mz19+ PNs (green) at 48 hr APF (A) and at the adult stage (C). PN type of Mz19+ PNs shown on left were decoded previously (Li et al., 2017). (B, D) Visualization of kn+ PNs from cells sequenced using GH146-GAL4 (in gray) and cells sequenced using kn-GAL4 (in blue) at 48 hr APF (A) and at the adult stage (C). Annotation of kn-GAL4+ cells was done in Figure 6. (E) Visualization of the same types of PNs matched automatically (left) or manually (right) in tSNE space (same as Figure 7C). Transcriptomic clusters representing the same PN types of different developmental stages are labeled in the same color. Colors used to indicate PN types are identical to those in Figure 7B.
Figure 7—figure supplement 2
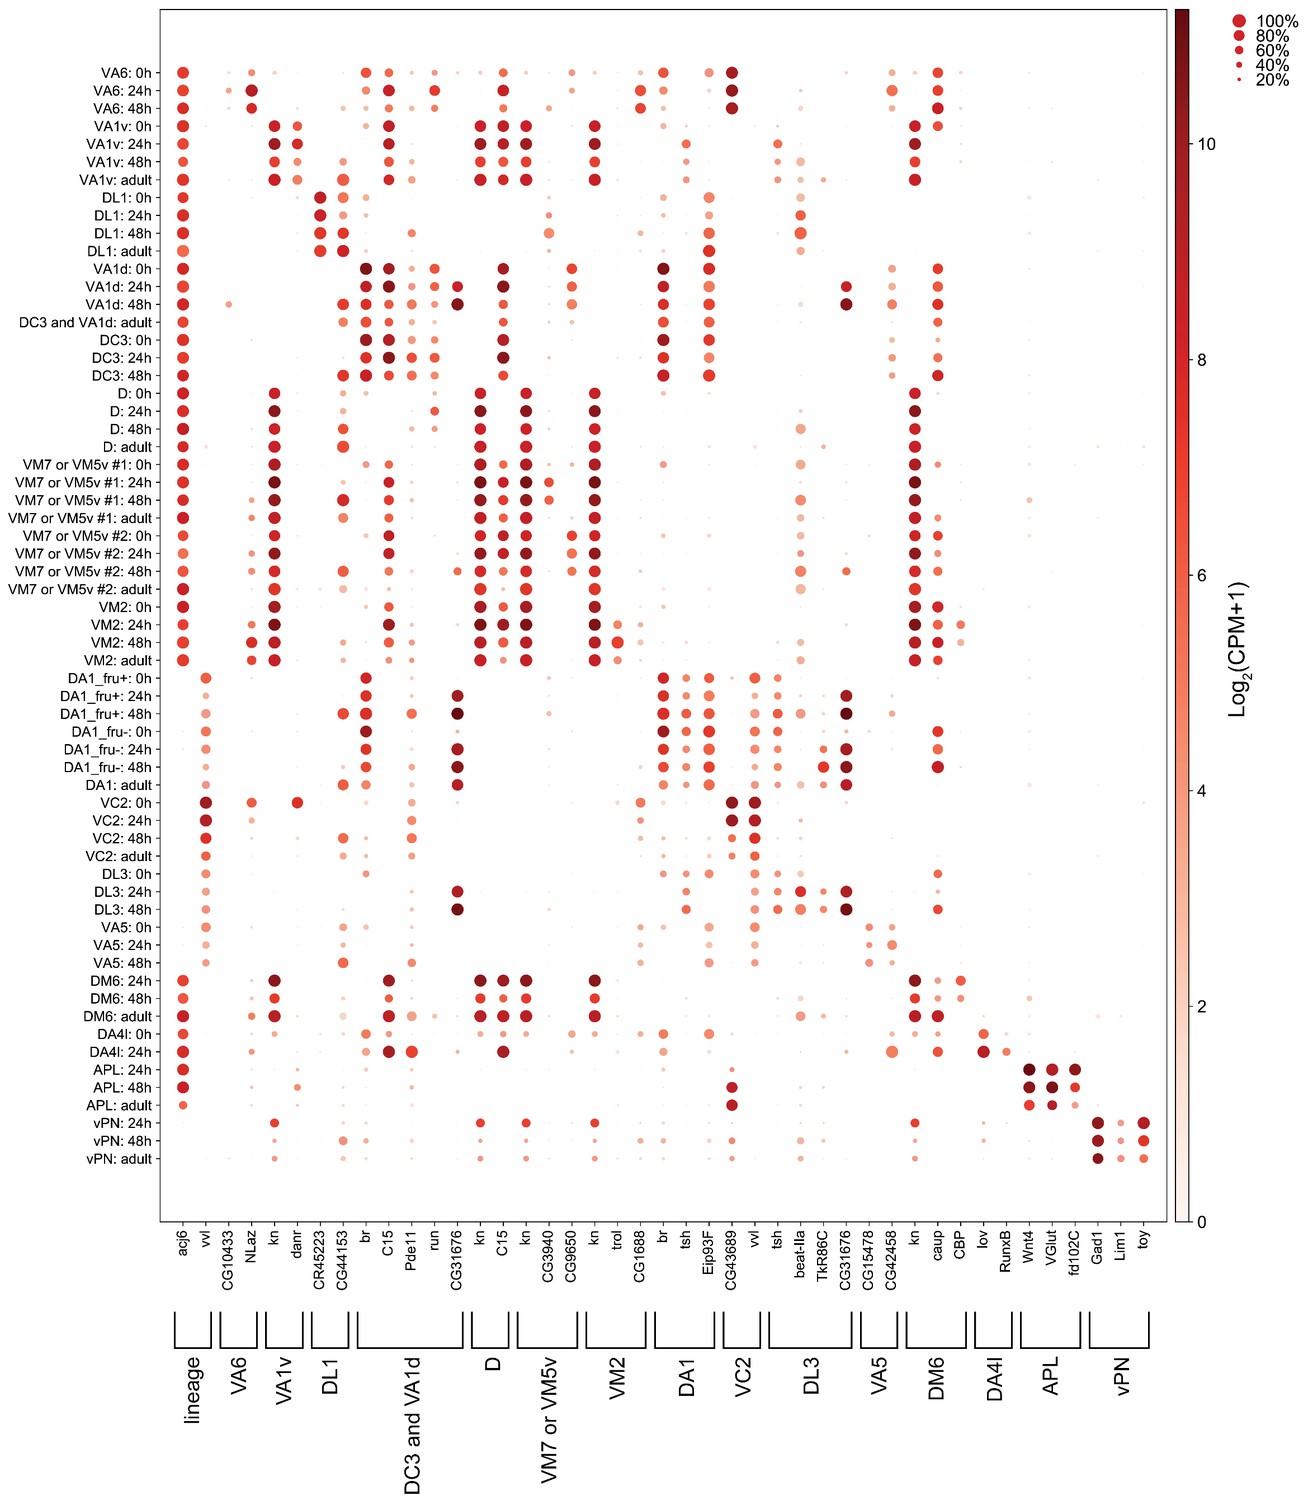
Markers used for manually matching projection neurons (PNs).
Dot plot of markers used to match the same types of PNs across different stages. Size of the dot represents percentage of cells expressing a given marker in a cluster at a given stage, and color of the dot represents expression level.
Figure 8 with 1 supplement
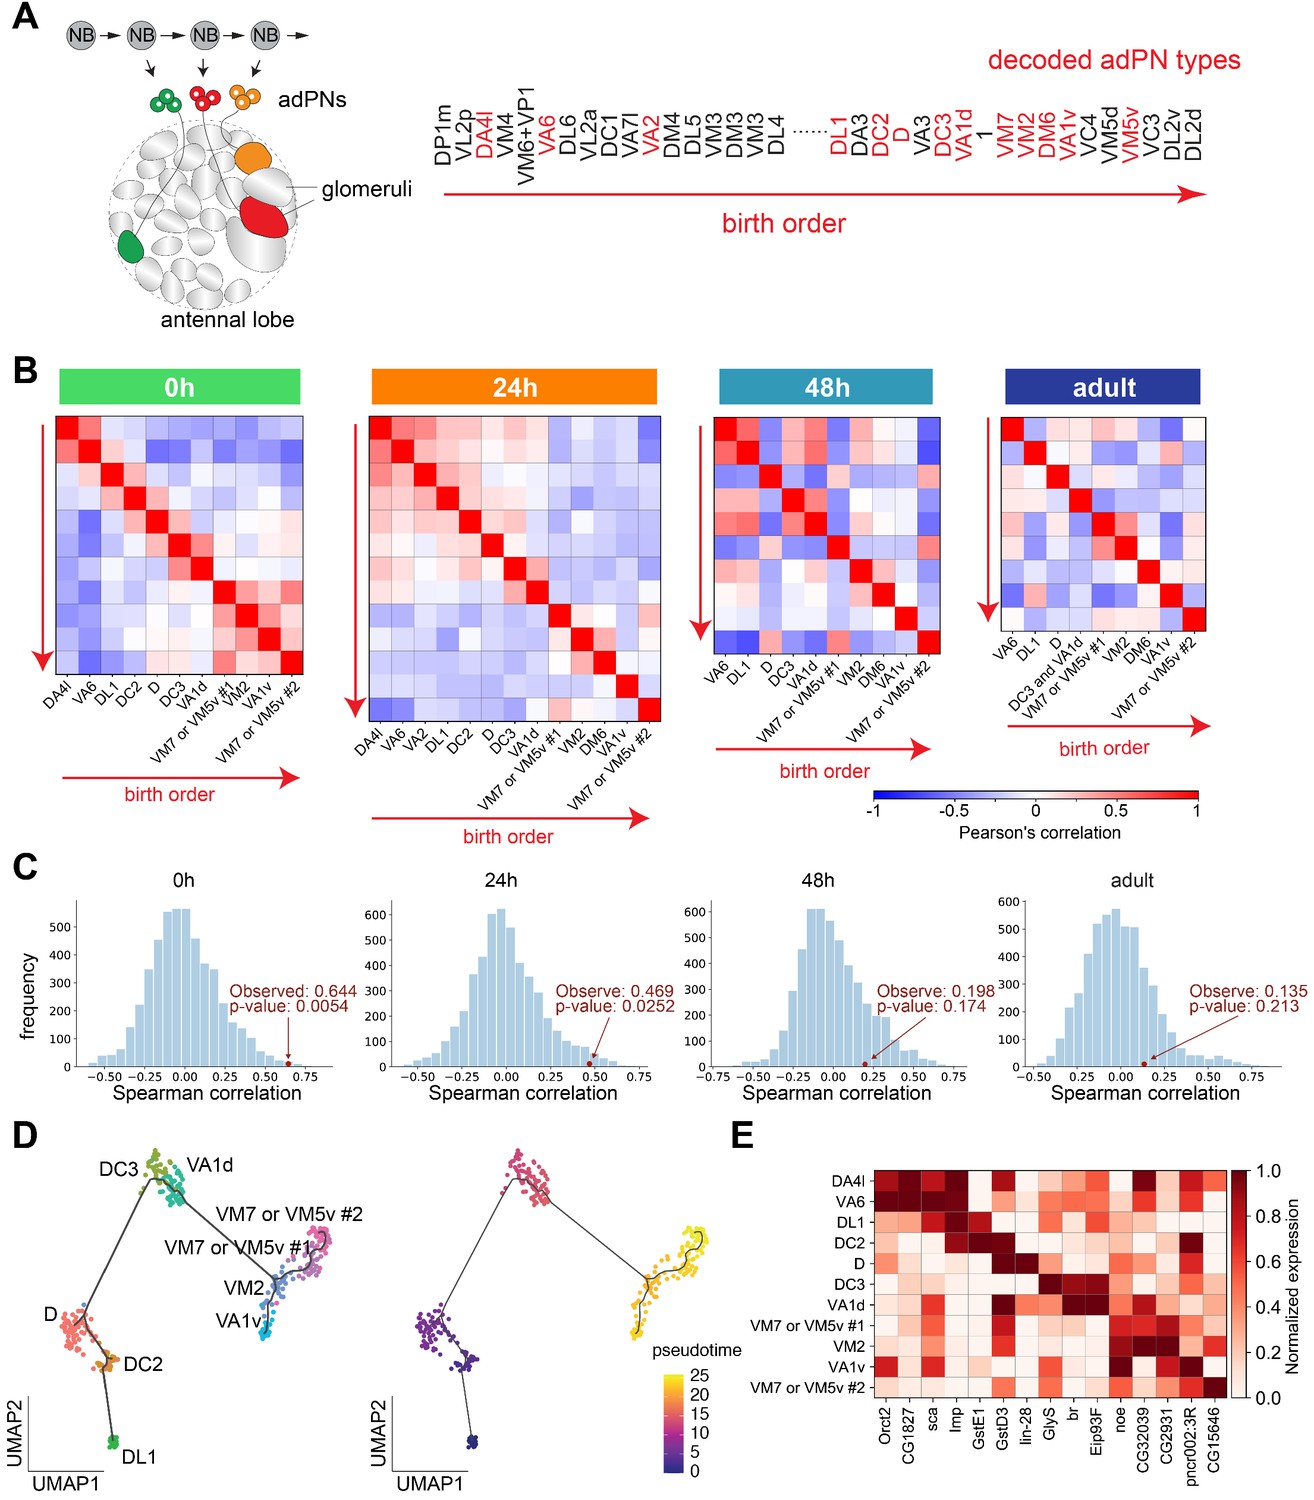
Projection neuron (PN) types with adjacent birth order share more similar transcriptomes at early pupal stages.
(A) Different PN types born from a common neuroblast follow a stereotyped sequence. The birth order of PNs determines to which glomerulus their dendrites target. The birth order of adPNs are shown on right. PN types with known transcriptomic identities at any of the four stages are highlighted in red. (B) Correlation matrix of the transcriptomes of adPNs with known identities (Pearson’s correlation). PN types are ordered according to their birth order. At 0 hr and 24 hr APF, PN types with birth orders adjacent to each other exhibit the highest correlations in their transcriptomes, as indicated by high correlations in boxes just off the diagonal line. (C) Results of permutation test under the null hypothesis that the ranks of adPN transcriptomic similarity do no covary with the ranks of birth order. Observed values is the average Spearman correlation of eight adPN types decoded in all four stages (red dot). The distribution is the average Spearman correlations obtained by randomly permutating the birth order for 5000 iterations (histogram). (D) Developmental trajectory analysis showing an unbiased pseudo time of 0 hr APF adPNs (embryonically born types excluded). The pseudo time roughly matches their birth order. (E) Expression levels of 15 genes in adPNs with known identity at 0 hr APF. These genes have been shown to exhibit temporal expression gradient in PN neuroblasts (Liu et al., 2015). The highest expression is normalized as one for all genes.
Figure 8—figure supplement 1
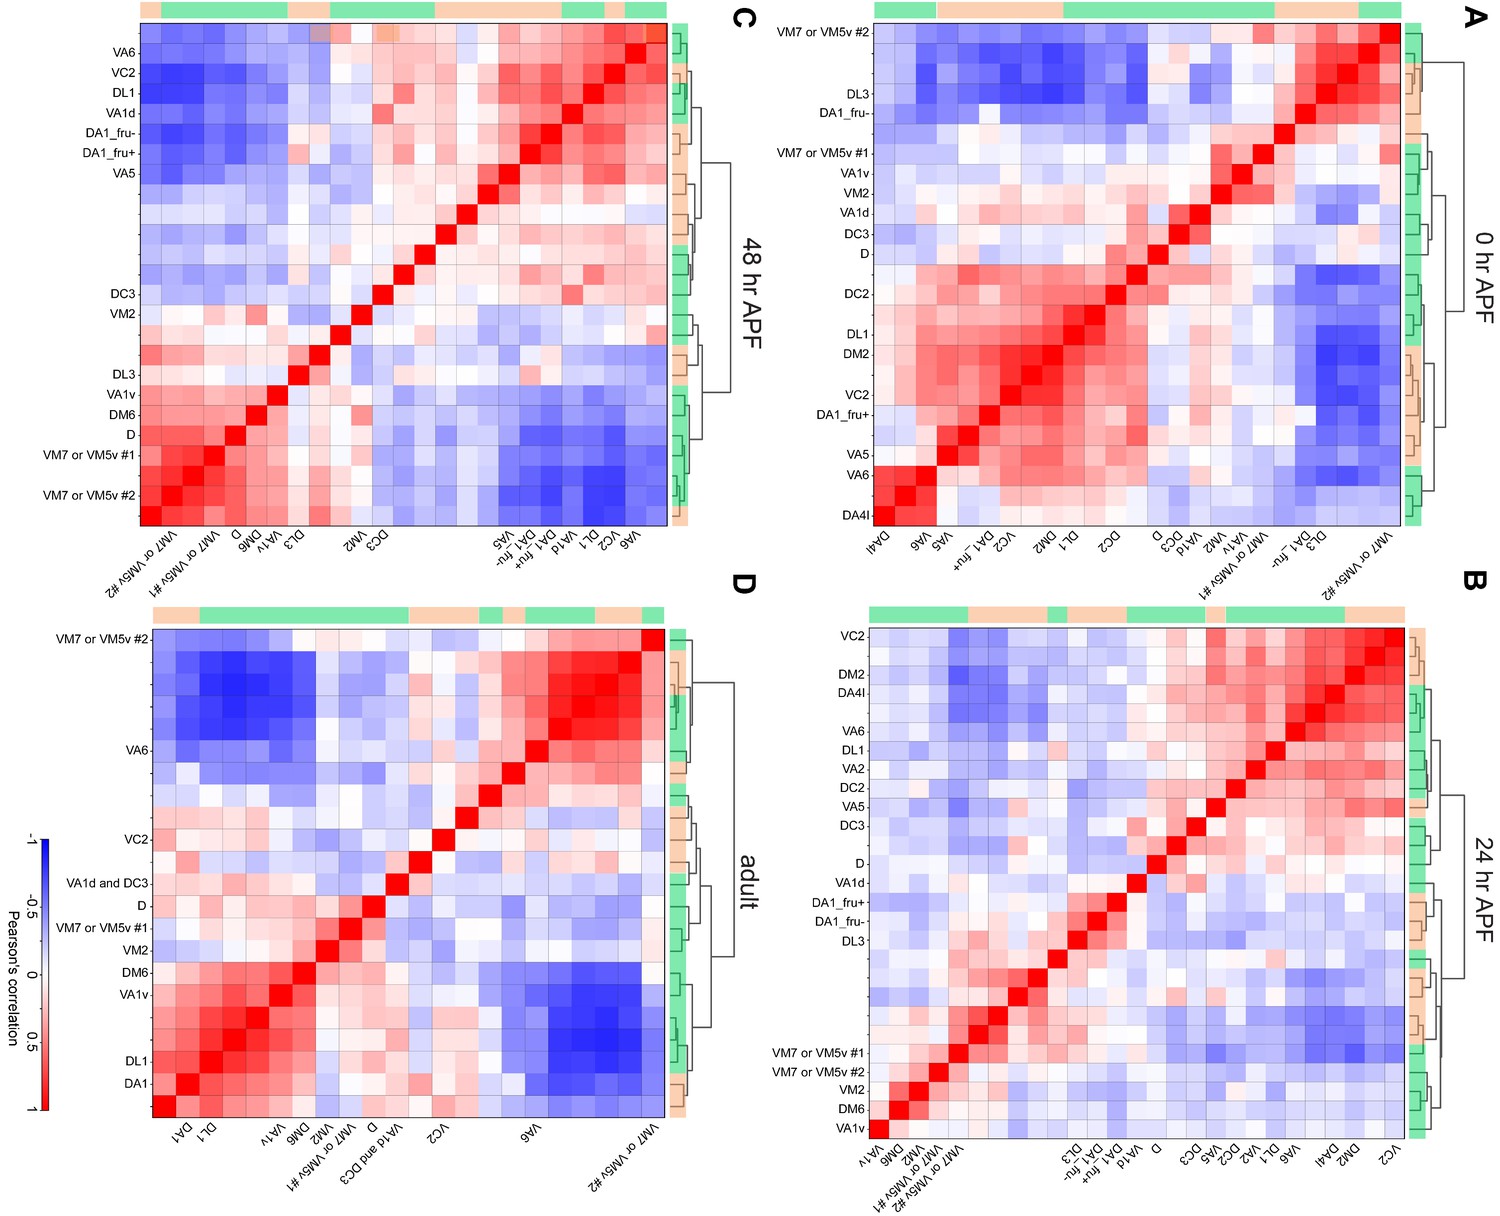
Hierarchical clustering of all excitatory projection neurons (PNs).
Hierarchical clustering of all excitatory PN clusters of 0 hr APF (A), 24 hr APF (B), 48 hr APF (C), and adult (D). Correlation calculation and hierarchical clustering were based on the principal components calculated using the entire gene matrix. adPNs are indicated by green bar and lPNs are indicated by orange bar on the top and left side of each plot. Clusters that have been matched to specific PN types are labeled.
Figure 9 with 2 supplements

Differentially expressed genes between different projection neuron (PN) types.
(A) Number of differentially expressed (DE) genes identified at each developmental stage among all excitatory PN clusters or among the 12 PN types that are matched in all four stages. A total of 103 and 52 genes are differentially expressed in all four stages among all excitatory PN types or among the 12 PN types, respectively. (B) Percentage of transcription factors (TFs) or cell-surface molecules (CSMs) from the list of genes that are differentially expressed among PNs in all four stages compared to the genome-wide percentage. (C, D) Dot plot of the 17 TFs (C) and 23 CSMs (D) that are differentially expressed in all four stages among the 12 PN types.
Figure 9—figure supplement 1
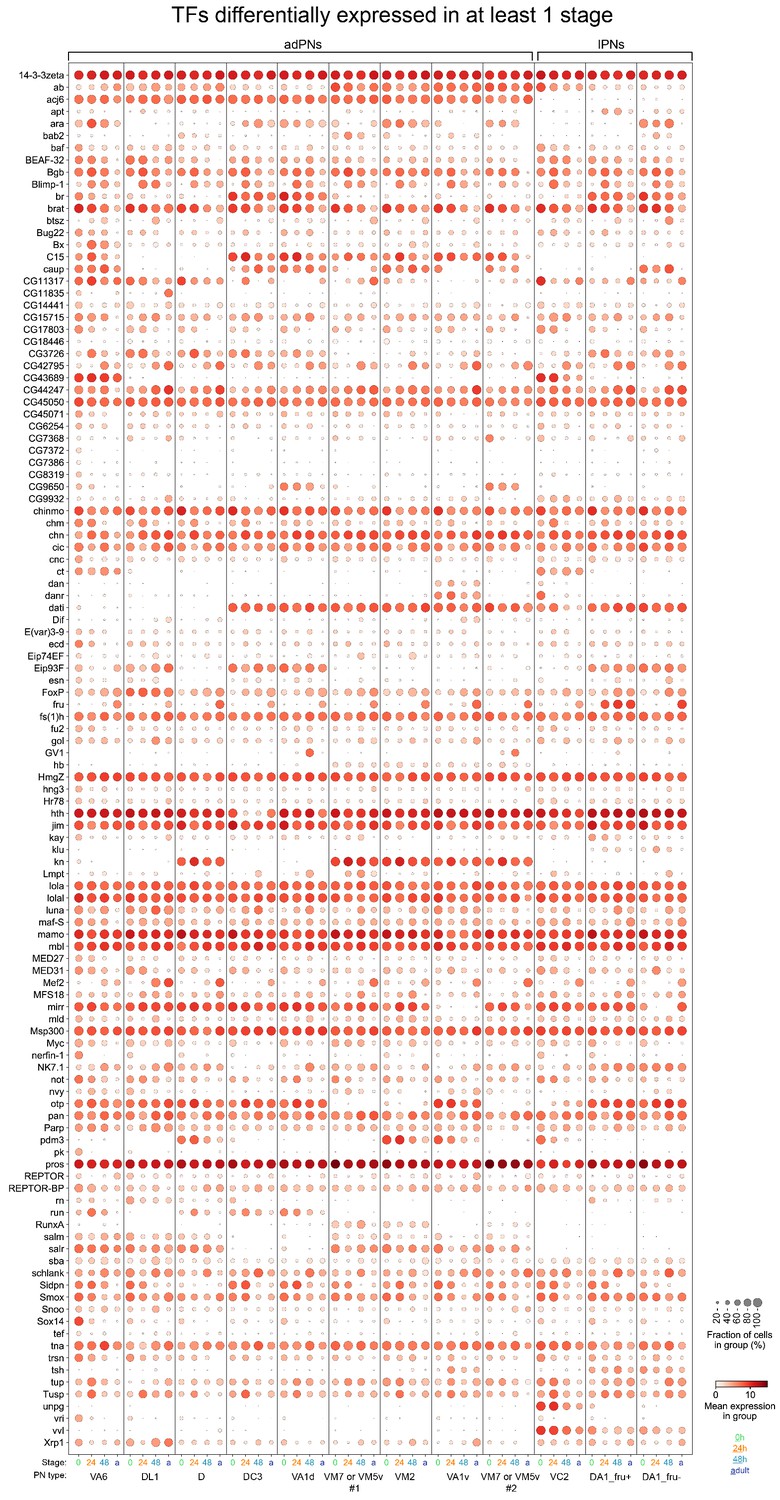
Dot plot of 114 TFs that are differentially expressed in any of the four stages among the 12 projection neuron (PN) type matched across all stages.
Figure 9—figure supplement 2

Dot plot of 228 CSMs that are differentially expressed in any of the four stages among the 12 projection neuron (PN) type matched across all stages.
Figure 10
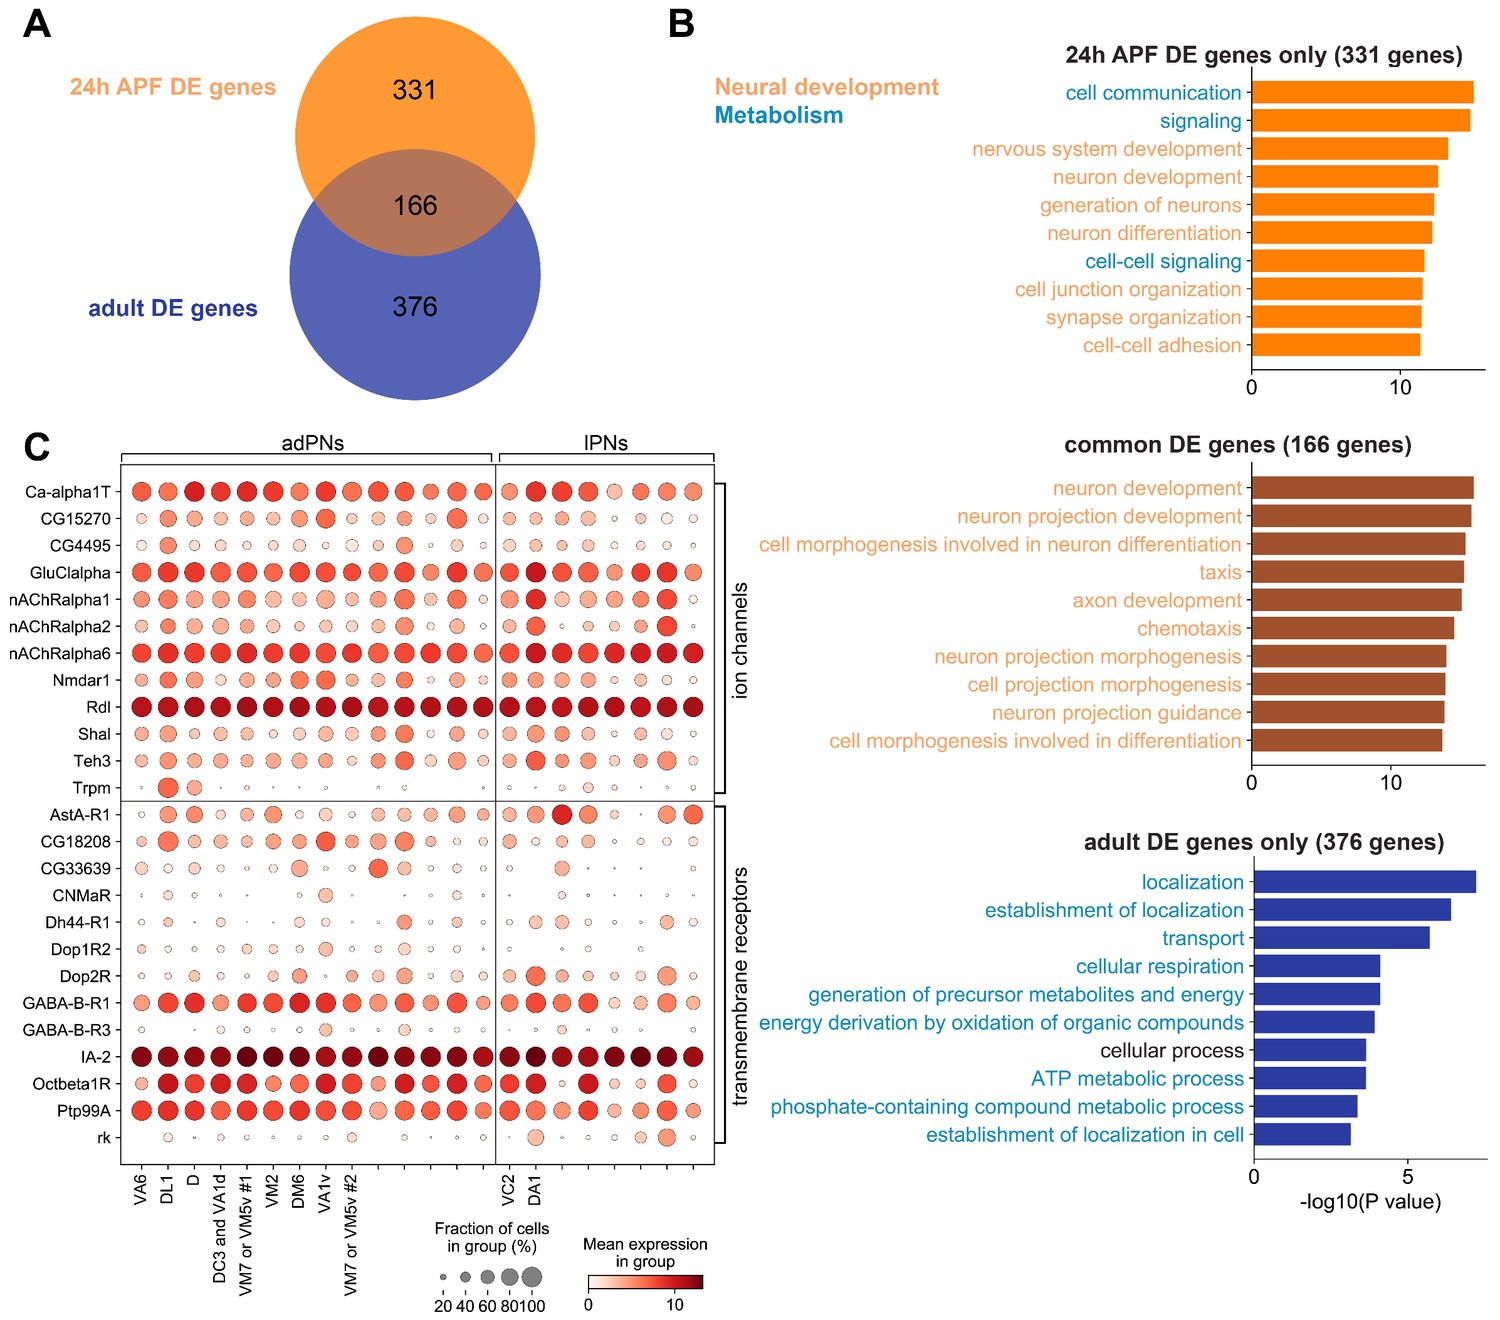
Differentially expressed genes among different projection neuron (PN) types in the adult stage.
(A) Venn diagram of differentially DE genes at 24 hr APF (497 genes) and in adults (542 genes). (B) Top 10 biological process terms of DE genes found in 24 hr APF PNs only (top), in both 24 hr APF and adults PNs (middle), and in adult PNs only (bottom). GO terms associated with neural development are colored in orange, and GO terms associated with metabolism are colored in blue. (C) Dot plot of adult DE genes that belong to the ‘ion channels’ (top) or ‘transmembrane receptors’ (bottom) gene group from FlyBase. PN types are separated by lineage and decoded PN types are labeled and ordered according to their birth order within each lineage.
Author response image 1
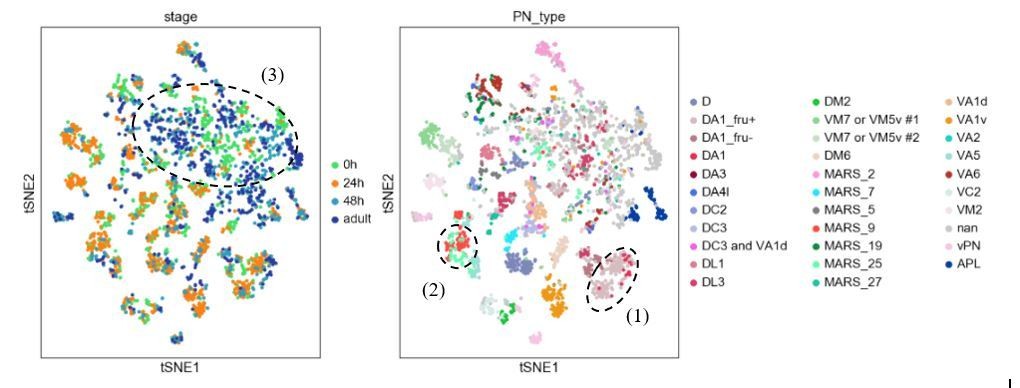
Visualization of most PNs in 4 different developmental stages after batch correction using harmony.
Cells are colored based on their developmental stage (left) and the final decoded PN types (right). Circled clusters highlight examples of the three types of issues we described.
Author response image 2

Expression levels of all 63 PN neuroblasts genes with temporal gradient in 0h APF PNs.
Expression levels of 63 genes in adPNs with known identity at 0h APF. These 63 genes are shown to have temporal expression gradient in PN neuroblasts (Liu et al., 2015). The highest expression is normalized as 1 for all genes.
Author response image 3
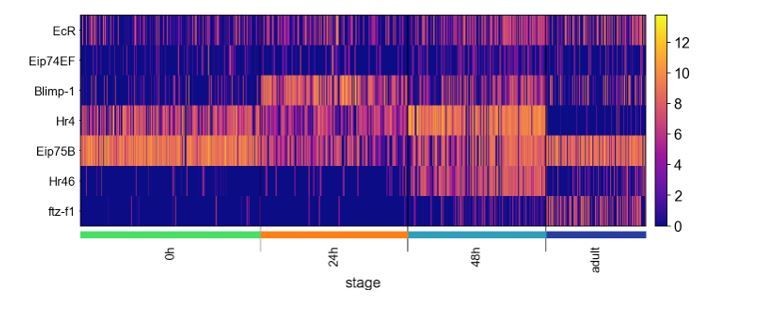
Expression of transcription factors of the Ecdysone-induced transcriptional cascade.
Heatmap showing the expression of TFs of the Ecdysone-induced transcriptional cascade examined in Jain et al. (note Hr46 is same gene as Hr3).
Tables
Key resources table
| Reagent type (species) or resource | Designation | Source or reference | Identifiers | Additional information |
|---|---|---|---|---|
| Genetic reagent (D. melanogaster) | GH146-GAL4 | Stocker et al., 1997 | RRID:BDSC_30026 | |
| Genetic reagent (D. melanogaster) | VT033006-GAL4 | Tirian and Dickson, 2017 | RRID:BDSC_73333 | |
| Genetic reagent (D. melanogaster) | Mz19-GAL4 | Jefferis et al., 2004 | RRID:BDSC_41573 | |
| Genetic reagent (D. melanogaster) | knot-GAL4 | Lee et al., 2018 | RRID:BDSC_67516 | |
| Genetic reagent (D. melanogaster) | split#28 GAL4 | Yoshi Aso (unpublished) | N/A | SS01265 |
| Genetic reagent (D. melanogaster) | split#7 GAL4 | Yoshi Aso (unpublished) | N/A | SS01867 |
| Genetic reagent (D. melanogaster) | split#15 GAL4 | Yoshi Aso (unpublished) | N/A | SS01165 |
| Genetic reagent (D. melanogaster) | GH146-Flp | Hong et al., 2009 | N/A | |
| Genetic reagent (D. melanogaster) | UAS-FRT-STOP-FRT-mCD8GFP | Hong et al., 2009 | RRID:BDSC_30125 | |
| Genetic reagent (D. melanogaster) | zfh2-GAL4 | Lee et al., 2018 | RRID:BDSC_86479 | |
| Genetic reagent (D. melanogaster) | Act-FRT-STOP-FRT-GAL4 | Pignoni and Zipursky, 1997 | N/A | |
| Genetic reagent (D. melanogaster) | UAS-Flp | Duffy et al., 1998 | N/A | |
| Genetic reagent (D. melanogaster) | C15-p65AD | Xie et al., 2019 | N/A | |
| Genetic reagent (D. melanogaster) | C15-GAL4DBD | This study | N/A | |
| Genetic reagent (D. melanogaster) | danr-P65AD | This study | N/A | |
| Genetic reagent (D. melanogaster) | VT033006-GAL4DBD | Yoshi Aso (unpublished) | N/A | |
| Genetic reagent (D. melanogaster) | DIP-zeta-GAL4 | Cosmanescu et al., 2018 | RRID:BDSC_90317 | |
| Genetic reagent (D. melanogaster) | DIP-eta-GAL4 | Cosmanescu et al., 2018 | RRID:BDSC_90318 | |
| Genetic reagent (D. melanogaster) | AstA-GAL4 | Deng et al., 2019 | RRID:BDSC_84593 | |
| Genetic reagent (D. melanogaster) | DIP-beta-GAL4 | Carrillo et al., 2015 | RRID:BDSC_90316 | |
| Genetic reagent (D. melanogaster) | kn-GAL4DBD | This study | N/A | |
| Genetic reagent (D. melanogaster) | elav-GAL4DBD | Luan et al., 2006 | N/A | |
| Antibody | Rat monoclonal anti-Ncad | Developmental Studies Hybridoma Bank | RRID:AB_528121 | (1:40 in 5% normal goat serum) |
| Antibody | Chicken polyclonal anti-GFP | Aves Labs | RRID:AB_10000240 | (1:1000 in 5% normal goat serum) |
| Software, algorithm | ZEN | Carl Zeiss | RRID:SCR_013672 | |
| Software, algorithm | ImageJ | National Institutes of Health | RRID:SCR_003070 | |
| Software, algorithm | Illustrator | Adobe | RRID:SCR_010279 | |
| Software, algorithm | STAR 2.5.4 | Dobin et al., 2013 | RRID:SCR_015899 | https://github.com/alexdobin/STAR |
| Software, algorithm | HTseq 0.11.2 | Anders et al., 2015 | RRID:SCR_005514 | https://github.com/htseq/htseq |
| Software, algorithm | Scanpy | Wolf et al., 2018 | RRID:SCR_018139 | https://scanpy.readthedocs.io/en/stable/ |
| Software, algorithm | Iterative Clustering for Identifying Markers (ICIM) | Li et al., 2017 | N/A | https://github.com/felixhorns/FlyPN |
| Recombinant DNA reagent | pT-GEM(0) (plasmid) | Diao et al., 2015 | RRID:Addgene_62891 | |
| Recombinant DNA reagent | pBS-KS-attB2-SA(2)-T2A-Gal4DBD-Hsp70 (plasmid) | Diao et al., 2015 | RRID:Addgene_62904 | |
| Recombinant DNA reagent | pU6-BbsI-chiRNA (plasmid) | Gratz et al., 2013 | RRID:Addgene_45946 |
Additional files
Download links
A two-part list of links to download the article, or parts of the article, in various formats.
Downloads (link to download the article as PDF)
Open citations (links to open the citations from this article in various online reference manager services)
Cite this article (links to download the citations from this article in formats compatible with various reference manager tools)
Temporal evolution of single-cell transcriptomes of Drosophila olfactory projection neurons
eLife 10:e63450.
https://doi.org/10.7554/eLife.63450


