Dendritic osmosensors modulate activity-induced calcium influx in oxytocinergic magnocellular neurons of the mouse PVN
- Department of Pharmacodynamics, College of Pharmacy, University of Florida, United States
- Department of Anesthesiology, School of Medicine, Stanford University, United States
- Center for Integrative Cardiovascular and Metabolic Diseases, University of Florida, United States
- Evelyn F. and William L. McKnight Brain Institute, University of Florida, United States
Figures
Figure 1 with 1 supplement
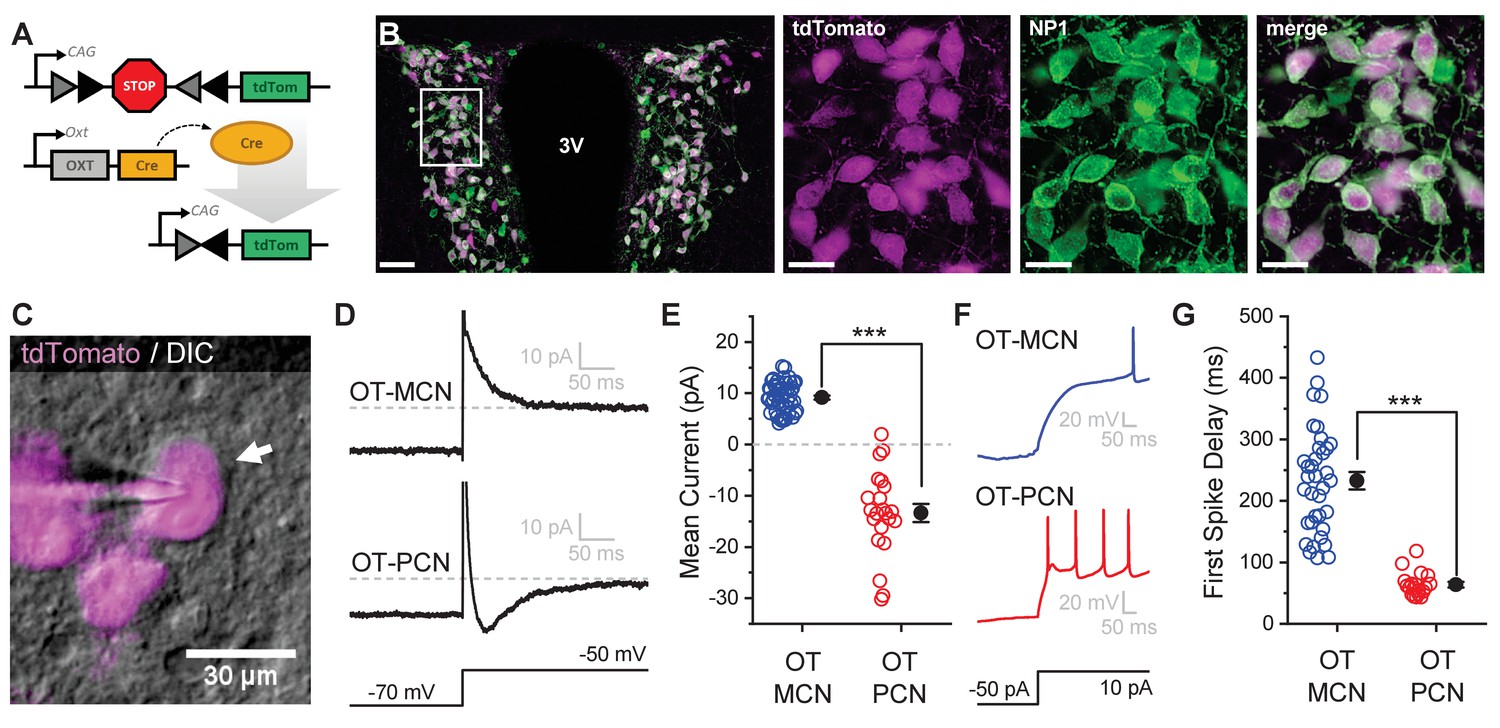
An oxytocin (OT) reporter mouse line facilitates selective targeting of OT neurons for in vitro experiments.
(A) Fluorophore (tdTomato) is selectively expressed in OT neurons of OT-Cre mice using a stop-floxed tdTomato construct. (B) Immunohistochemistry demonstrates colocalization of tdTomato and NP1 in PVN neurons. See Results for additional details. (C) Endogenous tdTomato facilitates selective targeting of OT neurons in acute brain slices for whole-cell patch clamp recording. (D) Magnocellular neurons (OT-MCNs, top panel) can be distinguished from parvocellular neurons (OT-PCNs, bottom panel) by the presence of a transient outward current (IA current) following a voltage-clamp step from −70 mV to −50 mV. Outward current in OT-MCNs is quantified over the first 100 msec after the step to −50 mV, relative to the steady state current at that voltage which is indicated by the dashed line. By contrast, OT-PCNs often reveal a transient inward current in response to the same stimulus (quantified with the same strategy, bottom panel). (E) Mean current response to the voltage step as presented in panel D segregates MCNs (demonstrating a transient outward current, IA) from PCNs (with no or inward transient current, n=51, 22, t = 12.46, p<0.001, unpaired two-sample t-test). (F) The IA current in MCNs produces a delay to first spike which can be readily observed in response to a suprathreshold depolarizing step in current clamp (top panel). (G) Time to first spike, as observed in response to a 40 pA current injection that immediately followed a hyperpolarizing prepulse, is significantly longer in OT-MCNs vs. OT-PCNs (n=36, 19, t = 11.41, p<0.001, unpaired two-sample t-test). Scale bars: B left panel 100 µm, B right panels 20 µm, C 30 µm. Error bars represent mean ± SEM.
-
Figure 1—source data 1
Excel file containing data for panels E and G.
- https://cdn.elifesciences.org/articles/63486/elife-63486-fig1-data1-v2.xlsx
Figure 1—figure supplement 1
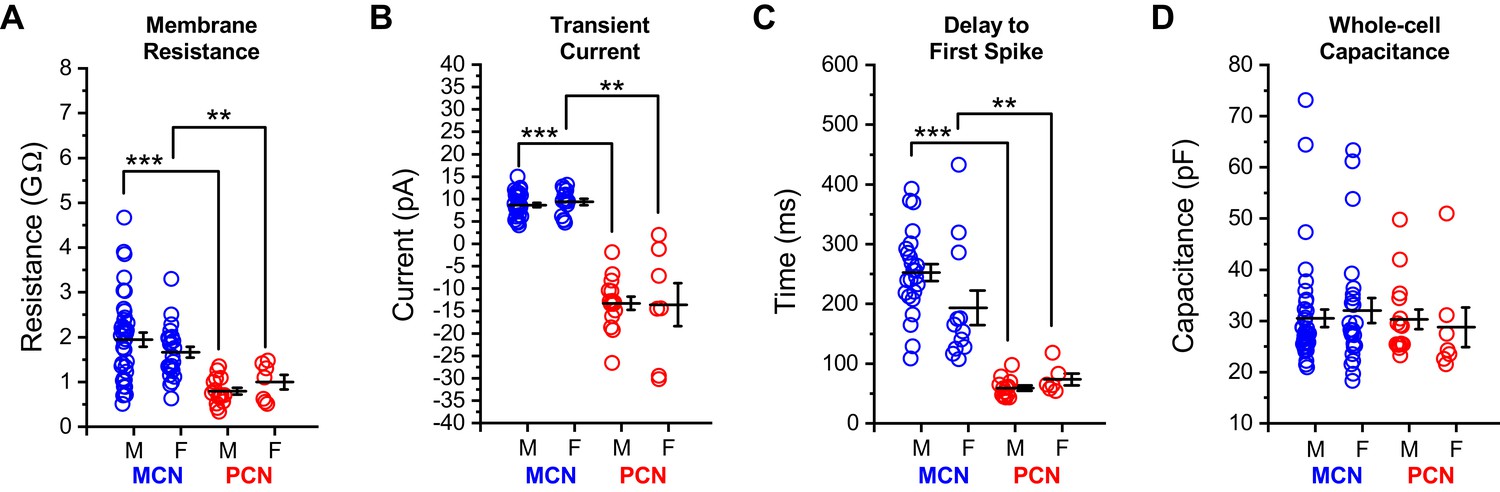
Intrinsic properties of OT PVN neurons do not differ by sex.
Core intrinsic properties of OT-MCNs (blue) and OT-PCNs (red) are separated by both sex and cell type and illustrated in panels A-D. A two-way ANOVA was run on data in each panel with sex and cell type as factors. (A–C) In these panels, illustrating membrane resistance, transient current amplitude, and delay to first spike, respectively, a two-way ANOVA revealed that there was no significant effect of sex (Rm: F1,83 = 0.04, p = 0.84, transient current: F1,66 = 0.02, p = 0.89, delay to first spike: F1,54 = 0.05, p = 0.83), there was a main effect of cell type (Rm: F1,83 = 21.2, p = 1.54 x 10⁻⁵, transient current: F1,66 = 230.3, p = 1 x 10⁻²², delay to first spike: F1,54 = 33.95, p = 3.83 x 10⁻⁷), and there was no significant interaction between sex and cell type (Rm: F1,83 = 1.496, p = 0.225, transient current: F1,66 = 0.12, p = 0.73, delay to first spike: F1,54 = 1.22, p = 0.274). Based on these results, we performed an unpaired two-sample t-test on selected data in these panels using data within each sex, separated by cell type. The results of these analyses, highlighted with brackets in panels A-C, indicate that in OT-MCNs vs. OT-PCNs, both sexes had significantly larger input resistance, displayed an outward rather than an inward transient current in voltage clamp, and had a longer delay to first spike in current clamp (* = p < 0.05, ** = p< 0.01, and *** = p < 0.001). (D) In contrast, a two-way ANOVA run on measurements of whole-cell capacitance, with both sex and cell type as factors, revealed no significant effect of either sex or cell type (sex: F1,83 = 5.7 x 10⁻⁵, p = 0.99, cell type: F1,83 = 0.392, p = 0.53). Overall, based on results presented in panels A-D, data were combined across sex and separated by cell type for analyses presented in Figure 1, and in related sections of the results. N values for cells and animals represented in all panels above are as follows: Panels A and D: OT-MCN male: 38, 15, OT-MCN female: 24, 12, OT-PCN male: 15, 3, OT-PCN female: 7, 6, Panel B: OT-MCN male: 30, 11, OT-MCN female: 15, 7, OT-PCN male: 15, 3, OT-PCN female: 7, 6, and Panel C: OT-MCN male: 24, 9, OT-MCN female: 12, 6, OT-PCN male: 13, 3, OT-PCN female: 6, 5.
-
Figure 1—figure supplement 1—source data 1
Excel file containing data for panels A-D.
- https://cdn.elifesciences.org/articles/63486/elife-63486-fig1-figsupp1-data1-v2.xlsx
Figure 2
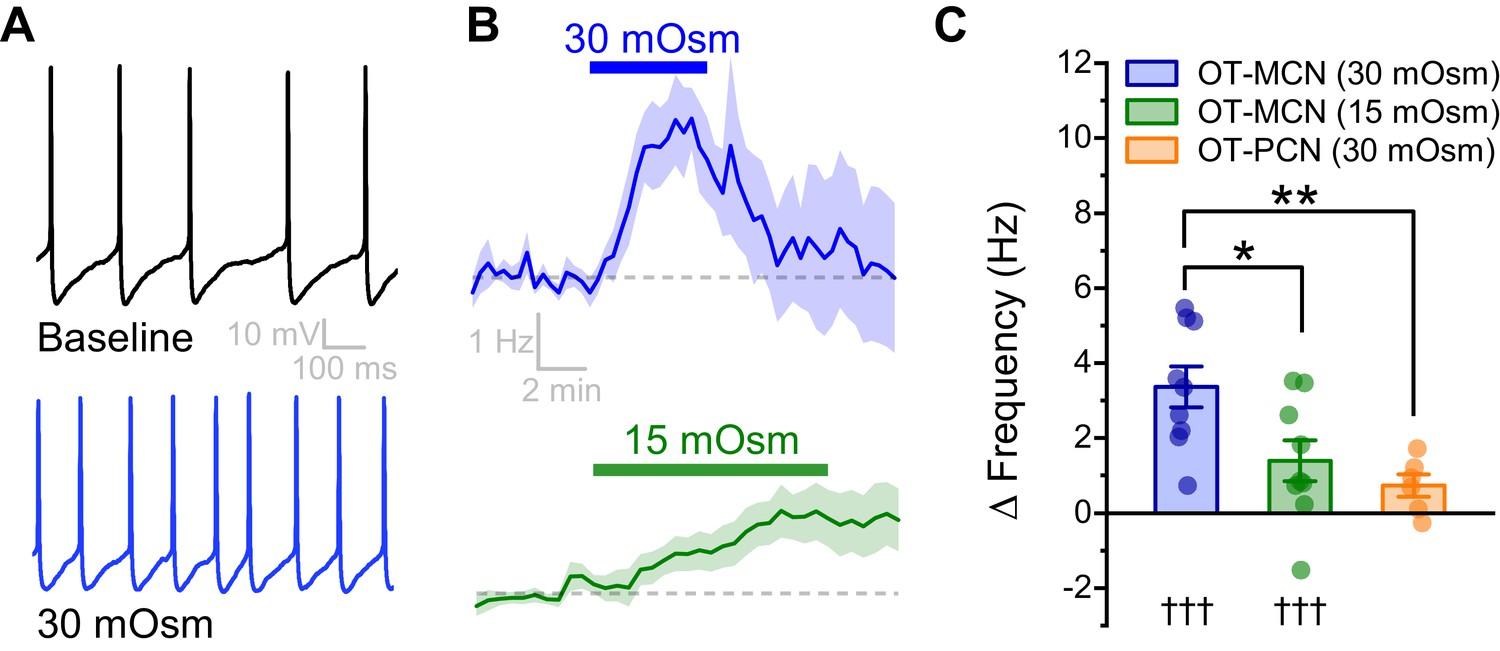
An acute hyperosmotic stimulus increases OT-MCN activity.
(A) Spontaneous firing in a representative OT-MCN before (top) and after (bottom) exposure to MT (30 mOsm). (B) Change in spontaneous action potential frequency over time in response to +30 mOsm (n=9, top) and +15 mOsm (n=9, bottom). (C) Both 15 and 30 mOsm stimuli caused a significant increase in action potential frequency in OT-MCNs (denoted by †††, p<0.001, one-sample t-tests), but response to 30 mOsm stimulus was significantly larger (denoted by * p< 0.01, unpaired two-sample t-test, blue vs. green bar). By contrast, the same 30 mOsm stimulus did not produce a significant increase in firing rate in OT-PCNs (orange bar, p = 0.06, one-sample t-test), and these results were significantly different that those observed in OT-MCNs (** denotes p = 0.003, unpaired two-sample t-test).
-
Figure 2—source data 1
Excel file containing data for panel C.
- https://cdn.elifesciences.org/articles/63486/elife-63486-fig2-data1-v2.xlsx
Figure 3 with 1 supplement
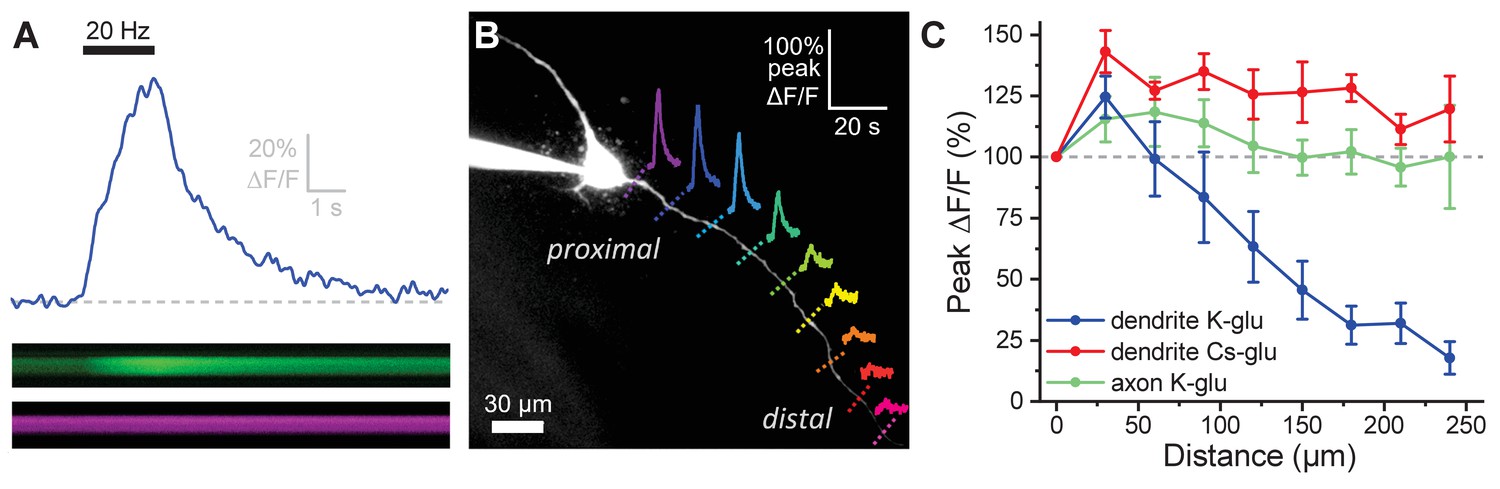
Activity-induced dendritic calcium influx decreases with distance from the soma in OT-MCNs.
(A) Blue trace illustrates calcium response observed in an OT-MCN dendrite as produced by a 2 s train of action potential-like voltage steps delivered to the soma at 20 Hz (black bar). The calcium signal was calculated using emissions from a calcium sensitive and calcium insensitive indicator (Fluo-5F and Alexa Fluor 594, respectively) obtained by performing a two-photon line scan across the dendrite during somatic stimulation. The bottom panels illustrate line scan data (top: Fluo-5F, bottom: Alexa Flour 594), with time on the horizontal axis and space across the dendrite on the vertical axis. See Materials and methods for details. (B) Two-photon Z-series projection of a representative OT-MCN. Colored dashed lines indicate position of line scans performed in this cell during somatic stimulation as in panel A. Solid lines illustrate calcium response, calculated as in panel A, observed at each location. Scale bar in the top right applies to all traces. (C) Illustrates the peak of the calcium response as a percentage of baseline (most proximal response) plotted against distance from the soma. Data were obtained from OT-MCN dendrites using either a K-gluconate or Cs-gluconate-based internal solution (blue vs. green traces, respectively), and from the axon of OT-MCNs (red trace). Overall, these data reveal significant distance-dependent loss of activity-induced calcium influx only in OT-MCN dendrites, and only in cells that were not filled with a Cs-gluconate-based internal solution.
-
Figure 3—source data 1
Excel file containing data for panel C.
- https://cdn.elifesciences.org/articles/63486/elife-63486-fig3-data1-v2.xlsx
Figure 3—figure supplement 1

Activity-induced dendritic calcium influx in OT-MCN dendrites requires external calcium.
(A) Representative traces of activity-induced calcium influx measured at proximal and distal dendritic locations (blue traces, red traces, respectively) during baseline conditions, after 15 min of bath application of calcium-free ACSF, and after an additional 5 min recovery period. (B) Summary data indicates a significant reduction of activity-induced calcium influx in both proximal and distal dendrites, followed by a rapid recovery (see text of results for further details).
-
Figure 3—figure supplement 1—source data 1
Excel file containing data for panel B.
- https://cdn.elifesciences.org/articles/63486/elife-63486-fig3-figsupp1-data1-v2.xlsx
Figure 4 with 3 supplements
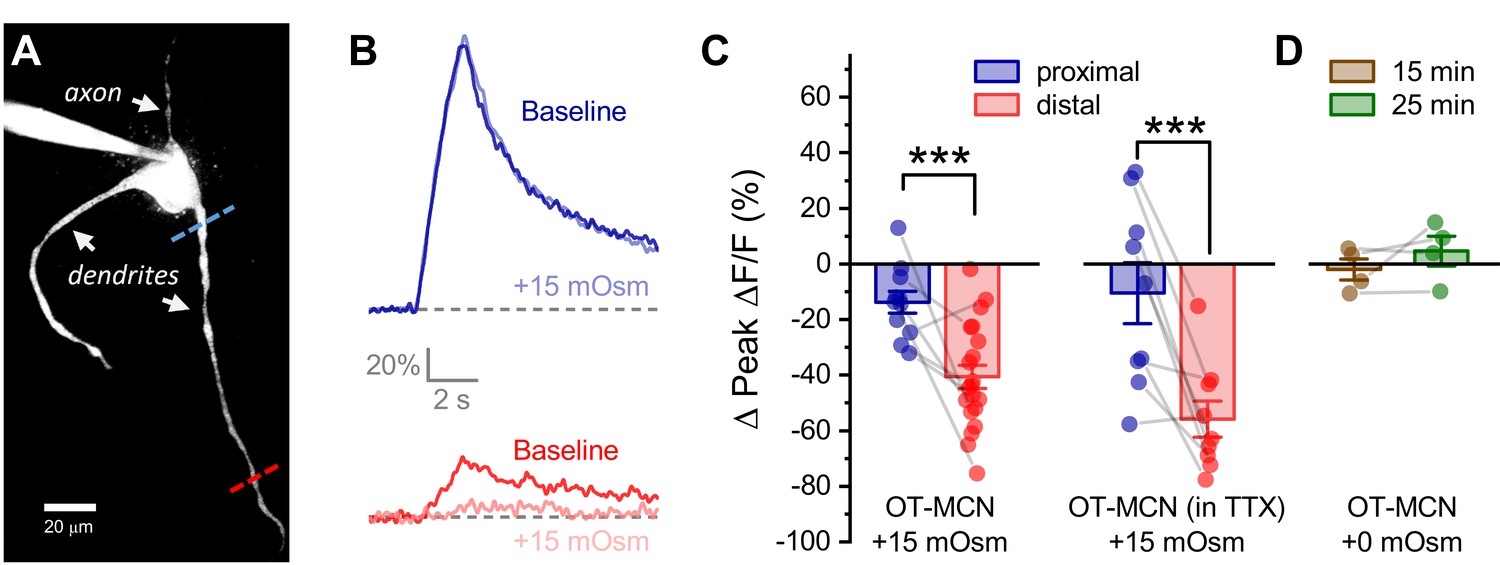
Acute hyperosmotic challenge produces a distance-dependent reduction in activity-induced calcium influx, as observed in OT-MCN dendrites.
(A) A two-photon Z-series projection image of a representative OT-MCN indicating proximal (blue) and distal (red) calcium imaging locations. (B) Activity-induced calcium response observed before and during exposure to a 15 mOsm stimulus at proximal and distal sites (top, bottom of panel respectively, with baseline responses color coded to match line scan positions indicated in panel A). (C) Left panel: Across multiple cells tested, the 15 mOsm stimulus produced a small inhibitory effect on activity-induced calcium influx as observed in the proximal dendrites (−14.3 ± 3.37%, n = 13, t = −4.2, p = 0.001, one-sample t-test), and a significantly larger inhibitory effect as observed in the distal dendrites (Left panel, *** p = 1.1 x 10⁻⁴, n=13, 20, for proximal and distal dendrites, respectively. See text of results for further details). Note an unpaired two-sample t-test was used for this analysis because some cells had data only from the proximal or the distal location. In cases were both proximal and distal data is available within a cell, corresponding points are connected by grey lines. If analysis is restricted to paired data only the difference between the effect observed in proximal and distal dendrites is still statistically significant (proximal: −15.27 ± 4.66%, distal: −45.67 ± 6.39%, n=9, t = 3.51, p = 0.008, paired two-sample t-test). Right panel: Although raw calcium influx was reduced in cells pretreated with 1 µM TTX, a 15 mOsm stimulus continued to preferentially inhibit activity-induced calcium influx as observed in the distal dendrites (right panel, *** p = 0.003, n=9,9 for distal and proximal dendrites, respectively, paired two-sample t-test). (D) Absent hyperosmotic stimulus, activity-induced calcium influx measured as in panels A-C is stable in distal dendrites over a 25-min recording period (sufficient time to change bath conditions in earlier experiments, n=four for distal dendrites, see text of results for further details).
-
Figure 4—source data 1
Excel file containing source data for panels C-D.
- https://cdn.elifesciences.org/articles/63486/elife-63486-fig4-data1-v2.xlsx
Figure 4—figure supplement 1
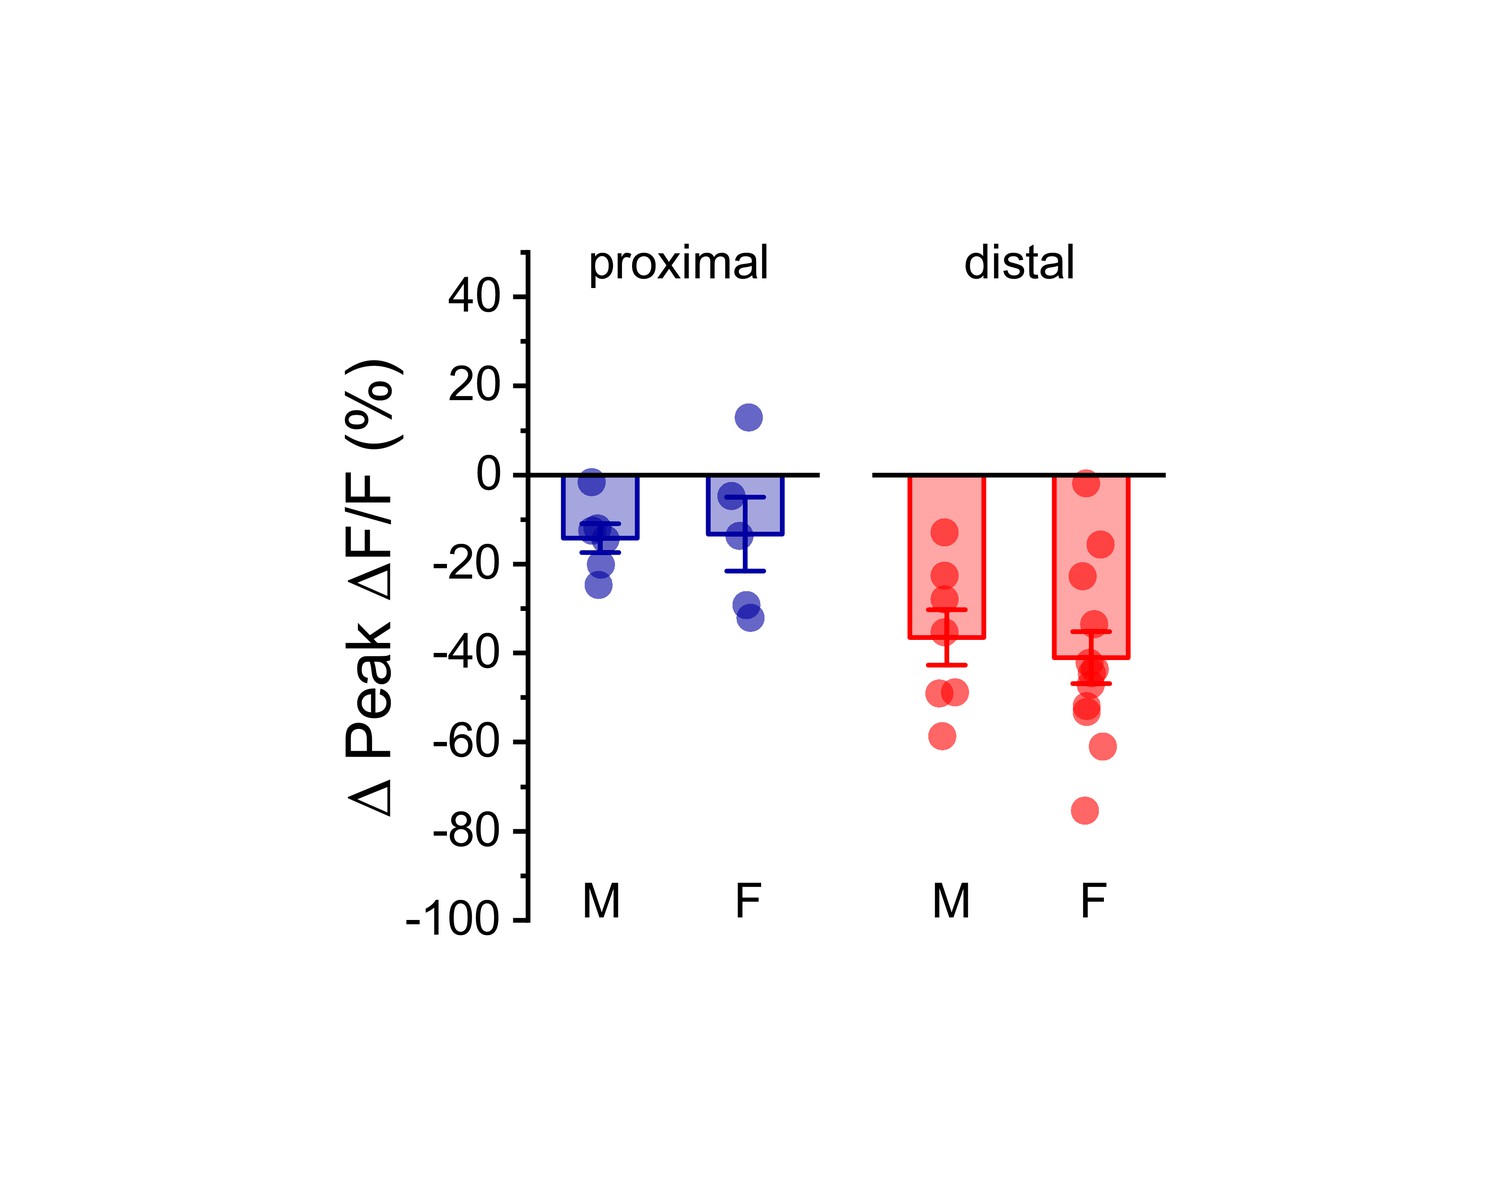
Effect of acute hyperosmotic challenge on activity-induced calcium influx is similar in males and females.
Summary data, separated by sex (M/F), illustrating the effect of acute hyperosmotic challenge on activity-induced calcium influx in both proximal (blue) and distal (red) dendrites of OT-MCNs. A two-way ANOVA run on these data, with sex and dendritic location as factors, revealed no main effect of sex (F1,29 = 0.08, p = 0.78), a significant effect of dendritic location (F1,29=14.1, p = 8.8 x 10⁻⁴), and no significant interaction between sex and location (F1,29 = 0.17, p = 0.68). As such, these data were combined across sex, separated by location, and presented in Figure 4C, left panel. For proximal data, n = 6 cells, 3 animals, and 5 cells, 5 animals for males and females, respectively. For distal data, n = 7 cells, 6 animals, and 12 cells, 7 animals for males and females, respectively.
-
Figure 4—figure supplement 1—source data 1
Excel file containing source data.
- https://cdn.elifesciences.org/articles/63486/elife-63486-fig4-figsupp1-data1-v2.xlsx
Figure 4—figure supplement 2
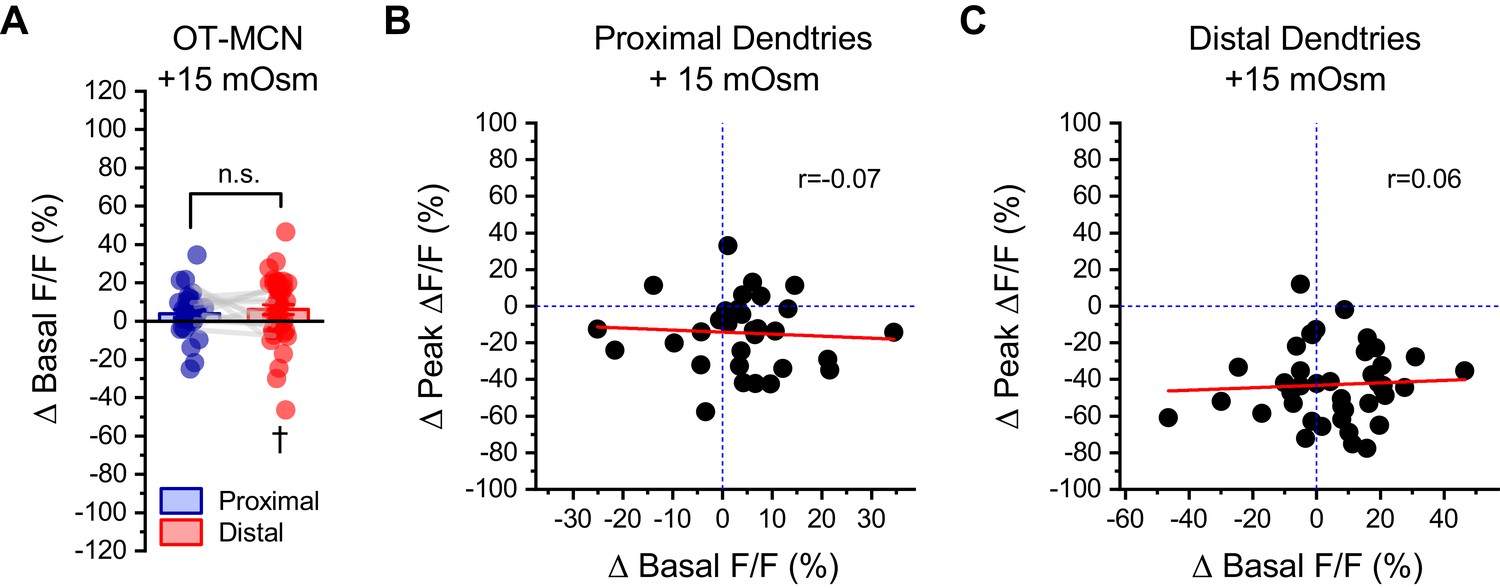
Changes in basal calcium observed during acute hyperosmotic challenge are not predictive of changes in activity-induced calcium influx, as observed in either proximal or distal dendrites of OT-MCNs.
(A) Across multiple experiments that involved acute hyperosmotic challenge with +15 mOsm MT, basal calcium (as indicated by resting F/F) increased by 4.0 ± 2.1% in the proximal dendrites of OT-MCNs (n=32, t = 1.8, p = 0.07, one-sample t-test), and by 6.1 ± 2.6% in the distal dendrites (n=43, t = 2.3, p = 0.02 †, one-sample t-test against null hypothesis that mean = 0). An unpaired two-sample t-test indicates that these changes were not significantly different from one another (t = −0.69, p = 0.49). (B–C) Further analysis with simple linear regression indicated that there was no correlation between changes in basal calcium levels and changes in activity-induced calcium influx observed in response to acute hyperosmotic challenge, in either the proximal or distal dendrites of OT-MCNs (Pearsons’s r=-0.07, 0.06, p = 0.72, 0.72, respectively, regression lines in red). Similarly, the coefficient of determination (r2) indicated that changes in basal calcium was not predictive of changes in activity-induced calcium influx in either proximal or distal dendrites of OT-MCNs (r2=0.004, 0.003, respectively).
-
Figure 4—figure supplement 2—source data 1
Excel file containing source data for panels A-C.
- https://cdn.elifesciences.org/articles/63486/elife-63486-fig4-figsupp2-data1-v2.xlsx
Figure 4—figure supplement 3
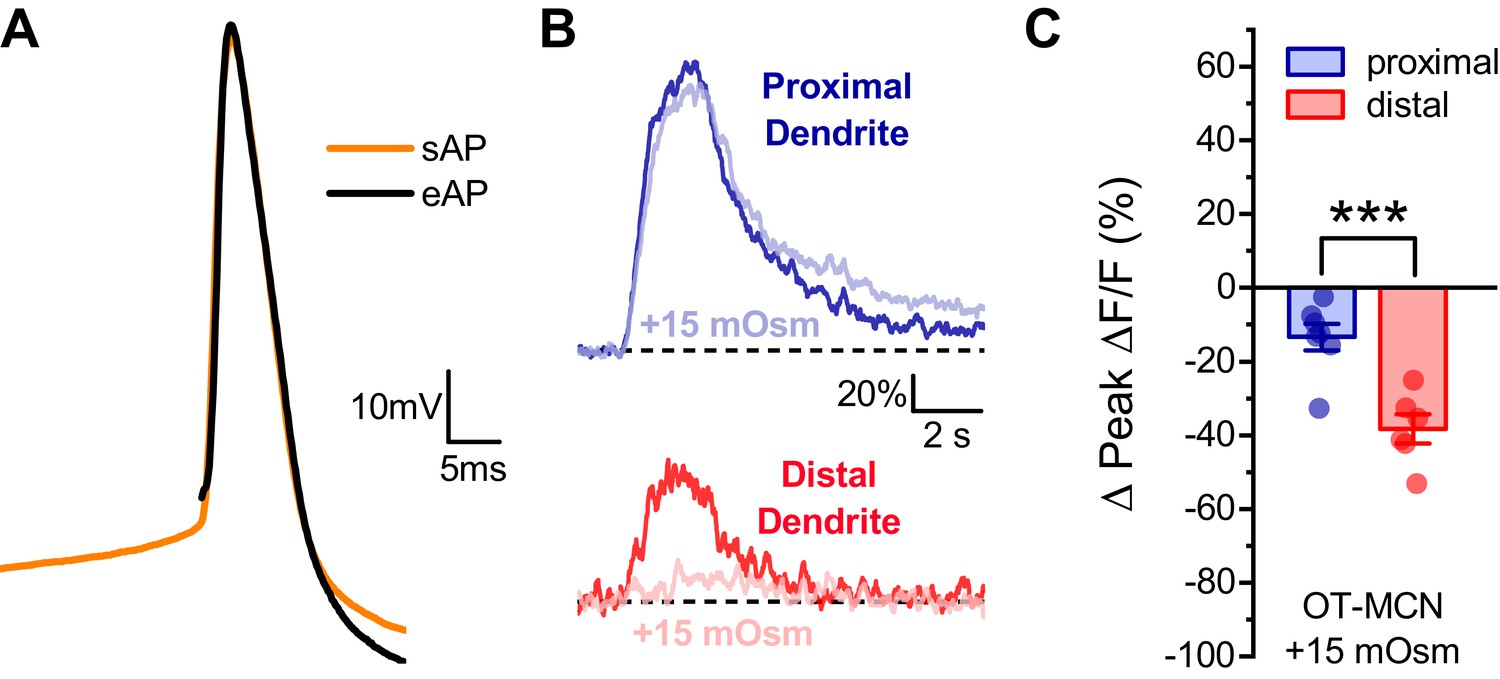
Effect of acute hyperosmotic challenge on activity-induced calcium influx in proximal vs. distal OT-MCN dendrites is preserved in neurons recorded in current clamp.
(A) Raw voltage traces from a representative individual OT-MCN illustrating the similarity between a spontaneous action potential (sAP, orange trace) and an action potential evoked by a 250 μs suprathreshold current pulse (eAP, black trace). The current pulse used to evoke the eAP occurred immediately before the start of the illustrated trace, and was part of a train of identical pulses (delivered for 2 s at 20 Hz). Across all cells tested paired two-sample t-tests revealed no significant difference between spontaneous and evoked action potentials, respectively, in terms of peak voltage (38.0 ± 2.77 mV vs. 36.3 ± 1.39 mV, n=13, t = 0.66, p = 0.52), maximum rate of depolarization (102.14 ± 4.36 mV/ms vs. 112.6 ± 10.2 mV/ms, n=13, t = −0.83, p = 0.42), or maximum rate of repolarization (−31.8 ± 0.87 mV/ms vs. −32.2 ± 1.03 mV/ms, n=13, t = 0.53, p = 0.61). (B) Representative traces illustrating the effect of acute hyperosmotic challenge on activity-induced calcium influx, as observed in current clamp, in both proximal and distal dendrites (blue, red respectively). (C) Summary data indicates that hyperosmotic challenge had a small inhibitory effect on activity induced calcium influx as observed in the proximal dendrites of OT-MCNs (−13.3 ± 3.6% n = 7, t = −3.7, p = 0.01, one-sample t-test), while also producing a significantly larger inhibitory effect in the distal dendrites (−38.3 ± 3.92%, n=7, *** indicates t = 4.68, p = 0.0007, proximal effect vs. distal effect, unpaired two-sample t-test). These effects were not significantly different than observed in voltage clamped neurons in Figure 4 (proximal: VC, IC: −14.30 ± 3.37,–13.33 ± 3.61, n=13, 7, respectively, t = −0.18, p = 0.86, unpaired two-sample t-test, distal: VC, IC: −40.63 ± 4.23,–38.27 ± 3.92, n=20, six respectively, t = −0.29, p = 0.77, unpaired two-sample test).
-
Figure 4—figure supplement 3—source data 1
Excel file containing source data for panel C.
- https://cdn.elifesciences.org/articles/63486/elife-63486-fig4-figsupp3-data1-v2.xlsx
Figure 5
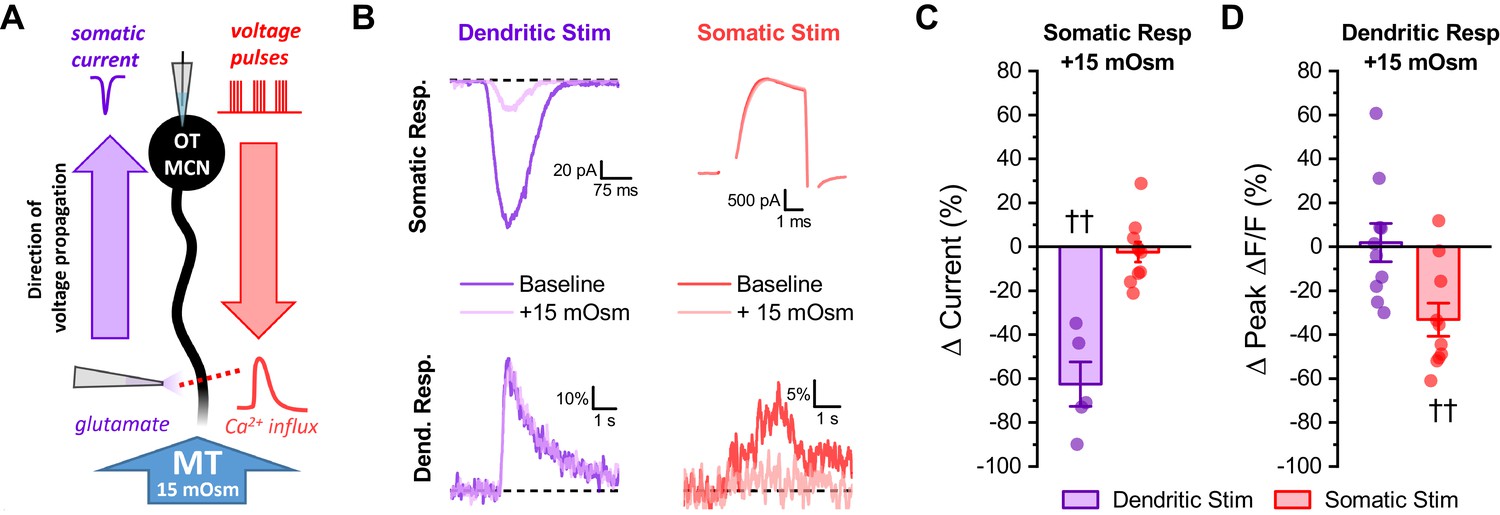
Acute hyperosmotic challenge selectively inhibits responses measured distal from a stimulus.
(A) Diagram of experimental design. Two distinct stimuli (one to the distal dendrites, and one to the soma) were delivered every 15 s to an OT-MCN voltage clamped at −70 mV. The stimulus to the distal dendrites was local application of glutamate (bottom left), while the somatic stimulus was the same 2 s, 20 Hz train of action potential-like voltage pulses used in earlier experiments (delivered though the patch pipette, top right). For each stimulus, we used electrophysiological techniques (whole-cell recording) to measure the somatic response, and optical techniques (two-photon line scans across the distal dendrite as in earlier figures) to measure the dendritic response. Both the electrophysiological and optical responses to each stimulus were measured both before and after bath application of 15 mOsm MT. (B) Illustrates representative recordings, both before and after acute hyperosmotic challenge, for each combination of stimulus and response described. (C) Illustrates the effect of acute hyperosmotic challenge on somatic responses to either dendritic or somatic stimulation (purple, red, respectively). (D) Illustrates the effect of acute hyperosmotic challenge on dendritic responses to either dendritic or somatic stimulation (purple, red, respectively). Collectively these results highlight that bath application of 15 mOsm MT effectively and selectively inhibits responses that are measured distal from the stimulus that produced them, irrespective of whether those responses are measured with electrical or optical techniques. These data reinforce the conclusion that acute hyperosmotic challenge reduces dendritic membrane resistance. †† p<0.01, one-sample t-test.
-
Figure 5—source data 1
Excel file containing source data for panels C-D.
- https://cdn.elifesciences.org/articles/63486/elife-63486-fig5-data1-v2.xlsx
Figure 6

Effect of acute hyperosmotic challenge is compartment-specific, cell type-specific and bidirectional.
(A) Compartment specificity: Calcium responses as observed in a representative cell indicating that acute hyperosmotic challenge preferentially inhibits activity-induced calcium influx in the distal dendrites as opposed to the distal axon of OT-MCNs. (B–C) Cell type specificity: Representative traces indicating that, in contrast to results reported for OT-MCNs (Figure 4), acute hyperosmotic challenge does not preferentially or selectively inhibit calcium influx (observed using identical techniques) in the distal dendrites of either PVN OT-PCNs (panel B) or hippocampal CA1 pyramidal neurons (panel C). (D) Bidirectionality: Representative traces indicating that, in contrast to results reported in Figure 4, acute hypo- (rather than hyper-) osmotic challenge selectively and preferentially increases (rather than decreases) activity-induced calcium influx observed in the distal dendrites of OT-MCNs. (Panels E-H) illustrate summary data for experiments represented in panels A-D, respectively. ** indicates p≤0.01, paired two-sample t-test.
-
Figure 6—source data 1
Excel file containing source data for panels E-H.
- https://cdn.elifesciences.org/articles/63486/elife-63486-fig6-data1-v2.xlsx
Figure 7
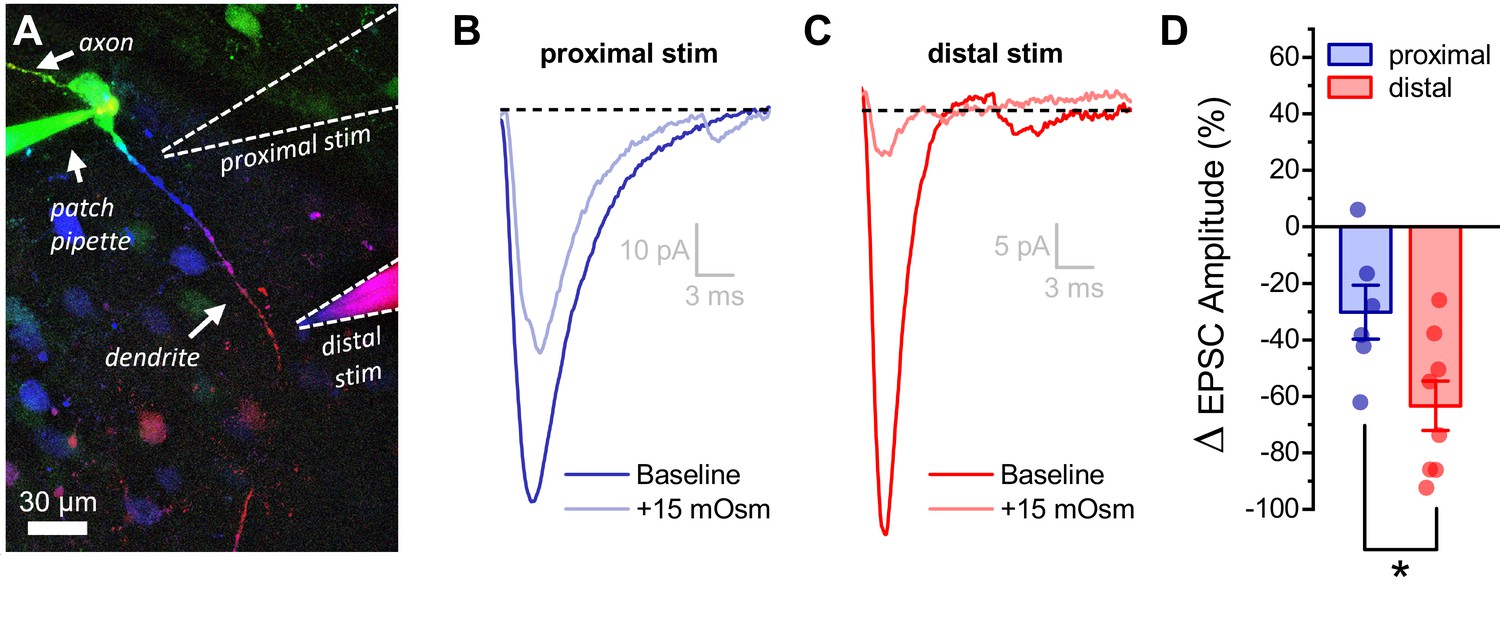
Acute hyperosmotic challenge has a greater inhibitory effect on distally vs. proximally evoked EPSCs in OT-MCNs.
(A) Representative OT-MCN (depth-coded two-photon Z-series projection) illustrates placement of minimal stimulators used to evoke EPSCs at either proximal or distal dendritic locations. (B–C) Representative data illustrating evoked EPSCs produced by proximal (panel B) vs. distal stimulation (panel C), both before and after bath application of 15 mOsm MT. (D) Summary data indicates that on average, acute hyperosmotic challenge produces greater inhibition of distally evoked EPSCs. * p = 0.03 (n=6,8, proximal, distal, respectively, unpaired two-sample t-test).
-
Figure 7—source data 1
Excel file containing source data for panel D.
- https://cdn.elifesciences.org/articles/63486/elife-63486-fig7-data1-v2.xlsx
Figure 8 with 2 supplements

Ruthenium red selectivity blocks the somatic, but not dendritic, effect of acute hyperosmotic challenge.
(A) Raw data from a representative OT-MCN illustrating spontaneous firing before and after acute hyperosmotic challenge in the continuous presence of TRPV antagonist ruthenium red (RR). (B) Summary data indicating that the effect of acute hyperosmotic challenge on action potential firing frequency in OT-MCNs (blue bar, ††† indicates p <0.001, one-sample t-test) is blocked in cells pretreated with RR (red bar, *** indicates p = 0.001, two-sample unpaired t-test, see text for further details). (C) Representative traces indicating that acute hyperosmotic challenge preferentially reduced activity-induced calcium influx in the distal vs. proximal dendrites of OT-MCNs. (D) In slices pre-treated with RR, acute hyperosmotic challenge had no significant effect on activity-induced calcium influx as observed in the proximal dendrites (ΔPeak ΔF/F: −10.9 ± 8.12%, n=6, t = −1.34, p = 0.24, one-sample t-test), but significantly reduced it in the distal dendrites (ΔPeak ΔF/F: −44.24 ± 7.47%, n=7, t = −5.92, p = 0.001, one-sample t-test, indicated by †††). *** indicates t = 3.03, p = 0.012 for effect in distal vs. proximal dendrites, unpaired two-sample t-test. Effects observed in this experiment also did not differ when compared to effects observed absent RR and reported in Figure 4C (proximal vs. proximal in RR: t = −0.37, p = 0.72, distal vs. distal in RR: t = 0.43, p = 0.67, unpaired two-sample t-test in both cases). Note that the control dataset in panel 8B above was previously presented in Figure 2C. ** indicates p = 0.001, unpaired two-sample t-test.
-
Figure 8—source data 1
Excel file containing source data for panels B.
- https://cdn.elifesciences.org/articles/63486/elife-63486-fig8-data1-v2.xlsx
Figure 8—figure supplement 1
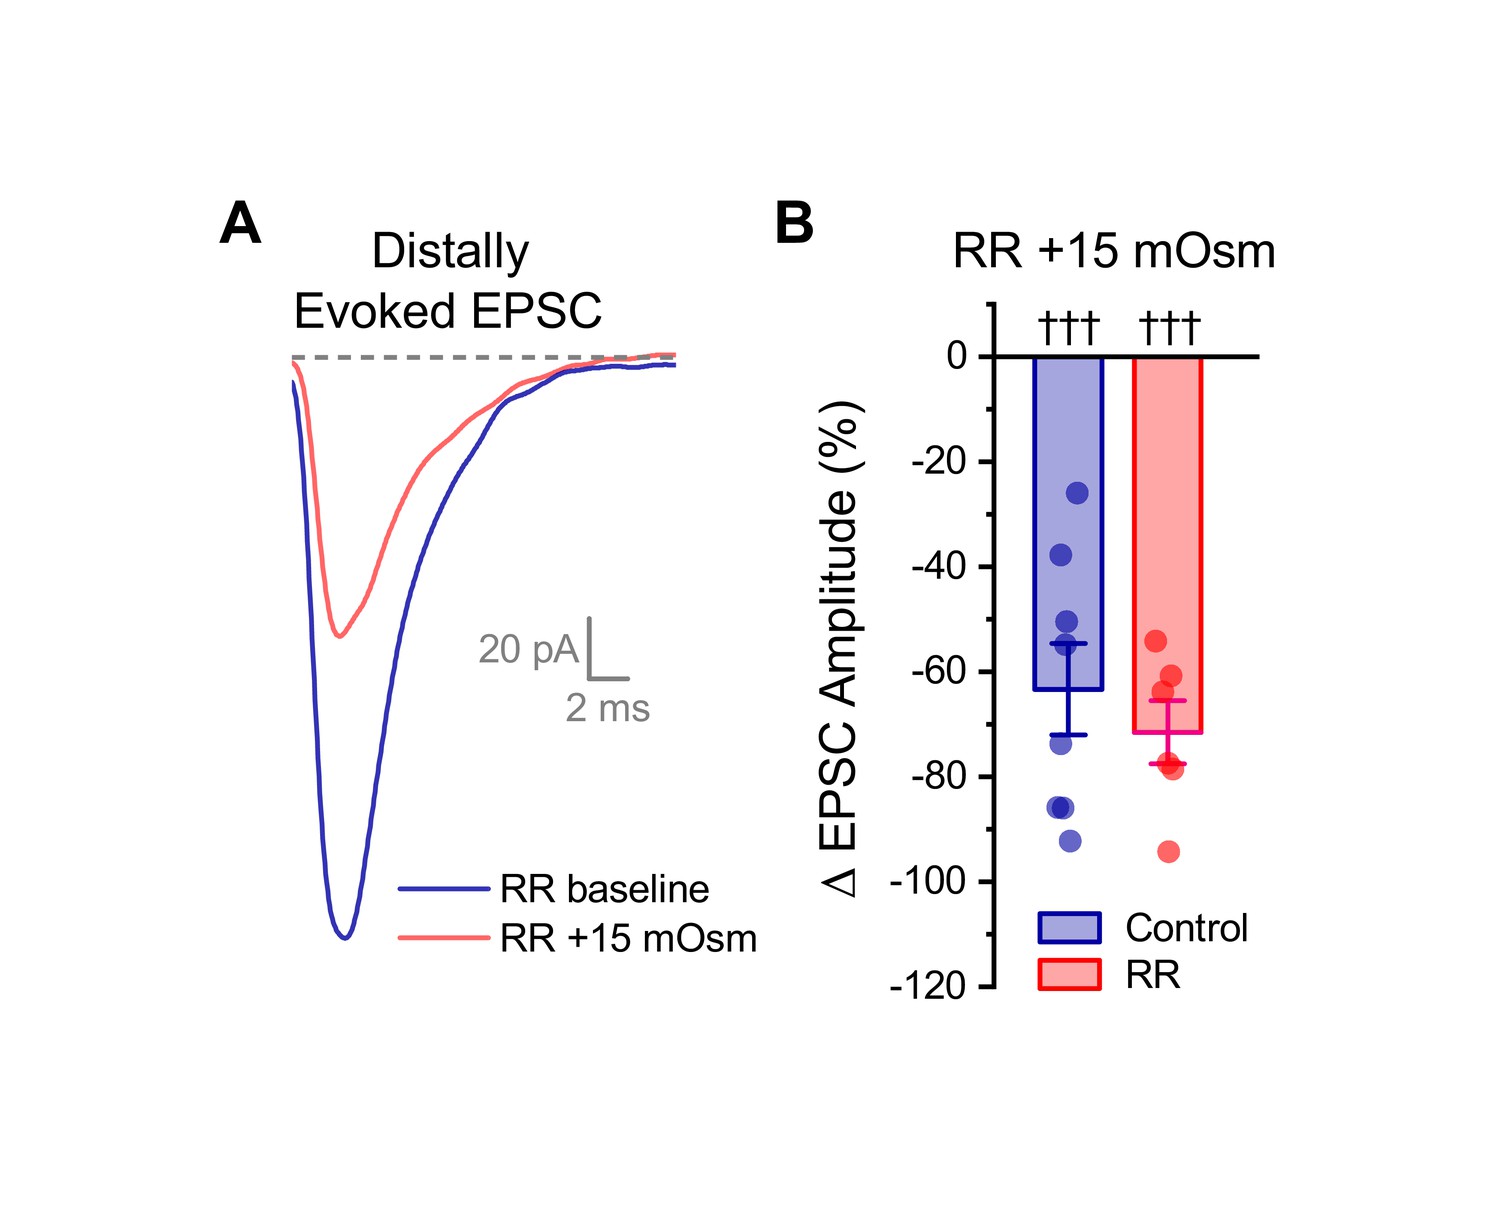
Ruthenium red does not block the effect of acute hyperosmotic challenge on distally evoked EPSCs.
(A) Raw data from a representative OT-MCN illustrating that acute hyperosmotic challenge continues to inhibit evoked EPSCs generated with minimal stimulation near the distal dendrite, even in cells pretreated with RR. (B) Summary data highlighting that pretreatment with RR has no impact on the ability of acute hyperosmotic challenge to inhibit distally evoked EPSCs. Note that the control dataset in panel B was previously presented in Figure 7D. ††† indicates p≤0.001, one-sample t-test.
-
Figure 8—figure supplement 1—source data 1
Excel file containing source data for panel B and D.
- https://cdn.elifesciences.org/articles/63486/elife-63486-fig8-figsupp1-data1-v2.xlsx
Figure 8—figure supplement 2
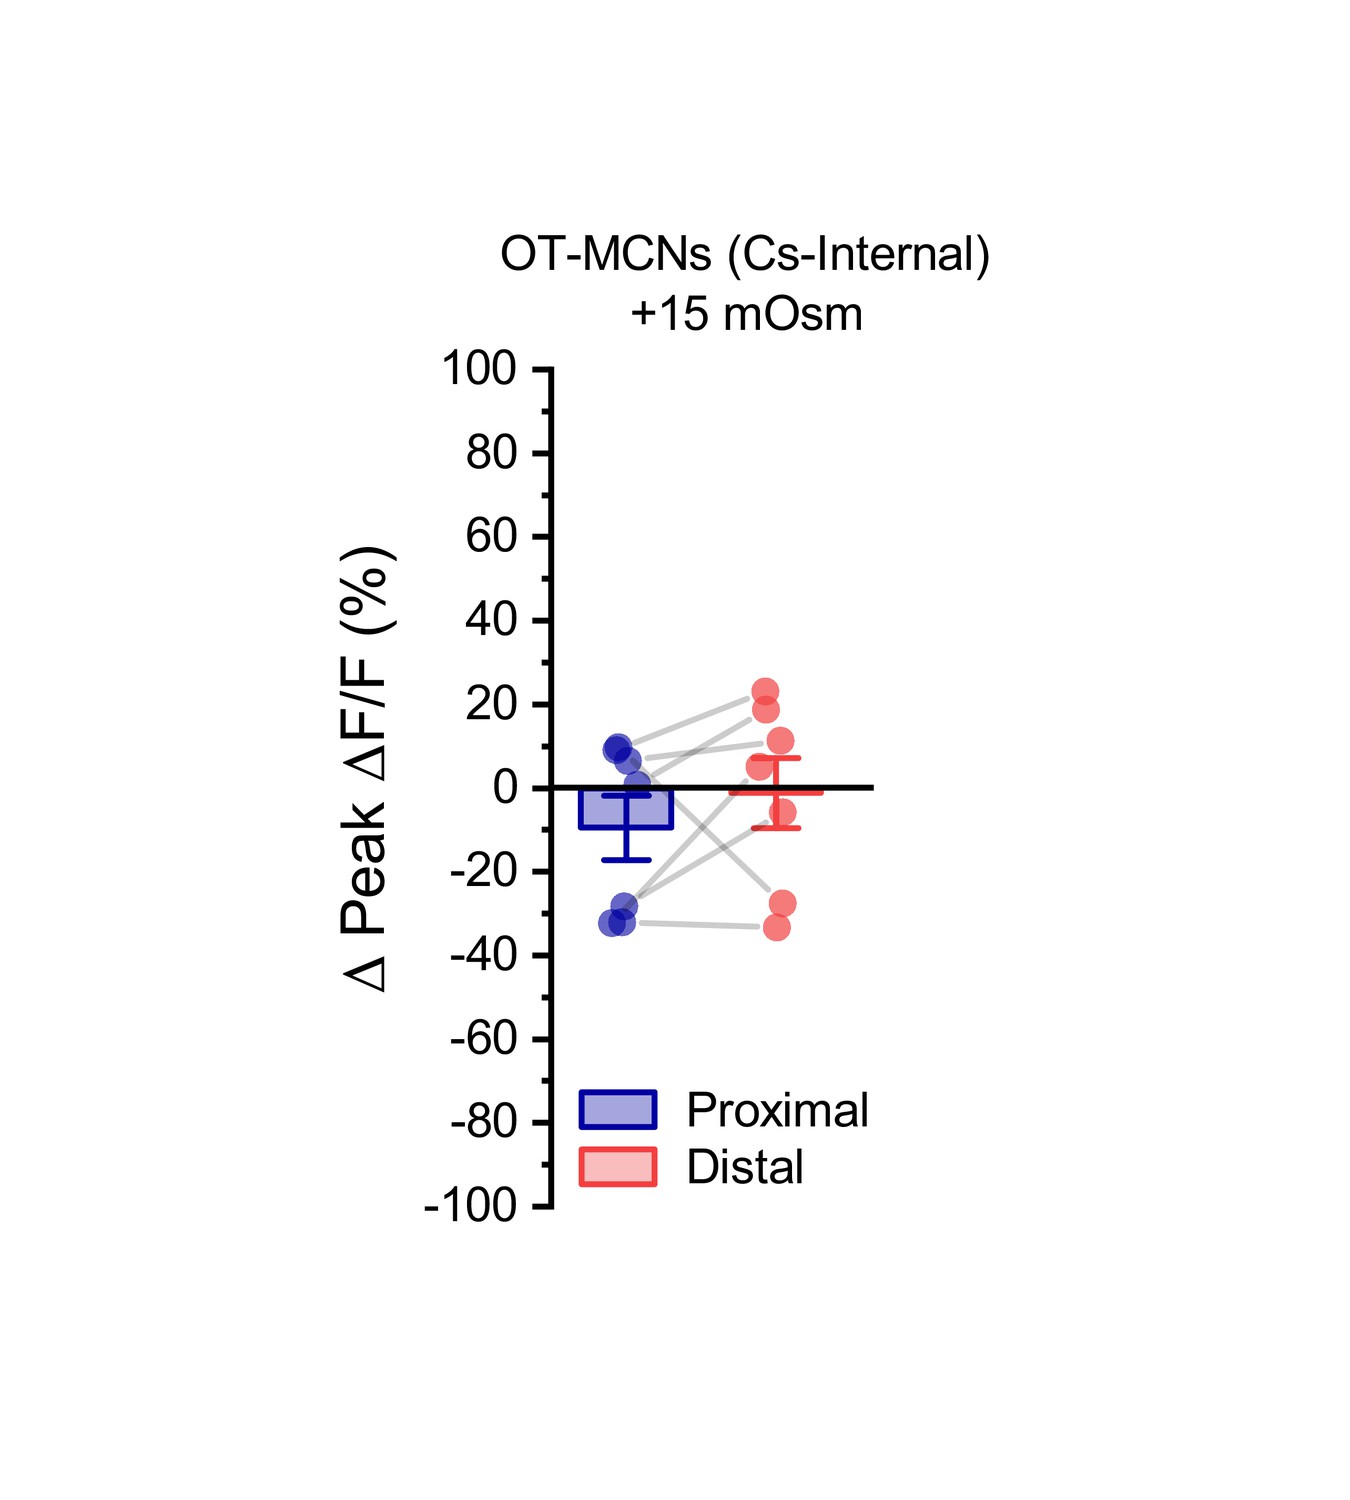
Acute hyperosmotic challenge has no effect on activity-induced calcium influx observed in dendrites of OT-MCNs filled with a Cs-gluconate-based internal solution.
We noted that when the experiment presented in Figure 4A–C is conducted in OT-MCNs filled with a Cs-gluconate rather than a K-gluconate-based internal solution, acute hyperosmotic challenge no longer had any significant effect on activity-induced calcium influx as observed in either the proximal or distal dendrites (Proximal:. −9.5 ± 7.7%, Distal: −1.2 ± 8.3%, n=seven is both cases, t = −1.2,–0.1, p = 0.26, 0.9, respectively, using one-sample t-test, and group means were also not significantly different, t = −0.93, p = 0.39, paired two-sample t-test).
-
Figure 8—figure supplement 2—source data 1
Excel file containing source data.
- https://cdn.elifesciences.org/articles/63486/elife-63486-fig8-figsupp2-data1-v2.xlsx
Figure 9

Activation of GABAA receptors preferentially inhibits activity-induced calcium influx in distal vs. proximal dendrites of OT-MCNs.
(A) Calcium responses to somatic activity were measured at proximal and distal sites (dashed lines) before and after bath application of 300 nM muscimol (a GABAA receptor agonist). Other than using muscimol in place of acute hyperosmotic challenge, techniques are identical those described for Figure 4. (B) Representative calcium responses observed during somatic stimulation in the proximal (blue) vs. distal (red) dendrite of an OT-MCN, before (lighter trace) and after (darker trace) bath application of muscimol. (C) Summary data indicates that bath application of muscimol produces greater inhibition of activity-induced calcium influx in the distal vs. proximal dendrites of OT-MCNs. *** p<0.001, paired two-sample t-test.
-
Figure 9—source data 1
Excel file containing source data for panel C.
- https://cdn.elifesciences.org/articles/63486/elife-63486-fig9-data1-v2.xlsx
Tables
Key resources table
| Reagent type (species) or resource | Designation | Source or reference | Identifiers | Additional information |
|---|---|---|---|---|
| Strain, strain background (Mouse) | B6.129S-Oxttm1.1(cre)Dolsn/J | Jackson Laboratory | JAX stock #024234; RRID:IMSR_JAX:024234 | |
| Strain, strain background (Mouse) | B6.Cg-Gt(ROSA) 26Sortm14(CAG-tdTomato)Hze/J | Jackson Laboratory | JAX stock #007914; RRID:IMSR_JAX:007914 | |
| Antibody | Anti-neurophysin1 (NP1, mouse monoclonal) | Dr. H. Gainer, National Institute of Health | PS-38 | 1:400 |
| Antibody | Anti-mouse Alexa Fluor 647 (donkey, polyclonal) | Jackson ImmunoResearch Labs | 715-606-151 RRID:AB_2340866 | 1:500 |
| Chemical compound, drug | DNQX | TOCRIS | 3212 | |
| Chemical compound, drug | AP5 | TOCRIS | 3693 | |
| Chemical compound, drug | picrotoxin | Sigma-Aldrich | P1675 | |
| Chemical compound, drug | CGP-55845 | TOCRIS | 1248 | |
| Chemical compound, drug | mannitol | Sigma-Aldrich | M4125 | |
| Chemical compound, drug | muscimol | TOCRIS | 0289 | |
| Chemical compound, drug | glutamate | Sigma-Aldrich | G2834 | |
| Chemical compound, drug | ruthenium red | Sigma-Aldrich | R275-1 | |
| Chemical compound, drug | Fluo-5F | ThermoFisher | F14221 | |
| Chemical compound, drug | Alexa Fluor 594 | ThermoFisher | A10438 | |
| Software, algorithm | NIS-Elements AR 5.02 | Nikon | RRID:SCR_014329 | |
| Software, algorithm | FIJI | Schindelin et al., 2012 | RRID:SCR_002285 | https://fiji.sc |
| Software, algorithm | pClamp 10 | Molecular Devices | RRID:SCR_011323 | |
| Software, algorithm | OriginPro | OriginLab Corporation | RRID:SCR_014212 | |
| Software, algorithm | Python 3.6 | RRID:SCR_008394 | https://www.python.org | |
| Software, algorithm | Prairie View 5.4 | Bruker Scientific | RRID:SCR_017142 |
Additional files
Download links
A two-part list of links to download the article, or parts of the article, in various formats.
Downloads (link to download the article as PDF)
Open citations (links to open the citations from this article in various online reference manager services)
Cite this article (links to download the citations from this article in formats compatible with various reference manager tools)
Dendritic osmosensors modulate activity-induced calcium influx in oxytocinergic magnocellular neurons of the mouse PVN
eLife 10:e63486.
https://doi.org/10.7554/eLife.63486


