Circuit and synaptic organization of forebrain-to-midbrain pathways that promote and suppress vocalization
- Department of Neurobiology, Duke University Medical Center, United Kingdom
- Department of Biostatistics & Bioinformatics, Duke University Medical Center, United Kingdom
- Department of Psychology, Cornell University, United States
Figures
Figure 1 with 4 supplements
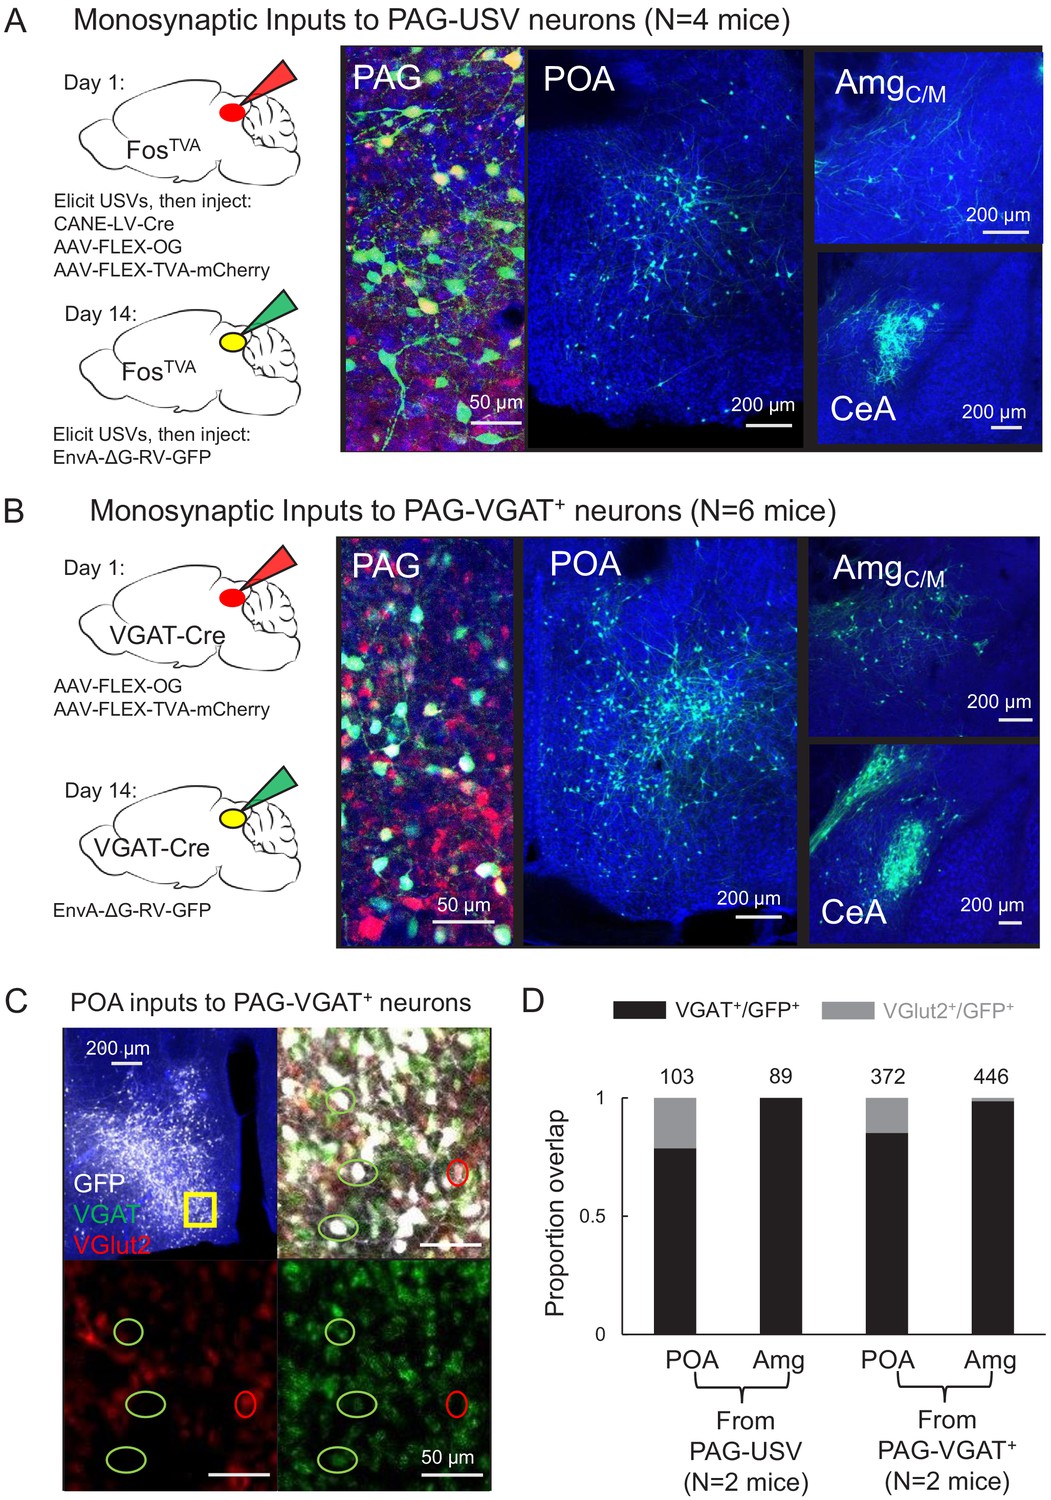
Inhibitory neurons in the hypothalamus and amygdala provide input to the periaqueductal gray (PAG) vocal gating circuit.
(A) (Left) Viral strategy shown for transsynaptic labeling of direct inputs to PAG-USV neurons (performed in N = 4 males). (Right) Confocal images are shown of starter PAG-USV neurons, upstream neurons labeled within the preoptic area of the hypothalamus (POA), and upstream neurons labeled within the AmgC/M and CeA. (B) Same, for transsynaptic labeling of direct inputs to GABAergic PAG neurons (performed in N = 4 males, N = 2 females). (C) Representative confocal image of in situ hybridization performed on transsynaptically labeled POA neurons that provide direct input to GABAergic PAG neurons (labeled with GFP, shown in white), showing overlap with expression of VGAT (green) and VGlut2 (red). DAPI shown in blue. (D) Quantification of overlap of transsynaptically labeled POA and amygdala neurons (CeA and AmgC/M combined) with VGAT and VGlut2 (N = 2 male mice per condition). Total numbers of neurons scored for overlap in each condition are indicated by the numbers over the bars. See also Figure 1—figure supplements 1–4, and Figure 1—source datas 1–2.
-
Figure 1—source data 1
Source data for Figure 1A–C.
- https://cdn.elifesciences.org/articles/63493/elife-63493-fig1-data1-v2.docx
-
Figure 1—source data 2
Source data for Figure 1D.
- https://cdn.elifesciences.org/articles/63493/elife-63493-fig1-data2-v2.xlsx
Figure 1—figure supplement 1

Monosynaptic rabies-based tracing reveals preoptic and amygdala inputs to the midbrain vocalization circuit.
(A) Example confocal images showing transsynaptic labeling of neurons in the preoptic area of the hypothalamus (preoptic area [POA], green) that provide monosynaptic input to GABAergic periaqueductal gray (PAG) neurons (left-most confocal image, VGAT-Cre female; middle confocal image, VGAT-Cre male) or to PAG-USV neurons (right confocal image, FosTVA male; blue, Neurotrace). (B–C) Same, for transsynaptically labeled neurons in (B) the central-medial boundary region of the amygdala (AmgC/M) and (C) the central amygdala (CeA). Coronal brain atlas images show the approximate plane of section of the confocal images to the right. Red rectangles superimposed on the atlas images indicate the approximate location of the brain regions shown in the confocal images. See also Figure 1—figure supplements 2–4. Scale bars, 250 µm. All brain atlas images were obtained from the Allen Mouse Brain Reference Atlas, (https://mouse.brain-map.org/experiment/thumbnails/100048576?Image_type=atlas).
Figure 1—figure supplement 2
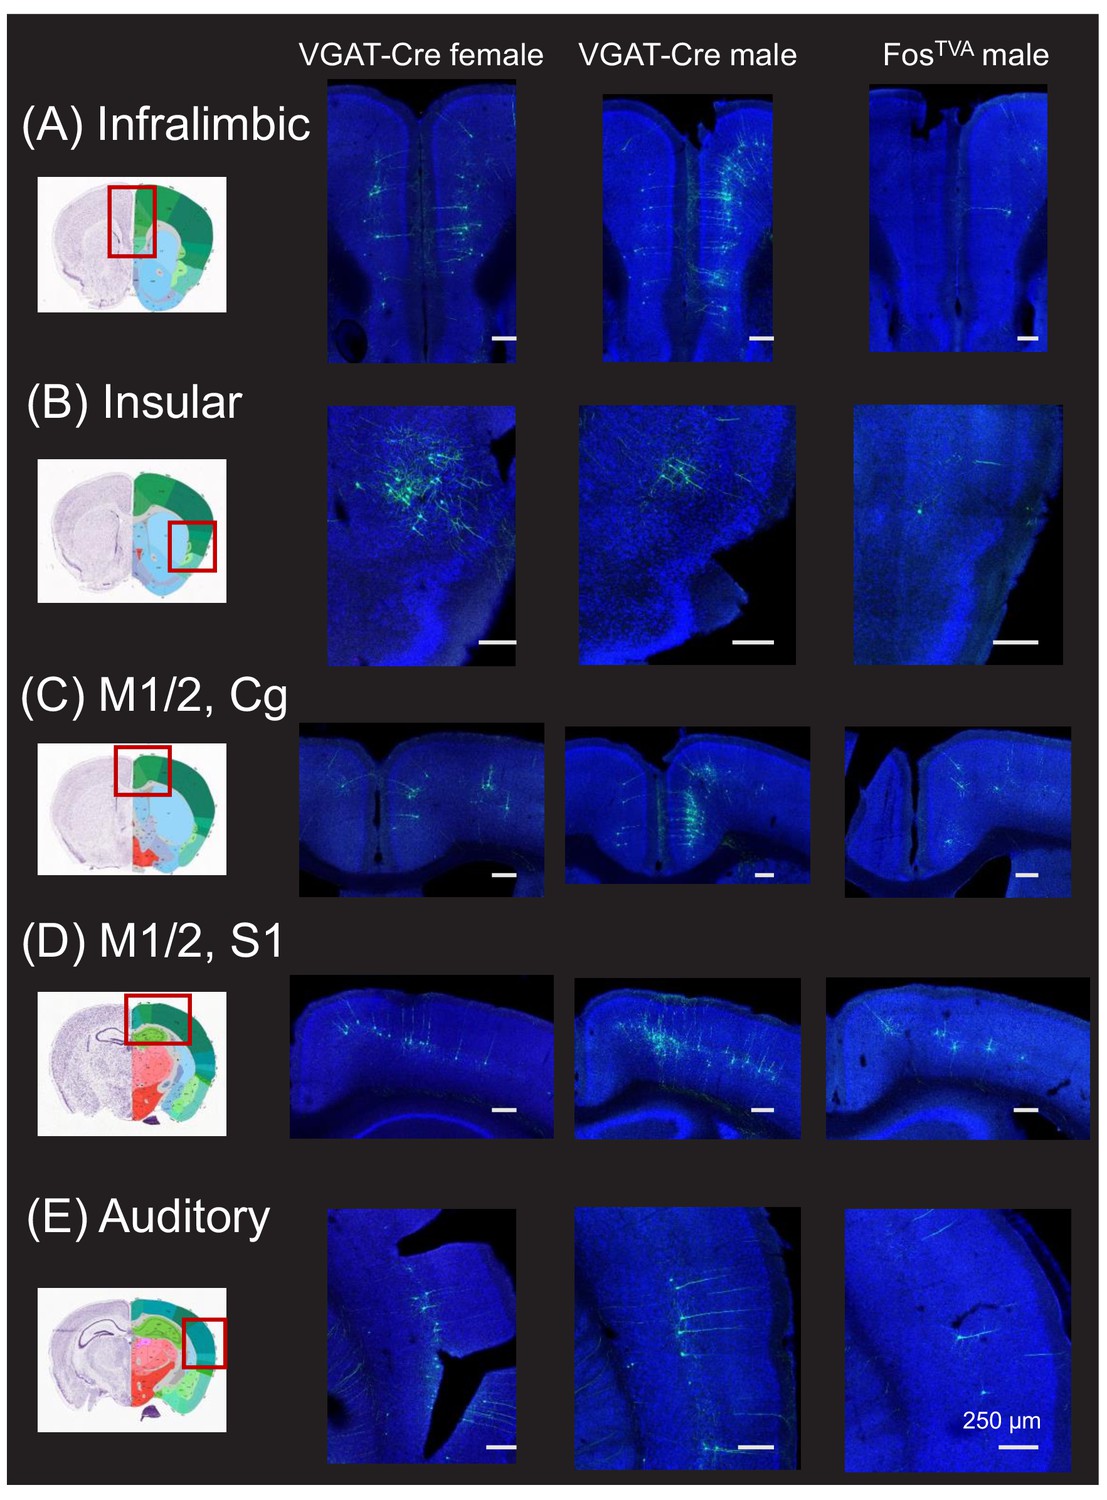
Monosynaptic rabies-based tracing reveals cortical inputs to the midbrain vocalization circuit.
(A) Example confocal images showing transsynaptic labeling of neurons in the infralimbic cortex (green) that provide monosynaptic input to GABAergic periaqueductal gray (PAG) neurons (left-most confocal image, VGAT-Cre female; middle confocal image, VGAT-Cre male) or to PAG-USV neurons (right confocal image, FosTVA male; blue, Neurotrace). (B–E) Same, for transsynaptically labeled neurons in (B) insular cortex, (C) motor (M1, M2), and cingulate (Cg) cortices, (D) M1, M2, and somatosensory cortex (S1), and (E) auditory cortex. Coronal brain atlas images show the approximate plane of section of the confocal images to the right. Red rectangles superimposed on the atlas images indicate the approximate location of the brain regions shown in the confocal images. See also Figure 1—figure supplements 1, 3 and 4. Scale bars, 250 µm. All brain atlas images were obtained from the Allen Mouse Brain Reference Atlas, (https://mouse.brain-map.org/experiment/thumbnails/100048576?Image_type=atlas).
Figure 1—figure supplement 3
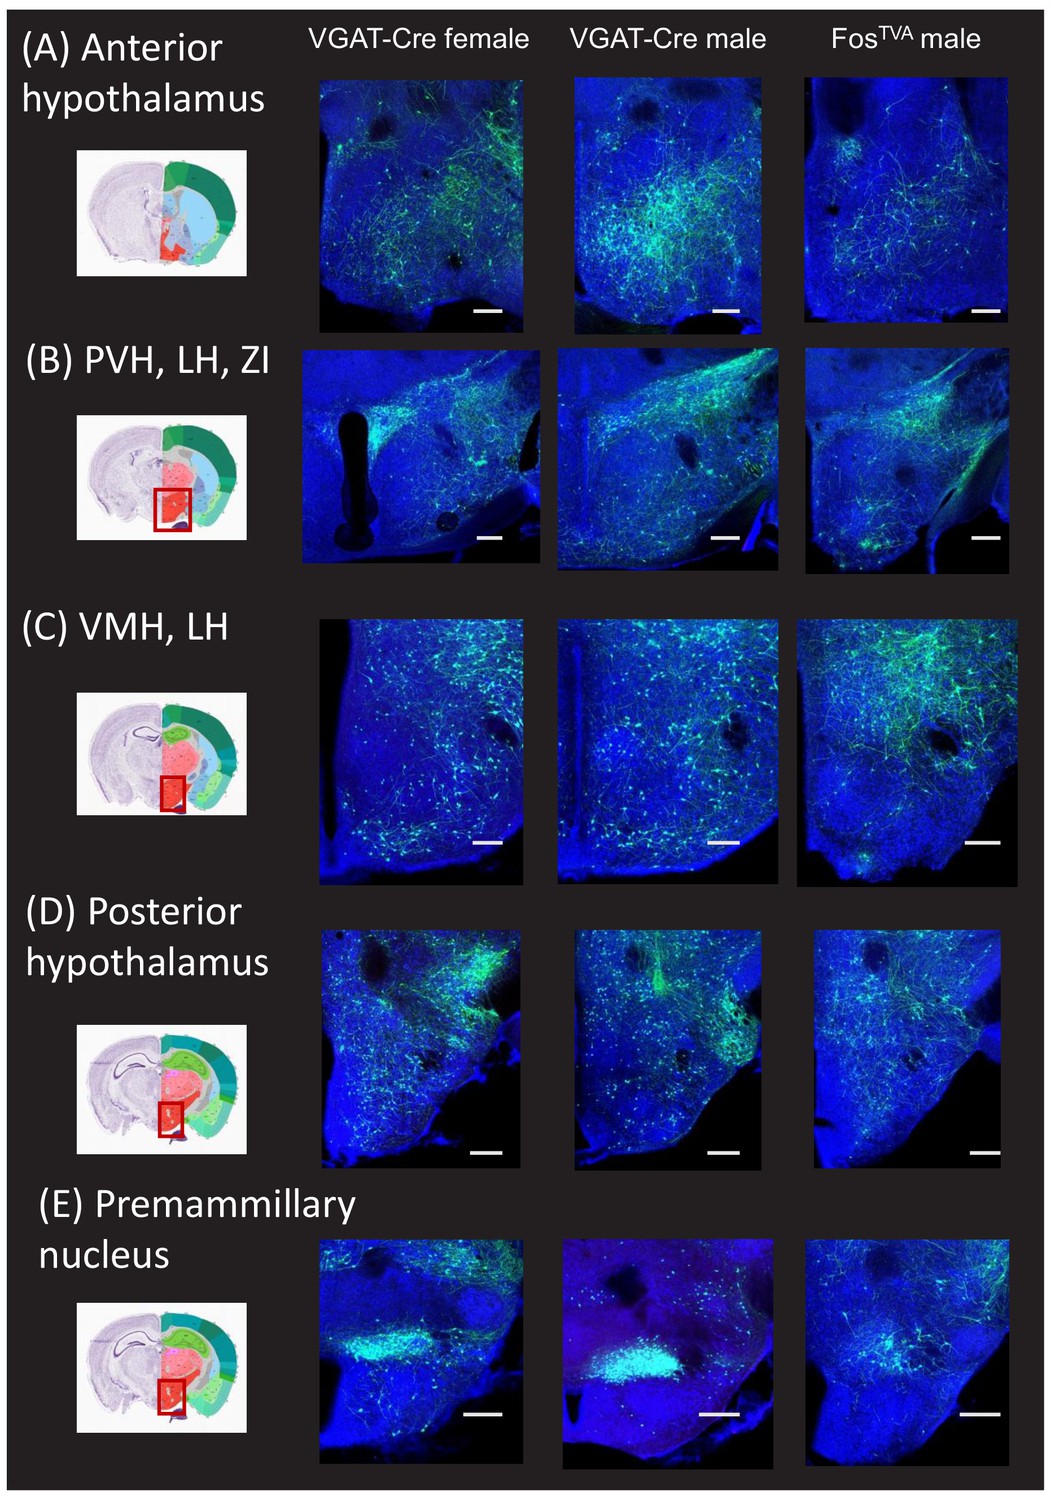
Monosynaptic rabies-based tracing reveals additional hypothalamic inputs to the midbrain vocalization circuit.
(A) Example confocal images showing transsynaptic labeling of neurons in the anterior hypothalamus (green) that provide monosynaptic input to GABAergic periaqueductal gray (PAG) neurons (left-most confocal image, VGAT-Cre female; middle confocal image, VGAT-Cre male) or to PAG-USV neurons (right confocal image, FosTVA male; blue, Neurotrace). (B–D) Same, for transsynaptically labeled neurons in (B) the paraventricular nucleus (PVN), lateral hypothalamus (LH), and zone incerta (ZI), (C) ventromedial hypothalamus (VMH) and LH, (D) posterior hypothalamus, and (E) premammillary nucleus. Coronal brain atlas images show the approximate plane of section of the confocal images to the right. Red rectangles superimposed on the atlas images indicate the location of the brain regions shown in the confocal images. See also Figure 1—figure supplements 1, 2 and 4. Scale bars, 250 µm. All brain atlas images were obtained from the Allen Mouse Brain Reference Atlas, (https://mouse.brain-map.org/experiment/thumbnails/100048576?Image_type=atlas).
Figure 1—figure supplement 4
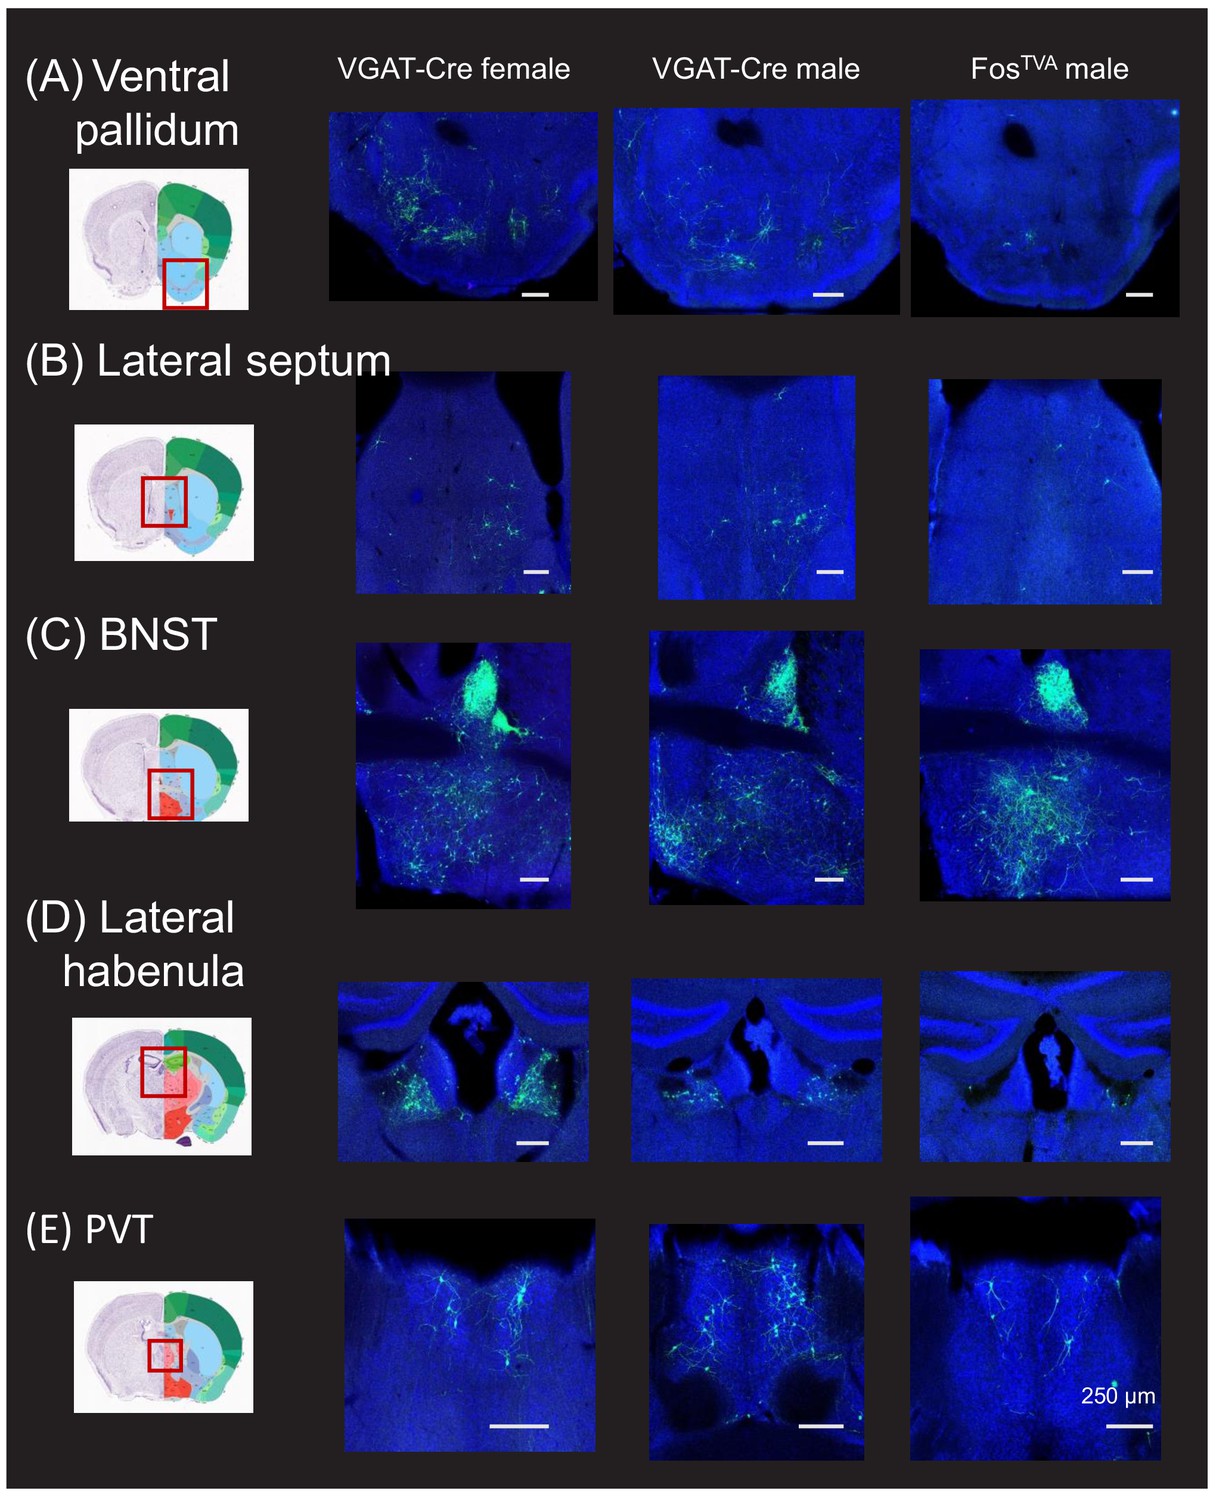
Monosynaptic rabies-based tracing reveals additional subcortical inputs to the midbrain vocalization circuit.
(A) Example confocal images showing transsynaptic labeling of neurons in the ventral pallidum (green) that provide monosynaptic input to GABAergic periaqueductal gray (PAG) neurons (left-most confocal image, VGAT-Cre female; middle confocal image, VGAT-Cre male) or to PAG-USV neurons (right confocal image, FosTVA male; blue, Neurotrace). (B–D) Same, for transsynaptically labeling of neurons in (B) lateral septum, (C) bed nucleus of the stria terminals (BNST), (D) lateral habenula, and (E) paraventricular nucleus of the thalamus (PVT). Coronal brain atlas images show the approximate plane of section of the confocal images to the right. Red rectangles superimposed on the atlas images indicates the location of the brain regions shown in the confocal images. See also Figure 1—figure supplements 1–3. Scale bars, 250 µm. All brain atlas images were obtained from the Allen Mouse Brain Reference Atlas, (https://mouse.brain-map.org/experiment/thumbnails/100048576?Image_type=atlas).
Figure 2 with 3 supplements
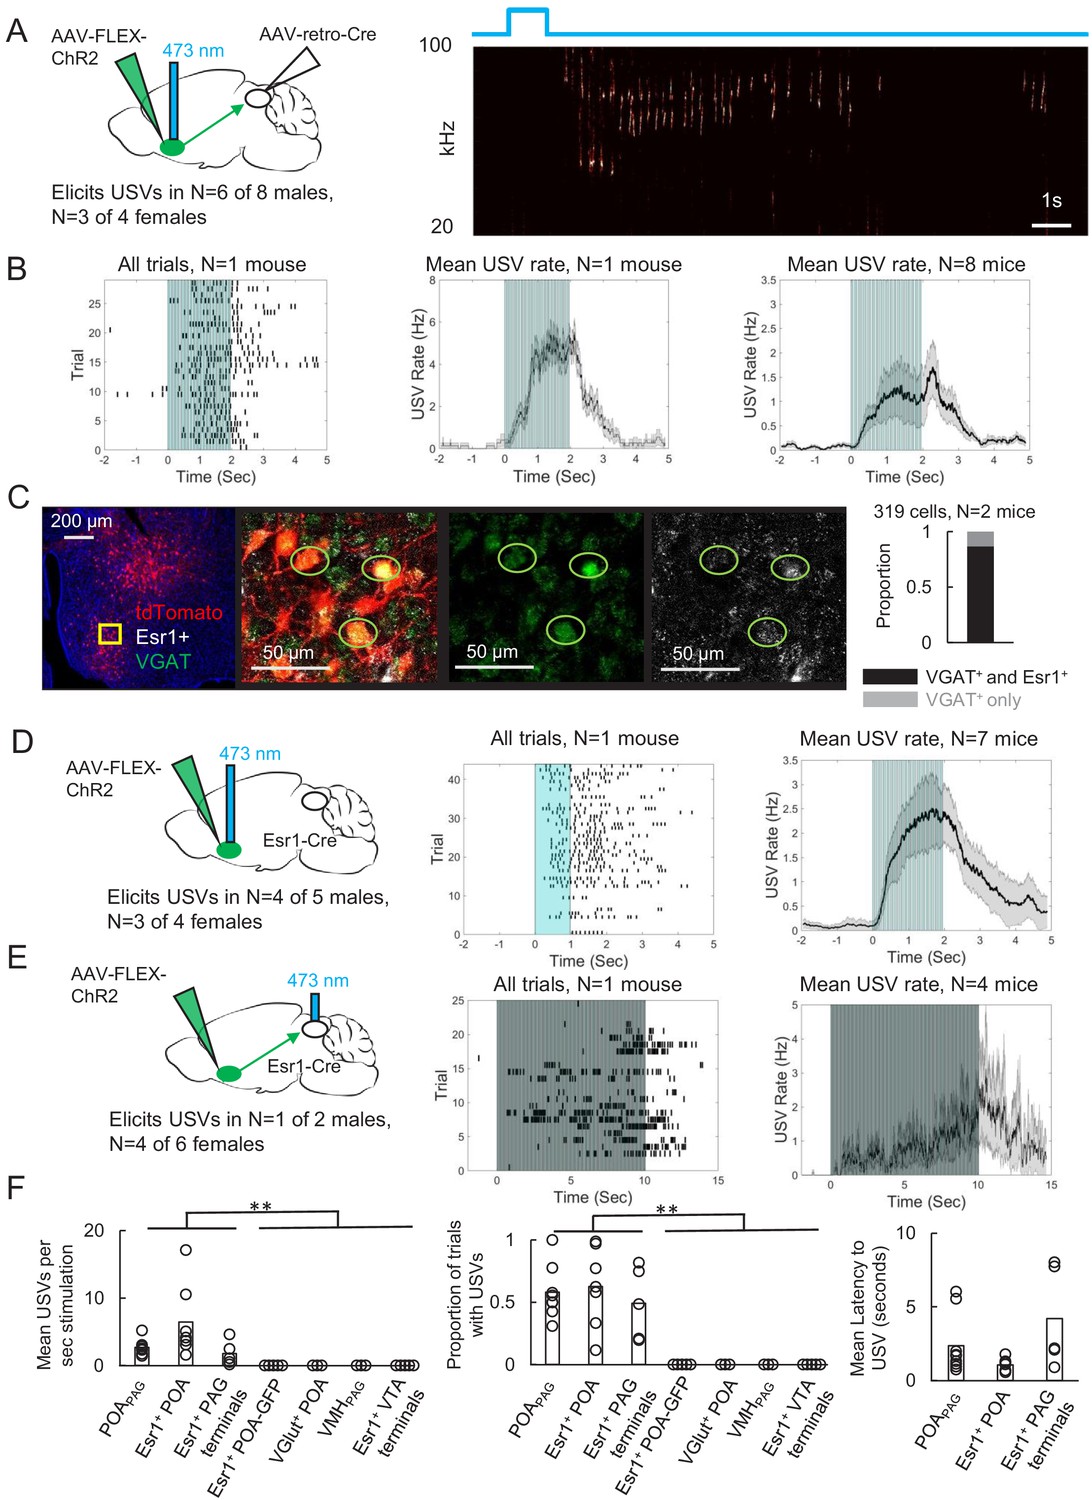
Activating periaqueductal gray (PAG)-projecting POA neurons elicits ultrasonic vocalizations (USVs) in the absence of social cues.
(A) (Left) Viral strategy to express ChR2 in POAPAG neurons. (Right) Example trial showing that optogenetic activation of POAPAG neurons elicits USV production in an isolated animal. (B) (Left) Raster plot shows USVs elicited in many trials in a representative mouse following optogenetic activation of POAPAG neurons. (Middle) Mean USV rate aligned to delivery of blue light pulses plotted for that same mouse. (Right) Mean USV rate plotted for N = 8 mice following optogenetic activation of POAPAG neurons. Please note that one mouse in which USVs were elicited by optogenetic stimuli that did not include the 2s-long, 10 Hz stimulus is excluded from the summary analysis shown in the right-most panel. Gray shading above and below the mean in the middle and right panels represents S.E.M. See also Figure 2—figure supplement 1. (C) Representative confocal image and quantification of in situ hybridization performed on POAPAG neurons (tdTomato, red), showing overlap with Esr1 (white) and VGAT (green). DAPI is blue, N = 2 mice. (D) (Left) Viral strategy used to express ChR2 in Esr1+ POA neurons. (Middle) Raster plot shows USVs elicited in many trials in a representative mouse following optogenetic activation of Esr1+ POA neurons. (Right) Mean USV rate plotted for N = 7 mice following optogenetic activation of Esr1+ POA neurons. Gray shading above and below the mean represents S.E.M. (E) Same as (D), for experiments in which the axon terminals of Esr1+ POA neurons were optogenetically activated within the PAG. Data shown for stimulation with10s-long, 20 Hz blue light pulses. Please note that one mouse in which USVs were elicited by optogenetic stimuli that did not include the 10s-long, 20 Hz stimulus is excluded from the summary analysis shown in the right-most panel. (F) Summary plots show mean number of USVs per second of optogenetic stimulation (left, p=0.0013, one-way ANOVA between all groups, with post-hoc t-tests showing that each experimental condition was significantly different from control conditions at p<0.01), mean number of optogenetic trials with USVs (middle, p=1.8E-6, one-way ANOVA between all groups, with post-hoc t-tests showing that each experimental condition was significantly different from control conditions at p<0.01), and mean latency from onset of optogenetic stimulus to onset of first USV (right) for mice in which optogenetic stimulation was applied to POAPAG neurons (N = 9 mice), Esr1+ POA neurons (N = 7 mice), Esr1+ POA axon terminals within the PAG (N = 5 mice), GFP-expressing Esr1+ POA neurons (N = 5 mice), VGlut+ POA neurons (N = 3 mice), VMHPAG neurons (N = 3), and Esr1+ POA axon terminals within the ventral tegmental area (VTA) (N = 4 mice). See also Figure 2—figure supplements 1–3 and Figure 2—source data 1.
-
Figure 2—source data 1
Source data for Figure 2C and F.
- https://cdn.elifesciences.org/articles/63493/elife-63493-fig2-data1-v2.xlsx
Figure 2—figure supplement 1

Additional characterization of ultrasonic vocalizations (USVs) elicited by optogenetic activation of preoptic area (POA) neurons.
(A) Mean USV rate across trials aligned to delivery of blue light pulses plotted for N = 8 individual mice following optogenetic activation of POAPAG neurons. Plots represent the individual animals summarized in the right-most panel of Figure 2B. The example animal represented in the left panels of 2B is mouse number four here. Gray shading above and below the mean in the middle and right panel represents S.E.M. (B) Top: the minimum latency from the onset of optogenetic stimulation to the onset of the first optogenetically elicited USV is plotted for three groups of mice: ChR2 expressed in POAPAG neurons (N = 9 mice, blue points), ChR2 expressed in Esr1+ POA neurons (N = 7 mice, black points), and ChR2 expressed in axon terminals within the PAG of Esr1+ POA neurons (N = 5 mice, red points). Bottom: same plot as above, but with the y range restricted from 0 to 0.5 s. (C) Quantification of the duration of USV bouts elicited by 2 s, 10–20 Hz optogenetic stimulation of POA neurons. Each column represents a different mouse, and each point represents the duration of an USV bout elicited by a 2s-long optogenetic stimulus. Colors as in (B). Please note that five animals shown in (B) had only a small number of 2s-long optogenetic activation trials and were therefore not included in the analysis shown in (C). See also Figure 2—figure supplement 1—source data 1.
-
Figure 2—figure supplement 1—source data 1
Source data for panels B and C of Figure 2—figure supplement 1.
- https://cdn.elifesciences.org/articles/63493/elife-63493-fig2-figsupp1-data1-v2.xlsx
Figure 2—figure supplement 2
Additional information related to the optogenetic activation of POAPAG, POA-Esr1+ neurons, and AmgC/M-PAG neurons.
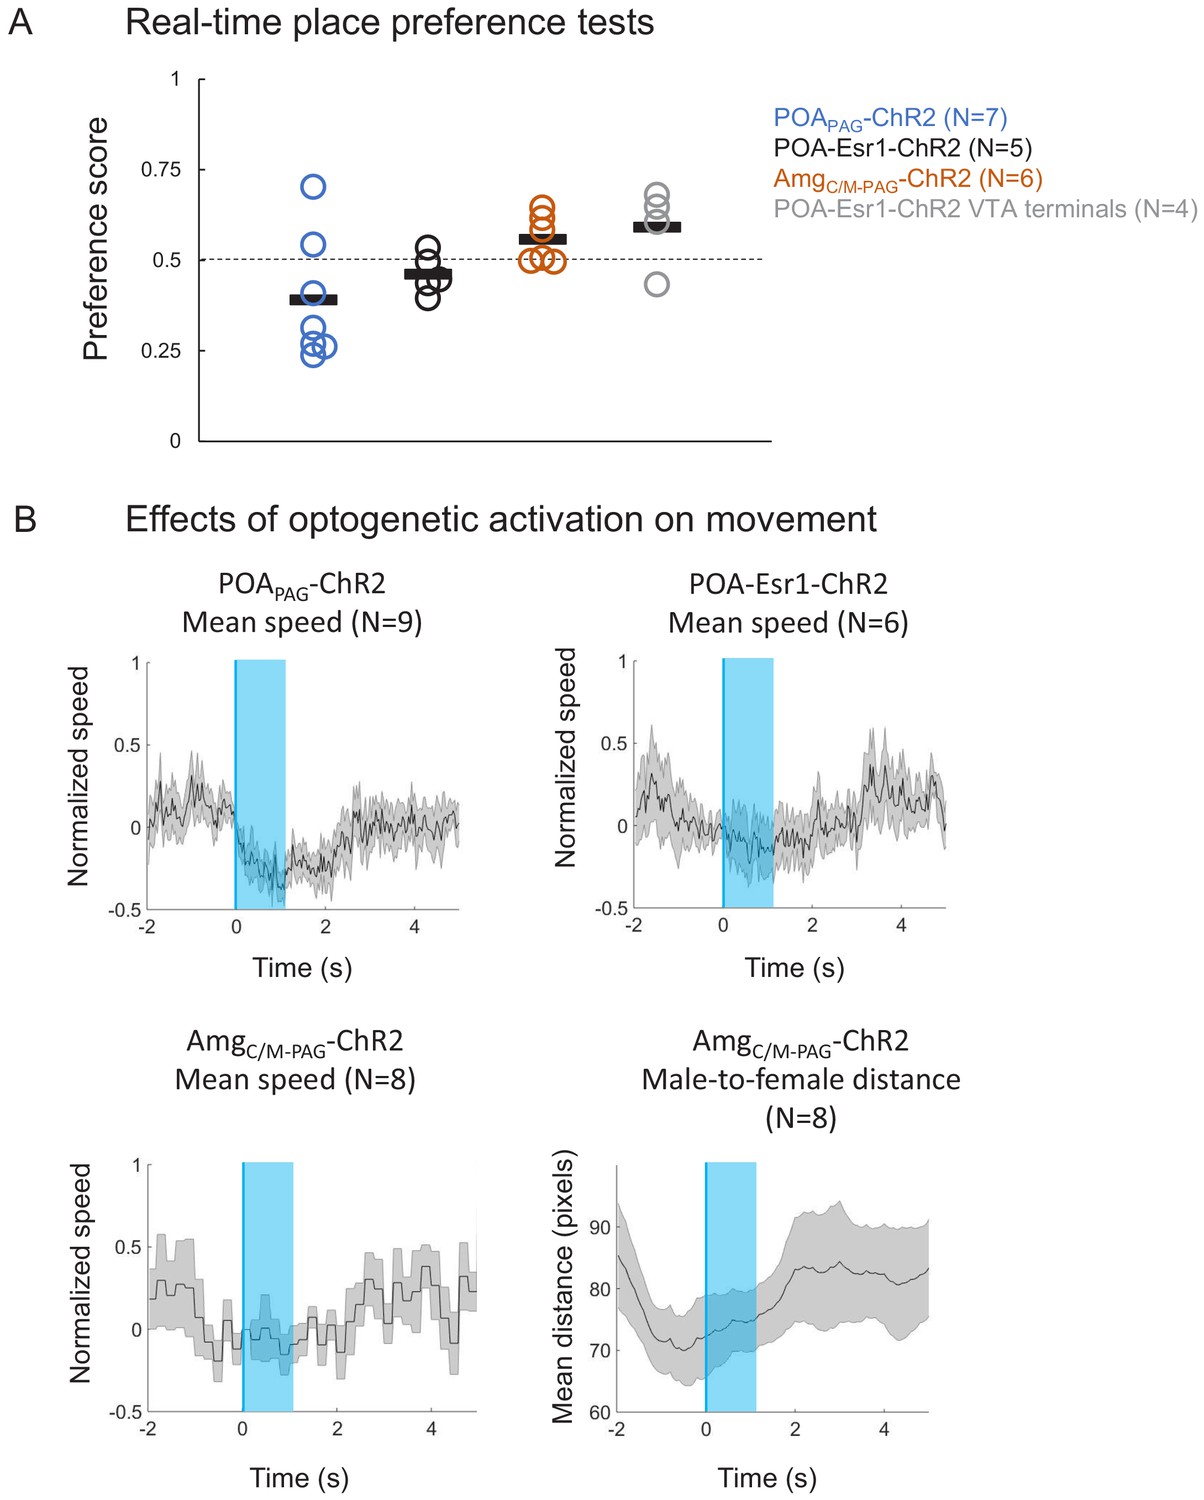
(A) Real-time place preference tests were performed in which either POA or AmgC/M neurons were optogenetically activated when mice were in one of two sides of a test chamber (see Materials and methods). (B) The mean speeds of mice were calculated and aligned to the onset of optogenetic activation of POAPAG neurons (top left), POA-Esr1+ neurons (top right), and AmgC/M-PAG neurons (bottom left). (Bottom, right) Distances between male AmgC/M-PAG-ChR2 mice and their female social partners were calculated and aligned to the onset of optogenetic activation of AmgC/M-PAG neurons. Gray shading represents S.E.M. See also Figure 2—figure supplement 2—source data 1.
-
Figure 2—figure supplement 2—source data 1
Source data for panel A of Figure 2—figure supplement 2.
- https://cdn.elifesciences.org/articles/63493/elife-63493-fig2-figsupp2-data1-v2.xlsx
Figure 2—figure supplement 3

Dual tracing of the axonal projections of POAPAG and AmgC/M-PAG neurons.
POAPAG neurons are labeled with GFP, and AmgC/M-PAG neurons are labeled with tdTomato. (Top left) Plane of section through the preoptic area (POA) shows the beginning of POAPAG cell body labeling in green and axonal projections to the lateral POA from AmgC/M-PAG neurons in red. (Middle left) Plane of section through the AmgC/M-PAG shows axonal projections from POAPAG neurons that overlap with AmgC/M-PAG cell bodies. (Bottom left) Plane of section through the ventral tegmental area (VTA)/SNr. (Top right) Plane of section including the rostral PAG and retrorubral area. (Bottom right) Place of section through the caudal PAG, showing the overlapping terminal fields of POAPAG and AmgC/M-PAG neurons. These representative images are from a female mouse, and we found that POAPAG and AmgC/M-PAG neurons have similar axonal projections in males and females (data not shown).
Figure 3

Acoustic characterization of ultrasonic vocalizations (USVs) elicited by optogenetic activation of preoptic area (POA) neurons.
(A) The variational autoencoder (VAE) takes spectrograms as input (left), maps the spectrograms to low-dimensional latent representations using an encoder (middle), and approximately reconstructs the input spectrogram using a decoder (right). (B) (Left) Dimensionality reduction techniques such as PCA or UMAP can be used to visualize the resulting latent vectors. (Right) Interpolations in latent space correspond to smooth USV syllable changes in spectrogram space exhibiting realistic dimensions of variation. (C) UMAP projections of latent syllable representations of female-directed USVs (red) and optogenetically elicited USVs (blue) from two example mice. (D) Maximum Mean Discrepancy (MMD) was calculated between distributions of latent syllable representations to generate three comparisons: female-directed USVs from the first half of the recording session vs. female-directed USVs from the second half, all female-directed USVs vs. opto-USVs (N = 16 experimental mice), and female-directed USVs from two different recordings sessions in N = 10 control mice (gray points). Note that larger MMD values indicate that distributions are more dissimilar (E) UMAP projections of latent descriptions of female-directed (red) and optogenetically elicited USVs (blue) for all mice (N = 15). (F) UMAP projections from panel E, color-coded by total energy (left) and frequency bandwidth (right). Example spectrograms of opto-USVS and female-directed USVs are plotted below, and the location of each example USV in UMAP space is indicated by the colored dots on the grayscale UMAP projection on the bottom left. See also Figure 3—source data 1.
-
Figure 3—source data 1
Source data for Figure 3D.
- https://cdn.elifesciences.org/articles/63493/elife-63493-fig3-data1-v2.xlsx
Figure 4 with 2 supplements
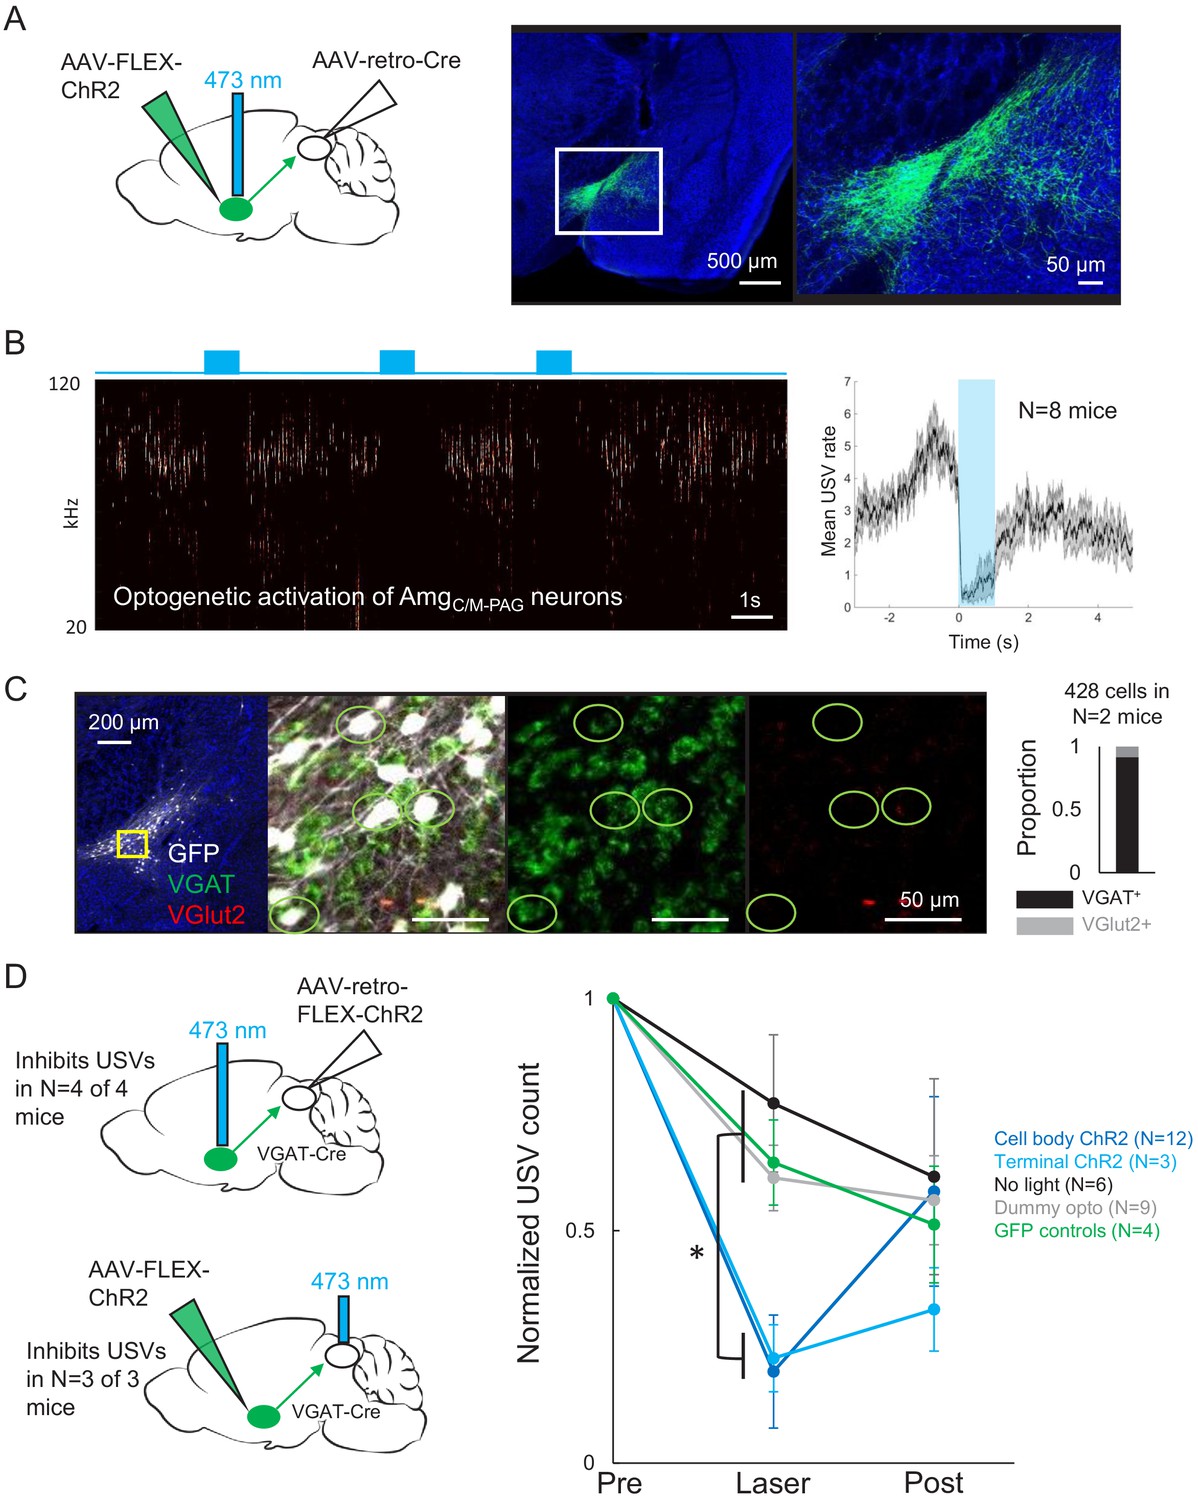
Activating AmgC/M-PAG neurons transiently suppresses ultrasonic vocalization (USV) production.
(A) (Left) Viral strategy used to express ChR2 in AmgC/M-PAG neurons. (Right) Confocal image of representative AmgC/M-PAG cell body labeling achieved with this viral strategy. (B) (Left) Spectrogram showing a representative trial in which optogenetic activation of AmgC/M-PAG neurons suppresses USV production during the laser stimulation period. (Right) Group data quantified for N = 8 mice. Gray shading above and below the mean represents S.E.M. (C) Confocal image and quantification of in situ hybridization performed on AmgC/M-PAG neurons (GFP, shown in white), showing overlap with VGlut2 (red) and VGAT (green). DAPI in blue, N = 2 mice. (D) Left: viral strategy used to express ChR2 in the periaqueductal gray (PAG) axon terminals of AmgC/M-PAG neurons. Right: Quantification of the number of USVs produced in the 1 s period prior to optogenetic stimulation (pre), the 1 s period of optogenetic stimulation (laser), and the 1 s period following optogenetic stimulation (post). Data for each mouse were normalized by dividing the pre, laser, and post measurements by the total number of USVs produced during the pre-laser period. Group averages are shown for mice in which AmgC/M-PAG neurons were optogenetically activated (N = 12, dark blue), mice in which the PAG axon terminals of AmgC/M-PAG neurons were optogenetically activated (N = 3, light blue), control mice in which the blue laser was shined over the mouse’s head but not connected to the optogenetic ferrule (N = 9, gray), control mice in which GFP was expressed in AmgC/M-PAG neurons (N = 4, green), and control mice in which the laser was triggered but not turned on (N = 6, black). Error bars represent S.D. Please note that the decay in USV rates over time in the control groups reflects the natural statistics of USV production (increasing probability that a bout will end as time progresses). See also Figure 4—figure supplements 1–2, Figure 2—figure supplements 1–2, and Figure 4—source data 1.
-
Figure 4—source data 1
Source data for Figure 4C and D.
- https://cdn.elifesciences.org/articles/63493/elife-63493-fig4-data1-v2.xlsx
Figure 4—figure supplement 1
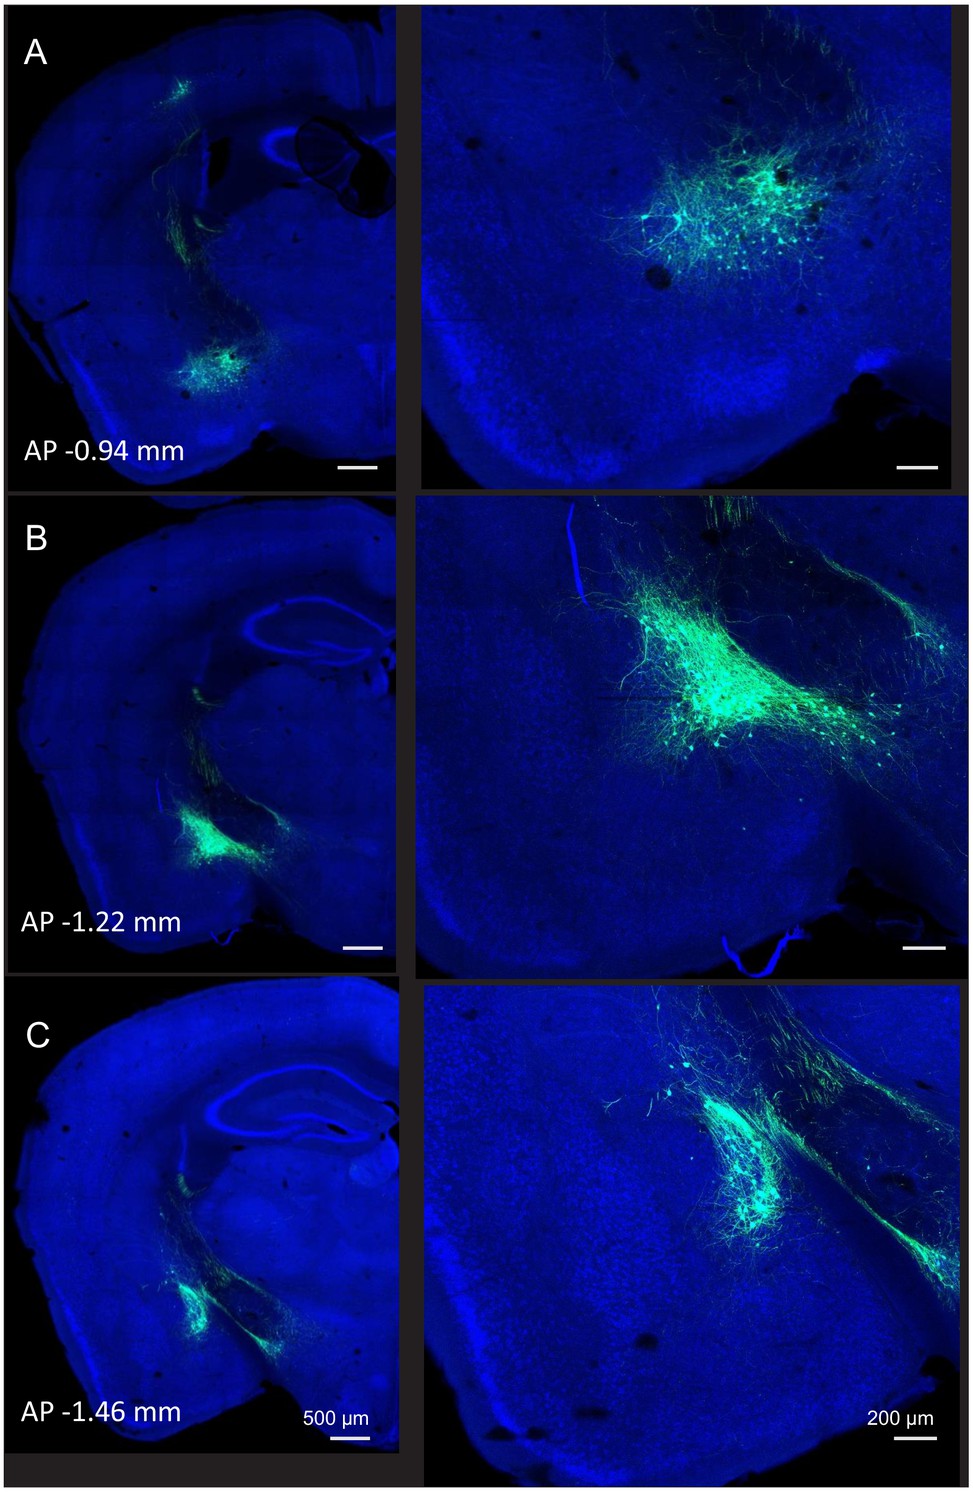
Extent of cell body labeling of AmgC/M-PAG neurons.
AmgC/M-PAG neurons were labeled by injecting AAV-retro-Cre into the caudolateral periaqueductal gray (PAG) and AAV-FLEX-GFP into the AmgC/M. (A–C) Three planes of coronal section are shown that cover the rostral to caudal extent of AmgC/M-PAG cell body labeling.
Figure 4—figure supplement 2
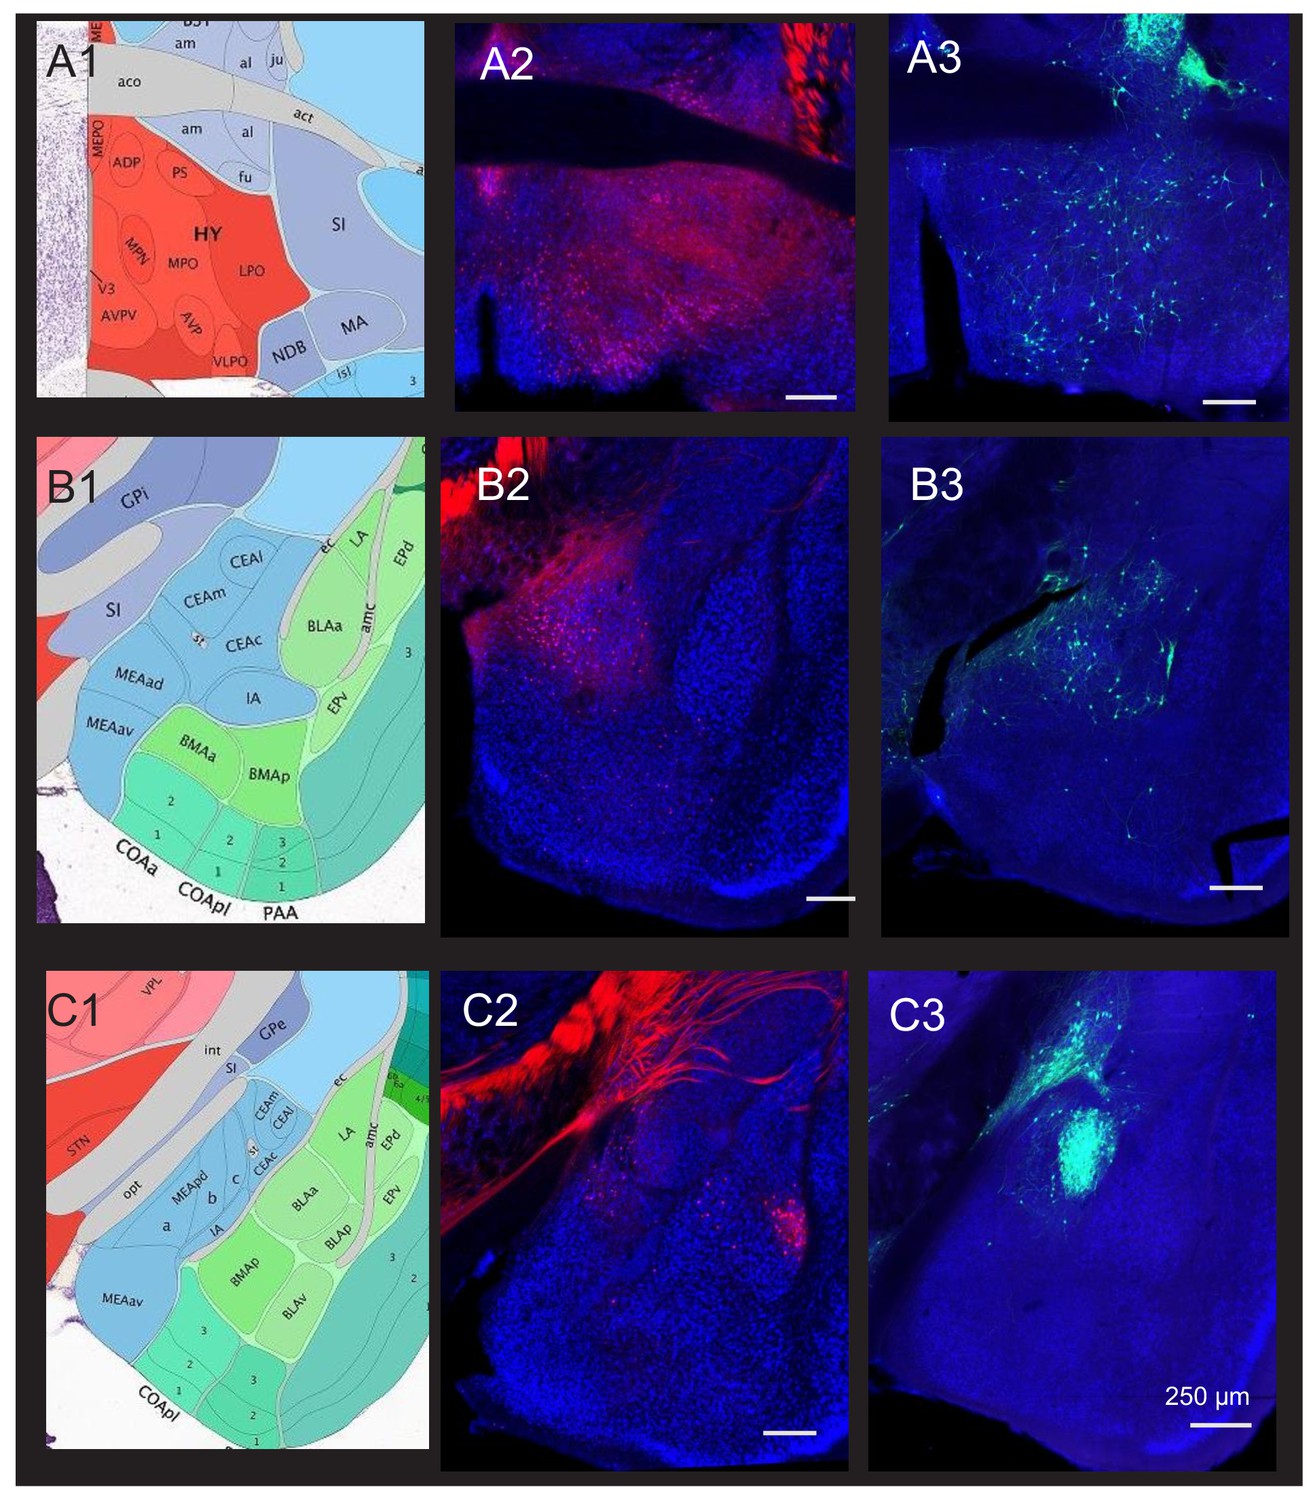
Comparison of hypothalamus and amygdala cell body labeling achieved after transsynaptic tracing from the periaqueductal gray (PAG) vocal gating circuit versus.
AAV-retro-Cre injection into the caudolateral PAG. Representative coronal sections are shown for POA and amygdala cell body labeling observed after monosynaptic rabies-based tracing from GABAergic PAG neurons (right panels, GFP-labeled cells) or AAV-retro-Cre injection into the caudolateral PAG of an Ai14 reporter mouse (middle panels, tdTomato-labeled cells, see Materials and methods). A-C show different planes of section as illustrated in the atlas images in the left panels. Note that although both AmgC/M and CeA neurons are labeled after transsynaptic tracing from PAG-GABA neurons (B3 and C3), CeA neuronal labeling is absent after injection of AAV-retro-Cre (C2). Scale bars, 250 µm. All brain atlas images were obtained from the Allen Mouse Brain Reference Atlas, (https://mouse.brain-map.org/experiment/thumbnails/100048576?Image_type=atlas).
Figure 5
AmgC/M neurons provide direct inhibition onto PAG-USV neurons.
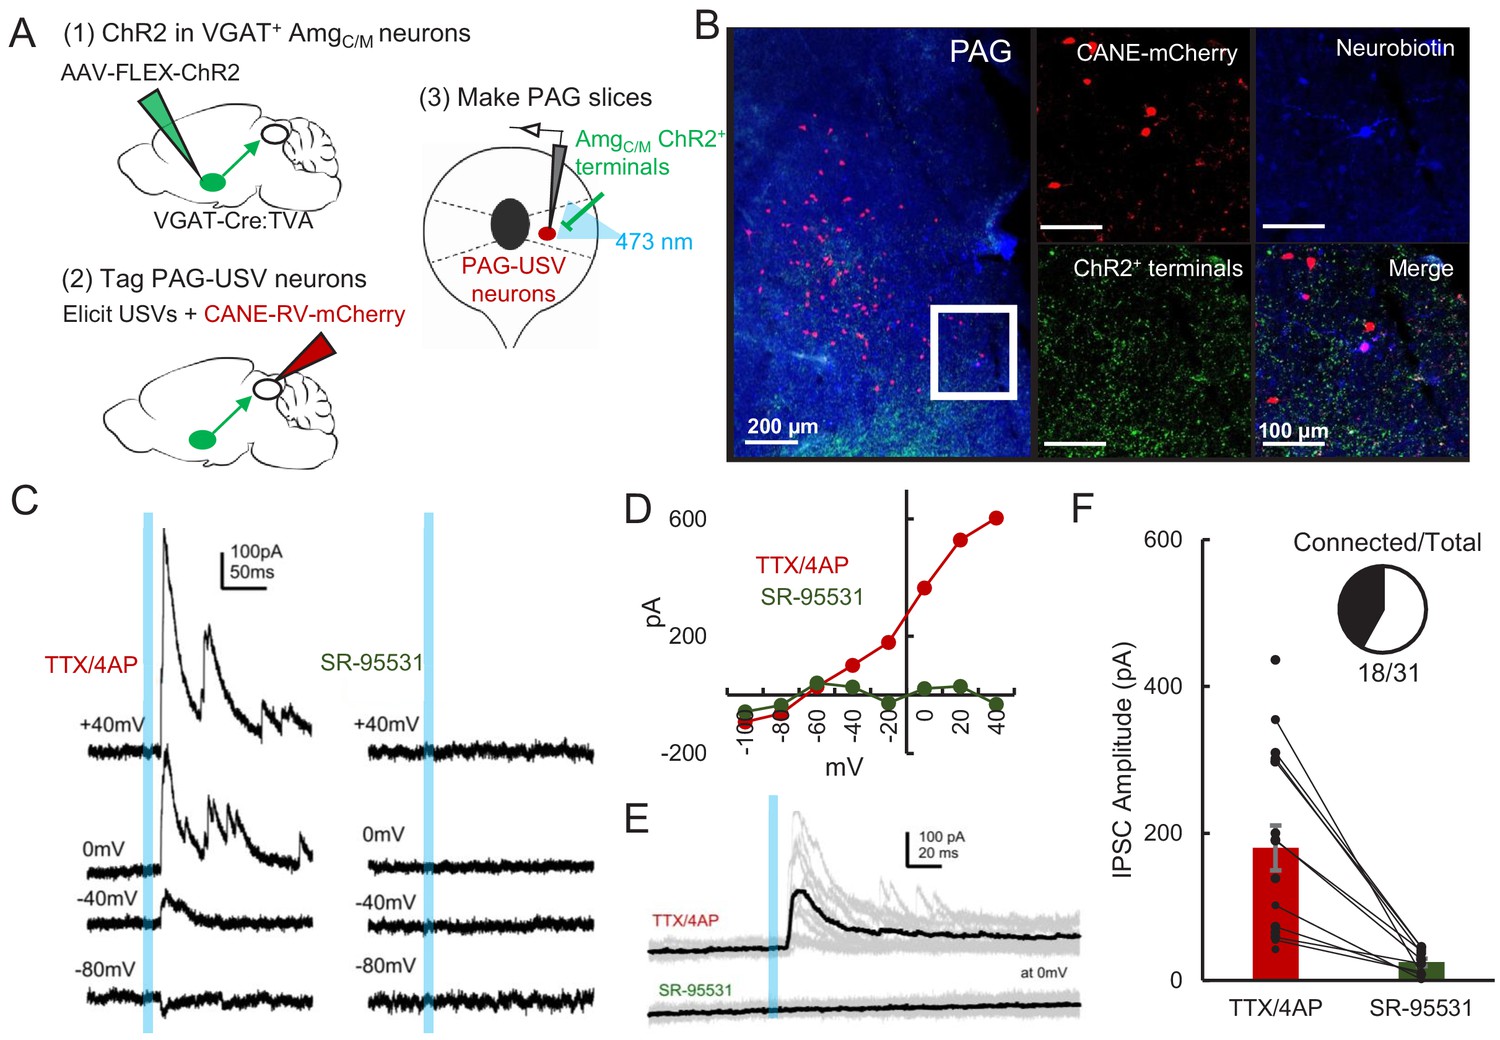
(A) Viral strategy (left) and schematic (right) for whole-cell patch clamp recordings from fluorescently identified CANE-tagged PAG-USV neurons while optogenetically activating AmgC/M-PAG axons. (B) Example image of overlap of neurobiotin and mCherry-labeled PAG-USV cells with ChR2-expressing AmgC/M-PAG axon terminals in the PAG. (C) Example of light-evoked IPSCs at different voltages from one PAG-USV cell recorded in TTX/4AP while stimulating AmgC/M-PAG axons (left). Inhibitory postsynaptic currents (IPSCs) were abolished by bath gabazine application (right). (D) The peak magnitude of light-evoked currents at different membrane voltages for the same cell as (C) shows that the current reverses around the reversal potential of chloride and is abolished by gabazine. Currents were identified as IPSCs in this manner based on their reversal behavior and, for a subset of cells, by disappearance in gabazine. (E,F) Light-evoked IPSCs recorded in TTX/4AP (observed in n = 16 of 29 CANE-tagged cells from nine mice) were abolished by application of gabazine (n = 10 cells also recorded in gabazine, N = 10 cells, p<0.001, paired t-test). IPSC amplitude refers to the peak of the light-evoked current at 0 mV holding potential. Error bars represent S.E.M. See also Figure 5—source data 1.
-
Figure 5—source data 1
Source data for Figure 5D and F.
- https://cdn.elifesciences.org/articles/63493/elife-63493-fig5-data1-v2.xlsx
Figure 6 with 1 supplement
POA neurons provide direct inhibition onto VGAT+ PAG neurons, which provide direct inhibition onto PAG-USV neurons.
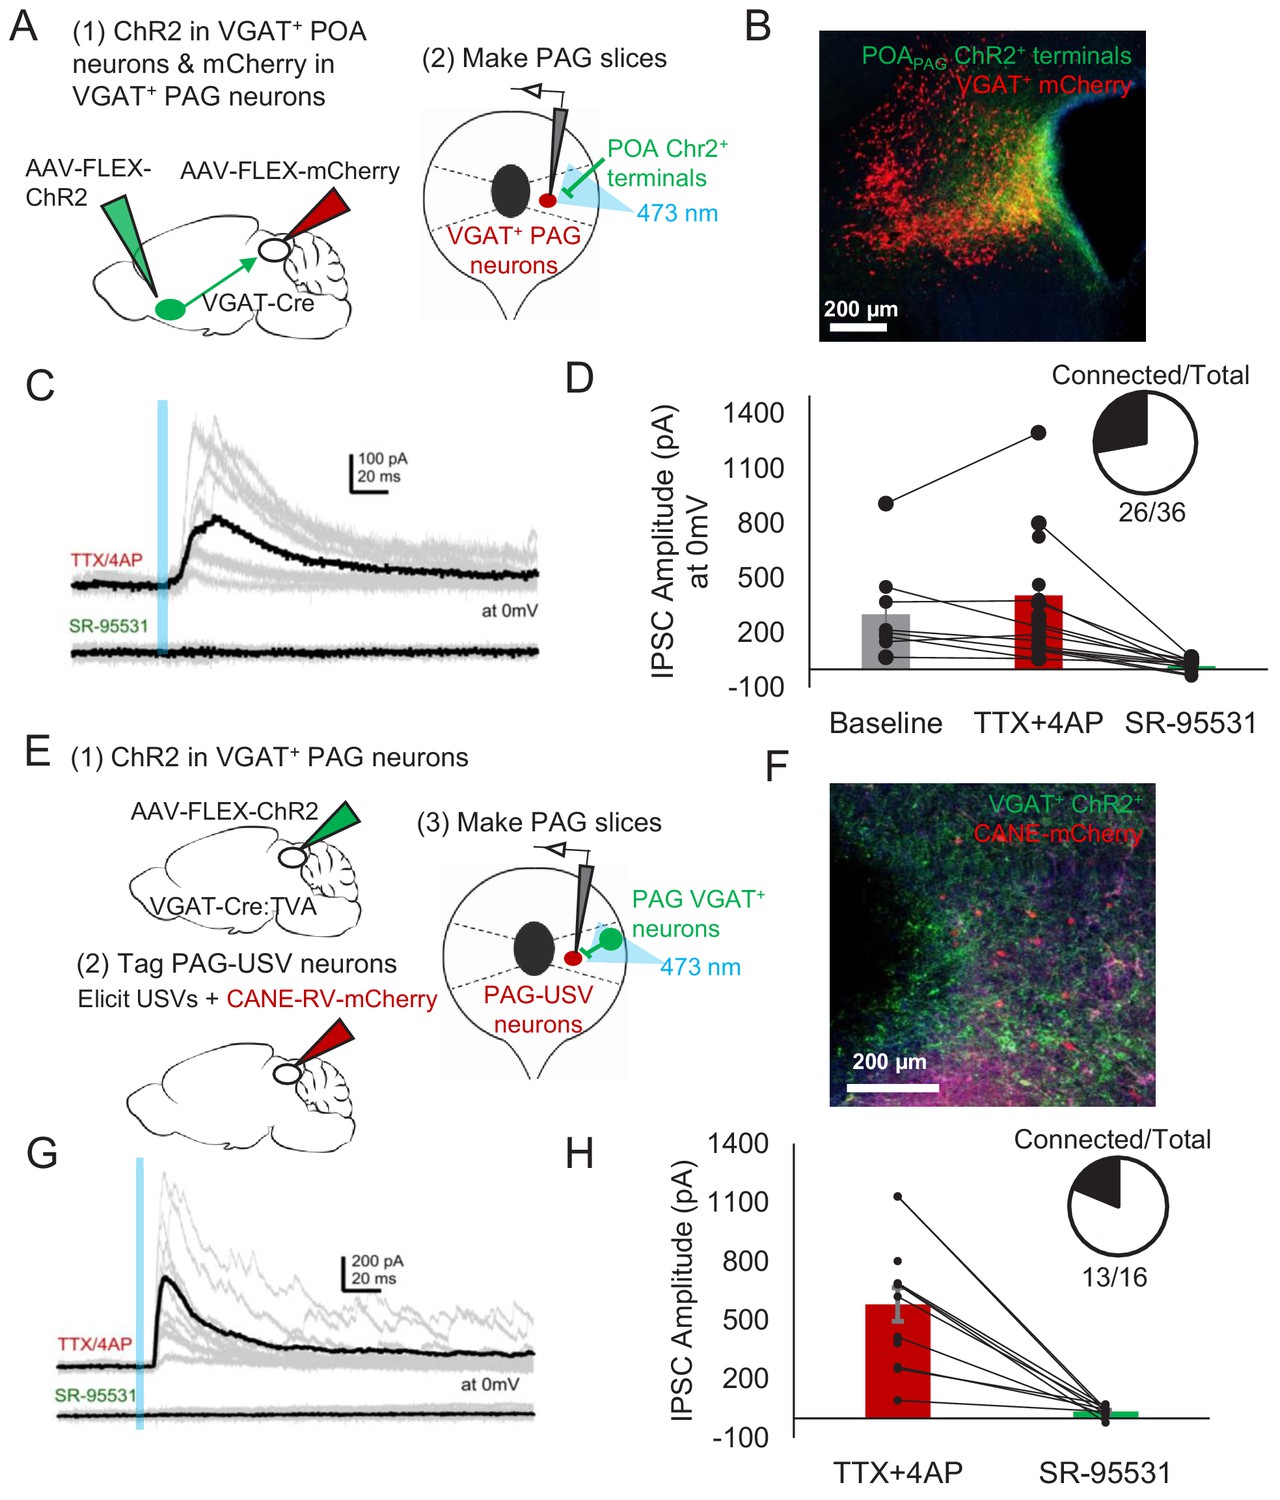
(A) Viral strategy (left) and schematic (right) for whole-cell patch clamp recordings from fluorescently identified VGAT+ PAG cells while optogenetically activating POAPAG axons. (B) Example image of mCherry-labeled VGAT+ neurons with ChR2-labeled POAPAG axon terminals in the PAG. (C, D) Light-evoked inhibitory postsynaptic currents (IPSCs; observed in n = 26 of 36 VGAT+ neurons recorded from 11 mice) persisted in TTX/4AP and were abolished by bath application of gabazine (n = 10 cells recorded at baseline, n = 22 cells recorded in TTX/4AP, and n = 13 cells also recorded in gabazine including the following pairs: 6 cells recorded in both baseline and TTX/4AP, 3 cells recorded in both baseline and gabazine, and 10 cells recorded in both TTX/4AP and gabazine, p=0.03, one-way ANOVA comparing baseline vs. TTX+4-AP vs. SR-95531, followed by a post-hoc t-test revealing a significant difference between TTX+4-AP vs. SR-95531, p<0.018). IPSC amplitude refers to the peak of the light-evoked current at 0 mV holding potential. Error bars represent S.E.M. (E) Viral strategy (left) and schematic (right) for whole-cell recordings from fluorescently identified CANE-tagged PAG-USV neurons while optogenetically activating local VGAT+ PAG neurons. (F) Example image of mCherry-labeled CANE-tagged PAG-USV neurons and ChR2-labeled VGAT+ PAG neurons. (G,H) Light-evoked IPSCs recorded in TTX/4AP (observed in n = 13 of 16 CANE-tagged cells from four mice) were abolished by gabazine application (N = 10 cells also recorded in gabazine, p<0.001, paired t-test). IPSC amplitude refers to the peak of the light-evoked current at 0 mV holding potential. Error bars represent S.E.M. See also Figure 6—figure supplement 1 and Figure 6—source data 1.
-
Figure 6—source data 1
Source data for Figure 6D and H.
- https://cdn.elifesciences.org/articles/63493/elife-63493-fig6-data1-v2.xlsx
Figure 6—figure supplement 1
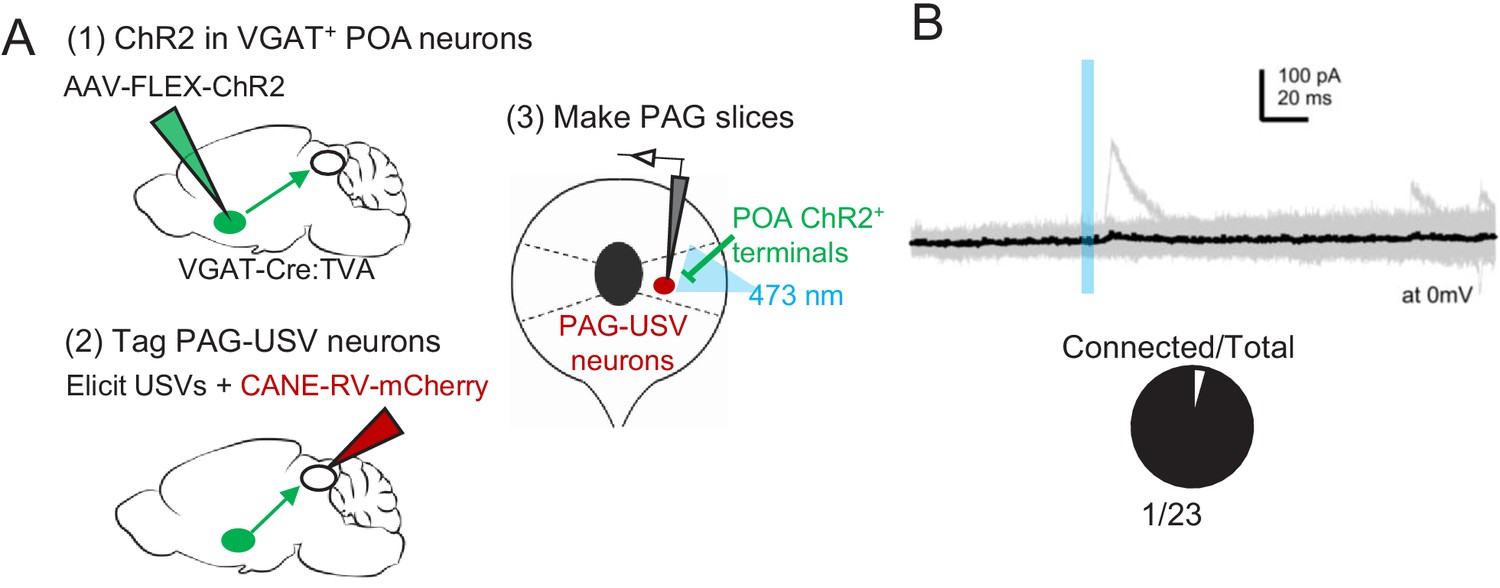
POA neurons provide direct inhibition onto few PAG-USV neurons.
(A) Viral strategy (left) and schematic (right) for whole-cell patch clamp recordings from fluorescently identified PAG-USV cells while optogenetically activating POAPAG axons. (B) Light-evoked inhibitory postsynaptic currents (IPSCs) were observed in 1 of 23 mCherry-labeled PAG-USV neurons recorded from seven mice. See also Figure 6—figure supplement 1—source data 1.
-
Figure 6—figure supplement 1—source data 1
Source data for panel B of Figure 6—figure supplement 1.
- https://cdn.elifesciences.org/articles/63493/elife-63493-fig6-figsupp1-data1-v2.xlsx
Figure 7
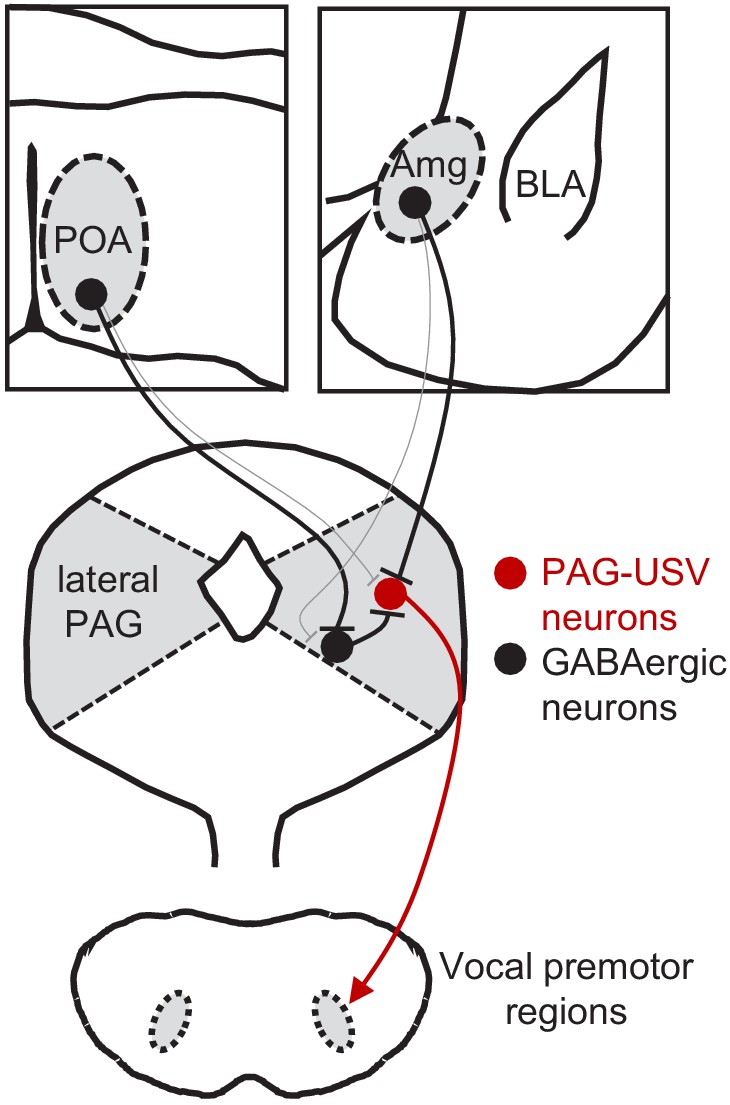
Model of bidirectional descending control of the periaqueductal gray (PAG) vocal gating circuit.
Inhibitory neurons within the POA provide direct input to inhibitory neurons within the PAG, which in turn provide direct input to PAG-USV neurons. In this manner, activation of POAPAG neurons disinhibits PAG-USV neurons, which provide excitatory input to downstream vocal premotor neurons and drive USV production. Conversely, inhibitory neurons within the AmgC/M provide direct inhibitory input to PAG-USV neurons. Hence activation of AmgC/M-PAG neurons reduces PAG-USV activity and transiently suppresses USV production.
Videos
Video 1
Optogenetic activation of POAPAG neurons elicits ultrasonic vocalizations (USVs).
An isolated male mouse is shown which has ChR2 is expressed in POAPAG neurons. Optogenetic activation of these neurons with pulses of blue light elicits USV production. Video is shown at the top, a spectrogram (bottom) showing the optogenetically elicited USVs is synchronized to the video, and pitch-shifted audio (80 kHz to 5 kHz transformation) is included to place the ultrasonic vocalizations (USVs) within the human hearing range.
Video 2
Optogenetic activation of AmgC/M-PAG neurons causes no obvious behavioral effects in the absence of a social partner.
An example male mouse with ChR2 expression in AmgC/M-PAG neurons is shown alone in a chamber with no social partner. Optogenetic activation of AmgC/M-PAG neurons with pulses of blue light does not elicit ultrasonic vocalization (USV) production or any other obvious behavioral response. Video is shown at the top, a spectrogram (bottom) showing the audio recording is synchronized to the video, and pitch-shifted audio (80 kHz to 5 kHz transformation) is included to place any USVs that may have occurred within the human hearing range.
Video 3
Optogenetic activation of AmgC/M-PAG neurons causes no obvious behavioral effects in the absence of a social partner.
An example male mouse with ChR2 expression in AmgC/M-PAG neurons is shown alone in a chamber with no social partner. Optogenetic activation of AmgC/M-PAG neurons with pulses of blue light does not elicit ultrasonic vocalization (USV) production or any other obvious behavioral response. Video is shown at the top, a spectrogram (bottom) showing the audio recording is synchronized to the video, and pitch-shifted audio (80 kHz to 5 kHz transformation) is included to place any USVs that may have occurred within the human hearing range.
Video 4
Optogenetic activation of AmgC/M-PAG neurons causes no obvious behavioral effects in the absence of a social partner.
An example male mouse with ChR2 expression in AmgC/M-PAG neurons is shown alone in a chamber with no social partner. Optogenetic activation of AmgC/M-PAG neurons with pulses of blue light does not elicit ultrasonic vocalization (USV) production or any other obvious behavioral response. Video is shown at the top, a spectrogram (bottom) showing the audio recording is synchronized to the video, and pitch-shifted audio (80 kHz to 5 kHz transformation) is included to place any USVs that may have occurred within the human hearing range.
Video 5
Optogenetic activation of AmgC/M-PAG neurons transiently suppresses ultrasonic vocalization (USV) production.
A male mouse which has ChR2 expressed in AmgC/M-PAG neurons is shown interacting with and producing USVs directed at a female social partner. Optogenetic activation of these neurons with pulses of blue light transiently suppresses USV production without suppressing non-vocal courtship behavior. Video is shown at the top, a spectrogram (bottom) showing the optogenetically elicited USVs is synchronized to the video, and pitch-shifted audio (80 kHz to 5 kHz transformation) is included to place the USVs within the human hearing range.
Tables
Key resources table
| Reagent type (species) or resource | Designation | Source or reference | Identifiers | Additional information |
|---|---|---|---|---|
| Strain, strain background (Mus musculus, C57BL/6J) | C57 | Jackson Labs | RRID:IMSR_JAX:000664 | |
| Strain, strain background (Mus musculus, B6N.129S6(Cg)-Esr1tm1.1(cre)And/J) | Esr1-Cre | Jackson Labs | RRID:IMSR_JAX:017911 | |
| Strain, strain background (Mus musculus, B6J.129S6(FVB)-Slc32a1tm2(cre)Lowl/ MwarJ) | VGAT-Cre | Jackson Labs | RRID:IMSR_JAX:016962 | |
| Strain, strain background (Mus musculus, B6;129S6-Gt(ROSA)26Sortim14(Cag-tdTomato)Hze/J) | Ai14 | Jackson Labs | RRID:IMSR_JAX:007908 | |
| Strain, strain background (Mus musculus, B6;129-Fostm1.1Fawa/J) | Fos-dsTVA | Jackson Labs | RRID:IMSR_JAX:027831 | |
| Recombinant DNA reagent | AAV2/1-hSyn-Flex-Chr2-eYFP | Addgene (K. Deisseroth) | RRID:Addgene_26973 | |
| Recombinant DNA reagent | AAV-pgk-retro-Cre | Addgene (P. Aebischer) | RRID:Addgene_24593 | |
| Recombinant DNA reagent | AAV2/1-pCAG-flex-GFP | Addgene (H. Zeng) | RRID:Addgene_51502 | |
| Recombinant DNA reagent | AAV2/1-pCAG-flex-Tdtomato | Addgene (H. Zeng) | RRID:Addgene_51503 | |
| Recombinant DNA reagent | AAV-flex-oG | Duke Viral Vector Core | ||
| Recombinant DNA reagent | EnvA-G-RV-GFP | Rodriguez et al., 2017 (DOI: 10.1038/s41593-017-0012-1), Sakurai et al., 2016 (DOI: 10.1016/j.neuron.2016.10.015) | ||
| Recombinant DNA reagent | CANE-RV-mCherry | Rodriguez et al., 2017 (DOI: 10.1038/s41593-017-0012-1), Sakurai et al., 2016 (DOI: 10.1016/j.neuron.2016.10.015) | ||
| Recombinant DNA reagent | AAV-flex-TVA-mCherry | Rodriguez et al., 2017 (DOI: 10.1038/s41593-017-0012-1), Sakurai et al., 2016 (DOI: 10.1016/j.neuron.2016.10.015) | ||
| Commercial assay or kit | HCR v3.0 | Molecular Instruments | ||
| Chemical compound, drug | Gabazine | Tocris | Cat# 1262 | (10 µM) |
| Chemical compound, drug | TTX | Tocris | Cat# 1069 | (2 µM) |
| Chemical compound, drug | 4AP | Sigma-Aldrich | Cat# 275875 | (100 µM) |
| Software, algorithm | MATLAB | Mathworks | RRID:SCR_001622 | |
| Software, algorithm | ImageJ | NIH | RRID:SCR_003070 | |
| Software, algorithm | ZEN | Zeiss | RRID:SCR_013672 | |
| Software, algorithm | Spike7 | CED | RRID:SCR_000903 | |
| Software, algorithm | pClamp | Molecular Devices | RRID:SCR_011323 | |
| Software, algorithm | IGOR Pro | WaveMetrics | RRID:SCR_000325 | |
| Other | NeuroTrace 435/455 | Invitrogen/Thermo Fischer Scientific | Cat# N21479 | (1:500) |
Additional files
Download links
A two-part list of links to download the article, or parts of the article, in various formats.
Downloads (link to download the article as PDF)
Open citations (links to open the citations from this article in various online reference manager services)
Cite this article (links to download the citations from this article in formats compatible with various reference manager tools)
Circuit and synaptic organization of forebrain-to-midbrain pathways that promote and suppress vocalization
eLife 9:e63493.
https://doi.org/10.7554/eLife.63493


