Activation of MAP3K DLK and LZK in Purkinje cells causes rapid and slow degeneration depending on signaling strength
- Neurobiology Section, Division of Biological Sciences, University of California San Diego, United States
- Department of Neurosciences, School of Medicine, University of California San Diego, United States
- VA San Diego Healthcare System, United States
- Kavli Institute of Brain and Mind, University of California San Diego, United States
Figures
Figure 1 with 1 supplement
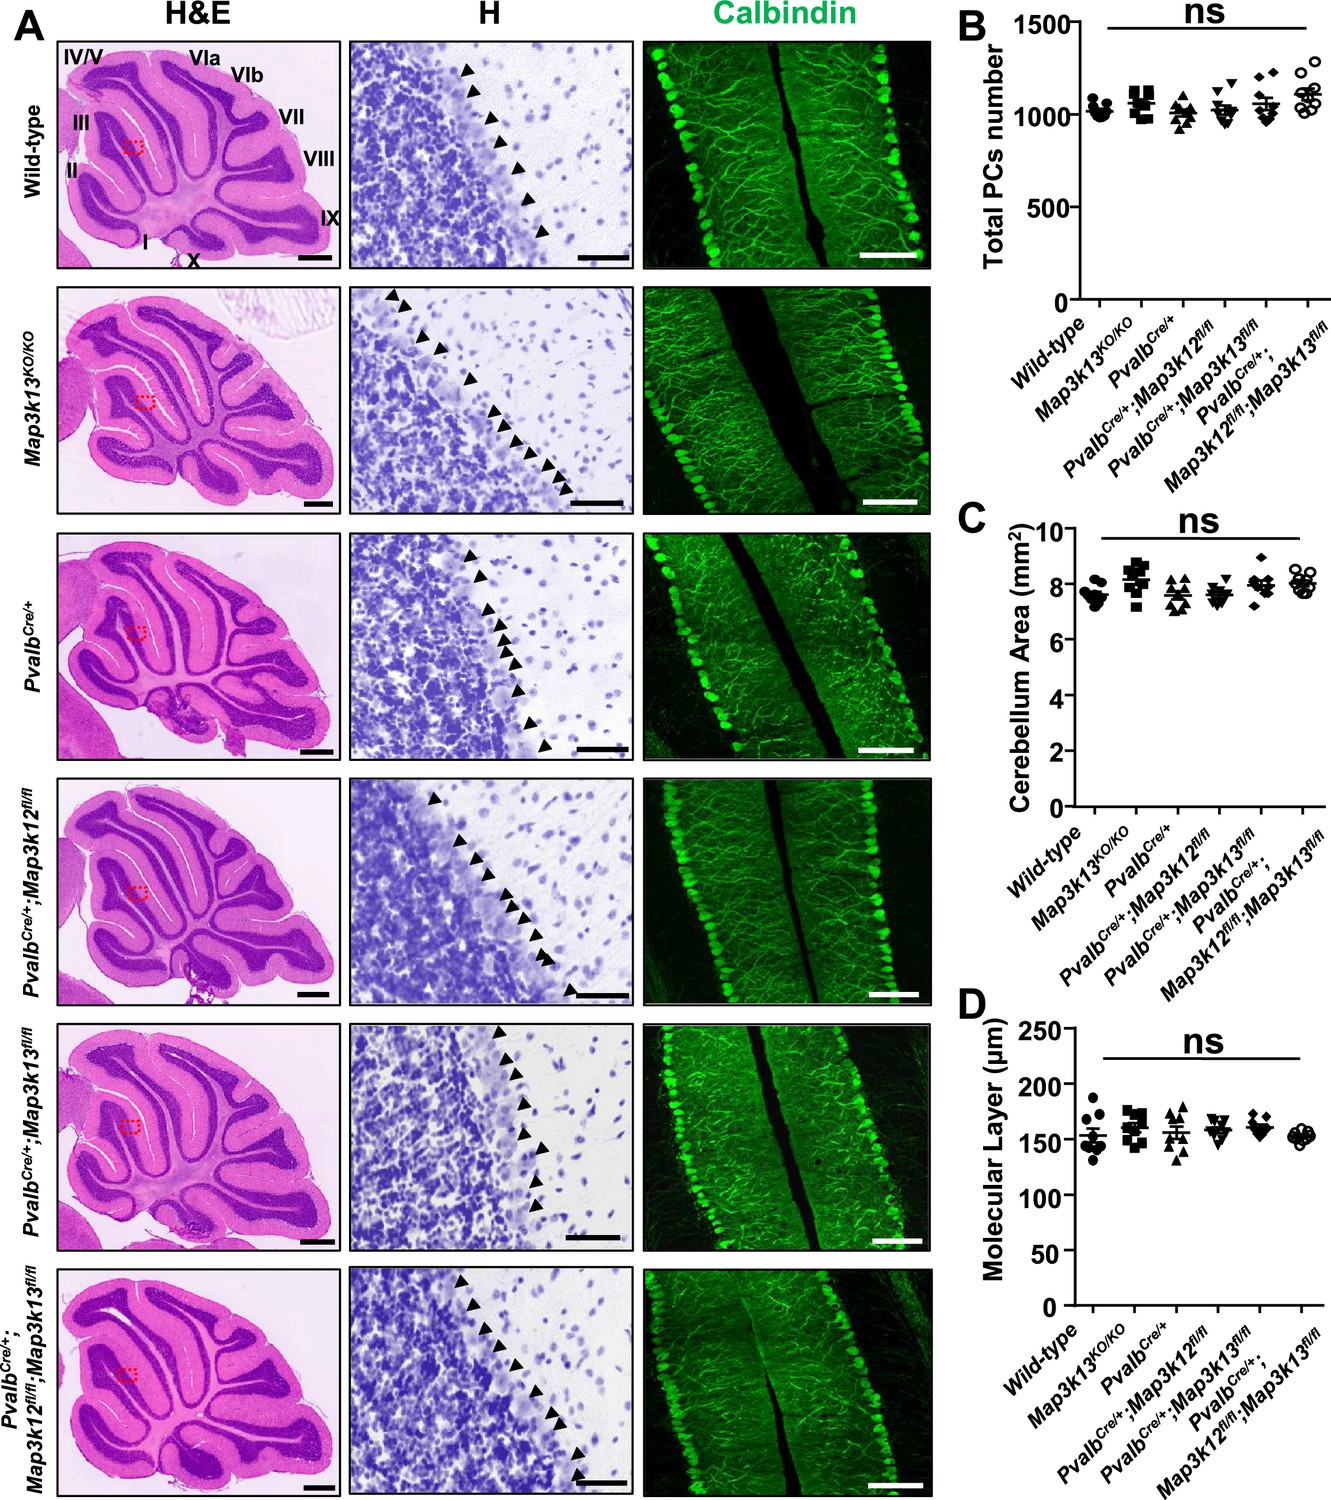
Morphology of cerebellar Purkinje cells is normal in the absence of LZK and DLK.
(A) Histological and immunostaining images of cerebellar sections of P60 mice of genotypes indicated, stained with hematoxylin and eosin (left panel), hematoxylin (enlarged red boxed areas, middle panel) and Calbindin (right panel). Map3k12 synonyms for DLK, Map3k13 for LZK. Roman letters mark corresponding lobules in the vermis of the cerebellum. Arrows point to the Purkinje cell bodies. Scale bars: 500 μm (left panel), 50 μm (middle panel), 100 μm (right panel). (B) Quantification of total number of Purkinje cells in all cerebellar lobules. (C) Quantification of cerebellum area, with perimeters measured by outlining the outer edge of midline sagittal sections of the cerebella. (D) Quantification of the molecular layer thickness in cerebellar lobules V-VI. (B–D) n = 3 animals per genotype, and three sections/animal; data shown as means ± SEM. Statistics: one-way ANOVA; ns. no significant.
-
Figure 1—source data 1
Total number of Purkinje cells in all cerebellar lobules of P60 mice of genotypes indicated.
- https://cdn.elifesciences.org/articles/63509/elife-63509-fig1-data1-v3.xlsx
-
Figure 1—source data 2
Cerebellum area of P60 mice of genotypes indicated.
- https://cdn.elifesciences.org/articles/63509/elife-63509-fig1-data2-v3.xlsx
-
Figure 1—source data 3
Molecular layer thickness in cerebellar lobules V-VI of P60 mice of genotypes indicated.
- https://cdn.elifesciences.org/articles/63509/elife-63509-fig1-data3-v3.xlsx
Figure 1—figure supplement 1
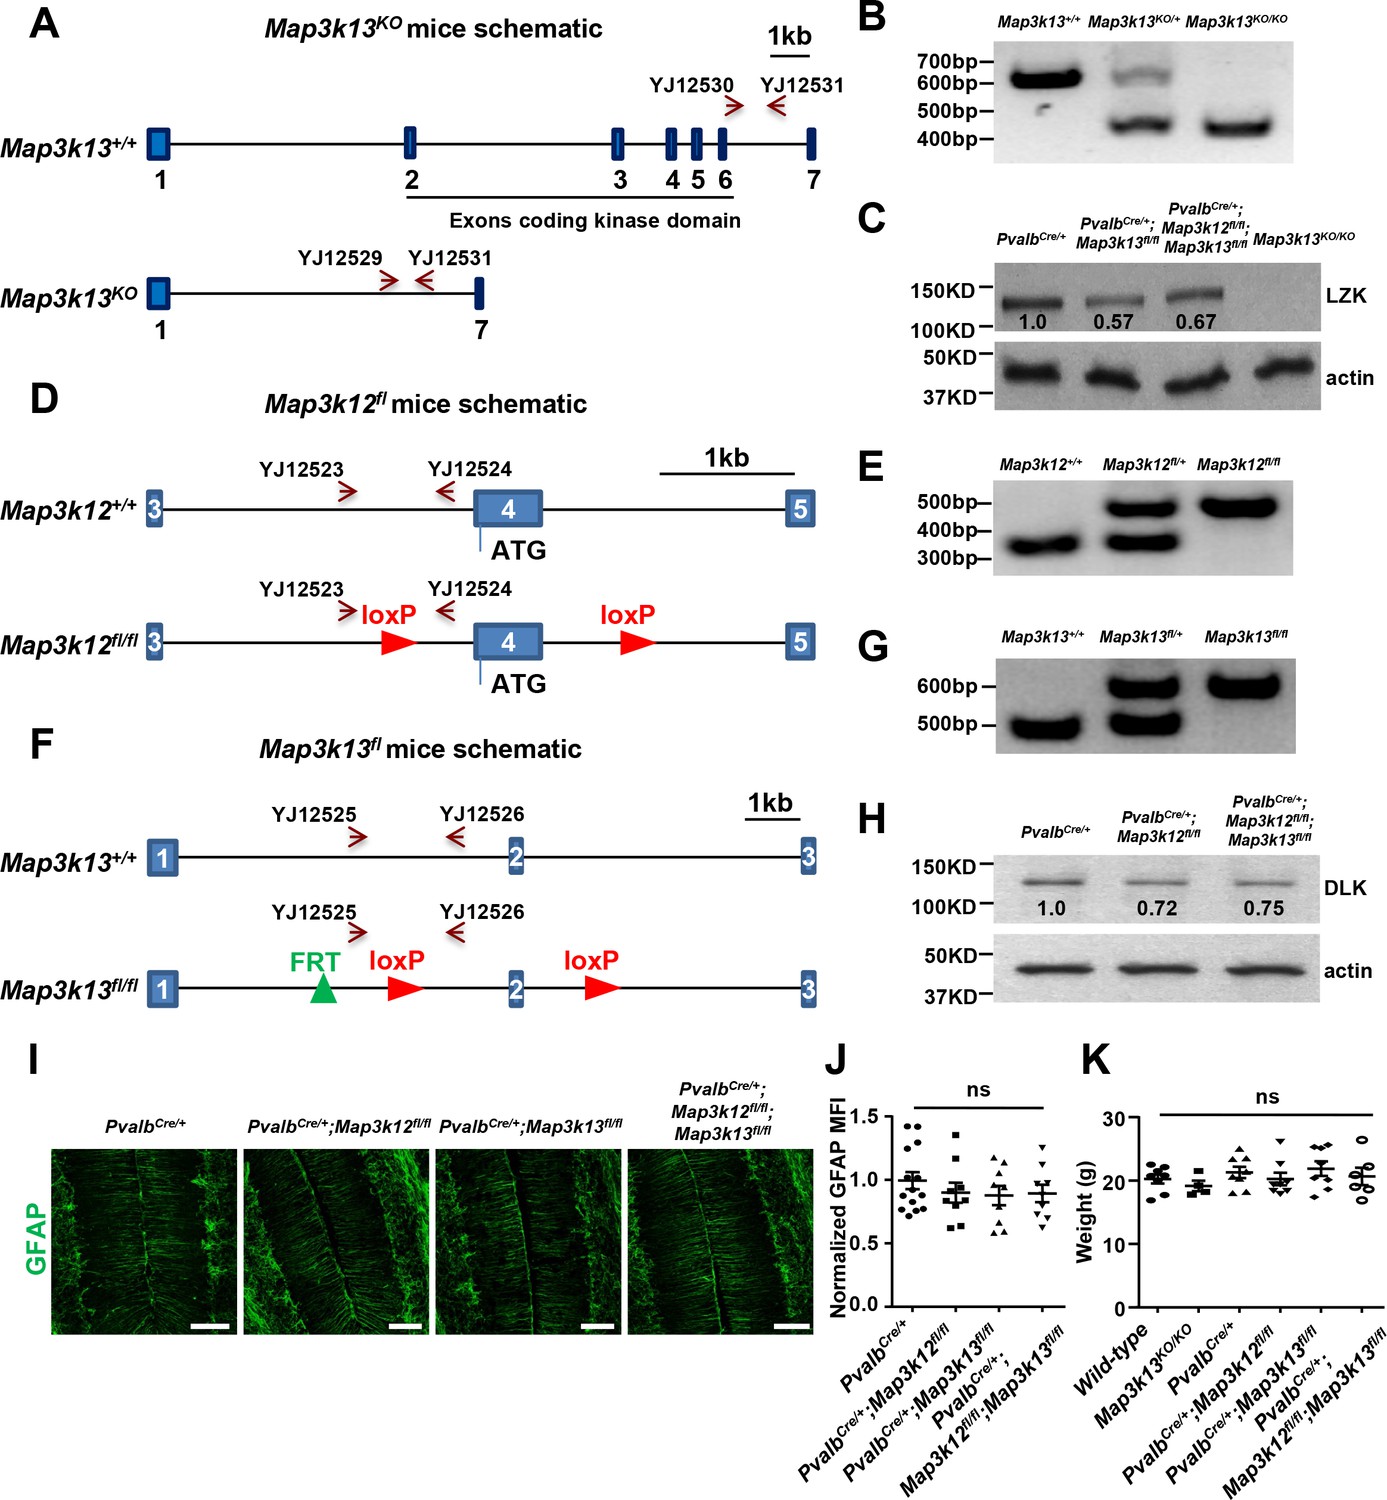
Knockout mice lines and associated evidence.
(A) Map3k13 KO mice were generated by CRISPR-Cas9 technology using three sgRNAs targeted to the kinase domain of LZK. Scale bar: 1 kb. (B) The homozygotes or heterozygotes of Map3k13KO were identified by PCR using primers YJ12529-12531. (C) The LZK protein levels in cerebellum of P60 mice of genotypes indicated were determined by immunoprecipitation and western blot. (D) Map3k12fl/fl mice have loxP sites flanking the exon 4 that contains the initiation ATG codon, and Cre-mediated excision results in knockout of DLK. Scale bar: 1 kb. (E) The homozygotes or heterozygotes of Map3k12fl were identified by PCR using primers YJ12523 and YJ12524. (F) Map3k13fl/fl mice have loxP sites flanking exon 2, and Cre-mediated excision results in frameshift, hence knockout of LZK. Scale bar: 1 kb. (G) The homozygotes or heterozygotes of Map3k13fl were identified by PCR using primers YJ12525 and YJ12526. (H) The DLK protein levels in cerebellum of P60 mice of genotypes indicated were determined by western blot. (I) Representative images of GFAP staining of cerebellar astrocytes from P60 mice of genotypes indicated. Scale bars: 100 μm. (J) GFAP staining intensity is quantified and normalized to PvalbCre/+ in cerebellum of P60 mice. PvalbCre/+: n = 5 animals, three sections/animal; PvalbCre/+;Map3k12fl/fl, PvalbCre/+;Map3k13fl/fl and PvalbCre/+;Map3k12fl/fl;Map3k13fl/fl: n = 3 animals, three sections/animal. MFI: mean of fluorescence intensity. (K) Quantification of the body weight of P60 mice of genotypes indicated. Wild-type: n = 8; Map3k13KO/KO: n = 4; PvalbCre/+: n = 8; PvalbCre/+;Map3k12fl/fl: n = 8; PvalbCre/+;Map3k13fl/fl: n = 8; PvalbCre/+;Map3k12fl/fl;Map3k13fl/fl: n = 6. (J, K) Data shown are means ± SEM; Statistics: one-way ANOVA; ns. no significant.
Figure 2 with 2 supplements
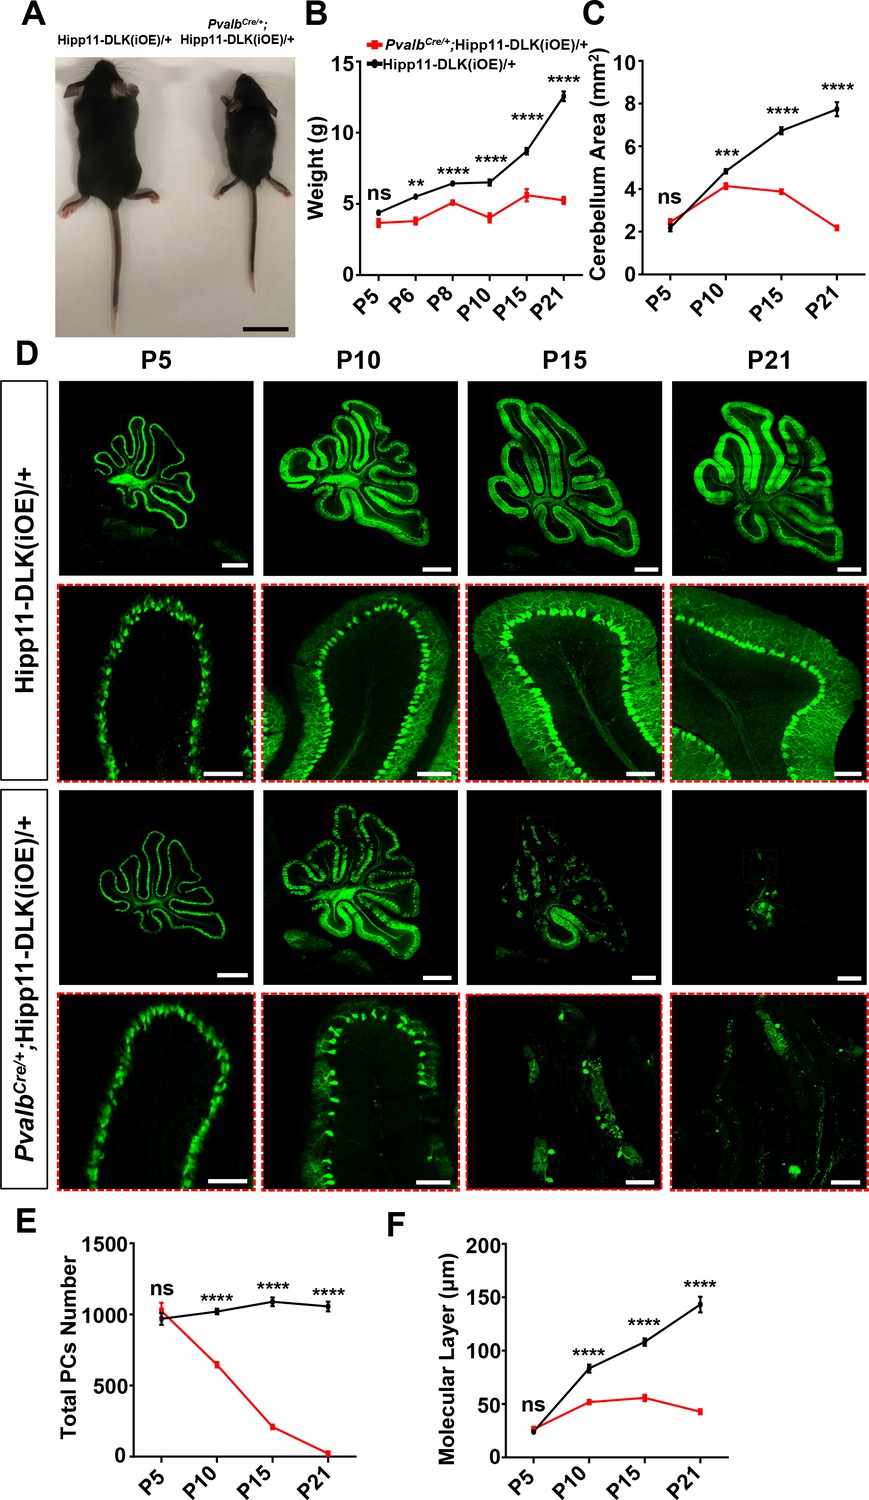
Induced expression of DLK using parvalbumin-cre (PvalbCre/+) causes animal growth defects and rapid degeneration of Purkinje cells.
(A) Representative image of P21 pups of genotypes indicated, and pups with induced DLK expression in PV+ neurons are smaller than siblings. Scale bar: 2 cm. (B) Quantification of the body weight from P5 to P21. Hipp11-DLK(iOE)/+: n = 3 (P5), n = 3 (P6), n = 4 (P8), n = 12 (P10), n = 8 (P15) and n = 10 (P21); PvalbCre/+;Hipp11-DLK(iOE)/+: n = 5 (P5), n = 6 (P6), n = 4 (P8), n = 11 (P10), n = 9 (P15) and n = 10 (P21). (C) Quantification of the cerebellum area from P5 to P21. (D) Representative images of Calbindin staining of cerebellar sections of littermates from mating parents PvalbCre/+ to Hipp11-DLK(iOE)/+ at indicated postnatal days. Red boxes are enlarged to show that induced expression of DLK causes a total loss of Purkinje cells by P21. Scale bars: 500 μm (upper panels), 100 μm (lower panels). (E) Quantification of total number of Purkinje cells in all cerebellar lobules. (F) Quantification of the molecular layer thickness in cerebellar lobules V-VI. Color representation for genotypes in C, E, and F is the same as in B. (C, E, F) n = 3 animals per genotype, three sections/animal for each time point. (B–C, E–F) Data shown as means ± SEM. Statistics: Student’s unpaired t-test; ns, no significant; **, p<0.01; ***, p<0.001; ****, p<0.0001.
-
Figure 2—source data 1
Mouse body weight of genotypes indicated from P5 to P21.
- https://cdn.elifesciences.org/articles/63509/elife-63509-fig2-data1-v3.xlsx
-
Figure 2—source data 2
Mouse cerebellum area of genotypes indicated from P5 to P21.
- https://cdn.elifesciences.org/articles/63509/elife-63509-fig2-data2-v3.xlsx
-
Figure 2—source data 3
Total number of Purkinje cells in all cerebellar lobules of mice genotypes indicated from P5 to P21.
- https://cdn.elifesciences.org/articles/63509/elife-63509-fig2-data3-v3.xlsx
-
Figure 2—source data 4
Molecular layer thickness in cerebellar lobules V-VI of mice genotypes indicated from P5 to P21.
- https://cdn.elifesciences.org/articles/63509/elife-63509-fig2-data4-v3.xlsx
Figure 2—figure supplement 1
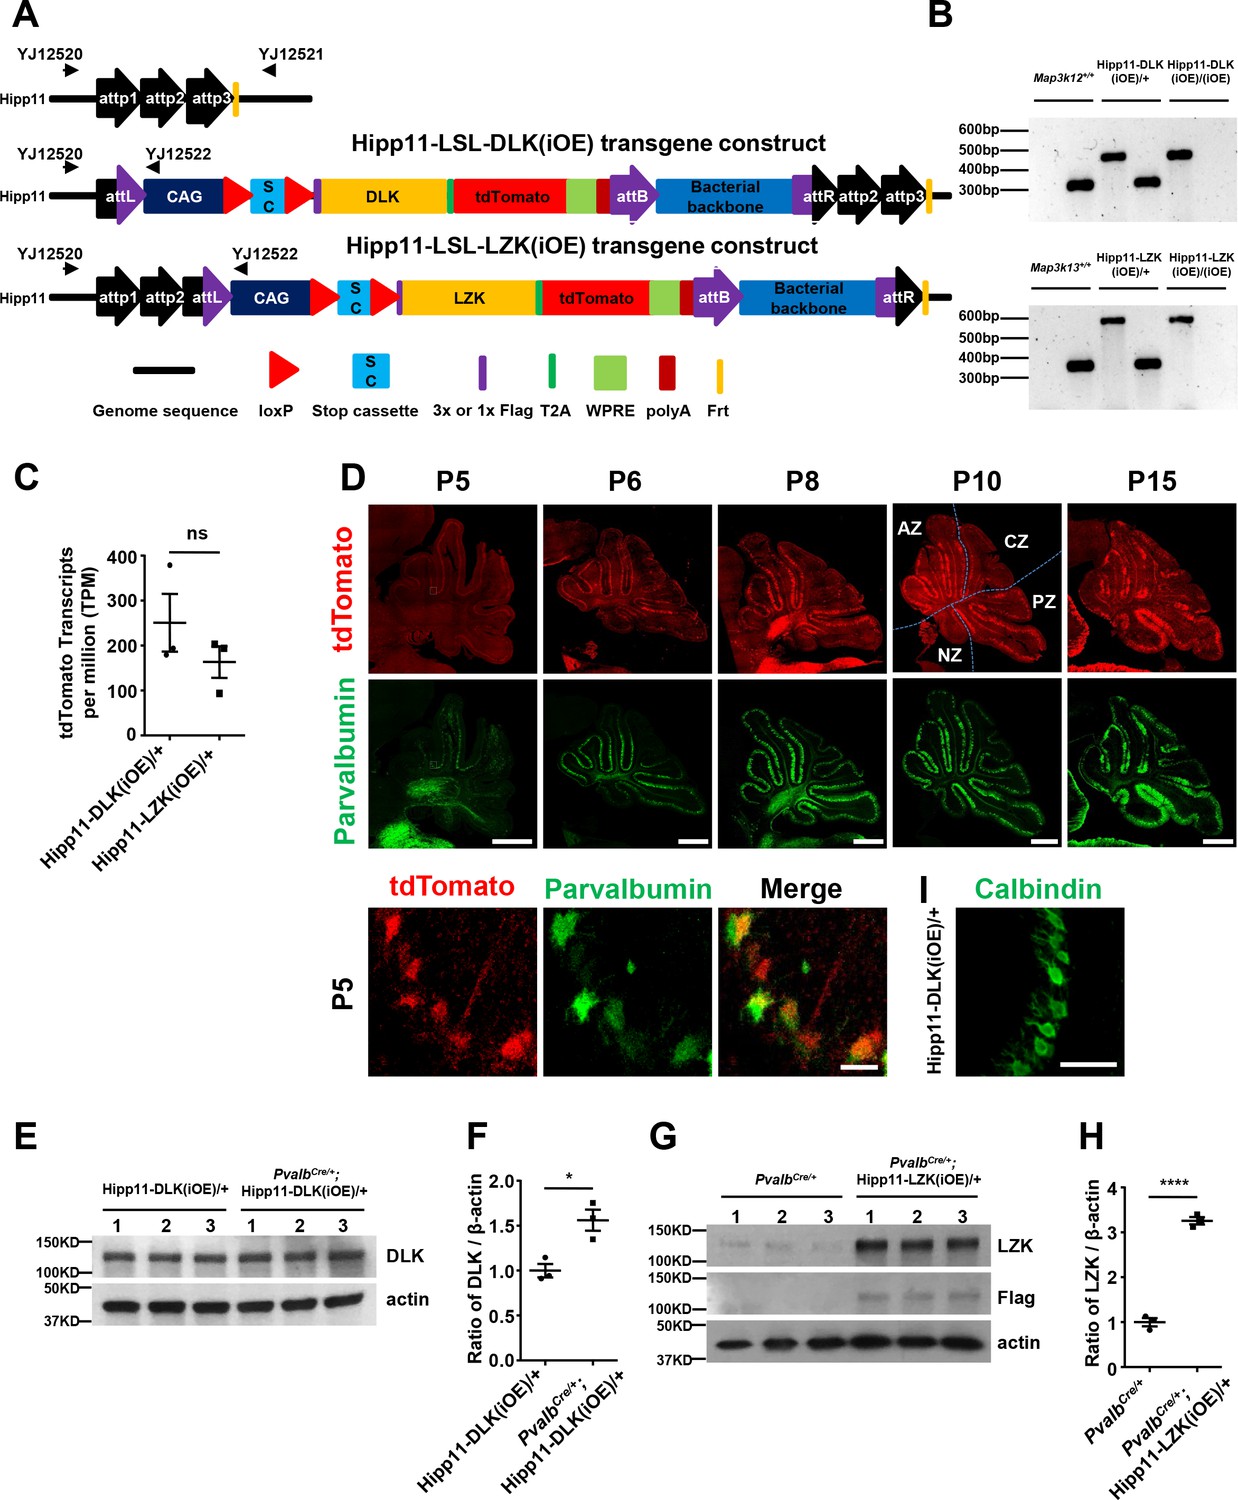
Cre-dependent DLK and LZK expression transgenic mice and associated evidence.
(A) Illustration of Cre-dependent expression of Hipp11-DLK(iOE) and Hipp11-LZK(iOE) transgenic mice, generated following the protocol described previously (Tasic et al., 2011). (B) PCR genotyping for Hipp11-DLK(iOE) and Hipp11-LZK(iOE) using primers YJ12520-12522. (C) Graph shows mRNA levels of tdTomato obtained from RNA-sequencing of cerebellum from P15 mice of Hipp11-DLK(iOE)/+ and Hipp11-LZK(iOE)/+ that expressed Cre in glutamatergic neurons. Transcript per million (TPM) values represent tdTomato transcript counts normalized by gene length and sequencing depth; and statistically significance was based on differential expression analysis using DESeq2 galaxy version 2.11.40.2 (Love et al., 2014). (D) Representative images of cerebellar sections of PvalbCre/+;Hipp11-DLK(iOE)/+ mice showing tdTomato expression as induced from Hipp11-DLK(iOE)/+ and immunostained for parvalbumin for Cre at indicated postnatal days. The dotted lines in top panels mark the boundary of anterior zone (AZ; lobules I-V), central zone (CZ; lobules VI-VII), posterior zone (PZ; lobules VIII-XI), and nodular zone (NZ; lobule X) in cerebellum, note higher tdTomato intensity in anterior cerebellum. Enlarged white boxed areas show tdTomato and parvalbumin expression in Purkinje cells in PvalbCre/+;Hipp11-DLK(iOE)/+ at P5. Scale bars: 500 μm (upper and middle panels), 10 μm (lower panel). (E) The DLK protein levels in cerebellar extracts from P10 mice of genotypes indicated were determined by western blot. (F) Quantification of the ratio of DLK relative to β-actin protein levels. (G) The LZK protein levels in cerebellar extracts from P21 mice of genotypes indicated were determined by immunoprecipitation and western blot. (H) Quantification of the ratio of LZK relative to β-actin protein levels. (I) Representative image of Calbindin staining of cerebellar section of Hipp11-DLK(iOE)/+ at P5 shows individual Calbindin+ cells. (C, F, H) n = 3 animals per genotype; data shown are means ± SEM. Statistics: Student’s unpaired t-test; ns, no significant; *, p<0.05; ****, p<0.0001.
Figure 2—figure supplement 2
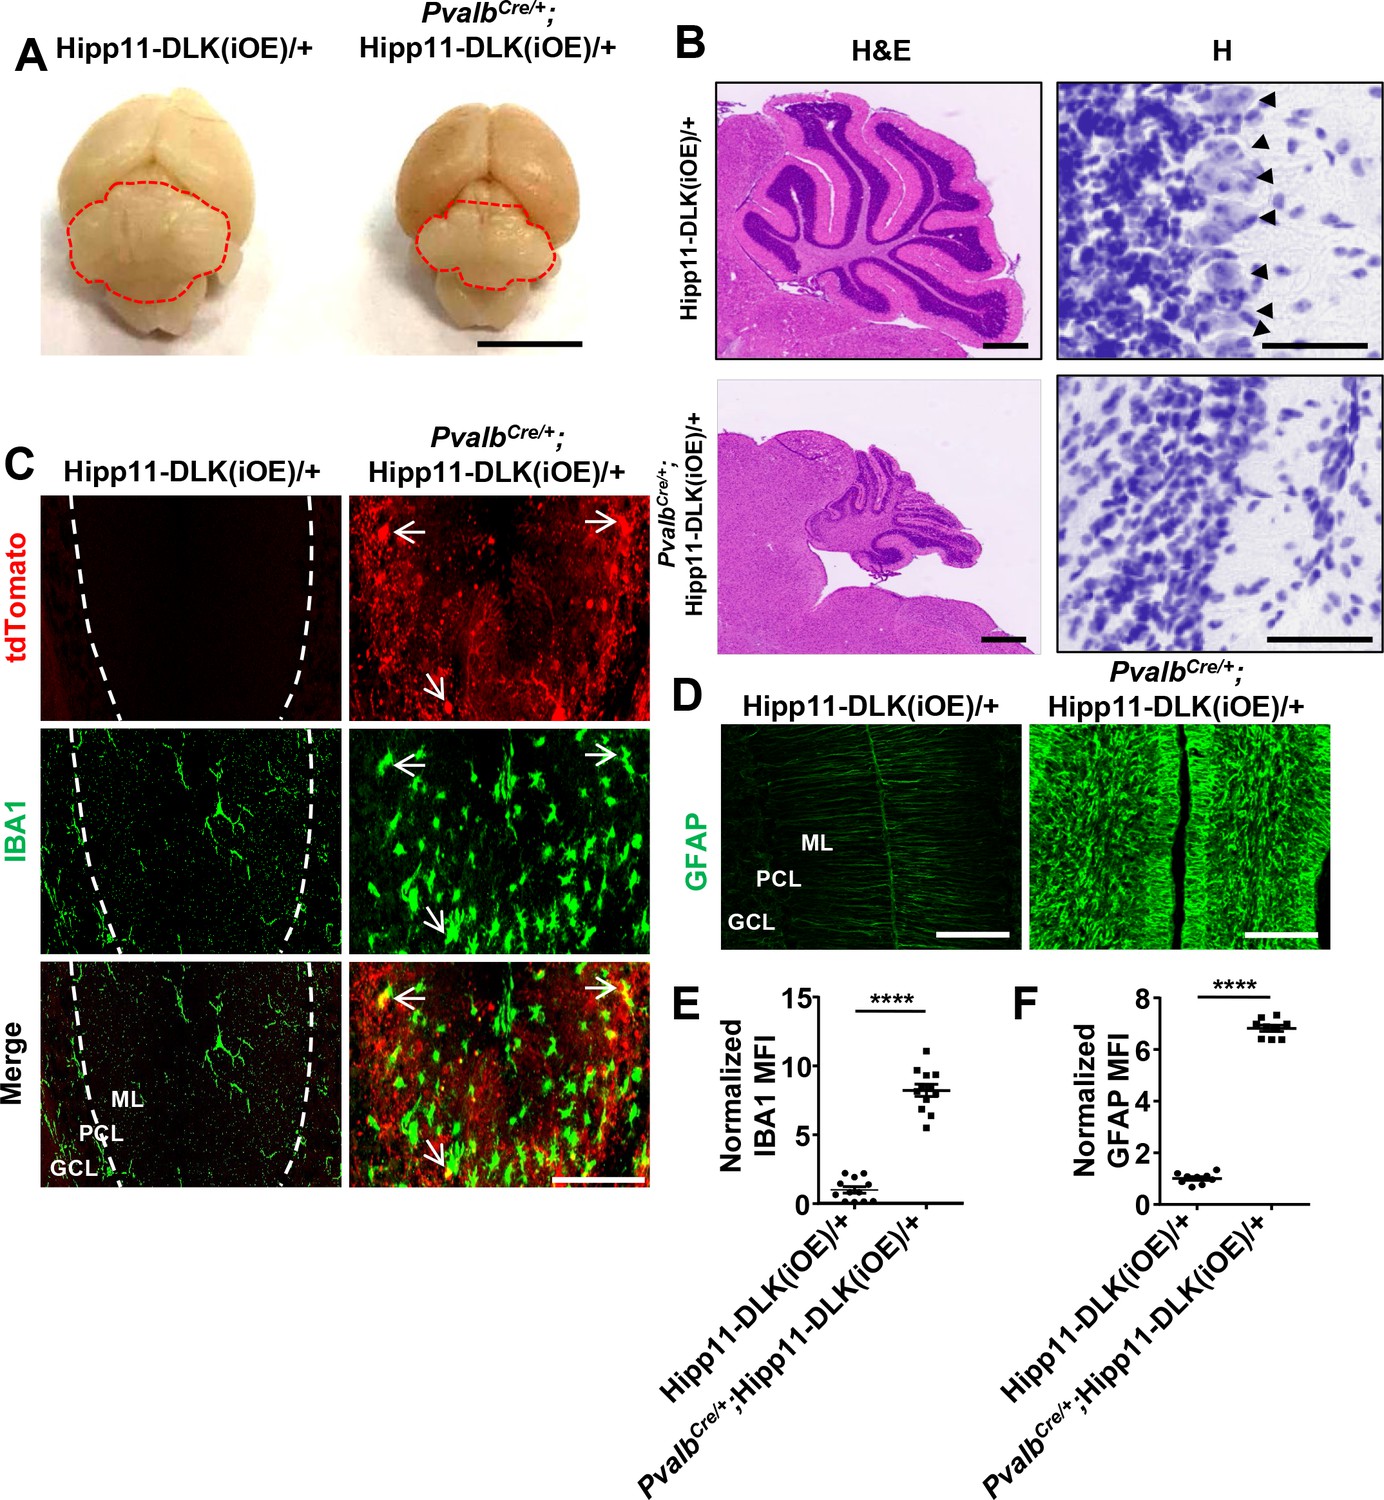
Additional evidence of Purkinje cell degeneration phenotypes caused by elevated DLK expression.
(A) Representative image of P21 brains of genotypes indicated. Cerebellum is outlined to show smaller size with induced DLK expression in PV+ neurons. Scale bar: 5 mm. (B) Representative images of hematoxylin and eosin (left panel), hematoxylin (enlarged red boxed areas, right panel) staining of cerebellar sections from P21 mice of genotypes indicated. Arrows point to the Purkinje cell bodies. Scale bars: 500 μm (left panel), 50 μm (right panel). (C) Representative images of cerebellar sections from P21 mice of genotypes indicated, immunostained for IBA1; and tdTomato reporter expression marks Purkinje cells. Arrows show close association between microglia and Purkinje cells. ML: Molecular Layer; PCL: Purkinje Cell Layer; GCL: Granule Cell Layer. Scale bars: 100 μm. (D) Representative images of cerebellar sections from P21 mice of genotypes indicated, immunostained for GFAP. (E–F) IBA1 and GFAP staining intensity are quantified and normalized to Hipp11-DLK(iOE)/+ in cerebellum of P21 mice. n = 3 animals per genotype, three sections/animal. Data shown are means ± SEM. Statistics: Student’s unpaired t-test; ****, p<0.0001.
Figure 3 with 4 supplements

Induced expression of DLK activates JNK signaling and apoptosis, and disrupts dendritic cytoskeleton of Purkinje cells.
(A) Representative images of co-immunostaining of p-c-Jun and Calbindin in Purkinje cells in P6 mice of genotypes indicated. Arrows point to p-c-Jun immunostaining signals in nuclei of Purkinje cells. Scale bar: 100 μm. (B) Quantification of percentage of p-c-Jun+ signals per total Purkinje cells in P6 mice of Hipp11-DLK(iOE)/+ and PvalbCre/+;Hipp11-DLK(iOE)/+. (C) Representative images of cerebellar lobule III of P15 mice, co-immunostained for Calbindin and cleaved caspase-3, with arrows and enlarged blue boxes showing cleaved caspase-3+ signals in the swollen dendrites of Purkinje cells of PvalbCre/+; Hipp11-DLK(iOE)/+ mice. Scale bars: 100 μm (left and middle panels), 50 μm (right panel). (D) Quantification of percentage of cleaved caspase-3+ cells in total Purkinje cells in P15 mice of Hipp11-DLK(iOE)/+ and PvalbCre/+;Hipp11-DLK(iOE)/+, and none detected in Hipp11-DLK(iOE)/+. (E) Quantification of percentage of Purkinje cells with swelling dendrites in mice of Hipp11-DLK(iOE)/+ and PvalbCre/+;Hipp11-DLK(iOE)/+ from P10 to P21, and none detected in Hipp11-DLK(iOE)/+. Hipp11-DLK(iOE)/+: n = 3 animals (P10, P15, P21), three sections/animal; PvalbCre/+;Hipp11-DLK(iOE)/+: n = 3 (P10, P21), n = 4 (P15) animals, three sections/animal. (F) Quantification of percentage of Purkinje cells containing cleaved caspase-3+ in swelling dendrites in total Purkinje cells in P15 mice of Hipp11-DLK(iOE)/+ and PvalbCre/+;Hipp11-DLK(iOE)/+. (G) Representative images of Purkinje cells of P15 mice co-immunostained for MAP2 and Calbindin. Swelling dendrites in Purkinje cells of PvalbCre/+;Hipp11-DLK(iOE)/+ mice have little expression of MAP2; arrows point to dendrites with intensity difference between the two genotypes. Scale bar: 50 μm. (H) Representative images of Purkinje cells of P15 mice co-immunostained for NF-200 and Calbindin, showing that induced DLK expression reduces NF-200 staining in dendrites (arrows) and axons (arrowheads) of Purkinje cells. Scale bar: 50 μm. (B, D, F) n = 3 animals per genotype, three sections/animal. (B, D, E, F) Data shown are means ± SEM. Statistics: Student’s unpaired t-test; ****, p<0.0001.
-
Figure 3—source data 1
Percentage of p-c-Jun+ Purkinje cells in total Purkinje cells in P6 mice of genotypes indicated.
- https://cdn.elifesciences.org/articles/63509/elife-63509-fig3-data1-v3.xlsx
-
Figure 3—source data 2
Percentage of cleaved caspase-3+ Purkinje cells in total Purkinje cells in P15 mice of genotypes indicated.
- https://cdn.elifesciences.org/articles/63509/elife-63509-fig3-data2-v3.xlsx
-
Figure 3—source data 3
Percentage of Purkinje cells with swelling dendrites in mice of genotypes indicated from P10 to P21.
- https://cdn.elifesciences.org/articles/63509/elife-63509-fig3-data3-v3.xlsx
-
Figure 3—source data 4
Percentage of Purkinje cells containing cleaved caspase-3+ in swelling dendrites in total Purkinje cells in P15 mice of genotypes indicated.
- https://cdn.elifesciences.org/articles/63509/elife-63509-fig3-data4-v3.xlsx
Figure 3—figure supplement 1
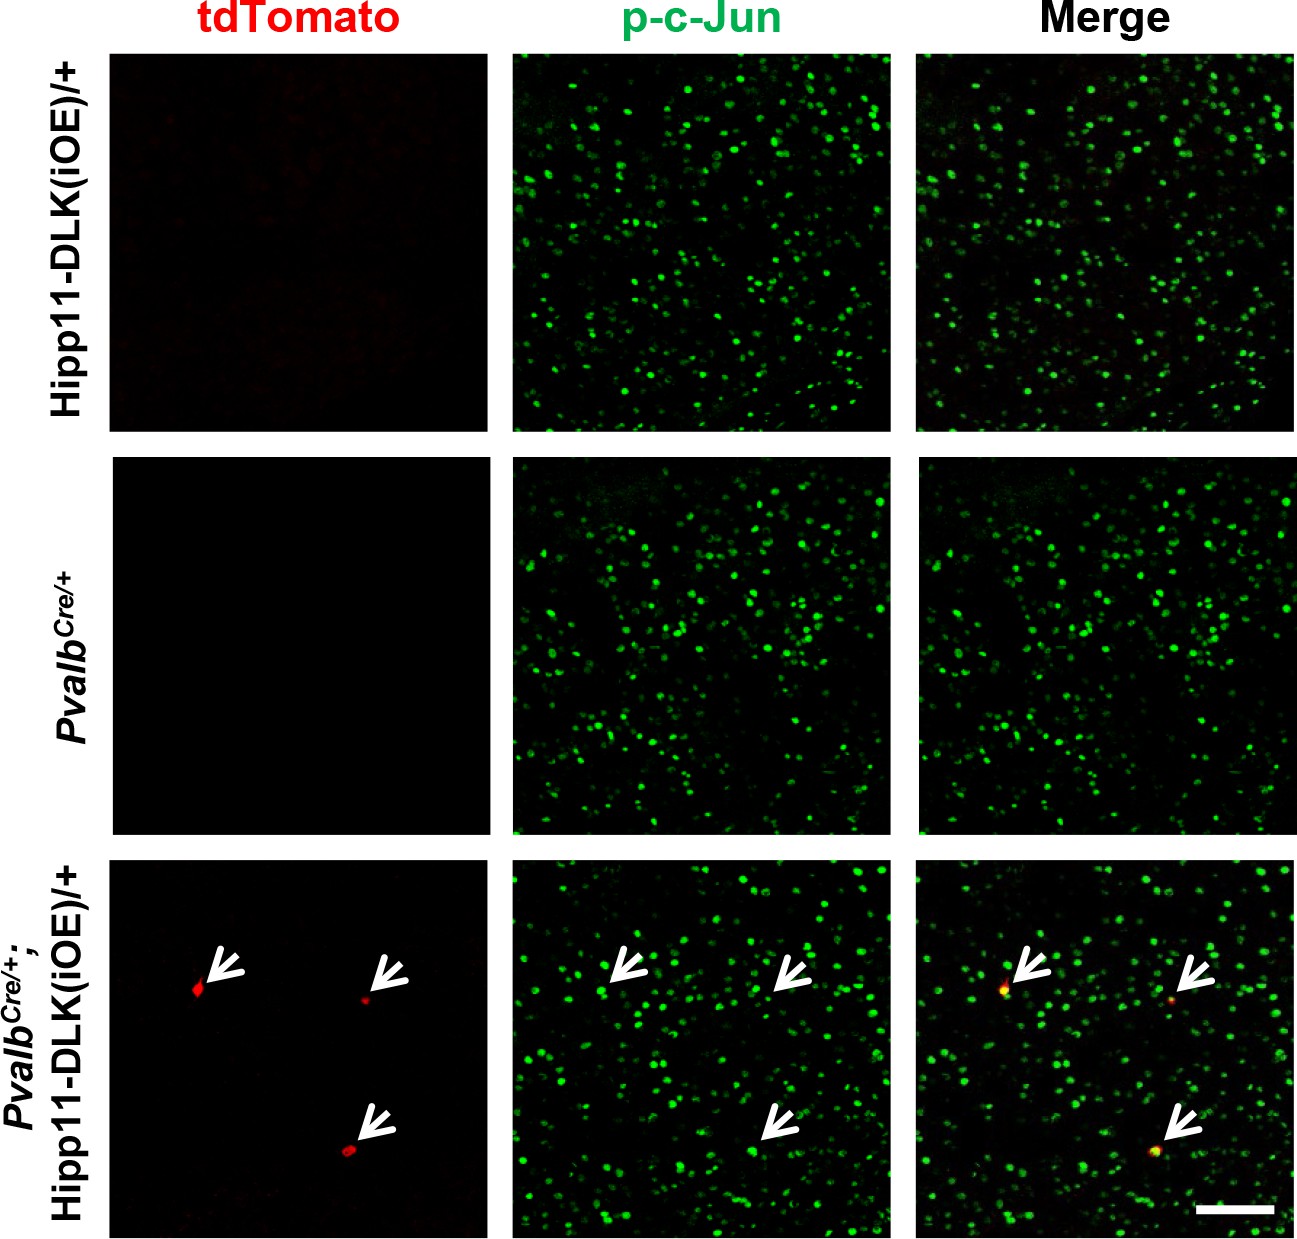
Additional evidence for p-c-Jun expression in cortex of PvalbCre/+;Hipp11-DLK(iOE)/+ mice.
Representative images of cortex of P15 mice of genotypes indicated, immunostained for p-c-Jun. Arrows point to the expression of p-c-Jun in tdTomato+ cells of PvalbCre/+;Hipp11-DLK(iOE)/+. Scale bar: 100 μm.
Figure 3—figure supplement 2
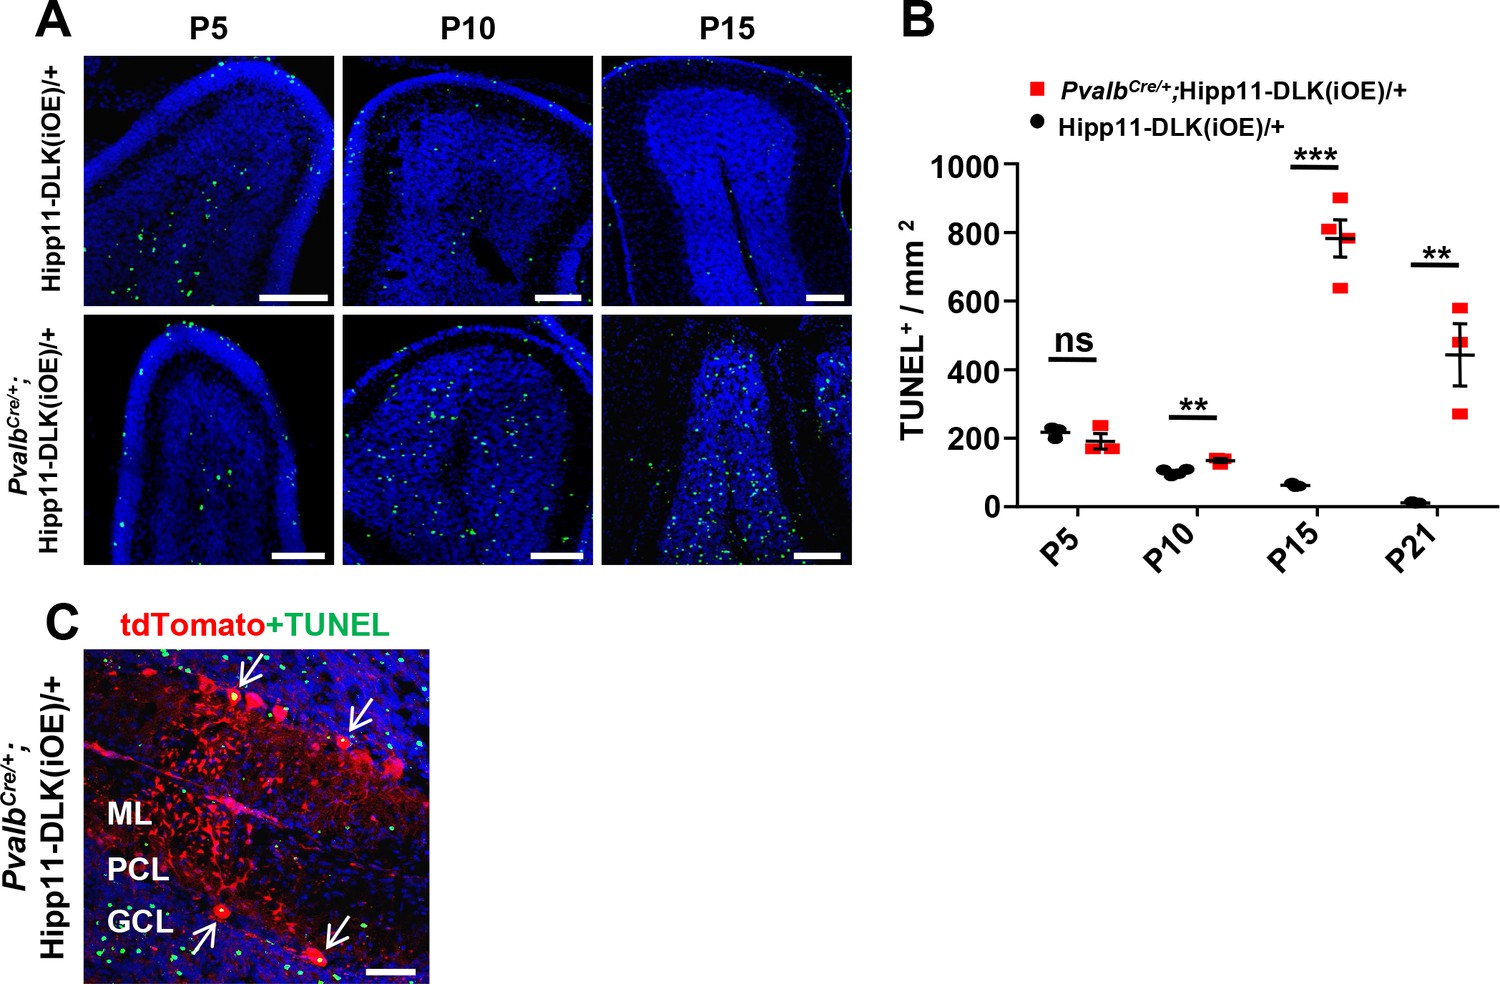
Additional evidence for apoptosis induced by elevated DLK expression.
(A) Representative images of cerebellar lobules of Hipp11-DLK(iOE)/+ and PvalbCre/+;Hipp11-DLK(iOE)/+ mice from P5 to P15, labeled with TUNEL fluorescence signal (fluorescein-12-dUTP). Scale bars: 100 μm. (B) Quantification of TUNEL+ cells density in cerebellum. Hipp11-DLK(iOE)/+: n = 3 (P5), n = 4 (P10), n = 3 (P15), n = 3 (P21); PvalbCre/+;Hipp11-DLK(iOE)/+: n = 3 (P5), n = 3 (P10), n = 4 (P15), n = 3 (P21). Data shown are means ± SEM. Statistics: Student’s unpaired t-test; ns, no significant; **, p<0.01; ***, p<0.001. (C) Representative image showed the co-localization of TUNEL signal with tdT+ Purkinje cells in P15 mice (arrows). ML: Molecular Layer; PCL: Purkinje Cell Layer; GCL: Granule Cell Layer. Scale bar: 50 μm.
Figure 3—figure supplement 3

DLK protein localization in Purkinje cells.
Representative images of cerebellar section of P10 mice immunostained for DLK; arrows show DLK distribution in Purkinje cells (arrows). ML: Molecular Layer; PCL: Purkinje Cell Layer; GCL: Granule Cell Layer. Scale bar: 100 μm.
Figure 3—figure supplement 4
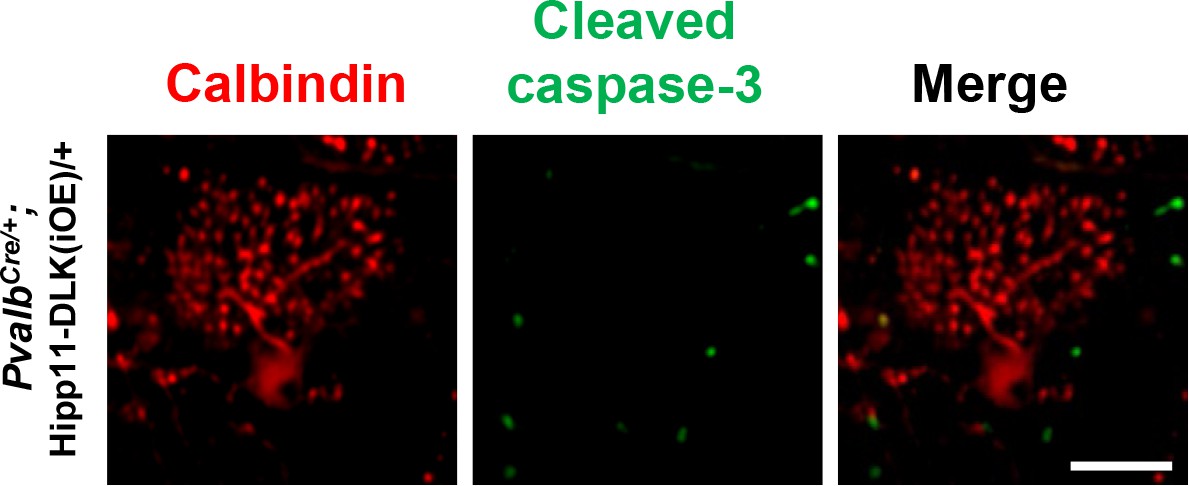
Additional images showing Purkinje cells that have dendrite swelling but are cleaved caspase-3- in PvalbCre/+;Hipp11-DLK(iOE)/+ mice at P15. Scale bar: 50 μm.
Figure 4 with 3 supplements
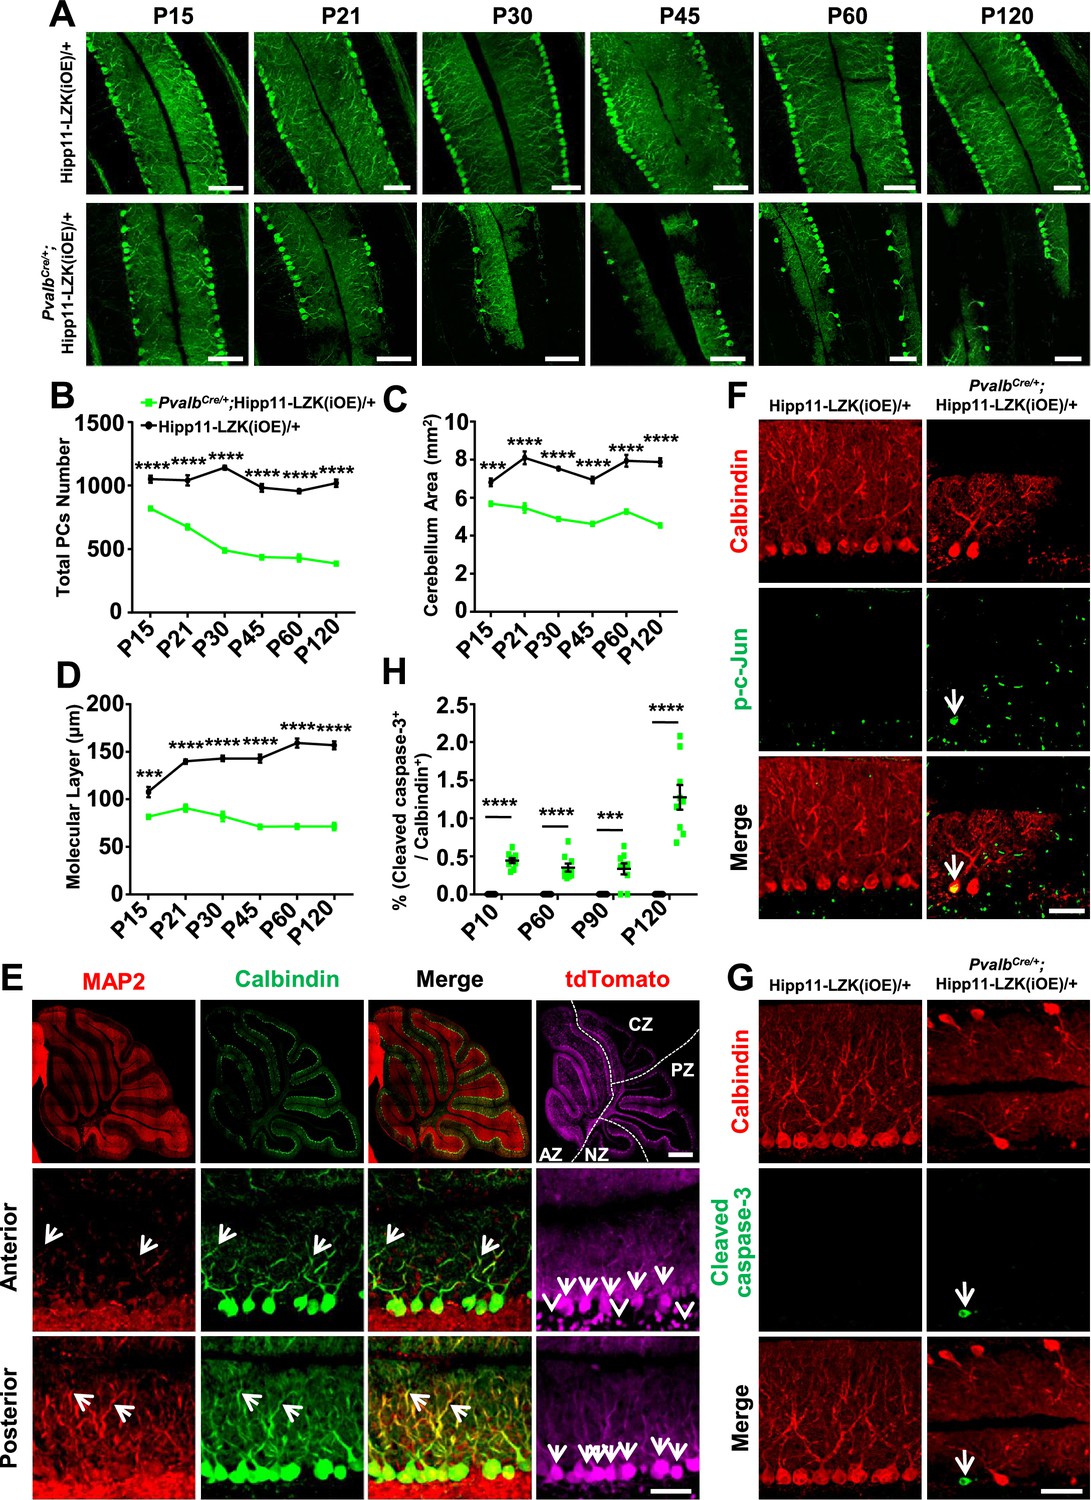
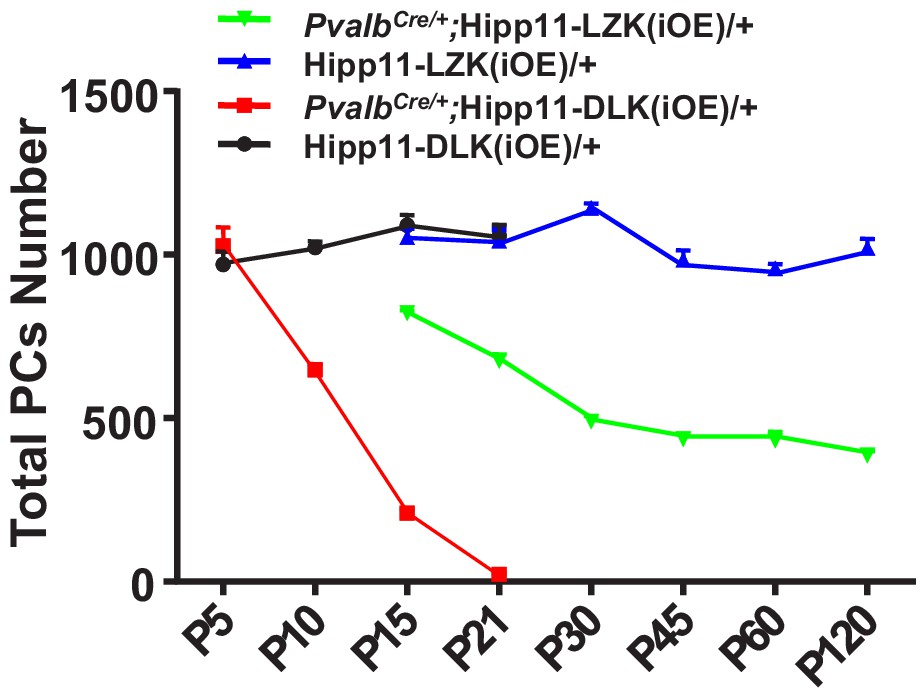
Induced expression of LZK using PvalbCre causes progressive degeneration of Purkinje cells.
(A) Representative images of Calbindin staining of cerebellar sections of littermates from mating parents PvalbCre/+ to Hipp11-LZK(iOE)/+ at indicated postnatal days. Scale bars: 100 μm. (B) Quantification of total Purkinje cells in all cerebellar lobules. (C) Quantification of cerebellum area, perimeters measured by outlining the outer edge of cerebellum. (D) Quantification of the molecular layer thickness in cerebellar lobules V-VI. (E) Representative images of cerebellar sections of PvalbCre/+;Hipp11-LZK(iOE)/+ mice at P15, co-immunostained for MAP2 and Calbindin. The dotted lines in top panels mark the boundary of anterior zone (AZ; lobules I-V), central zone (CZ; lobules VI-VII), posterior zone (PZ; lobules VIII-XI) and nodular zone (NZ; lobule X) in cerebellum, note higher tdTomato intensity in anterior cerebellum (arrows and arrowheads). Images in the bottom two rows show enlarged views of the anterior and posterior cerebellum, with arrows pointing to dendrites of Purkinje cells. Scale bars: 500 μm (upper panel), 100 μm (middle and lower panels). (F) Representative images of Purkinje cells of P90 mice co-immunostained for Calbindin and p-c-Jun. Scale bar: 50 μm. (G) Representative images of Purkinje cells of P90 mice co-immunostained for Calbindin and cleaved caspase-3. Note that PvalbCre/+;Hipp11-LZK(iOE)/+ mice have smaller cerebella, hence two rows of Purkinje cells are in view. Scale bar: 50 μm. (H) Quantification of the percentage of cleaved caspase-3+ Purkinje cells in total Purkinje cells in Hipp11-LZK(iOE)/+ and PvalbCre/+;Hipp11-LZK(iOE)/+ mice from P10 to P120. Color representation for genotypes in C, D, H is the same as in B. (B–D, H) n = 3 animals per genotype, three sections/animal for each time point; data shown are means ± SEM. Statistics: Student’s unpaired t-test; ***, p<0.001; ****, p<0.0001.
-
Figure 4—source data 1
Total number of Purkinje cells in all cerebellar lobules of mice genotypes indicated from P15 to P120.
- https://cdn.elifesciences.org/articles/63509/elife-63509-fig4-data1-v3.xlsx
-
Figure 4—source data 2
Mouse cerebellum area of genotypes indicated from P15 to P120.
- https://cdn.elifesciences.org/articles/63509/elife-63509-fig4-data2-v3.xlsx
-
Figure 4—source data 3
Molecular layer thickness in cerebellar lobules V-VI of mice genotypes indicated from P15 to P120.
- https://cdn.elifesciences.org/articles/63509/elife-63509-fig4-data3-v3.xlsx
-
Figure 4—source data 4
Percentage of cleaved caspase-3+ Purkinje cells in total Purkinje cells in mice genotypes indicated from P10 to P120.
- https://cdn.elifesciences.org/articles/63509/elife-63509-fig4-data4-v3.xlsx
Figure 4—figure supplement 1
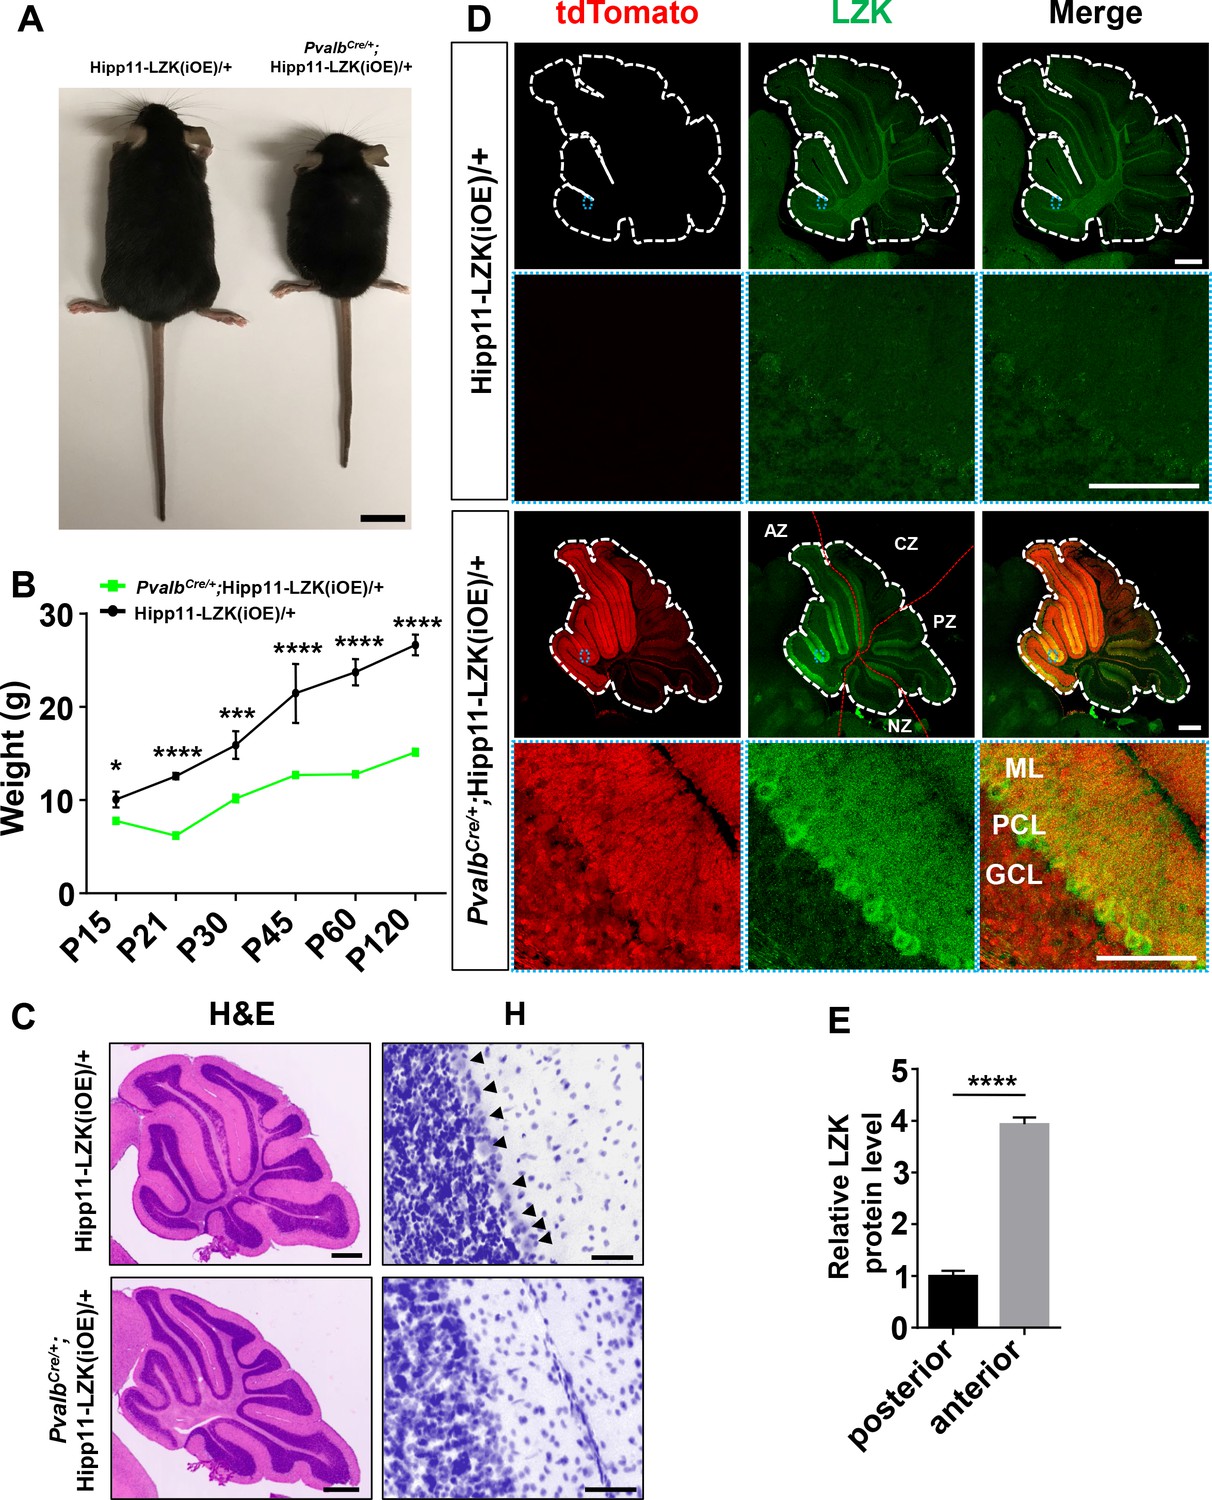
Additional evidence for elevating LZK expression in PV+ neurons causing animal growth and movement defects.
(A) Representative image of P120 mice of genotypes indicated. Scale bar: 2 cm. (B) Quantification of the body weight of mice of genotypes indicated from P15 to P120. Hipp11-LZK(iOE)/+: n = 4 (P15), n = 10 (P21), n = 10 (P30), n = 4 (P45), n = 11 (P60), n = 12 (P120); PvalbCre/+;Hipp11-LZK(iOE)/+: n = 5 (P15), n = 17 (P21), n = 14 (P30), n = 16 (P45), n = 20 (P60), n = 18 (P120). (C) Representative images of hematoxylin and eosin (left panel), hematoxylin (enlarged red boxed areas, right panel) staining of cerebellar sections from P120 mice of genotypes indicated. Arrows point to the Purkinje cell bodies. Scale bars: 500 μm (left panel), 50 μm (right panel). (D) Representative images of Purkinje cells of P21 mice immunostained for LZK. Enlarged blue boxed areas show transgenic LZK strongly expressed in dendrites and soma of Purkinje cells in PvalbCre/+;Hipp11-LZK(iOE)/+ mice. The red dotted lines mark the boundary of anterior zone (AZ; lobules I-V), central zone (CZ; lobules VI-VII), posterior zone (PZ; lobules VIII-XI), and nodular zone (NZ; lobule X) in cerebellum. ML: Molecular Layer; PCL: Purkinje Cell Layer; GCL: Granule Cell Layer. Scale bars: 500 μm (whole sections), 100 μm (enlarged views). (E) Quantification of relative LZK protein levels in PC soma of anterior and posterior of cerebellum in PvalbCre/+;Hipp11-LZK(iOE)/+ mice. n = 3 animals per genotype, three sections/animal. (B, E) Data shown are means ± SEM. Statistics: Student’s unpaired t-test; ns, no significant; *, p<0.05; ***, p<0.001; ****, p<0.0001.
Figure 4—figure supplement 2
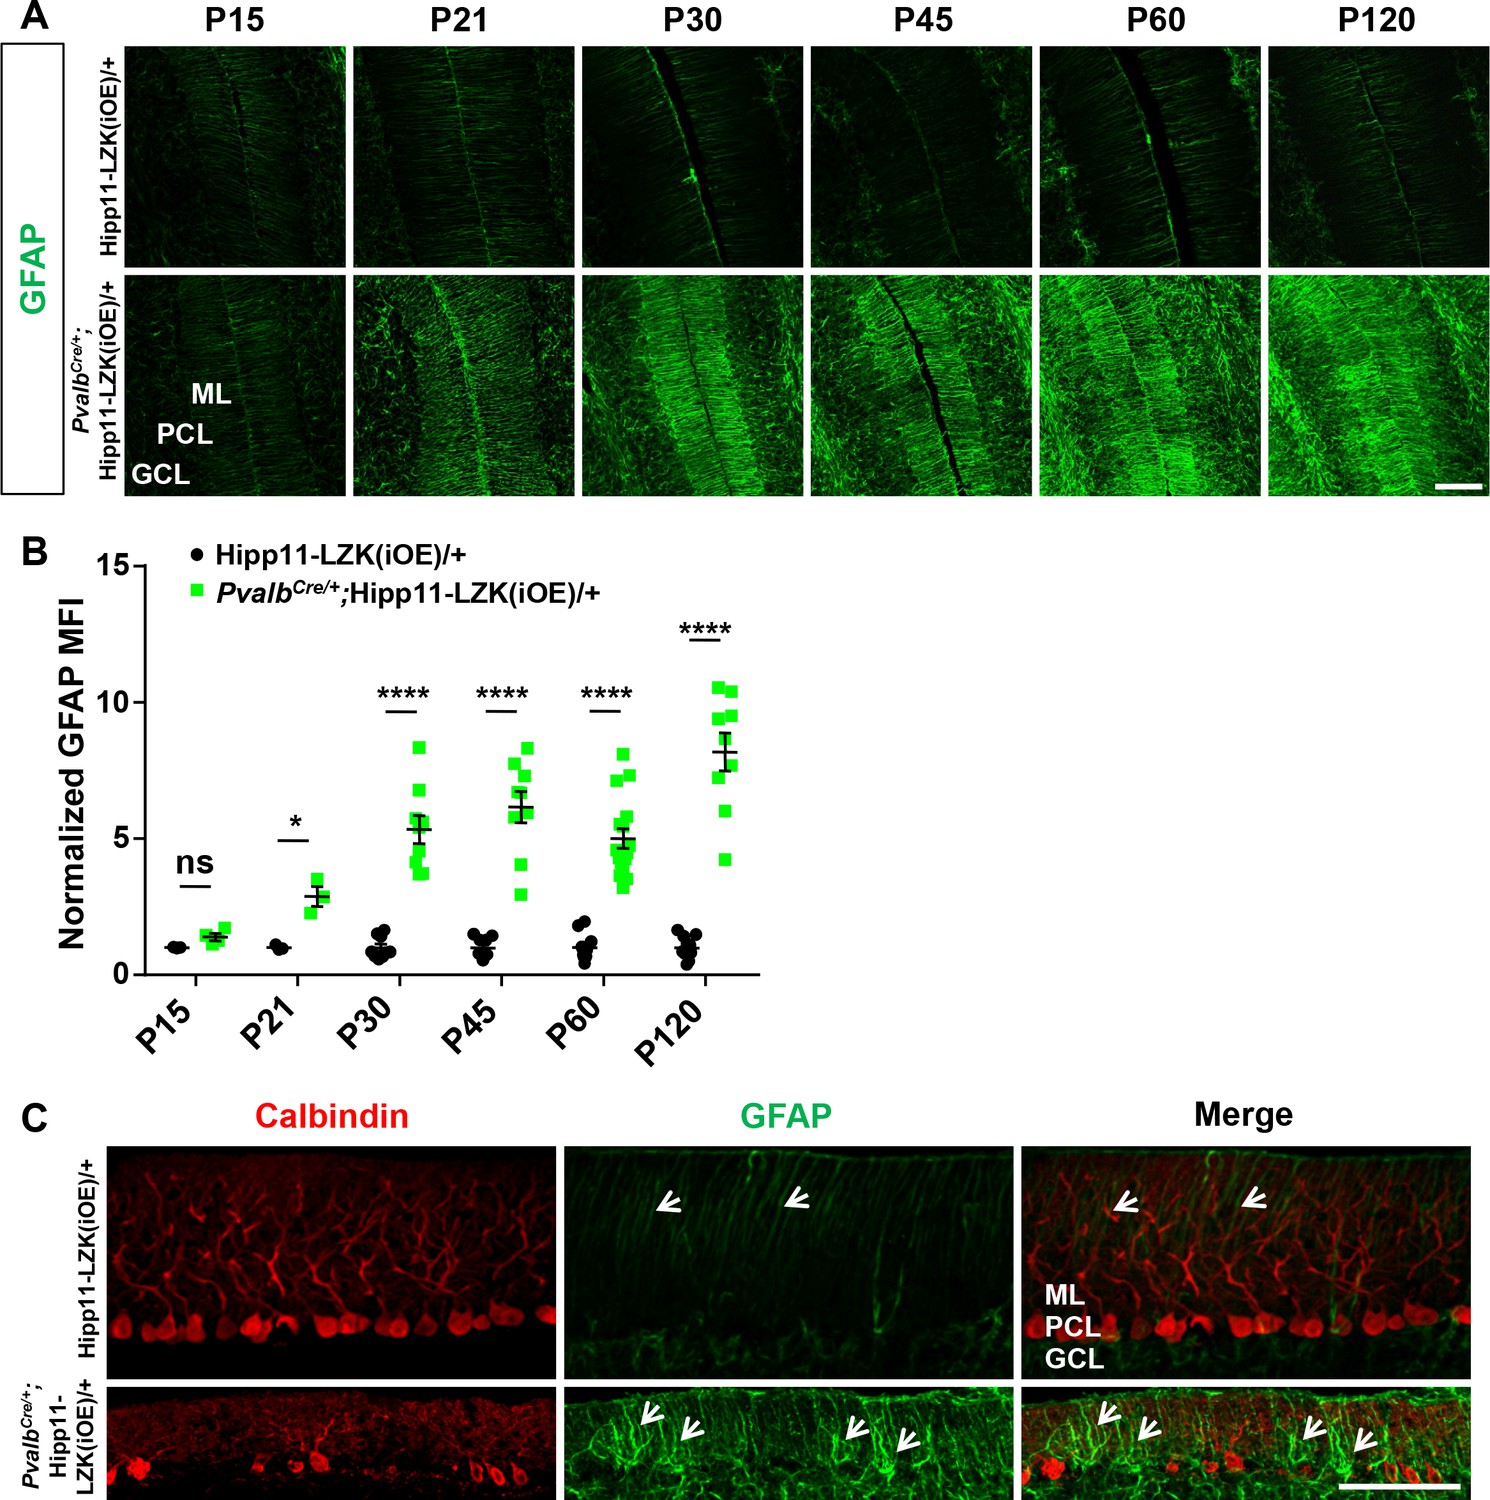
Additional evidence for degeneration of Purkinje cells induced by elevated LZK expression.
(A) Representative images of GFAP staining of cerebellar astrocytes of the mice from P15 to P120. ML: Molecular Layer; PCL: Purkinje Cell Layer; GCL: Granule Cell Layer. Scale bar: 100 μm. (B) GFAP staining intensity is quantified and normalized to Hipp11-LZK(iOE)/+ in cerebellum of the mice from P15 to P120. From P21, mice with induced LZK expression in PV+ neurons have significantly higher GFAP levels in cerebellum than control Hipp11-LZK(iOE)/+ mice. Hipp11-LZK(iOE)/+: n = 3 (P15), n = 3 (P21), n = 9 (P30), n = 9 (P45), n = 12 (P60), n = 9 (P120) sections; PvalbCre/+;Hipp11-LZK(iOE)/+: n = 4 (P15), n = 3 (P21), n = 9 (P30), n = 9 (P45), n = 16 (P60), n = 9 (P120) sections. MFI: mean of fluorescence intensity. Data shown are means ± SEM. Statistics: Student’s unpaired t-test; ns, no significant; *, p<0.05; ****, p<0.0001. (C) Representative images of Purkinje cells and Bergmann glia in cerebellum of P45 mice, co-immunostained for Calbindin and GFAP. The death of Purkinje cells induced increased reactivity of their adjacent Bergmann glia (arrows). ML: Molecular Layer; PCL: Purkinje Cell Layer; GCL: Granule Cell Layer. Scale bar: 100 μm.
Figure 4—figure supplement 3
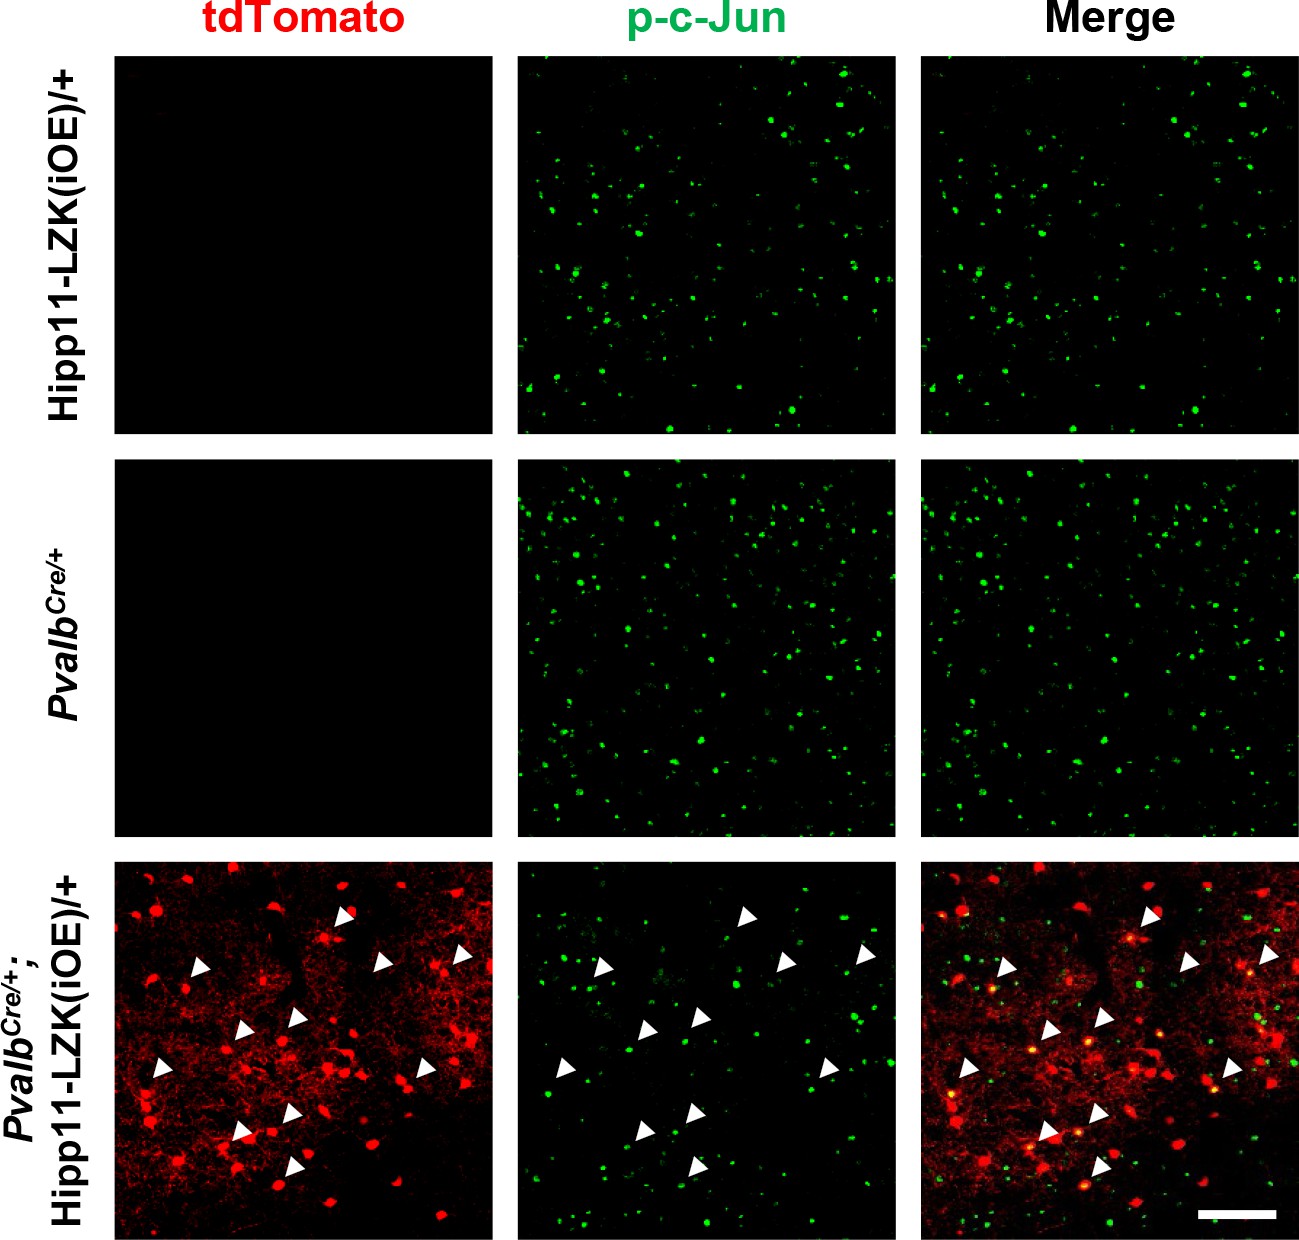
Additional evidence of p-c-Jun expression in cortex of PvalbCre/+;Hipp11-LZK(iOE)/+ mice.
Representative images of cortex of P60 mice of genotypes indicated, immunostained for p-c-Jun. Arrows point to p-c-Jun expression in tdTomato+ cells of PvalbCre/+;Hipp11-LZK(iOE)/+. Scale bar: 100 μm.
Figure 5 with 3 supplements
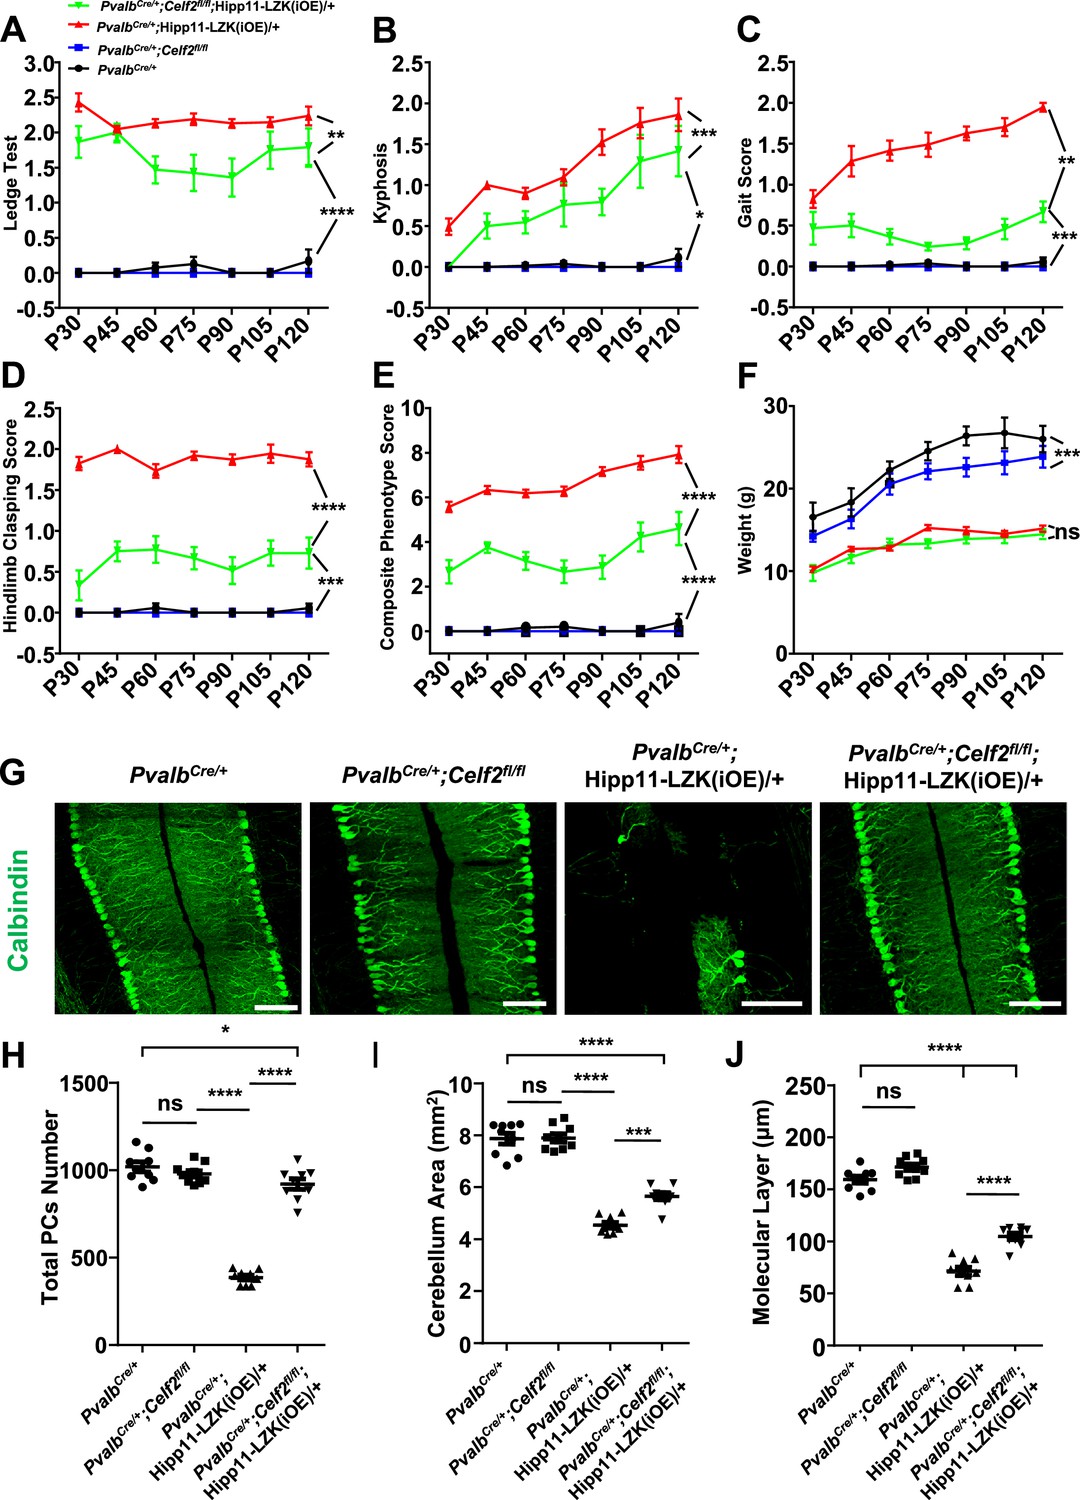
Deletion of the RNA splicing factor CELF2 using PvalbCre rescues degeneration of Purkinje cells induced by elevated LZK expression.
(A–E) Quantification of movement phenotypes of mice of indicated genotypes from P30 to P120. PvalbCre/+: n = 8 (P30), n = 17 (P45), n = 23 (P60), n = 19 (P75), n = 22 (P90), n = 12 (P105), n = 12 (P120); PvalbCre/+;Celf2fl/fl: n = 5 (P30), n = 8 (P45), n = 7 (P60), n = 6 (P75), n = 4 (P90), n = 4 (P105), n = 5 (P120); PvalbCre/+;Hipp11-LZK(iOE)/+: n = 21 (P30), n = 7 (P45), n = 20 (P60), n = 21 (P75), n = 26 (P90), n = 18 (P105), n = 19 (P120); PvalbCre/+;Celf2fl/fl;Hipp11-LZK(iOE)/+: n = 5 (P30), n = 8 (P45), n = 11 (P60), n = 11 (P75), n = 13 (P90), n = 8 (P105), n = 8 (P120). (F) Quantification of the body weight of mice of indicated genotypes from P30 to P120. PvalbCre/+: n = 9 (P30), n = 9 (P45), n = 17 (P60), n = 14 (P75), n = 16 (P90), n = 10 (P105), n = 7 (P120); PvalbCre/+;Celf2fl/fl: n = 5 (P30), n = 5 (P45), n = 8 (P60), n = 6 (P75), n = 6 (P90), n = 5 (P105), n = 4 (P120); PvalbCre/+;Hipp11-LZK(iOE)/+: n = 14 (P30), n = 16 (P45), n = 20 (P60), n = 14 (P75), n = 20 (P90), n = 17 (P105), n = 18 (P120); PvalbCre/+;Celf2fl/fl;Hipp11-LZK(iOE)/+: n = 7 (P30), n = 7 (P45), n = 12 (P60), n = 12 (P75), n = 14 (P90), n = 10 (P105), n = 10 (P120). Color representation for genotypes in B-F is the same as in A. (G) Representative images of Calbindin staining of cerebellar sections from P120 mice of genotypes indicated. Scale bars: 100 μm. (H) Quantification of total Purkinje cells in all cerebellar lobules at P120. (I) Quantification of cerebellum area at P120. (J) Quantification of the molecular layer thickness of P120 mice in cerebellar lobules V-VI. (H–J) n = 3 animals per genotype, three sections/animal. (A–F, H–J) Data shown are means ± SEM; Statistics: one-way ANOVA; ns, no significant; *, p<0.05; **, p<0.01; ***, p<0.001; ****, p<0.0001.
-
Figure 5—source data 1
Score of ledge test of mice genotypes indicated from P30 to P120.
- https://cdn.elifesciences.org/articles/63509/elife-63509-fig5-data1-v3.xlsx
-
Figure 5—source data 2
Score of kyphosis of mice genotypes indicated from P30 to P120.
- https://cdn.elifesciences.org/articles/63509/elife-63509-fig5-data2-v3.xlsx
-
Figure 5—source data 3
Score of gait of mice genotypes indicated from P30 to P120.
- https://cdn.elifesciences.org/articles/63509/elife-63509-fig5-data3-v3.xlsx
-
Figure 5—source data 4
Score of hindlimb clasping of mice genotypes indicated from P30 to P120.
- https://cdn.elifesciences.org/articles/63509/elife-63509-fig5-data4-v3.xlsx
-
Figure 5—source data 5
Composite phenotype score of mice genotypes indicated from P30 to P120.
- https://cdn.elifesciences.org/articles/63509/elife-63509-fig5-data5-v3.xlsx
-
Figure 5—source data 6
Mouse body weight of genotypes indicated from P30 to P120.
- https://cdn.elifesciences.org/articles/63509/elife-63509-fig5-data6-v3.xlsx
-
Figure 5—source data 7
Total Purkinje cells in all cerebellar lobules of mice of genotypes indicated at P120.
- https://cdn.elifesciences.org/articles/63509/elife-63509-fig5-data7-v3.xlsx
-
Figure 5—source data 8
Mouse cerebellum area of genotypes indicated at P120.
- https://cdn.elifesciences.org/articles/63509/elife-63509-fig5-data8-v3.xlsx
-
Figure 5—source data 9
Molecular layer thickness in cerebellar lobules V-VI of P120 mice of genotypes indicated.
- https://cdn.elifesciences.org/articles/63509/elife-63509-fig5-data9-v3.xlsx
Figure 5—figure supplement 1
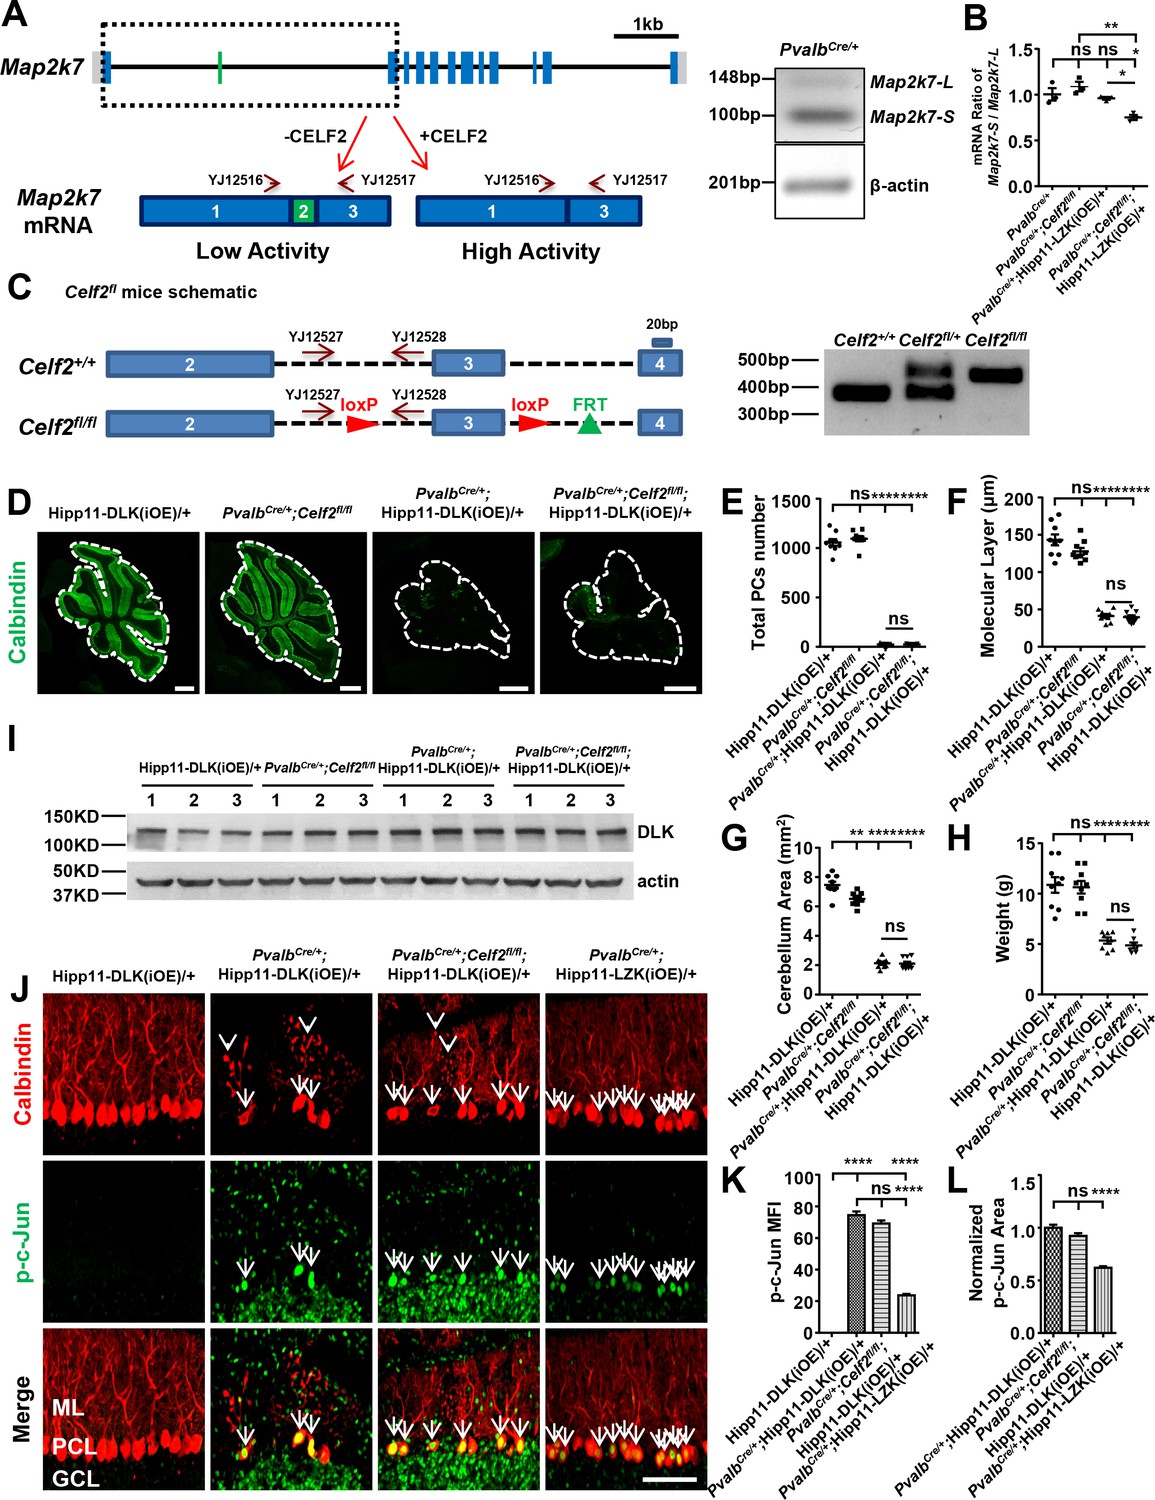
CELF2 is a regulator of Map2k7 in Purkinje cells.
(A) Schematic of Map2k7 locus on Chromosome 8, along with primers for mRNA detection of Map2k7 isoforms. Scale bar: 1 kb. CELF2 promotes exclusion of exon 2 of Map2k7. The gel image shows the RT-PCR analysis of the Map2k7 long isoform (Map2k7-L) and short isoform (Map2k7-S) as well as β-actin mRNA levels in cerebellum of PvalbCre/+ mouse using primers YJ12516-12519. (B) qRT-PCR analyses show the mRNA ratio of Map2k7-S/Map2k7-L in cerebellum from P21 mice of genotypes indicated. RNA samples are collected from n = 3 animals/genotype. For qRT-PCR, n = 5 replicates/sample. (C) The Celf2fl/fl mice have two loxP sites flanking exon 3, and Cre-mediated excision results in an early stop codon within exon 4, hence a null allele. The homozygotes or heterozygotes of Celf2fl were identified by PCR using primers YJ12527 and YJ12528. (D) Representative images of Calbindin staining of cerebellar sections from P21 mice of genotypes indicated. Scale bars: 500 μm. (E) Quantification of total number of PCs in all cerebellar lobules. (F) Quantification of the molecular layer thickness in cerebellar lobules V-VI. (G) Quantification of the cerebellum area of P21 mice. (H) Quantification of the body weight of P21 mice of genotypes indicated. Hipp11-DLK(iOE)/+: n = 9; PvalbCre/+;Celf2fl/fl: n = 9; PvalbCre/+;Hipp11-DLK(iOE)/+: n = 8; PvalbCre/+;Celf2fl/fl;Hipp11-DLK(iOE)/+: n = 7. (I) The DLK protein levels in cerebellum from P10 mice of genotypes indicated were determined by western blot. n = 3 per group. (J) Representative images of Purkinje cells of P15 mice of genotypes indicated, co-immunostained for Calbindin and p-c-Jun. Celf2 deletion did not reduce the phosphorylation level of c-Jun induced by DLK overexpression in PV+ neurons (arrows), nor rescued the dendrite swelling caused by DLK overexpression in PV+ neurons (arrowheads). ML: Molecular Layer; PCL: Purkinje Cell Layer; GCL: Granule Cell Layer. Scale bar: 100 μm. (K) Quantification of the p-c-Jun levels in Purkinje cells of P15 mice. MFI: mean of fluorescence intensity. (L) p-c-Jun areas are quantified and normalized to PvalbCre/+;Hipp11-DLK(iOE)/+ in Purkinje cells of P15 mice. (E–G, K–L) n = 3 animals per genotype, three sections/animal. (B, E–H, K–L) Data shown are means ± SEM; Statistics: one-way ANOVA; ns, no significant; *, p<0.05; **, p<0.01; ****, p<0.0001.
Figure 5—figure supplement 2
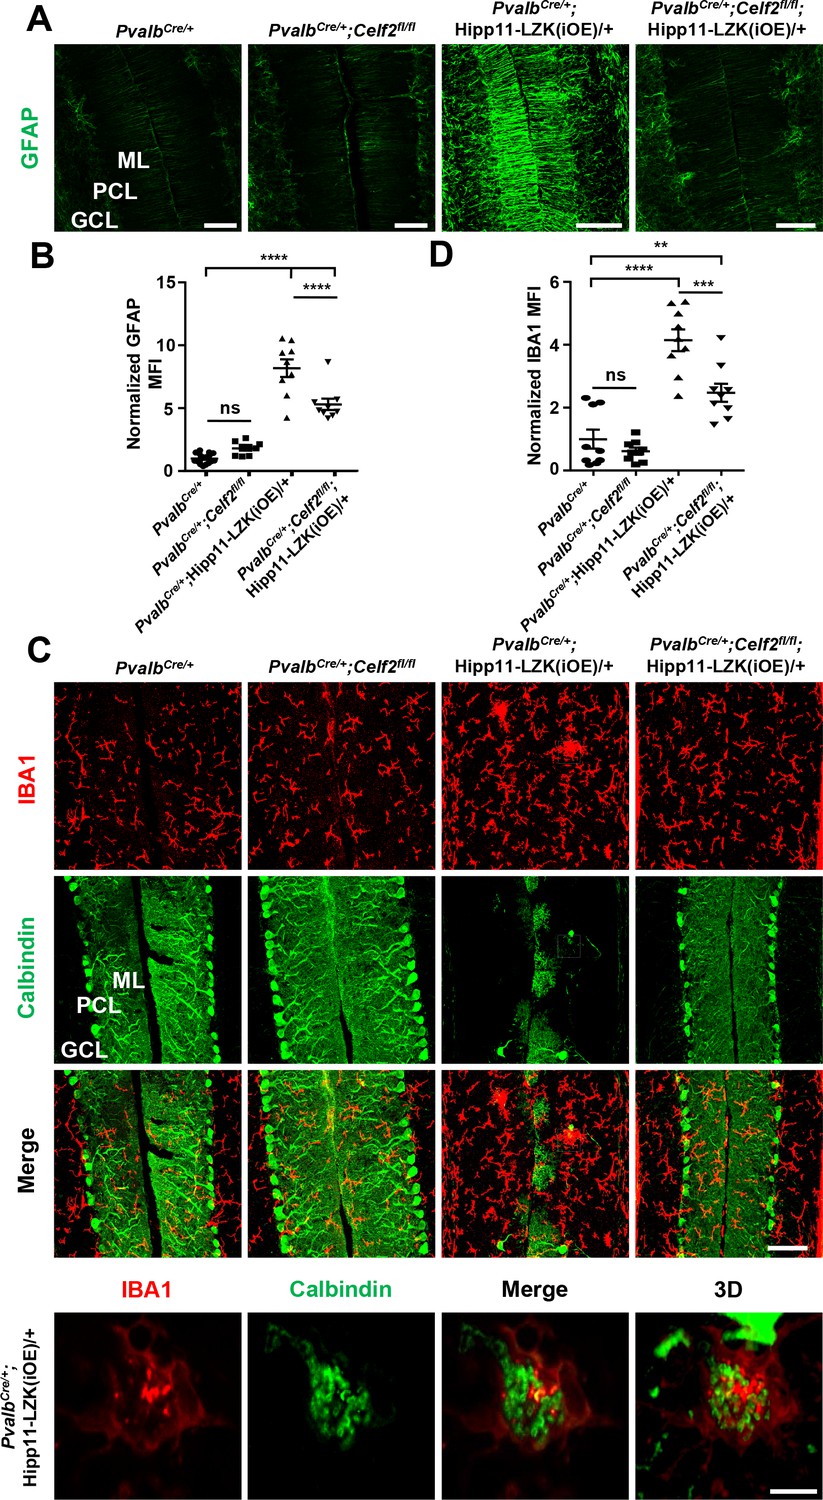
CELF2 deletion reduces astrogliosis and microgliosis associated with LZK in PV+ neurons.
(A) Representative images of GFAP staining of cerebellar astrocytes from P120 mice of genotypes indicated. ML: Molecular Layer; PCL: Purkinje Cell Layer; GCL: Granule Cell Layer. Scale bars: 100 μm. (B) GFAP staining intensity is quantified and normalized to PvalbCre/+ in cerebellum of P120 mice. PvalbCre/+: n = 6 animals, three sections/animal; PvalbCre/+;Celf2fl/fl, PvalbCre/+;Hipp11-LZK(iOE)/+ and PvalbCre/+;Celf2fl/fl;Hipp11-LZK(iOE)/+: n = 3 animals per genotype, three sections/animal. MFI: mean of fluorescence intensity. (C) Representative images of cerebellar sections from P120 mice of genotypes indicated, co-immunostained for IBA1 and Calbindin. Enlarged white boxed areas show Calbindin-stained materials are within IBA1+ microglia. The views are from single-focal plane and a 3D reconstructed image, respectively. Scale bar: 100 μm (upper three panels), 10 μm (lower panel). ML: Molecular Layer; PCL: Purkinje Cell Layer; GCL: Granule Cell Layer. (D) IBA1 staining intensity is quantified and normalized to PvalbCre/+ in cerebellum of P120 mice. n = 3 animals per genotype, three sections/animal. MFI: mean of fluorescence intensity. (B, D) Data shown are means ± SEM; Statistics: one-way ANOVA; ns, no significant; **, p<0.01; ***, p<0.001; ****, p<0.0001.
Figure 5—figure supplement 3
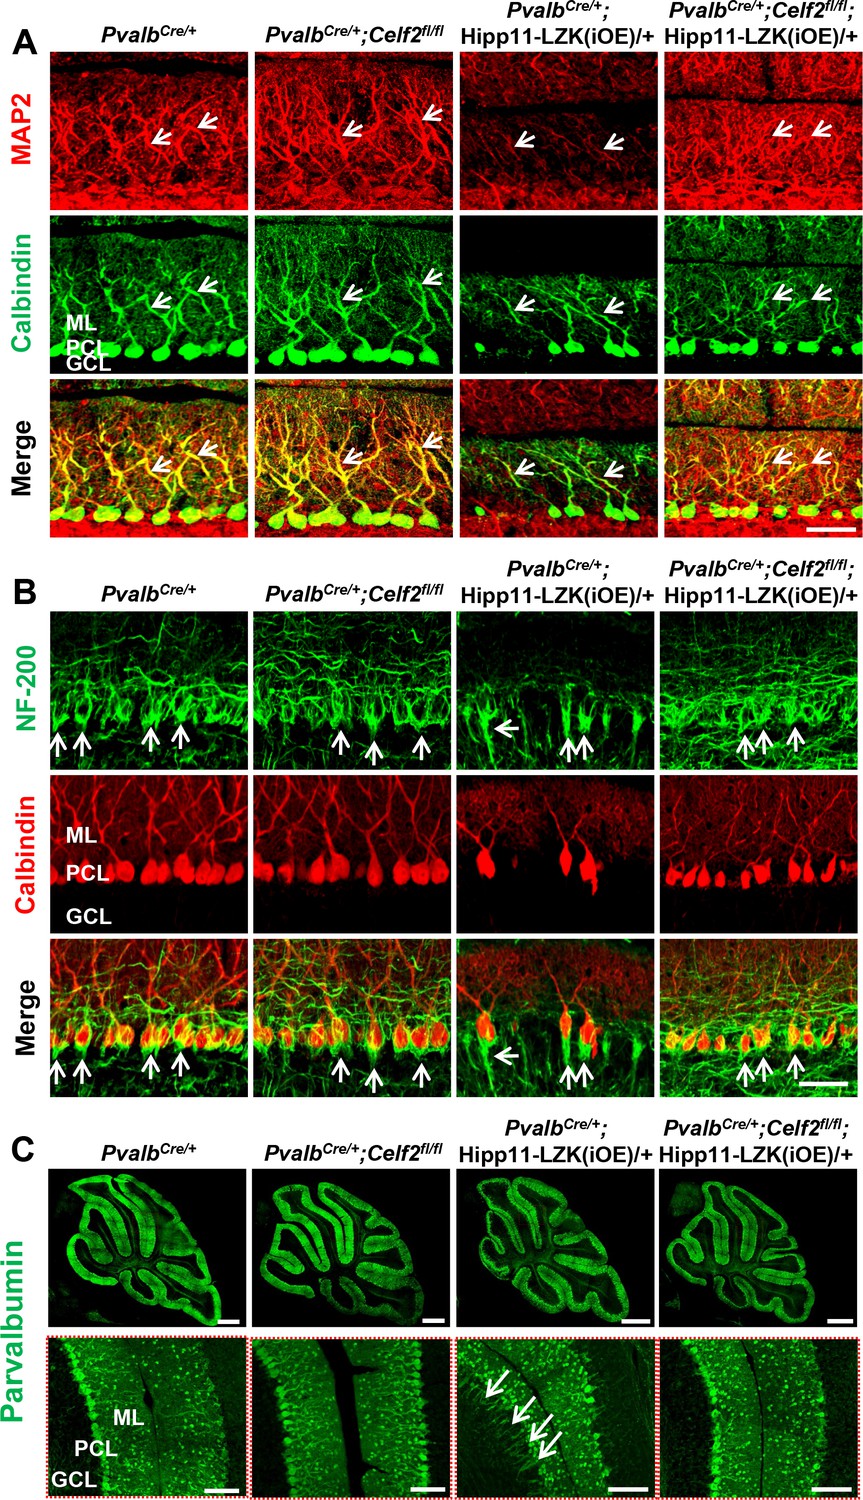
CELF2 deletion rescues reduced expression of MAP2 and NF-200 and pinceau disorganization induced by elevated LZK expression.
(A) Representative images of cerebellar sections from P120 mice of genotypes indicated, co-immunostained for Calbindin and MAP2. Arrows point to MAP2 staining in dendrites of Purkinje cells. (B) Representative images of cerebellar sections from P120 mice of genotypes indicated, co-immunostained for NF-200 and Calbindin. LZK overexpression in PV+ neurons changes the organization of basket cell pinceaux (arrows) at the initial segment of axons of Purkinje cells, which is suppressed by Celf2 deletion. (A–B) ML: Molecular Layer; PCL: Purkinje Cell Layer; GCL: Granule Cell Layer. Scale bar: 50 μm. (C) Representative images of parvalbumin staining of cerebellar sections from P120 mice of genotypes indicated. Enlarged white boxed areas in lower panel show suppression of pinceaux disorganization by Celf2 deletion. ML: Molecular Layer; PCL: Purkinje Cell Layer; GCL: Granule Cell Layer. Scale bars: 500 μm (upper panel), 100 μm (lower panel).
Figure 6 with 1 supplement
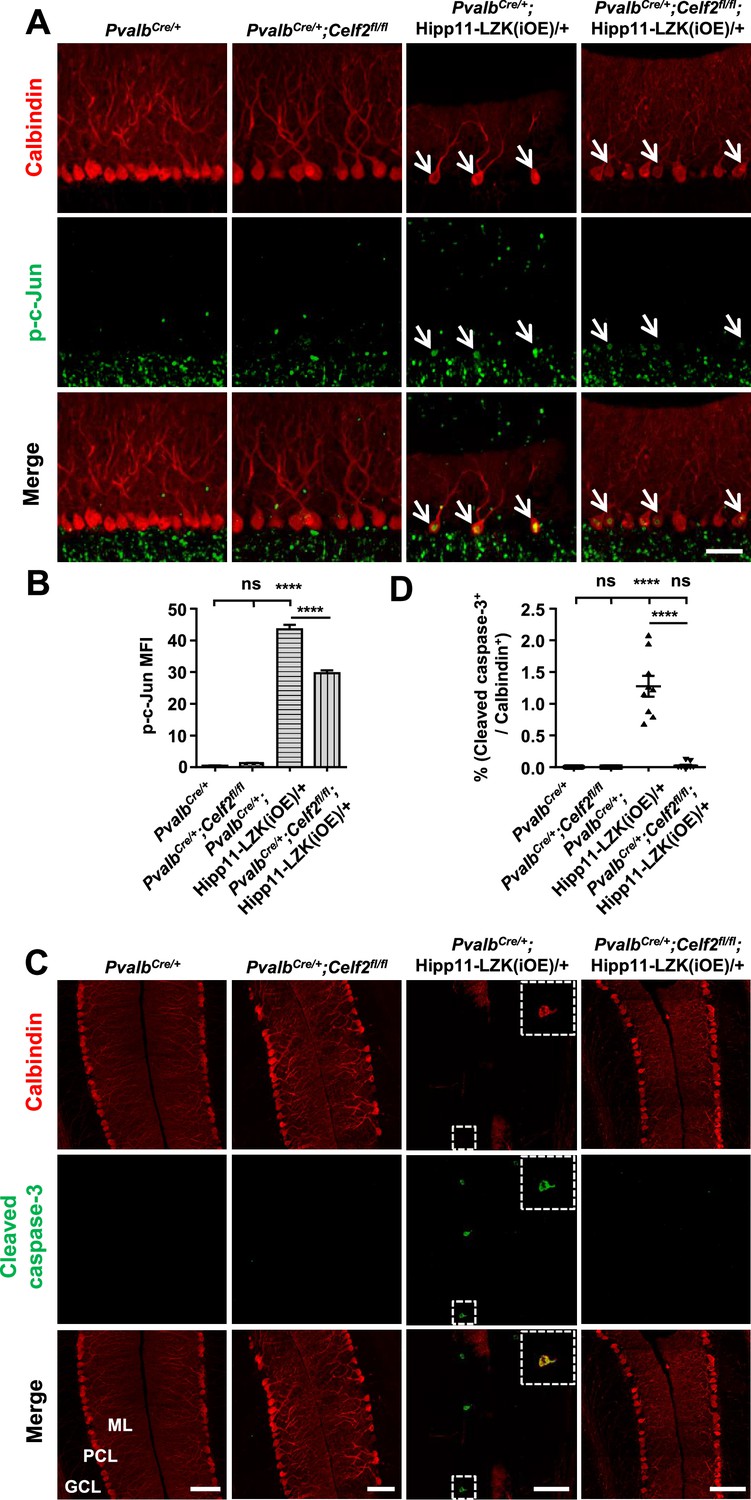
Deletion of CELF2 in PvalbCre/+;Hipp11-LZK(iOE)/+ mice reduces levels of p-c-Jun and apoptosis in Purkinje cells.
(A) Representative images of Purkinje cells, co-immunostained for p-c-Jun and Calbindin, in P120 mice of genotypes indicated. Arrows point to p-c-Jun immunostaining signals in Purkinje cells. ML: Molecular Layer; PCL: Purkinje Cell Layer; GCL: Granule Cell Layer. Scale bar: 100 μm. (B) Quantification of the p-c-Jun levels in Purkinje cells of P120 mice. MFI: mean of fluorescence intensity. (C) Representative images of Purkinje cells, co-immunostained for cleaved caspase-3 and Calbindin, in P120 mice of genotypes indicated, with enlarged boxes showing cleaved caspase-3+ signal in Calbindin-labeled Purkinje cells. ML: Molecular Layer; PCL: Purkinje Cell Layer; GCL: Granule Cell Layer. Scale bars: 100 μm. (D) Quantification of the percentage of cleaved caspase-3+ Purkinje cells in total number of Purkinje cells of P120 mice of genotypes indicated. (B, D) n = 3 animals per genotype, three sections/animal; data shown are means ± SEM. Statistics: one-way ANOVA; ns, no significant; ****, p<0.0001.
-
Figure 6—source data 1
p-c-Jun levels in Purkinje cells of P120 mice of genotypes indicated.
- https://cdn.elifesciences.org/articles/63509/elife-63509-fig6-data1-v3.xlsx
-
Figure 6—source data 2
Percentage of cleaved caspase-3+ Purkinje cells in total number of Purkinje cells of P120 mice of genotypes indicated.
- https://cdn.elifesciences.org/articles/63509/elife-63509-fig6-data2-v3.xlsx
Figure 6—figure supplement 1
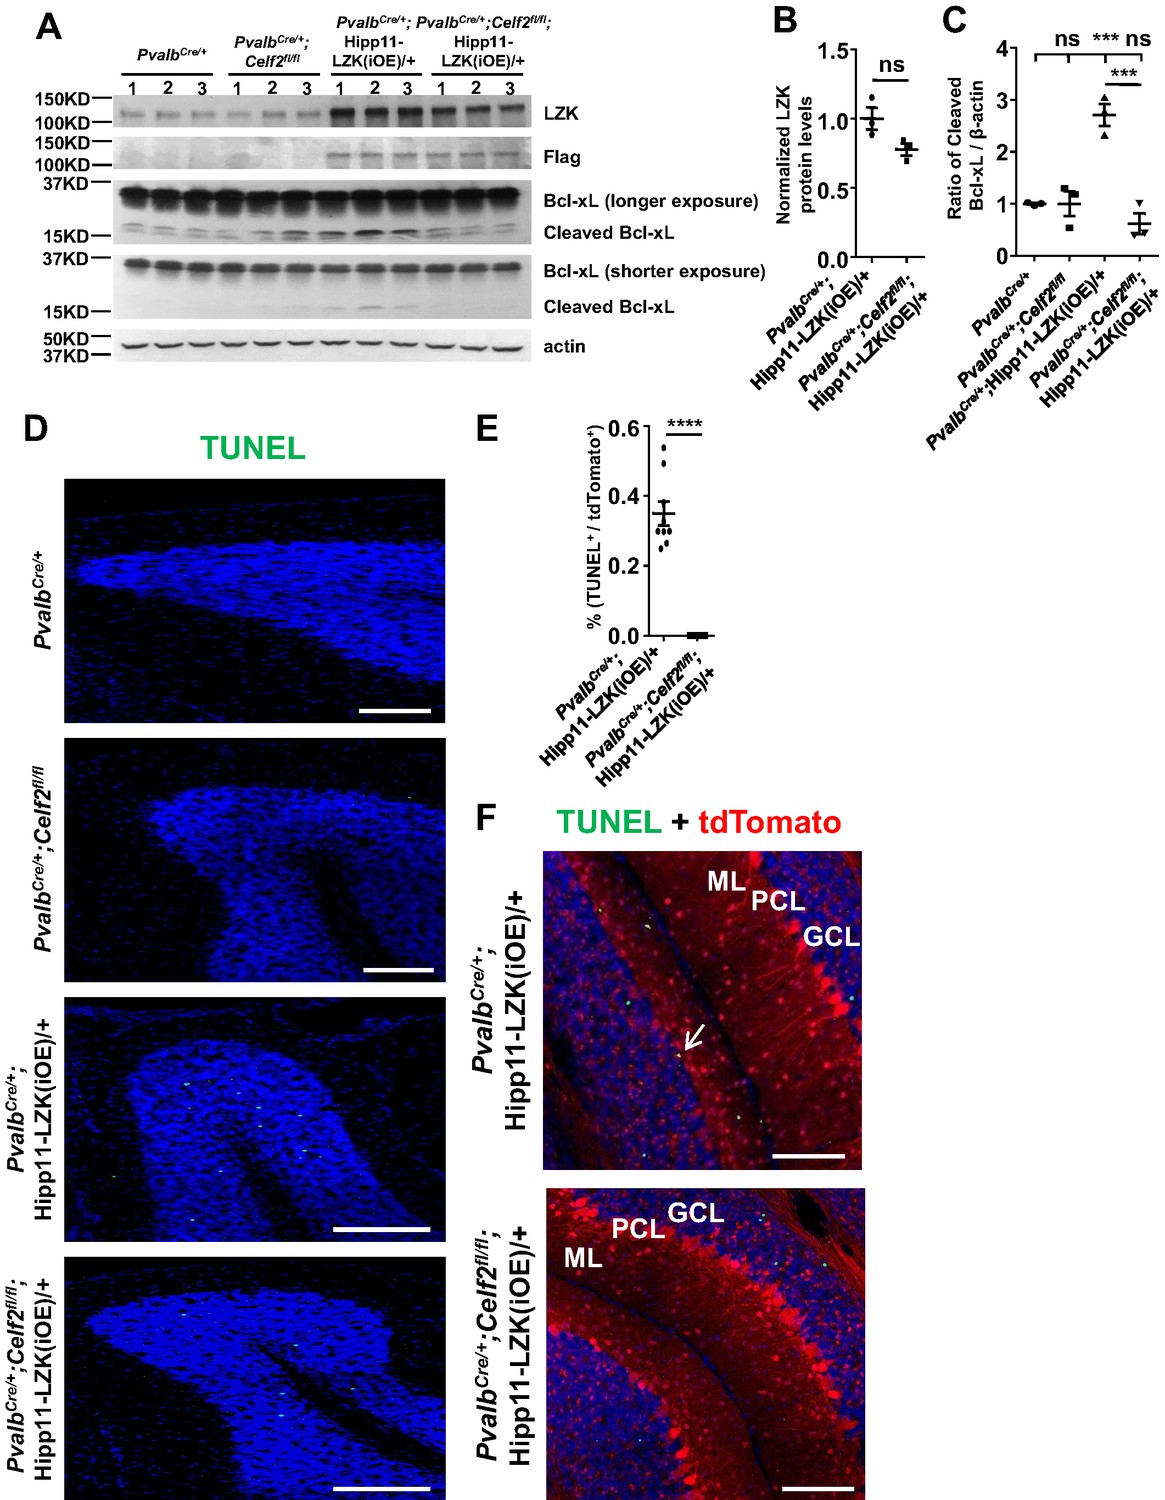
Additional evidence of apoptosis in Purkinje cell degeneration caused by elevated LZK expression.
(A) Western blot showing LZK and Bcl-xL protein levels in cerebellar extracts from P21 mice of genotypes indicated. The LZK proteins were first immunoprecipitated and then analyzed by western blot. (B) LZK protein levels are quantified and normalized to PvalbCre/+;Hipp11-LZK(iOE)/+. n = 3 animals per genotype. Data shown are means ± SEM. Statistics: Student’s unpaired t-test; ns, no significant. (C) Quantification of the ratio of cleaved Bcl-xL relative to β-actin protein levels. n = 3 animals per genotype. Data shown are means ± SEM. Statistics: one-way ANOVA; ns, no significant; ***, p<0.001. (D) Representative images of TUNEL fluorescence signal (fluorescein-12-dUTP) in cerebellar lobules of P120 mice of genotypes indicated. Scale bars: 100 μm. (E) Quantification of the percentage of TUNEL+ Purkinje cells in total Purkinje cells (tdTomato+) in PvalbCre/+;Hipp11-LZK(iOE)/+ and PvalbCre/+;Celf2fl/fl;Hipp11-LZK(iOE)/+ mice at P120. n = 3 animals per genotype, three sections/animal. Data shown are means ± SEM. Statistics: Student’s unpaired t-test; ****, p<0.0001. (F) Representative images of cerebellar sections of PvalbCre/+;Hipp11-LZK(iOE)/+ and PvalbCre/+;Celf2fl/fl;Hipp11-LZK(iOE)/+ mice labeled with TUNEL fluorescence signal and reporter tdTomato. The TUNEL signal was co-localized with Purkinje cells in PvalbCre/+;Hipp11-LZK(iOE)/+ mice (arrow), but not in PvalbCre/+;Celf2fl/fl;Hipp11-LZK(iOE)/+ mice. ML: Molecular Layer; PCL: Purkinje Cell Layer; GCL: Granule Cell Layer. Scale bars: 100 μm.
Figure 7 with 2 supplements
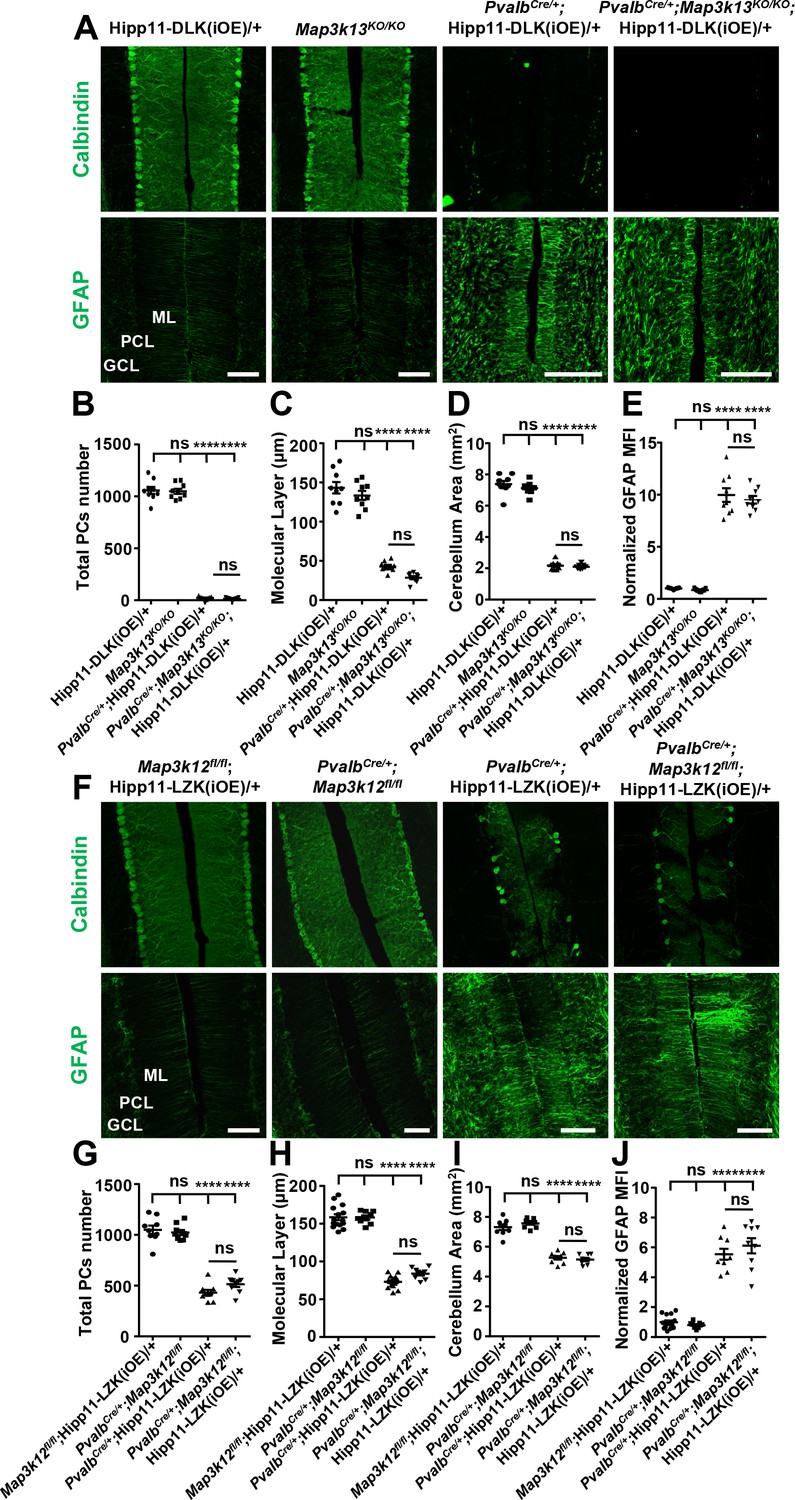
DLK and LZK can induce Purkinje cell degeneration independent of each other.
(A) Representative images of immunostainning for Calbindin (upper panels) and GFAP (lower panels) of cerebellar sections of P21 mice of genotypes indicated. ML: Molecular Layer; PCL: Purkinje Cell Layer; GCL: Granule Cell Layer. Scale bars: 100 μm. (B) Quantification of total number of Purkinje cells in all cerebellar lobules at P21. (C) Quantification of the molecular layer thickness in cerebellar lobules V-VI of P21 mice. (D) Quantification of the cerebellum area of P21 mice. (E) GFAP staining intensity is quantified and normalized to Hipp11-DLK (iOE)/+ in cerebellum of P21 mice. MFI: mean of fluorescence intensity. (F) Representative images of immunostaining for Calbindin (upper panels) and GFAP (lower panels) of cerebellar sections of P60 mice of genotypes indicated. ML: Molecular Layer; PCL: Purkinje Cell Layer; GCL: Granule Cell Layer. Scale bars: 100 μm. (G) Quantification of total number of Purkinje cells in all cerebellar lobules of P60 mice. (H) Quantification of the molecular layer thickness in cerebellar lobules V-VI of P60 mice. Map3k12fl/fl;Hipp11-LZK(iOE)/+ and PvalbCre/+;Hipp11-LZK(iOE)/+: n = 5 animals, three sections/animal; PvalbCre/+;Map3k12fl/fl and PvalbCre/+;Map3k12fl/fl;Hipp11-LZK(iOE)/+: n = 3 animals, three sections/animal. (I) Quantification of the cerebellum area of P60 mice. (J) GFAP staining intensity is quantified and normalized to Map3k12fl/fl;Hipp11-LZK(iOE)/+ in cerebellum of P60 mice. MFI: mean of fluorescence intensity. Map3k12fl/fl;Hipp11-LZK(iOE)/+: n = 5 animals, three sections/animal; PvalbCre/+;Map3k12fl/fl, PvalbCre/+;Hipp11-LZK(iOE)/+ and PvalbCre/+;Map3k12fl/fl;Hipp11-LZK(iOE)/+: n = 3 animals, three sections/animal. (B–E, G, I) n = 3 animals per genotype, three sections/animal. (B–E, G–J) Data shown are means ± SEM; Statistics: one-way ANOVA; ns, no significant; ****, p<0.0001.
-
Figure 7—source data 1
Total number of Purkinje cells in all cerebellar lobules of P21 mice of genotypes indicated.
- https://cdn.elifesciences.org/articles/63509/elife-63509-fig7-data1-v3.xlsx
-
Figure 7—source data 2
Molecular layer thickness in cerebellar lobules V-VI of P21 mice of genotypes indicated.
- https://cdn.elifesciences.org/articles/63509/elife-63509-fig7-data2-v3.xlsx
-
Figure 7—source data 3
Cerebellum area of P21 mice of genotypes indicated.
- https://cdn.elifesciences.org/articles/63509/elife-63509-fig7-data3-v3.xlsx
-
Figure 7—source data 4
Normalized GFAP levels in cerebellum of P21 mice of genotypes indicated.
- https://cdn.elifesciences.org/articles/63509/elife-63509-fig7-data4-v3.xlsx
-
Figure 7—source data 5
Total number of Purkinje cells in all cerebellar lobules of P60 mice of genotypes indicated.
- https://cdn.elifesciences.org/articles/63509/elife-63509-fig7-data5-v3.xlsx
-
Figure 7—source data 6
Molecular layer thickness in cerebellar lobules V-VI of P60 mice of genotypes indicated.
- https://cdn.elifesciences.org/articles/63509/elife-63509-fig7-data6-v3.xlsx
-
Figure 7—source data 7
Cerebellum area of P60 mice of genotypes indicated.
- https://cdn.elifesciences.org/articles/63509/elife-63509-fig7-data7-v3.xlsx
-
Figure 7—source data 8
Normalized GFAP levels in cerebellum of P60 mice of genotypes indicated.
- https://cdn.elifesciences.org/articles/63509/elife-63509-fig7-data8-v3.xlsx
Figure 7—figure supplement 1
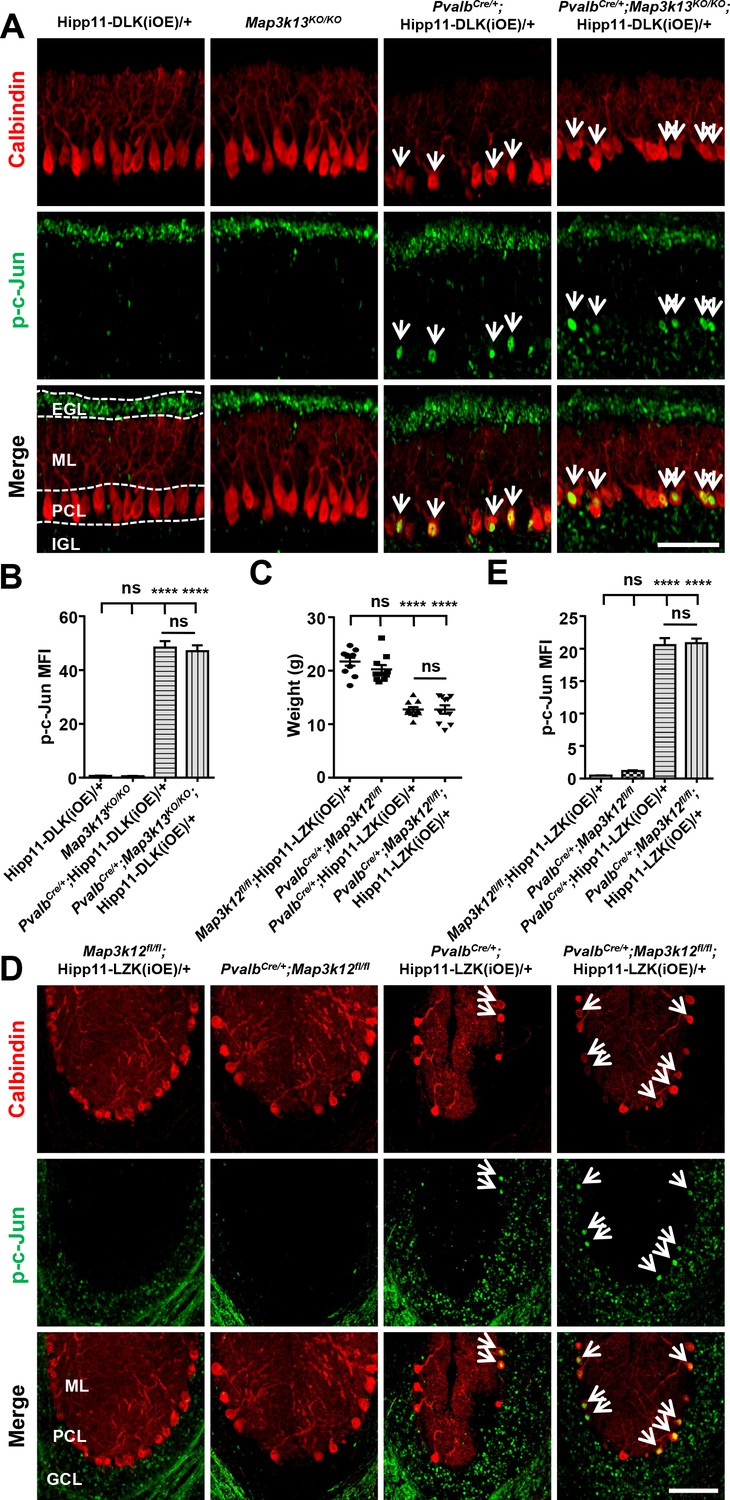
Levels of p-c-Jun induced by elevated expression of DLK or LZK is not affected by loss of LZK or DLK, respectively.
(A) LZK deletion did not attenuate the phosphorylation of c-Jun induced by DLK overexpression in PV+ neurons. Shown are representative images of cerebellar sections of P10 mice, co-immunostained for p-c-Jun and Calbindin. EGL: External Granule Layer; ML: Molecular Layer; PCL: Purkinje Cell Layer; IGL: Internal Granule Layer. Scale bar: 100 μm. (B) Quantification of the p-c-Jun levels in Purkinje cells of P10 mice of genotype indicated. MFI: mean of fluorescence intensity. (C) Quantification of the body weight of P60 mice of genotypes indicated. n = 10 animals per genotype. (D) DLK deletion did not attenuate the phosphorylation of c-Jun induced by LZK overexpression in PV+ neurons. Shown are representative images of cerebellar lobules of P60 mice, co-immunostained for Calbindin and p-c-Jun. ML: Molecular Layer; PCL: Purkinje Cell Layer; GCL: Granule Cell Layer. Scale bar: 100 μm. (E) Quantification of the p-c-Jun levels in Purkinje cells of P60 mice. MFI: mean of fluorescence intensity. (B, E) n = 3 animals per genotype, three sections/animal. (B, C, E) Data shown are means ± SEM; Statistics: one-way ANOVA; ns, no significant; ****, p<0.0001.
Figure 7—figure supplement 2
Summary of Purkinje cell death observed in the mice with elevated expression of two MAP3Ks.
Videos
Video 1
Locomotor deficits in P15 PvalbCre/+;Hipp11-DLK(iOE)/+ mice.
A representative P15 old PvalbCre/+;Hipp11-DLK(iOE)/+ mouse exhibited difficulty moving forward and drags its abdomen along the ground, as well as tremors.
Video 2
Locomotor deficits in P120 PvalbCre/+;Hipp11-LZK(iOE)/+ mice.
A representative P120 old PvalbCre/+;Hipp11-LZK(iOE)/+ mouse exhibited severe limp while walking and tremors.
Video 3
Calbindin+ staining materials are present inside of IBA1+ cells in P120 PvalbCre/+;Hipp11-LZK(iOE)/+ mice.
A video showing the 3D reconstruction image of Calbindin+ staining materials in the microglia or macrophage cell body.
Tables
Key resources table
| Reagent type (species) or resource | Designation | Source or reference | Identifiers | Additional information |
|---|---|---|---|---|
| Genetic reagent (M. musculus) | B6.129P2-Pvalbtm1(cre)Arbr/J (PvalbCre) | Jackson Laboratory | Stock #: 017320 RRID:MGI_3590684 | |
| Genetic reagent (M. musculus) | C57BL/6J | Jackson Laboratory | Stock #: 000664 RRID:MGI_3028467 | |
| Genetic reagent (M. musculus) | Inducible DLK overexpression: Hipp11-DLK(iOE) | This paper | housed in UCSD vivarium | |
| Genetic reagent (M. musculus) | Inducible LZK overexpression: Hipp11-LZK(iOE) | This paper | housed in UCSD vivarium | |
| Genetic reagent (M. musculus) | Conditional DLK knockout (Map3k12fl) | Chen et al., 2016b | housed in UCSD vivarium | |
| Genetic reagent (M. musculus) | Conditional LZK knockout (Map3k13fl) | Chen et al., 2016b | housed in UCSD vivarium | |
| Genetic reagent (M. musculus) | Conditional Celf2 knockout (Celf2fl) | Chen et al., 2016a | housed in UCSD vivarium | |
| Genetic reagent (M. musculus) | CRISPR LZK knockout (Map3k13KO) | This paper | housed in UCSD vivarium | |
| Antibody | Anti-MAP3K12 (rabbit polyclonal) | Sigma-Aldrich | Cat. #: SAB2700169 RRID:AB_2714162 | WB (1:2000), IF (1:250) |
| Antibody | Anti-MAP3K13 (rabbit polyclonal) | Sigma-Aldrich | Cat. #: HPA016497 RRID:AB_10670027 | WB (1:300), IF (1:200), IP (2 μg per sample) |
| Antibody | Anti-Actin (Clone C4) (mouse monoclonal) | MP Biomedicals | Cat. #: 08691001 RRID:AB_2335127 | WB (1:10,000) |
| Antibody | Anti-Bcl-xL (54H6) (rabbit monoclonal) | Cell signaling | Cat. #: 2764 RRID:AB_2228008 | WB (1:2000) |
| Antibody | Anti-FLAG (rabbit polyclonal) | Millipore | Cat. #: F7425 RRID:AB_439687 | WB (1:500) |
| Antibody | Sheep anti-mouse IgG (sheep polyclonal, HRP conjugated) | GE healthcare | Cat. #: NA931 RRID:AB_772210 | WB (1:5000) |
| Antibody | Donkey anti-rabbit IgG (donkey polyclonal, HRP conjugated) | GE healthcare | Cat. #: NA934 RRID:AB_772206 | WB (1:5000) |
| Antibody | Anti-Iba1 (rabbit polyclonal) | Wako | Cat. #: 019–19741 RRID:AB_839504 | IF (1:1000) |
| Antibody | Anti-Neurofilament 200 (Phos. and Non-Phos.) (mouse monoclonal) | Sigma-Aldrich | Cat. #: N0142 RRID:AB_477257 | IF (1:200) |
| Antibody | Anti-Phospho-c-Jun (Ser73) (D47G9) XP (rabbit monoclonal) | Cell signaling | Cat. #: 3270 RRID:AB_2129575 | IF (1:200) |
| Antibody | Anti-Cleaved Caspase-3 (Asp175) (rabbit polyclonal) | Cell signaling | Cat. #: 9661 RRID:AB_2341188 | IF (1:200) |
| Antibody | Anti-Calbindin (D1I4Q) XP (rabbit monoclonal) | Cell signaling | Cat. #: 13176 RRID:AB_2687400 | IF (1:500) |
| Antibody | Anti-Calbindin D-28k (mouse monoclonal) | Swant | Cat. #: 300 RRID:AB_10000347 | IF (1:500) |
| Antibody | Anti-GFAP (2.2B10) (rat monoclonal) | Thermo Fisher Scientific | Cat. #: 13–0300 RRID:AB_2532994 | IF (1:500) |
| Antibody | Anti-MAP2 (chicken polyclonal) | Abcam | Cat. #: ab5392 RRID:AB_2138153 | IF (1:500) |
| Antibody | Anti-Parvalbumin (guinea pig polyclonal) | Synaptic systems | Cat. #: 195004 RRID:AB_2156476 | IF (1:500) |
| Antibody | Anti-tdTomato (goat polyclonal) | SICGEN | Cat. #: AB8181-200 RRID:AB_2722750 | IF (1:500) |
| Antibody | Goat anti-mouse IgG (H+L) (goat polyclonal, Alexa Fluor 647 conjugated) | Invitrogen | Cat. #: A21236 RRID:AB_2535805 | IF (1:500) |
| Antibody | Goat anti-guinea Pig IgG (H+L) (goat polyclonal, Alexa Fluor 488 conjugated) | Invitrogen | Cat. #: A11073 RRID:AB_2534117 | IF (1:500) |
| Antibody | Goat anti-rabbit IgG (H+L) (goat polyclonal, Alexa Fluor 488 conjugated) | Invitrogen | Cat. #: A11008 RRID:AB_143165 | IF (1:500) |
| Antibody | Goat anti-rabbit IgG (H+L) (goat polyclonal, Alexa Fluor 647 conjugated) | Invitrogen | Cat. #: A21245 RRID:AB_2535813 | IF (1:500) |
| Antibody | Goat anti-mouse IgG (H+L) (goat polyclonal, Alexa Fluor 488 conjugated) | Invitrogen | Cat. #: A11001 RRID:AB_2534069 | IF (1:500) |
| Antibody | Goat anti-rat IgG (H+L) (goat polyclonal, Alexa Fluor 488 conjugated) | Invitrogen | Cat. #: A11006 RRID:AB_141373 | IF (1:500) |
| Antibody | Goat anti-chicken IgG (H+L) (goat polyclonal, Alexa Fluor 647 conjugated) | Invitrogen | Cat. #: A21449 RRID:AB_1500594 | IF (1:500) |
| Recombinant DNA reagent | pBT378-LSL-3X Flag-DLK-T2A-tdTomato (plasmid) | This paper | Construct Hipp11-DLK(iOE) mice | |
| Recombinant DNA reagent | pBT378-LSL-1X Flag-LZK-T2A-tdTomato (plasmid) | This paper | Construct Hipp11-LZK(iOE) mice | |
| Sequence-based reagent | sgRNA2-Fw | This paper | CACCGTGGCACTACAGGTCACATAC | |
| Sequence-based reagent | sgRNA2-Re | This paper | AAACGTATGTGACCTGTAGTGCCAC | |
| Sequence-based reagent | sgRNA5-Fw | This paper | CACCGGACCTCGTACAGCTGTCCGT | |
| Sequence-based reagent | sgRNA5-Re | This paper | AAACACGGACAGCTGTACGAGGTCC | |
| Sequence-based reagent | sgRNA12-Fw | This paper | CACCGACTCCAGTATAGCCTCGATG | |
| Sequence-based reagent | sgRNA12-Re | This paper | AAACCATCGAGGCTATACTGGAGTC | |
| Commercial assay or kit | SuperScript IV First-Strand Synthesis System | Invitrogen | 18091050 | |
| Commercial assay or kit | iQ SYBR Supermix | Bio-Rad | 170–8882 | |
| Commercial assay or kit | Surveyor Mutation Detection Kit | IDT | 706020 | |
| Commercial assay or kit | MEGAscript T7 Transcription Kit | Invitrogen | AMB13345 | |
| Commercial assay or kit | MEGAclear-96 Transcription Clean-Up Kit | Invitrogen | AM1909 | |
| Commercial assay or kit | H and E staining Kit | Abcam | ab245880 | |
| Commercial assay or kit | Pierce BCA protein assay kit | Thermo Fisher Scientific | 23225 | |
| Commercial assay or kit | DeadEnd Fluorometric TUNEL System | Promega | G3250 | |
| Software, algorithm | ImageJ software | ImageJ (https://imagej.net/) | RRID:SCR_003070 | |
| Software, algorithm | GraphPad Prism software | GraphPad Prism (http://www.graphpad.com/) | RRID:SCR_002798 | Version 6.0 |
| Software, algorithm | CFX Manager | CFX Manager (http://www.bio-rad.com/en-eh/product/cfx-manager-software) | RRID:SCR_017251 | |
| Software, algorithm | NDP.view2 Viewing software | Hamamatsu Photonics (https://www.hamamatsu.com/us/en/product/type/U12388-01/index.html) | RRID:SCR_017105 | |
| Other | DAPI stain | Invitrogen | D1306 | (14.3 μM) |
Table 1
Primers used in this study.
| Designation | 5’−3’ | PCR Products (bp) | Purpose |
|---|---|---|---|
| YJ12516 | CGACCTCAACTTGGATATCAGCC | 148 (Map2k7-L) 100 (Map2k7-S) | RT-PCR |
| YJ12517 | GGAGCTCTCTGAGGATGGTGAGC | ||
| YJ12518 | GCTTCTTTGCAGCTCCTTCGT | 201 (Actin) | RT-PCR |
| YJ12519 | CCTTCTGACCCATTCCCACC | ||
| YJ12520 | TGGAGGAGGACAAACTGGTCA | 323 (Wild-type) ~500 (Hipp11-DLK(iOE)) ~600 (Hipp11-LZK(iOE)) | Genotyping |
| YJ12521 | TTCCCTTTCTGCTTCATCTTGC | ||
| YJ12522 | CATATATGGGCTATGAACTAATGACCCCGT | ||
| YJ12523 | GATGATTGCTAGTCATGGAGTAGTAGG | 350 (Wild-type) 500 (Map3k12fl/fl) | Genotyping |
| YJ12524 | GGTGGTGTTATCATAGTTCCATCATG | ||
| YJ12525 | ACATCTGGATCTGAAGACAGCCAGG | ~500 (Wild-type) ~600 (Map3k13fl/fl) | Genotyping |
| YJ12526 | AGGTGCGTTTTCATTCTTCTGGACC | ||
| YJ12527 | GAGGTGTCTGCCGAACT | 370 (Wild-type) 470 (Celf2fl/fl) | Genotyping |
| YJ12528 | CACTCAGTCCCTGTTTGTAA | ||
| YJ12529 | TGGCAGTGTGGAGACAGAAG | 720 (Wild-type) 420 (Map3k13KO/KO) | Genotyping |
| YJ12530 | CCTACCTGCCTTTCCCGTTG | ||
| YJ12531 | TGCTCACCTGGGATCTGACTA | ||
| YJ12532 | TTAATACGACTCACTATAGGGTGGCACTACAGGTCACATAC | 121 | sgRNA2 PCR |
| YJ12535 | AAAAGCACCGACTCGGTGCC | ||
| YJ12533 | TTAATACGACTCACTATAGGGGACCTCGTACAGCTGTCCGT | 121 | sgRNA5 PCR |
| YJ12535 | AAAAGCACCGACTCGGTGCC | ||
| YJ12534 | TTAATACGACTCACTATAGGGACTCCAGTATAGCCTCGATG | 121 | sgRNA12 PCR |
| YJ12535 | AAAAGCACCGACTCGGTGCC | ||
| YJ12536 | GGCCCAGGCCCATTATTGTG | 83 (Map2k7-L) | qRT-PCR |
| YJ12537 | GTTGGCCAGTGGGAGTTGCAG | ||
| YJ12538 | GCCAAGCTGAAGCAGGAGAACC | 100 (Map2k7-S) | qRT-PCR |
| YJ12539 | CCAGTGGGAGTTGCAGGGTG |
Additional files
Download links
A two-part list of links to download the article, or parts of the article, in various formats.
Downloads (link to download the article as PDF)
Open citations (links to open the citations from this article in various online reference manager services)
Cite this article (links to download the citations from this article in formats compatible with various reference manager tools)
Activation of MAP3K DLK and LZK in Purkinje cells causes rapid and slow degeneration depending on signaling strength
eLife 10:e63509.
https://doi.org/10.7554/eLife.63509


