Promoter-specific changes in initiation, elongation, and homeostasis of histone H3 acetylation during CBP/p300 inhibition
- Molecular Biology Institute, UCLA, United States
- Department of Microbiology, UCLA, United States
Figures
Figure 1 with 1 supplement
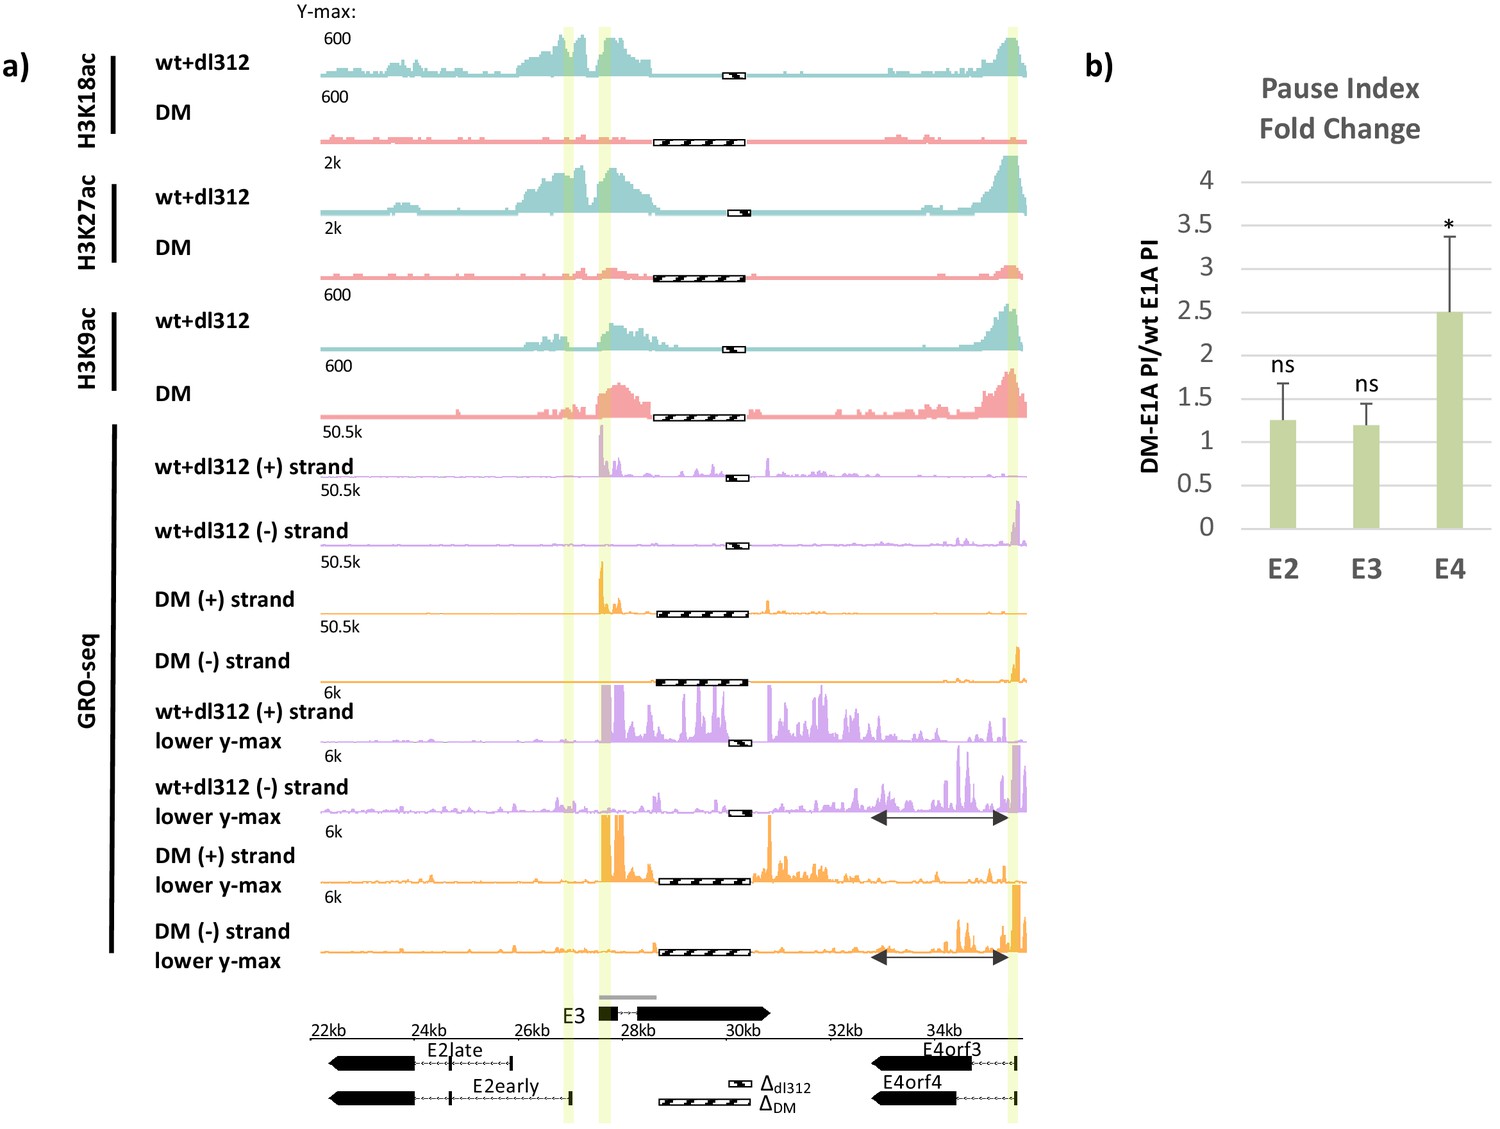
Promoter H3K18/27 acetylation activated by E1A activation domain (E1A-AD)-CBP/p300 interaction stimulates paused polymerase II (Pol2) release at adenovirus promoter E4.
(a, bottom) Map of the major human adenovirus 5 early E2, E3, and E4 mRNAs. Deletions in the E3 regions of dl312 and the E1A-DM vector are shown by cross-hatched horizontal bars. Shared E3 sequence used as the E3 gene body is indicated by the gray bar above E3. Vertical stripes highlighted in yellow indicate promoter-proximal regions. Global Run-On sequencing (GRO-seq) counts from primary human bronchial-tracheal epithelial cells infected with wt+dl312 or DM vectors at 12 hr post-infection were plotted on the Ad5 genome with H3K18ac, H3K27ac, and H3K9ac ChIP-seq data (Hsu et al., 2018). GRO-seq tracks are shown for the two viral DNA strands (+, transcribed to the right; and –, transcribed to the left), with two different y-axis scales to allow visualization of high- and low-amplitude peaks. The double-headed arrows in the GRO-seq plots in the E4 region refer to gene body regions discussed in the text. (b) Average fold change in pause index for E2early, E3, and E4 in cells expressing DM-E1A compared to wt E1A. Pause index is the ratio of reads in the promoter region (transcription start site [TSS] to +200) to reads in the gene body (+200 to TTS). Error bars represent standard deviation of three biological replicates. Paired t-test comparing wt E1A and DM-E1A for E2, E3, and E4. * indicates a significant difference (p-value<0.05) between cells expressing wt E1A and DM-E1A. ‘ns’ indicates no significant difference.
-
Figure 1—source data 1
qRT-PCR for E2early, E3, and E4 pre-mRNA transcripts in cells treated with DMSO or A-485.
- https://cdn.elifesciences.org/articles/63512/elife-63512-fig1-data1-v3.xlsx
Figure 1—figure supplement 1
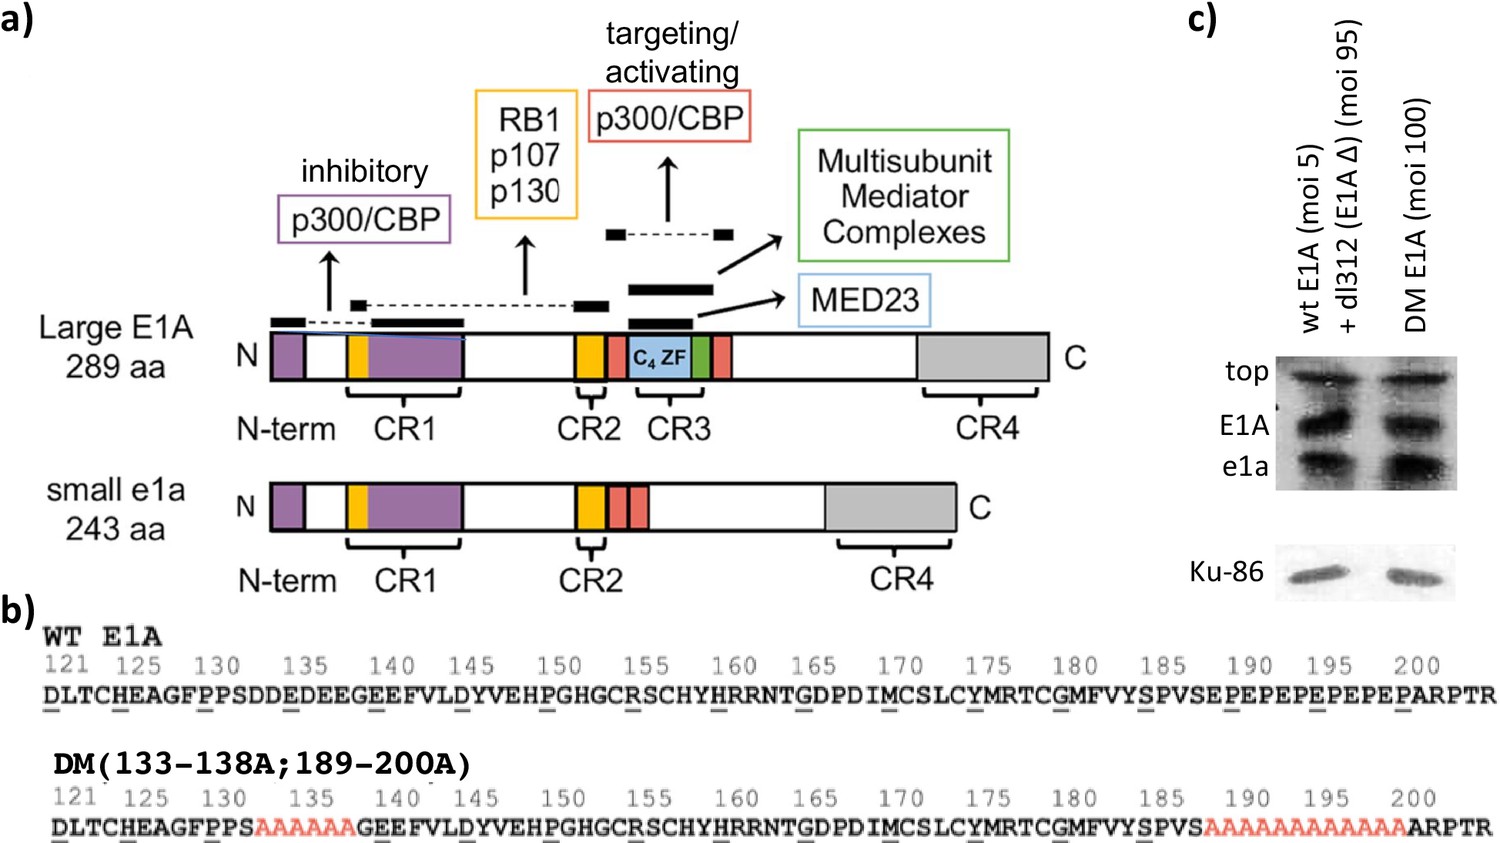
Small and large E1A protein interaction and E1A mutants.
(a) E1A interaction maps for large E1A (289 aa) and small e1a (243 aa). Colored portions and horizontal black bars above them represent regions of E1A that interact with the indicated cellular protein. Dashed lines connect conserved regions of E1A that bind the indicated targets together. Conserved regions (CR) 1–4 are indicated in brackets. (b) Sequences of Ad5 mutants from E1A (aa 121–223), with alanine substitutions in red. (c) Western blot showing wt and DM large E1A protein levels at 12 hr post-infection (p.i). Human bronchial-tracheal epithelial cells were coinfected with the wt E1A-expressing virus at an MOI (multiplicity of infection) of 5 and dl312 at an MOI (multiplicity of infection) of 95 or infected with the DM virus alone at an MOI (multiplicity of infection) of 100. Ku-86 protein levels were used as loading controls.
Figure 2
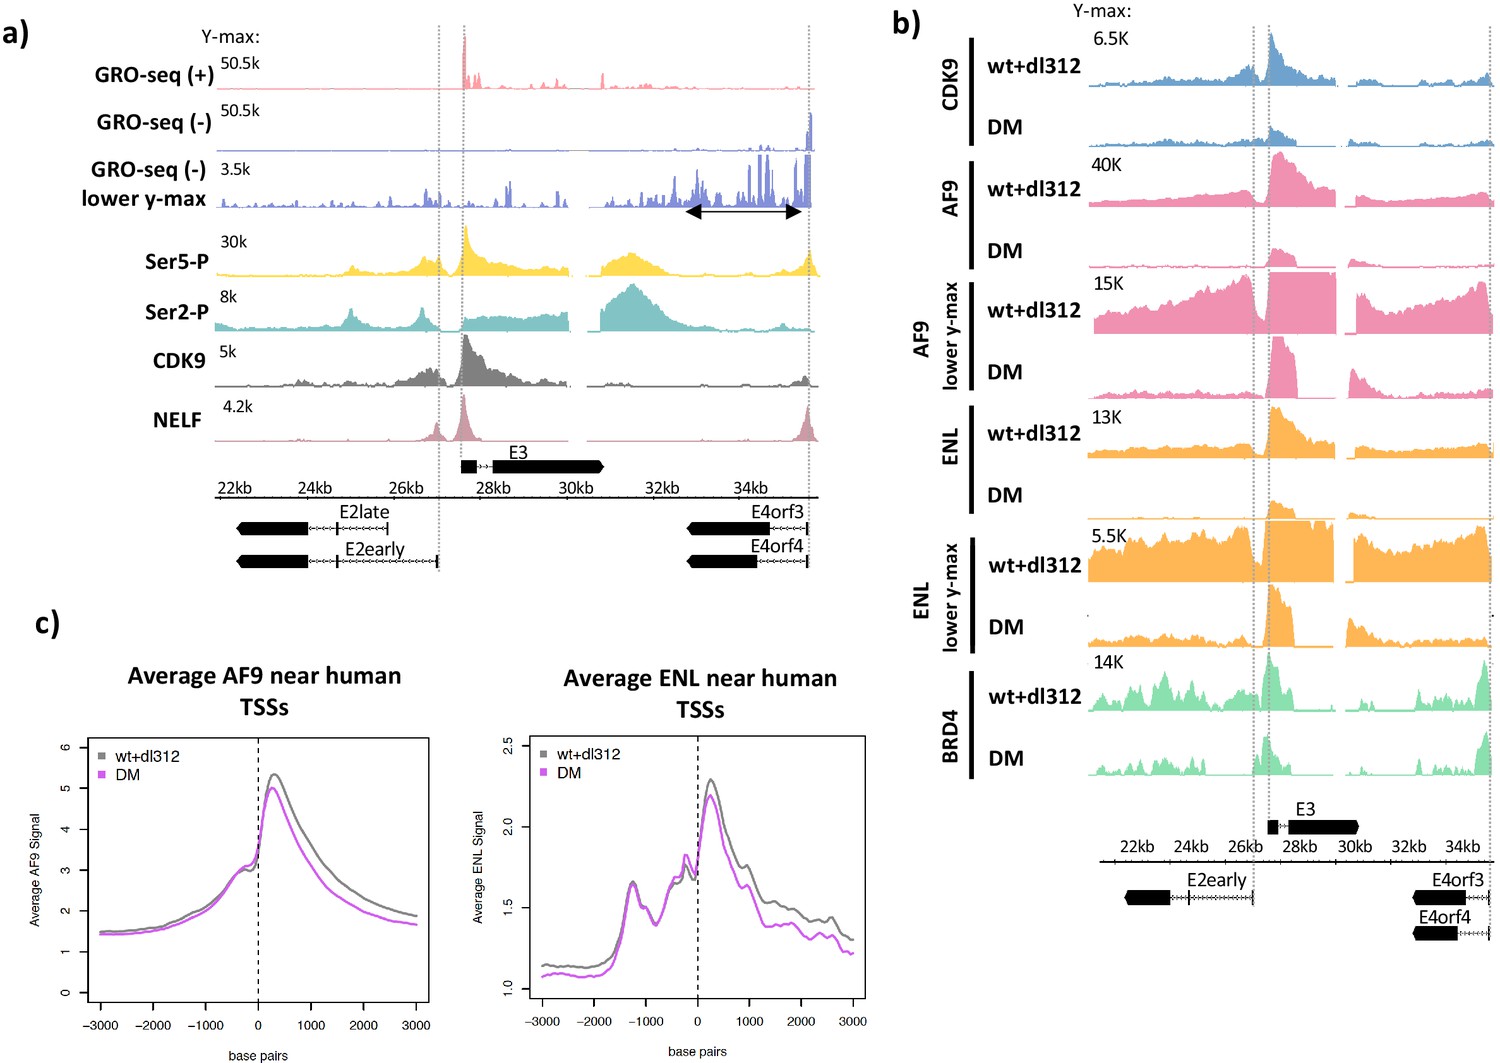
Ser5-P, Ser2-P, CDK9, negative elongation factor (NELF), and super-elongation complex (SEC) subunits on the Ad5 genome.
(a, top) Global Run-On sequencing in cells expressing wt E1A; (bottom) ChIP-seq of C-terminal domain (CTD) Ser5-P, CTD Ser2-P, CDK9, and NELF. (b) CDK9, AF9, ENL, and BRD4 ChIP-seq in cells expressing wt or DM E1A. AF9 and ENL ChIP-seq data are plotted with two different y-axes. (c) Average plots of AF9 and ENL binding near transcription start sites on the human genome.
Figure 3
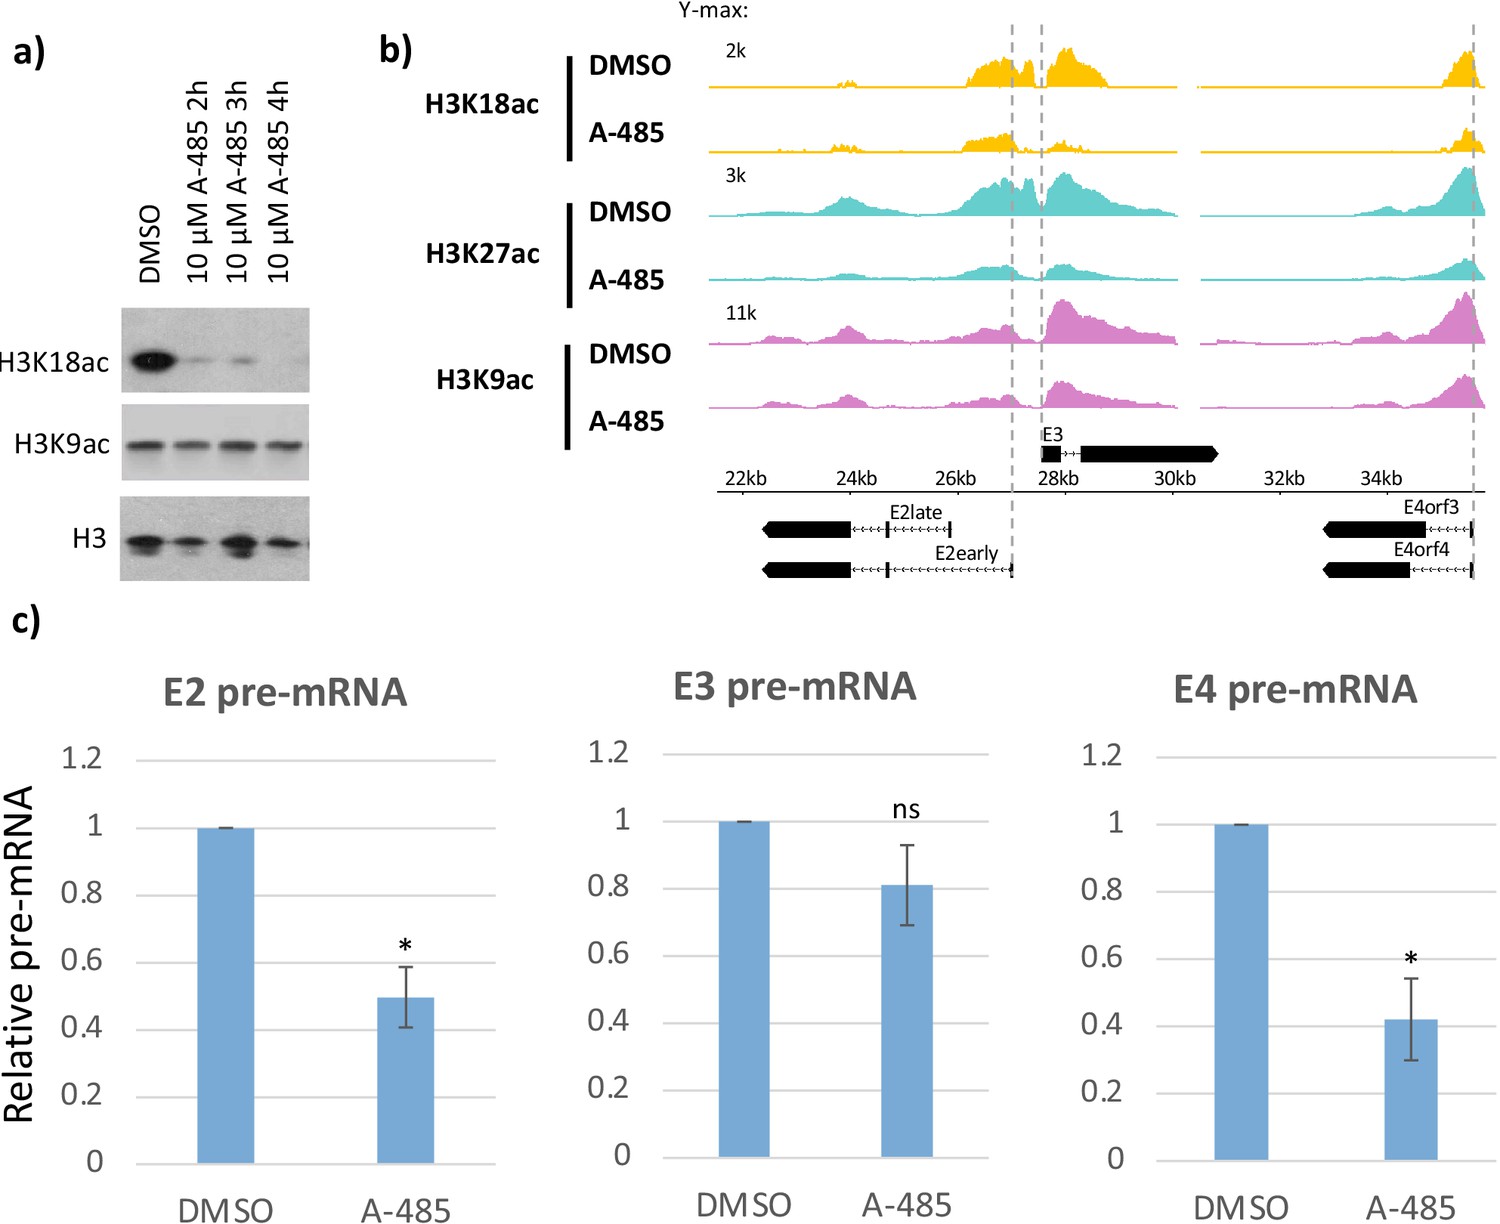
CBP/p300 histone acetyl transferase inhibitor A-485 causes H3 hypoacetylation and decreased early viral gene expression.
(a) Western blot for H3K18ac, H3K9ac, and total H3 in human bronchial-tracheal epithelial cells treated with control vehicle DMSO (dimethyl sulfoxide) or 10 µM A-485 after 2, 3, or 4 hr. (b) H3K18ac, H3K27ac, and H3K9ac ChIP-seq at early viral promoters in cells treated with control vehicle DMSO (dimethyl sulfoxide) or 10 µM A-485 for 2 hr. (c) qRT-PCR for E2early, E3, and E4 pre-mRNA transcripts in cells treated with DMSO (dimethyl sulfoxide) or 10 µM A-485 for 2 hr. Averages and standard deviations shown for three successive experiments. Paired t-test, *p<0.05 between cells treated with DMSO (dimethyl sulfoxide) and A-485. ‘ns’ indicates no significant difference between cells treated with DMSO (dimethyl sulfoxide) and A-485.
-
Figure 3—source data 1
Average fold change in pause index for E2early, E3, and E4 in cells expressing wt E1A compared to DM E1A.
- https://cdn.elifesciences.org/articles/63512/elife-63512-fig3-data1-v3.xlsx
Figure 4
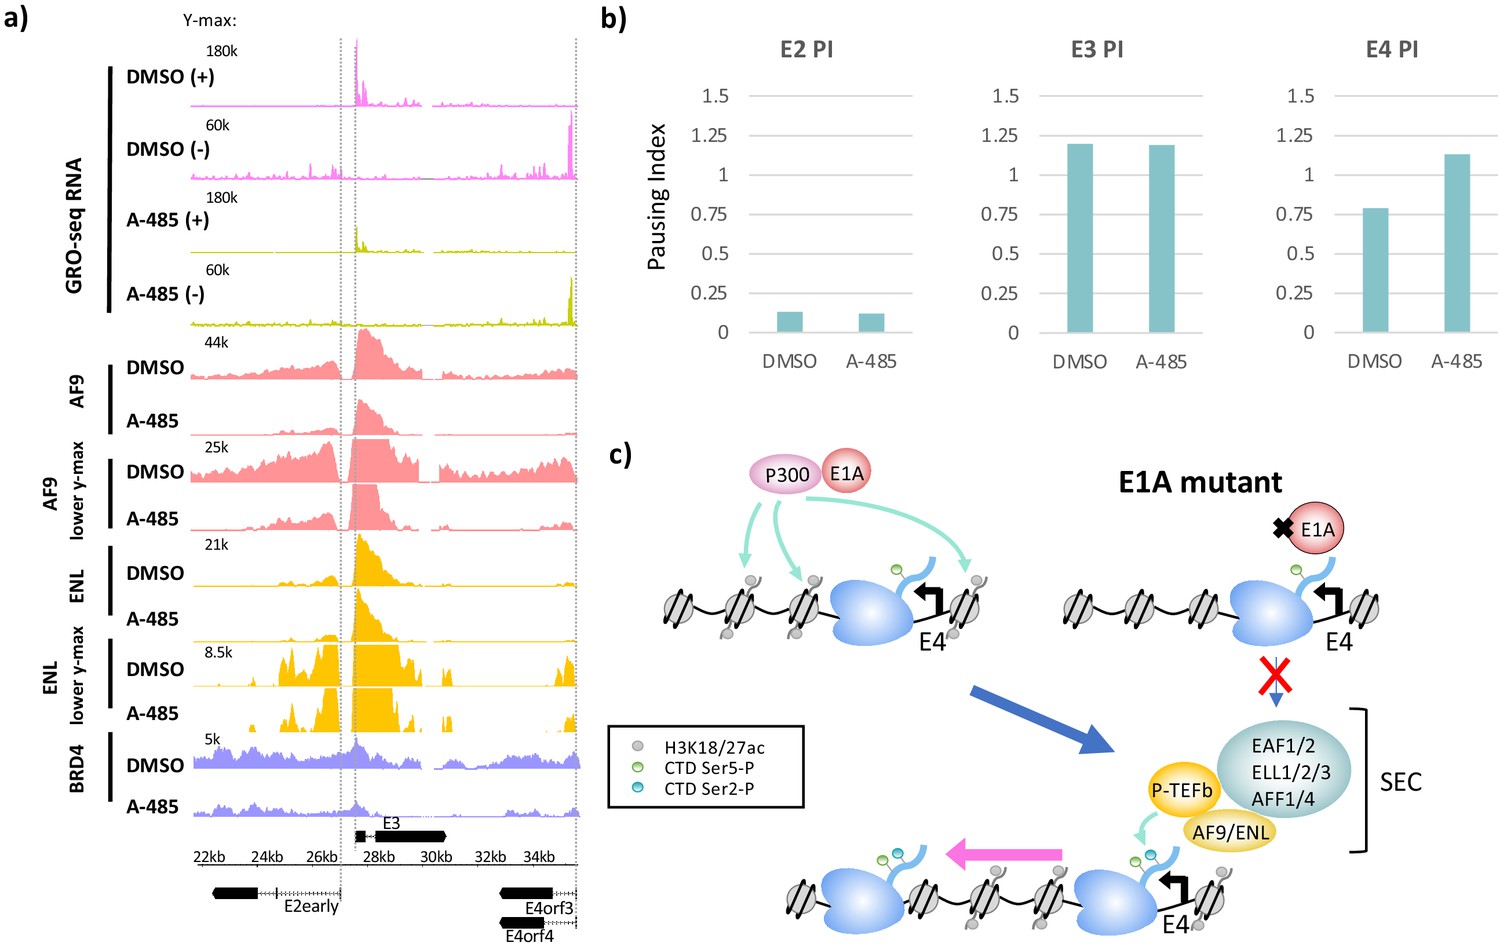
CBP/p300 histone acetyl transferase inhibition by A-485 results in defective polymerase II pause release and decreased super-elongation complex (SEC) and BRD4 association at E4.
(a) Global Run-On sequencing (GRO-seq) in cells expressing wt E1A treated with DMSO (dimethyl sulfoxide) or 10 µM A-485 for 2 hr. GRO-seq tracks are plotted with ChIP-seq for AF9, ENL, and BRD4 in cells treated with DMSO (dimethyl sulfoxide) or 10 µM A-485 for 2 hr. Both AF9 and ENL ChIP-seq tracks are shown with two different y-axes. (b) Pause indexes for E2early, E3, and E4 in cells treated with DMSO (dimethyl sulfoxide) versus A-485. (c) Model for regulation of E4 elongation by SEC recognition of CBP/p300-E1A-mediated H3K18/27ac.
-
Figure 4—source data 1
Pause indexes for E2early, E3, and E4 in cells treated with DMSO compared to A-485 treated cells.
- https://cdn.elifesciences.org/articles/63512/elife-63512-fig4-data1-v3.xlsx
Figure 5 with 3 supplements
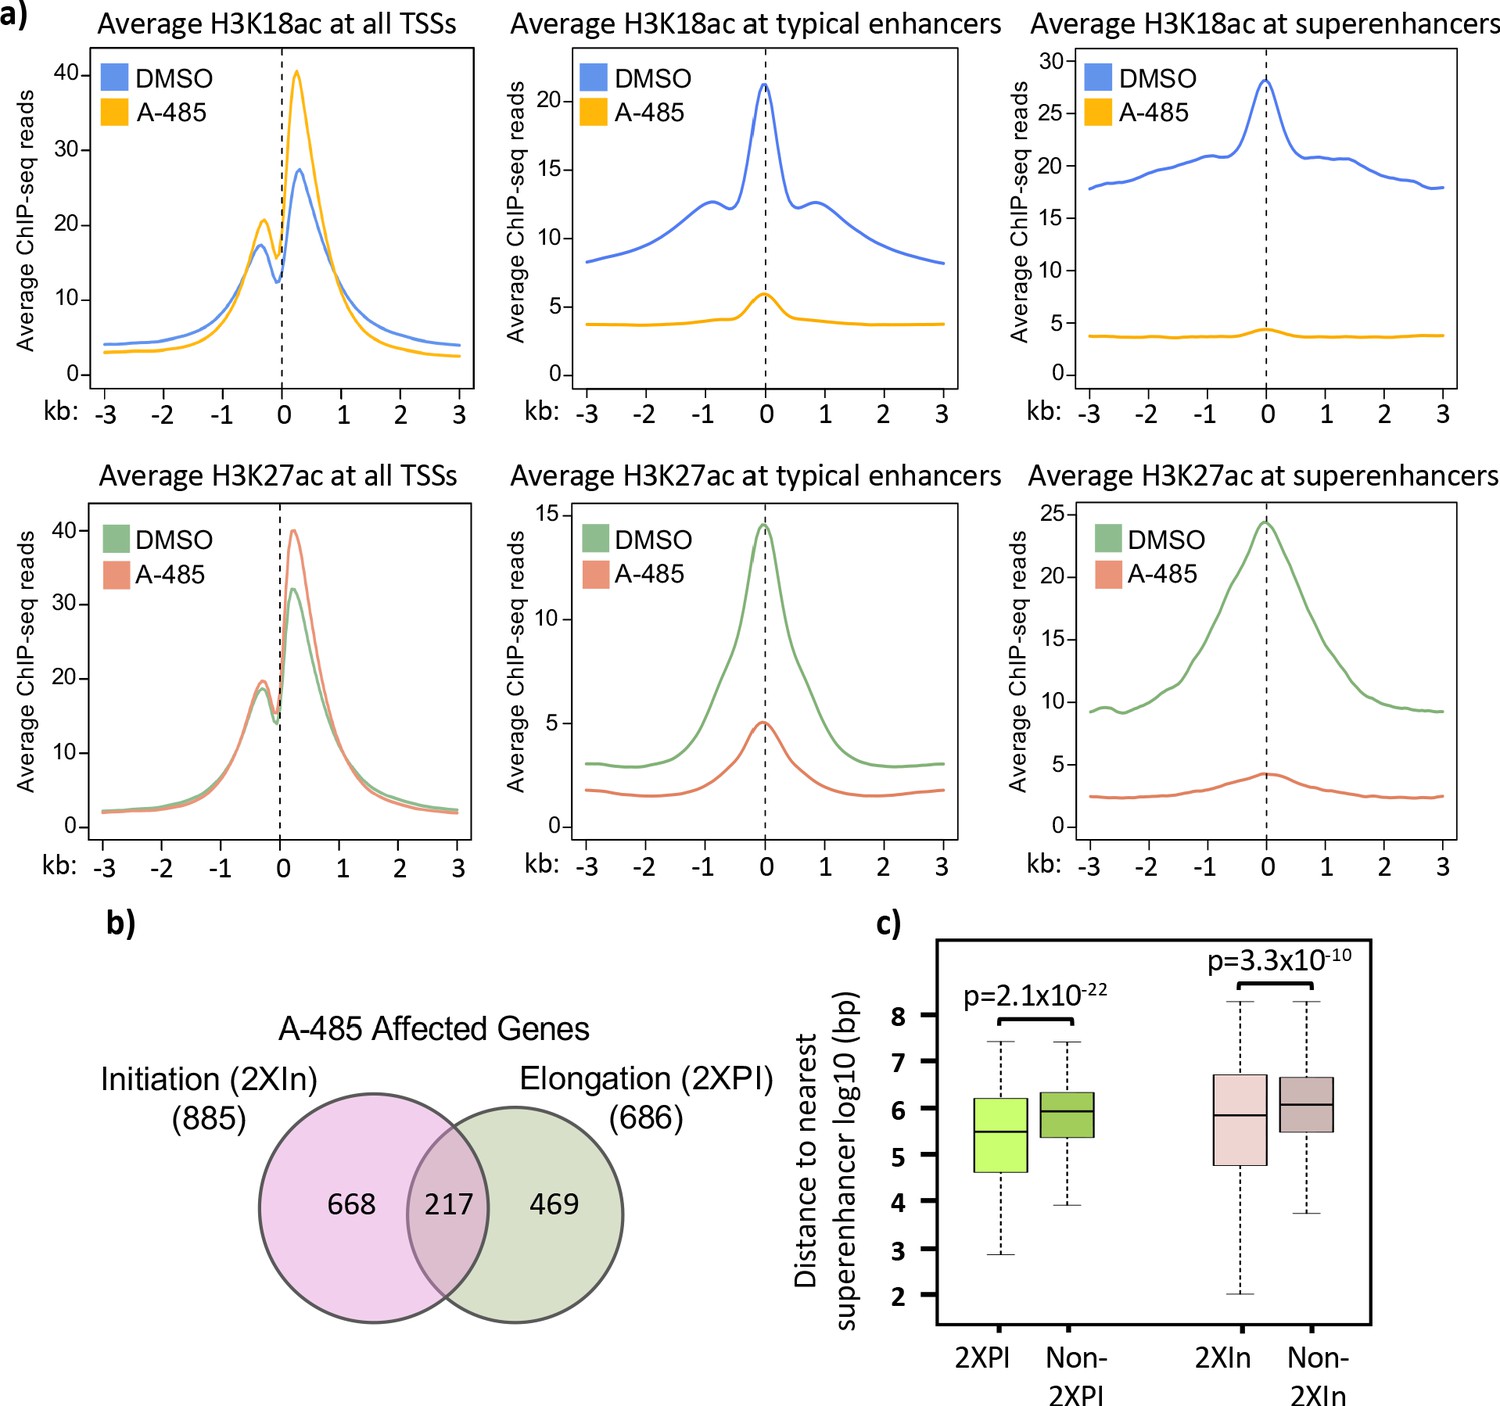
Treatment with A-485 causes different effects on H3K18/27ac at promoters and enhancers and results in defects in both initiation and elongation.
(a) Plots of average H3K18ac and H3K27ac signals at all human transcription start sites (TSSs), typical enhancers, and at super-enhancers in primary cells treated with A-485 or DMSO (dimethyl sulfoxide). (b) Venn diagram showing number of protein-coding genes with defects during transcription by A-485 during initiation (greater than twofold decrease in counts in the promoter region) and elongation (greater than twofold increase in pausing index). (c) Boxplots showing distributions of distances (log10 bp) from the nearest super-enhancer to the TSS for 2XPI genes and 2Xin genes versus the same numbers of genes without defects in transcription after A-485. p-Values are from two-sided t-test.
-
Figure 5—source data 1
Lists of all active genes, 2XPI, and 2XIn genes.
- https://cdn.elifesciences.org/articles/63512/elife-63512-fig5-data1-v3.xlsx
Figure 5—figure supplement 1

Average H3K9ac and BRD4 peaks at typical and super-enhancers and TATA box motifs in promoter regions.
(a) Average H3K9ac and BRD4 at typical enhancers and super-enhancers in cells treated with DMSO (dimethyl sulfoxide) or A-485 treatment. (b) Percentage of genes with consensus TATA boxes in all active genes, 2XPI, and 2XIn genes. * indicates a statistically significant difference (two-sided t-test) compared to the average for all active promoters.
Figure 5—figure supplement 2
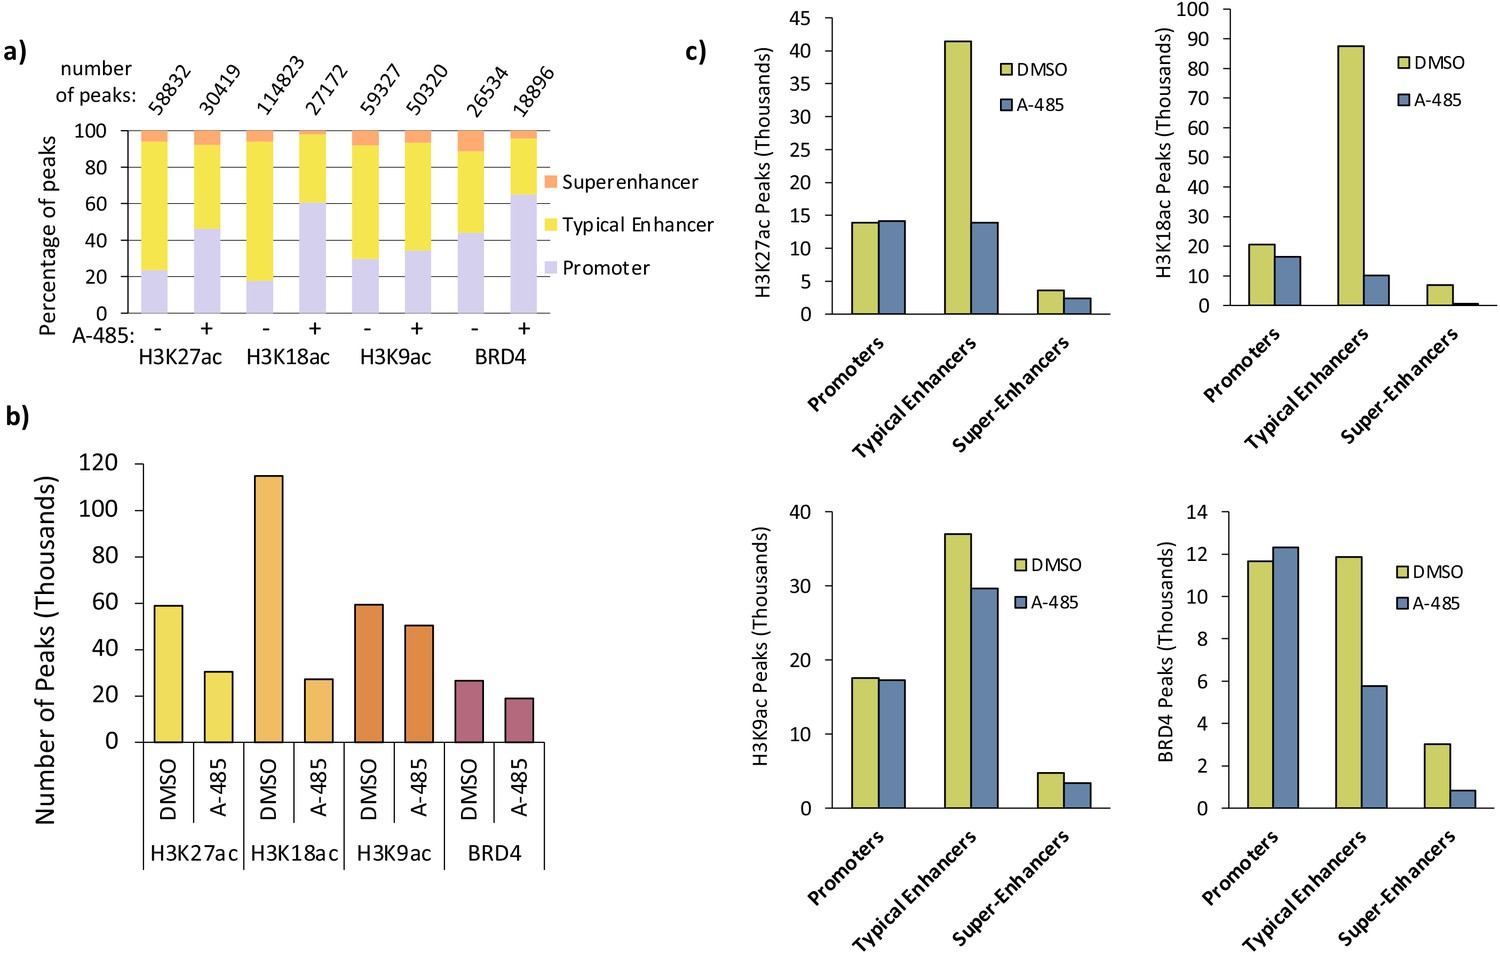
Distribution of H3K27ac, H3K18ac, and H3K9ac, and BRD4 peaks at promoters, typical enhancers, and super-enhancers.
(a) Percentage of H3K27ac, H3K18ac, H3K9ac, and BRD4 peaks called in indicated annotated regions from DMSO versus A-485-treated cells. (b) Total number of H3K27ac, H3K18ac, H3K9ac, and BRD4 peaks observed by ChIP-seq. See Experimental procedures for the method for determining the numbers and positions of peaks across the human genome from ChIP-seq data. (c) Number of H3K27ac, H3K18ac, and H3K9ac and BRD4 peaks at promoters, typical enhancers, and super-enhancers.
-
Figure 5—figure supplement 2—source data 1
Percentage of H3K27ac, H3K18ac, H3K9ac, and BRD4 peaks called in indicated annotated regions from DMSO versus A-485 treated cells.
- https://cdn.elifesciences.org/articles/63512/elife-63512-fig5-figsupp2-data1-v3.xlsx
-
Figure 5—figure supplement 2—source data 2
Total number of H3K27ac, H3K18ac, H3K9ac,and BRD4 peaks in cells treated with DMSO versus A-485 treated cells as observed by ChIP-seq.
- https://cdn.elifesciences.org/articles/63512/elife-63512-fig5-figsupp2-data2-v3.xlsx
Figure 5—figure supplement 3

Promoter motifs and gene ontologies of 2XPI and 2Xin genes.
(a) Motif analysis of promoter-proximal de novo motifs in 2XPI and 2Xin genes. (b) Gene ontology of 2XPI and 2Xin genes.
-
Figure 5—figure supplement 3—source data 1
Promoter proximal de novo motifs and gene ontology of 2XPI and 2XIn genes.
- https://cdn.elifesciences.org/articles/63512/elife-63512-fig5-figsupp3-data1-v3.xlsx
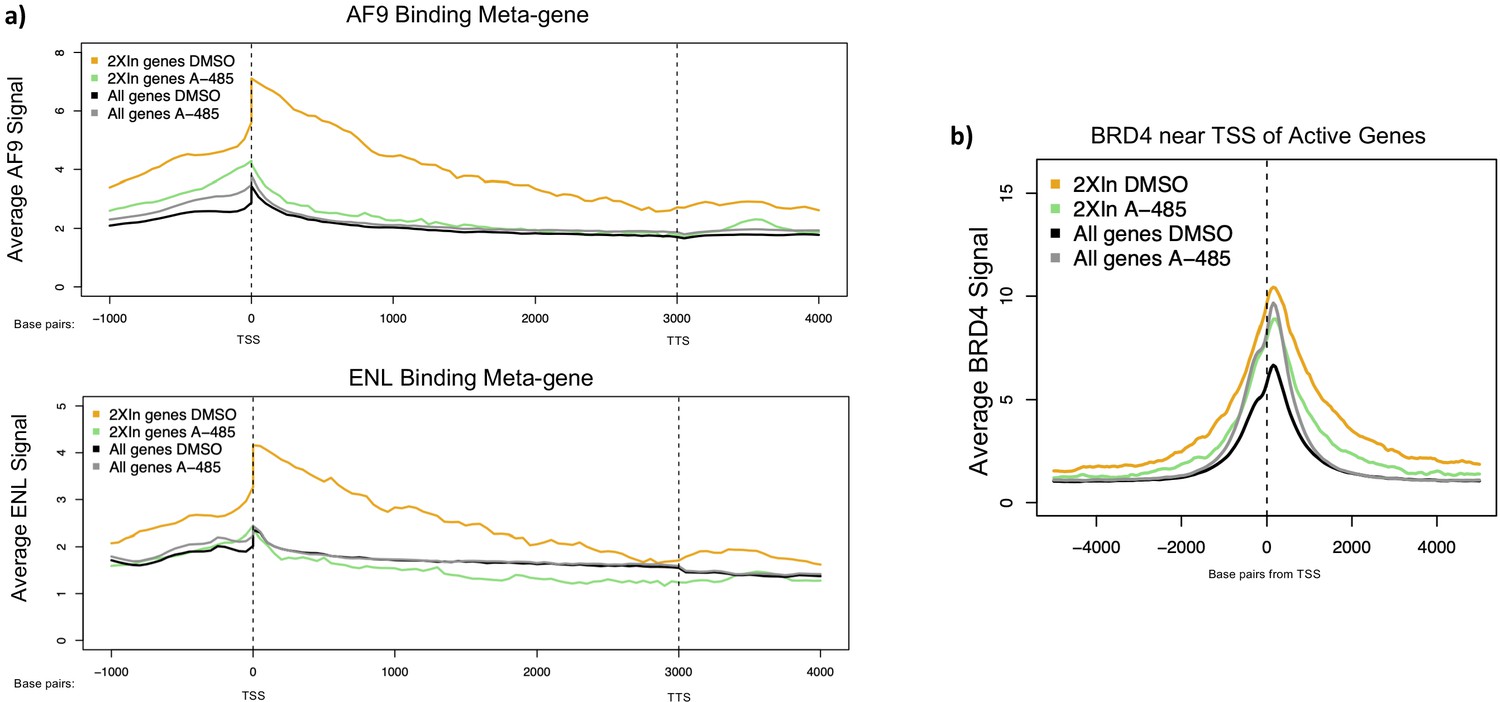
Figure 6 with 1 supplement

A-485-sensitive promoter H3K18/27ac and high super-elongation complex association at 2XPI genes.
(a) Average H3K18ac, H3K27ac, and H3K9ac near transcription start sites (TSSs) for all active genes, 2XPI genes, and 2Xin genes after DMSO (dimethyl sulfoxide) or A-485 treatment. (b) Metagene plots of AF9 and ENL ChIP-seq counts across all active genes and 2XPI genes after DMSO (dimethyl sulfoxide) or A-485 treatment. (c) Average BRD4 near TSSs for all active genes and 2XPI genes after DMSO (dimethyl sulfoxide) or A-485 treatment.
Figure 6—figure supplement 1
Average AF9, ENL, and BRD4 binding in 2XIn genes in cells treated with DMSO or A-485.
(a) Metagene plots of AF9 and ENL ChIP-seq counts across 2XPI genes in cells treated with DMSO (dimethyl sulfoxide) or A-485 treatment. (b) Average BRD4 binding near transcription start sites of 2XIn genes in cells treated with DMSO (dimethyl sulfoxide) or A-485.
Figure 7 with 4 supplements
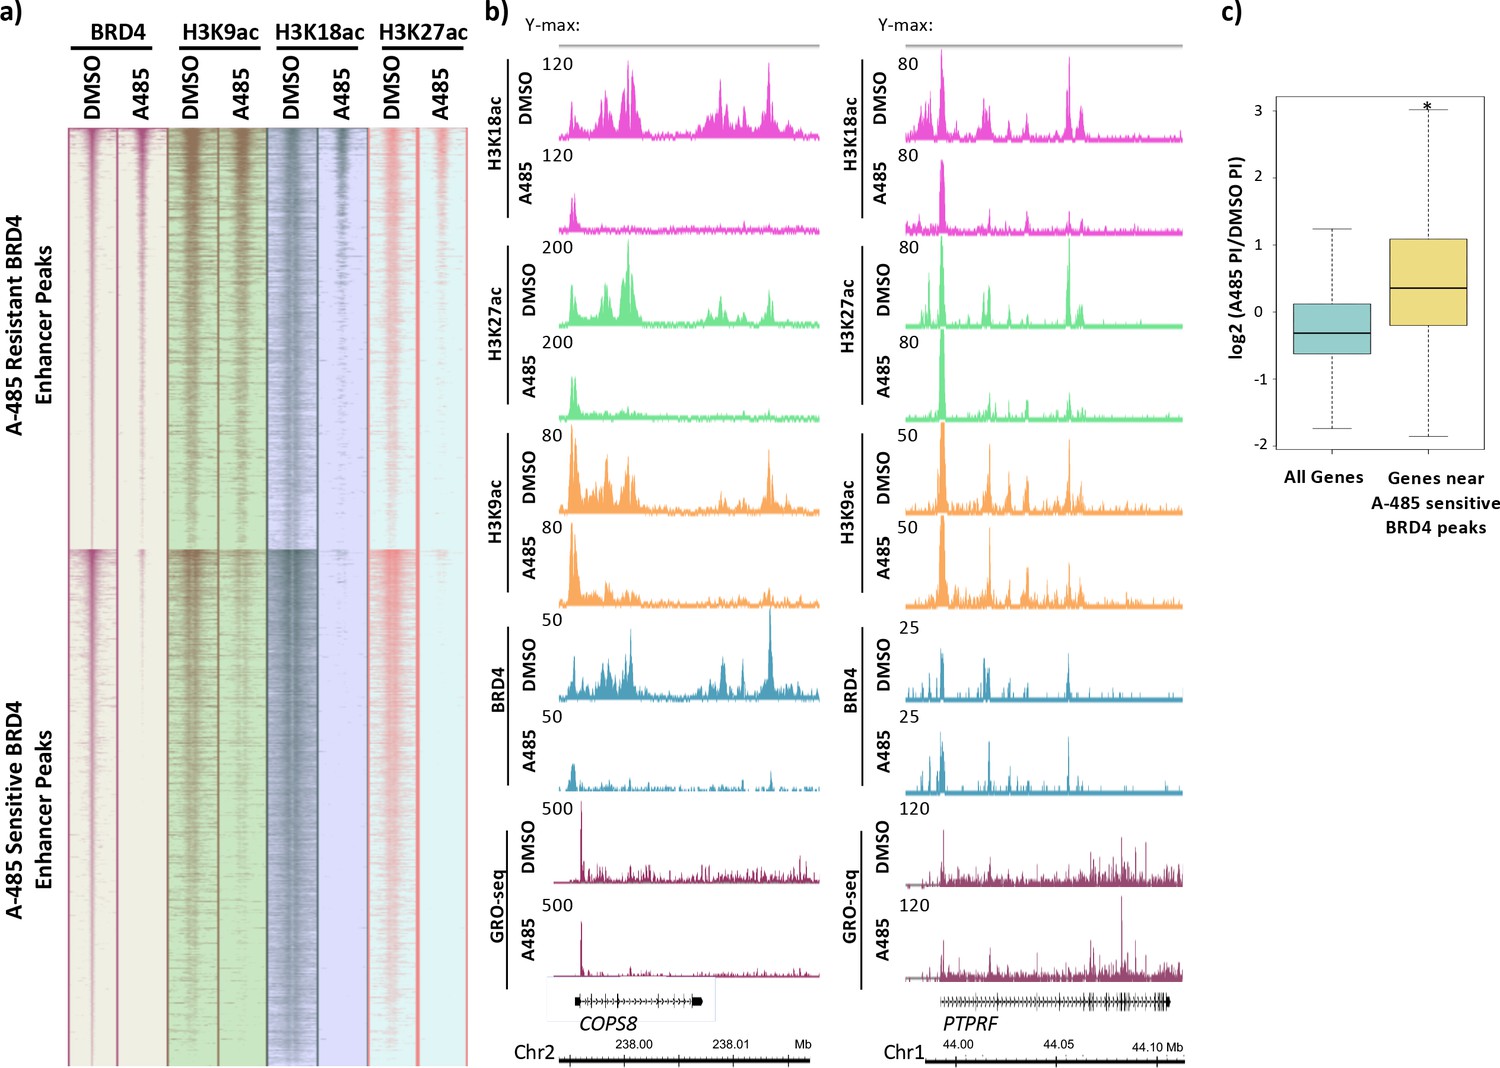
BRD4 enhancer binding stimulates pause release at nearby genes.
(a) Heatmaps of BRD4, H3K9ac, H3K18ac, and H3K27ac ChIP-seq data. BRD4 enhancer peaks are divided into those that are A-485-resistant (top cluster) or A-485-sensitive (bottom cluster). (b) Gene browser plots of ChIP-seq data for the indicated histone modifications and BRD4, and GRO-seq counts for regions including the COPS8 (left) and PTPRF (right) genes. (c) Boxplots comparing the change in pausing index (PI) after A-485 treatment (log2 (A-485 PI/DMSO PI)) for all genes versus genes near A-485-sensitive enhancer BRD4 peaks. *p<0.05, two-sided t-test.
Figure 7—figure supplement 1
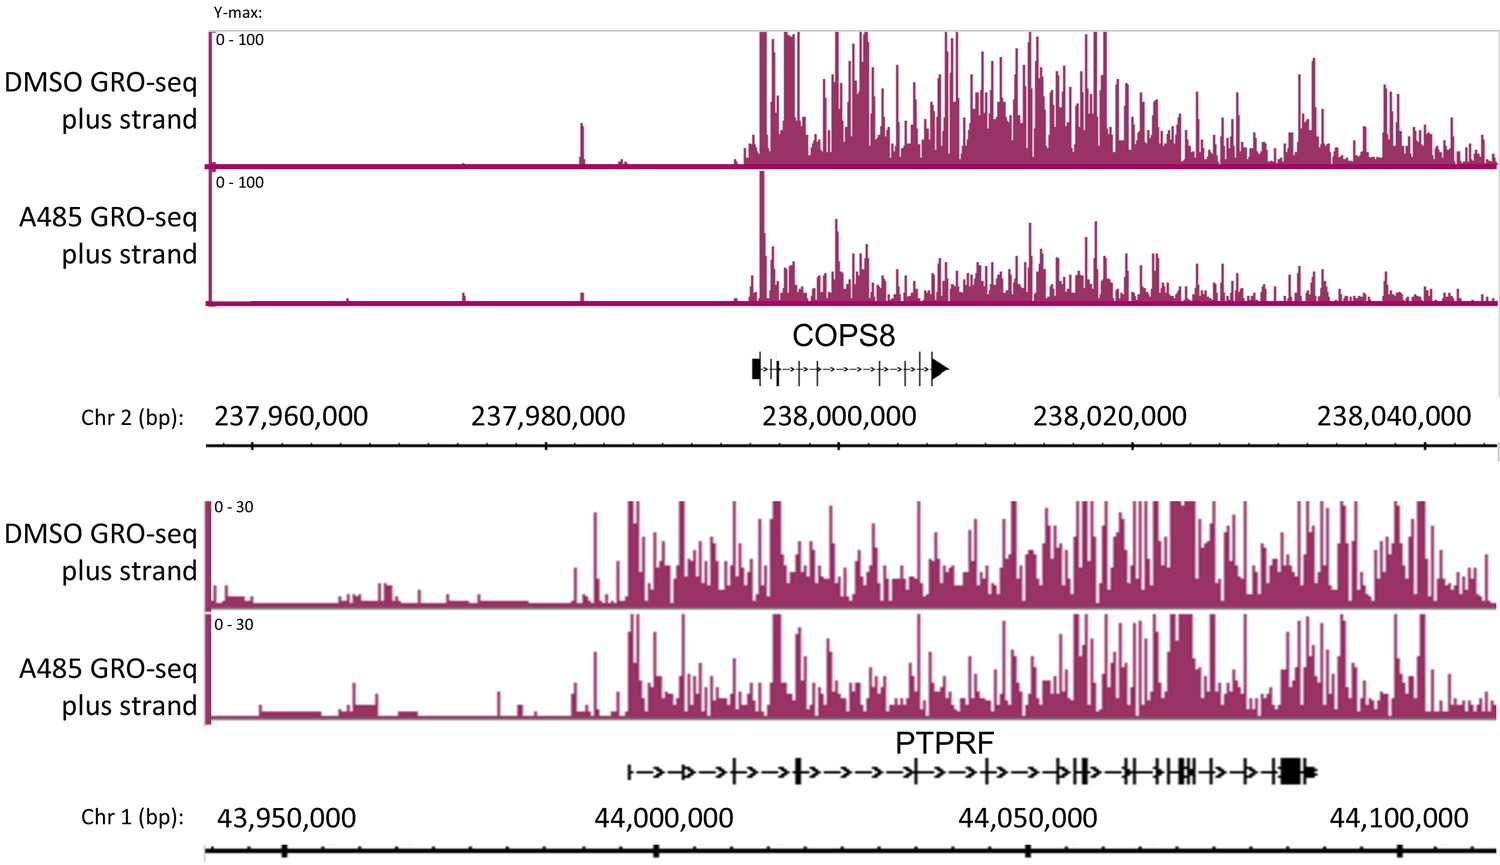
Global Run-On sequencing counts plotted with low ymax to show the relative level in the gene bodies of COPS8 and PTPRF in response to A-485.
Figure 7—figure supplement 2
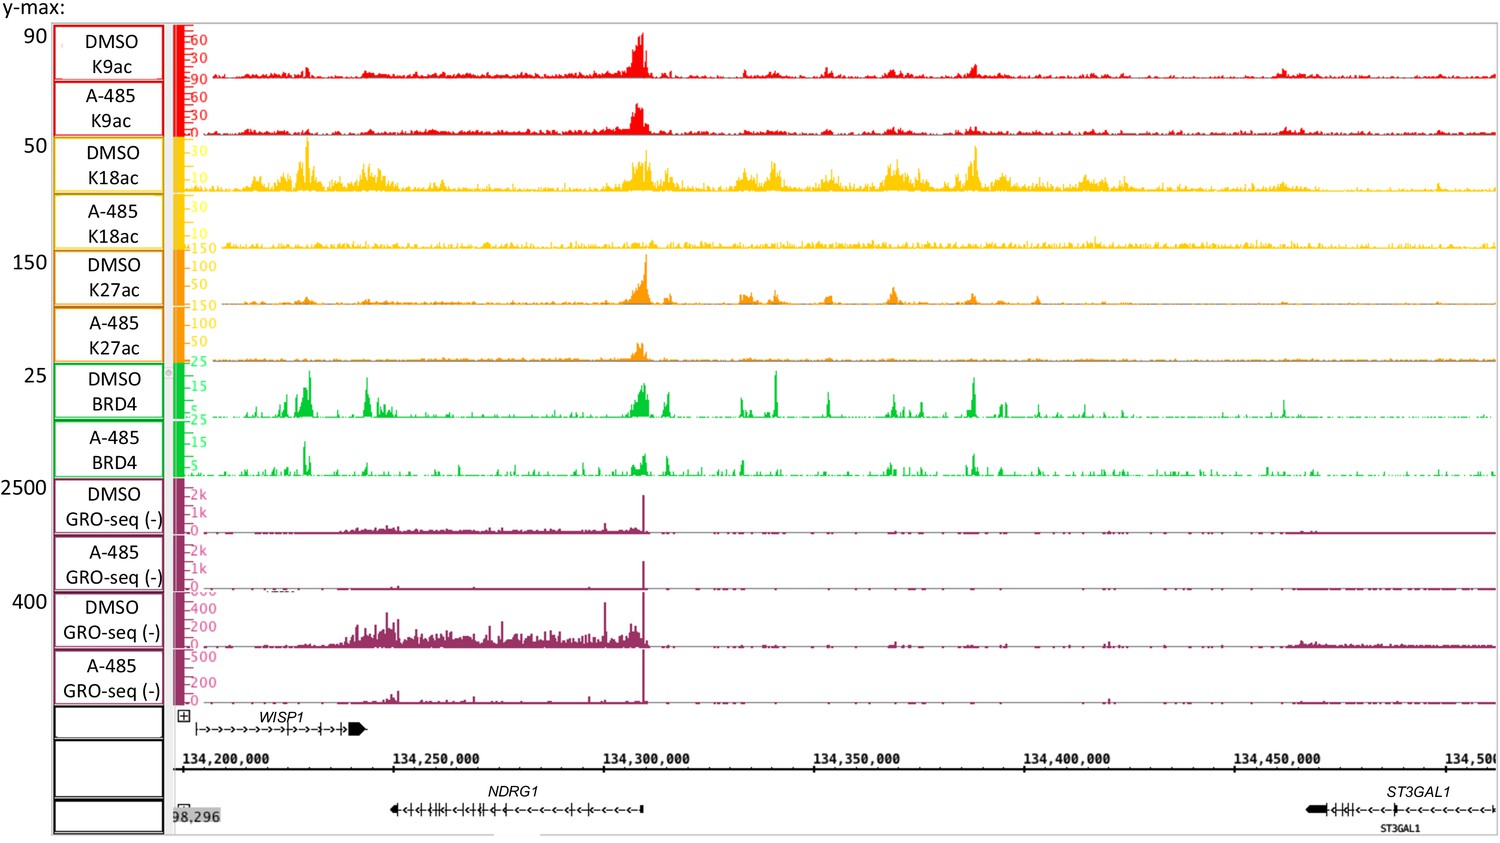
Global Run-On sequencing counts plotted with high and low ymax to show the relative level of paused polymerase II near the transcription start site in A-485-treated and control DMSO-treated cells (observed in plot with ymax = 2500) and in the gene body of the NDRG1 gene (best observed at ymax = 400).
Figure 7—figure supplement 3
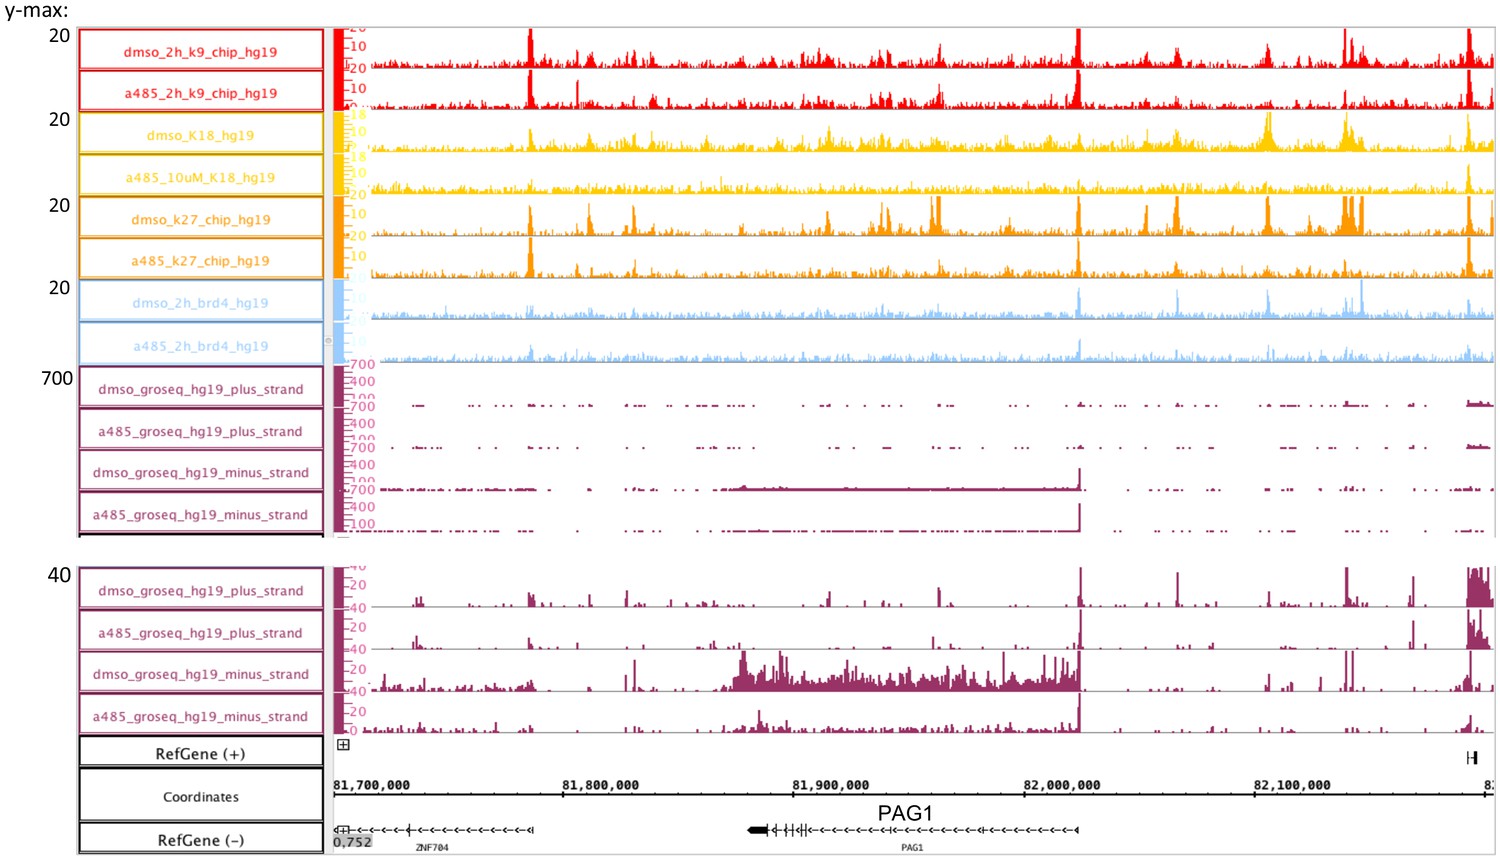
A-485 inhibited polymerase II (Pol2) release from the PAG1 promoter-proximal pause site, but not Pol2 initiation and transcription to the PAG1 pause site.
Figure 7—figure supplement 4
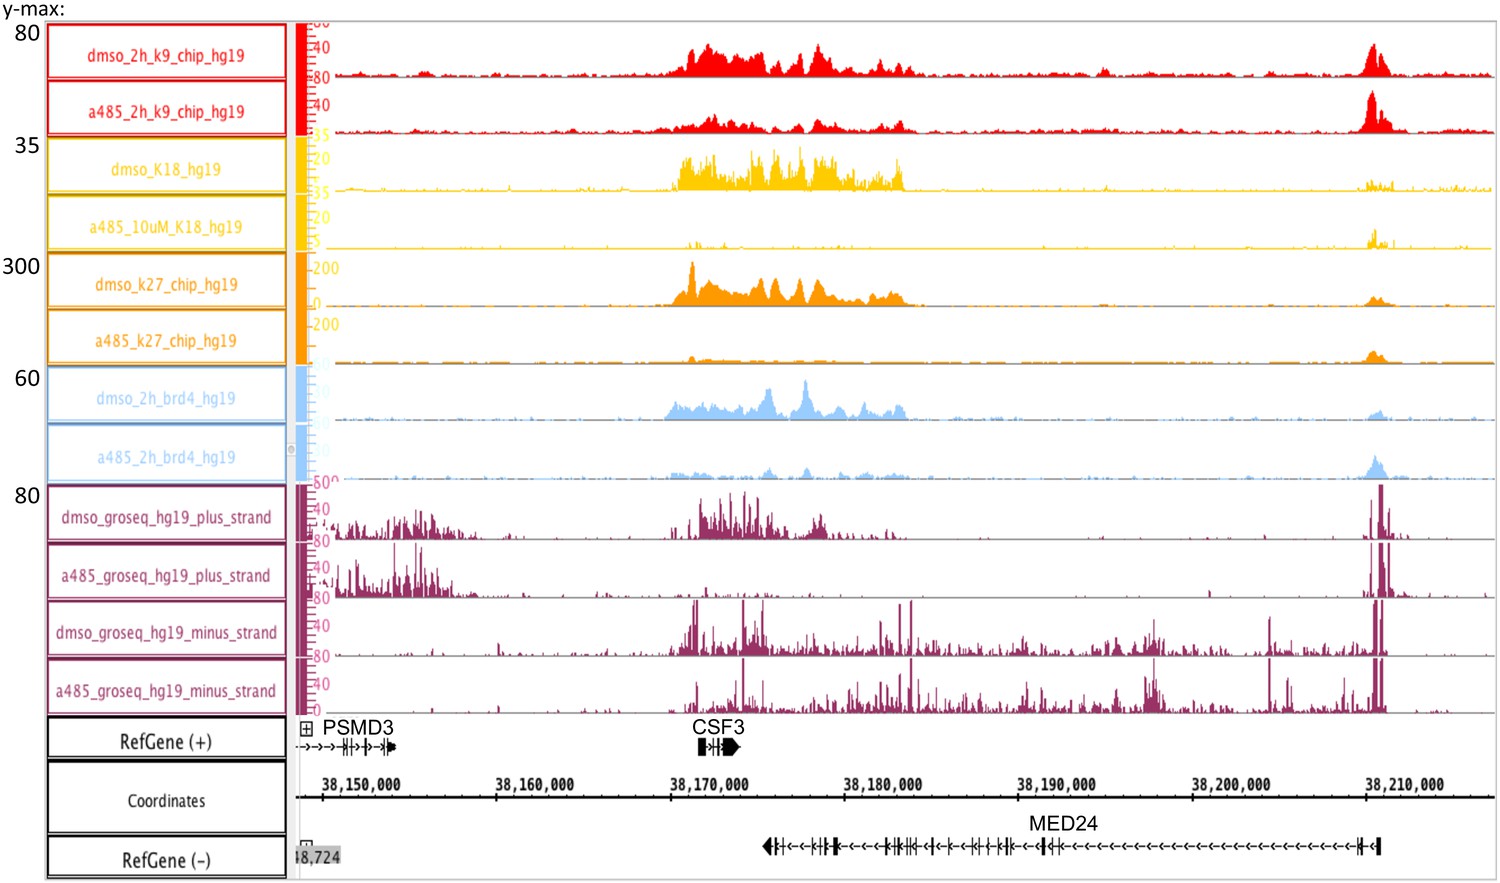
A-485 inhibition of transcription initiation of CSF3, but not PSMD3, to the left also transcribed from the plus strand, or MED24 to the right, transcribed from the minus strand.
Tables
Key resources table
| Reagent type (species) or resource | Designation | Source or reference | Identifiers | Additional information |
|---|---|---|---|---|
| Cell line (human) | HBTEC (human bronchial/tracheal epithelial cells, primary) | Lifeline Cell Technology | FC-0035 | |
| Other | Ad5 mutant vector wt E1A | Constructed as previously described (Hsu et al., 2018) | PMID:29976669 | |
| Other | Ad5 mutant vector DM E1A | Constructed as previously described (Hsu et al., 2018) | PMID:29976669 | |
| Antibody | H3K18ac (rabbit polyclonal) | Prepared and validated as described previously (Ferrari et al., 2012) | PMID:22499665 WB (1:2000) ChIP-seq (2 μL/ChIP) | |
| Antibody | H3K9ac (rabbit polyclonal) | Millipore | 07-352 | WB (1:1000) ChIP-seq (2 μL/ChIP) |
| Antibody | H3K27ac (rabbit polyclonal) | Active Motif | 39133 | ChIP-seq (5 μL/ChIP) |
| Antibody | H3 (mouse monoclonal) | Abcam | ab10799 | WB (1:10,000) |
| Antibody | AF9 (rabbit polyclonal) | Genetex | GTX102835 | ChIP-seq (2 μL/ChIP) |
| Antibody | ENL/MLLT1 (rabbit monoclonal) | Cell Signaling | 14893 | ChIP-seq (10 μL/ChIP) |
| Antibody | BRD4 (rabbit polyclonal) | Bethyl | A301-985A50 | ChIP-seq (2 μL/ChIP) |
| Antibody | NELF TH1L (D5G6W) (rabbit monoclonal) | Cell Signaling | 12265S | ChIP-seq (7 μL/ChIP) |
| Antibody | Pol2 Ser2-P (31Z3G) (rabbit monoclonal) | Cell Signaling | 13499 | ChIP-seq (10 μL/ChIP) |
| Antibody | Pol2 Ser5-P (D9N5I) (rabbit monoclonal) | Cell Signaling | 13523 | ChIP-seq (10 μL/ChIP) |
| Antibody | CDK9 (C12F7) (rabbit monoclonal) | Cell Signaling | 2316 | ChIP-seq (10 μL/ChIP) |
| Antibody | BrdU antibody, agarose conjugated | Santa Cruz Biotechnology | sc-32323 AC | 50 μL/IP |
| Commercial assay, kit | TruSeq Small RNA Library Preparation Kit | Illumina | RS-200–0012 | |
| Commercial assay, kit | KAPA Hyper Prep kit | KAPA Biosystems | KK8504 | |
| Commercial assay, kit | NEXTflex ChIP-seq barcodes | Bio Scientific | NOVA-514120 | |
| Chemical compound, drug | A-485 | MedChemExpress | HY-107455 | |
| Software, algorithm | HISTAT2 | HISTAT2 | PMID:31375807 | |
| Software, algorithm | HTseq | HTseq | PMID:25260700 | |
| Software, algorithm | Homer | Homer | PMID:20513432 | |
| Software, algorithm | Bowtie2 | Bowtie2 | PMID:22388286 | |
| Software, algorithm | MACS2 | MACS2 | PMID:18798982 | |
| Software, algorithm | CEAS | CEAS | PMID:19689956 |
Additional files
Download links
A two-part list of links to download the article, or parts of the article, in various formats.
Downloads (link to download the article as PDF)
Open citations (links to open the citations from this article in various online reference manager services)
Cite this article (links to download the citations from this article in formats compatible with various reference manager tools)
Promoter-specific changes in initiation, elongation, and homeostasis of histone H3 acetylation during CBP/p300 inhibition
eLife 10:e63512.
https://doi.org/10.7554/eLife.63512


