Molecular structures of the eukaryotic retinal importer ABCA4
- Laboratory of Membrane Biology and Biophysics, The Rockefeller University, United States
- Tri-Institutional Training Program in Chemical Biology, United States
- Howard Hughes Medical Institute, United States
Figures
Figure 1
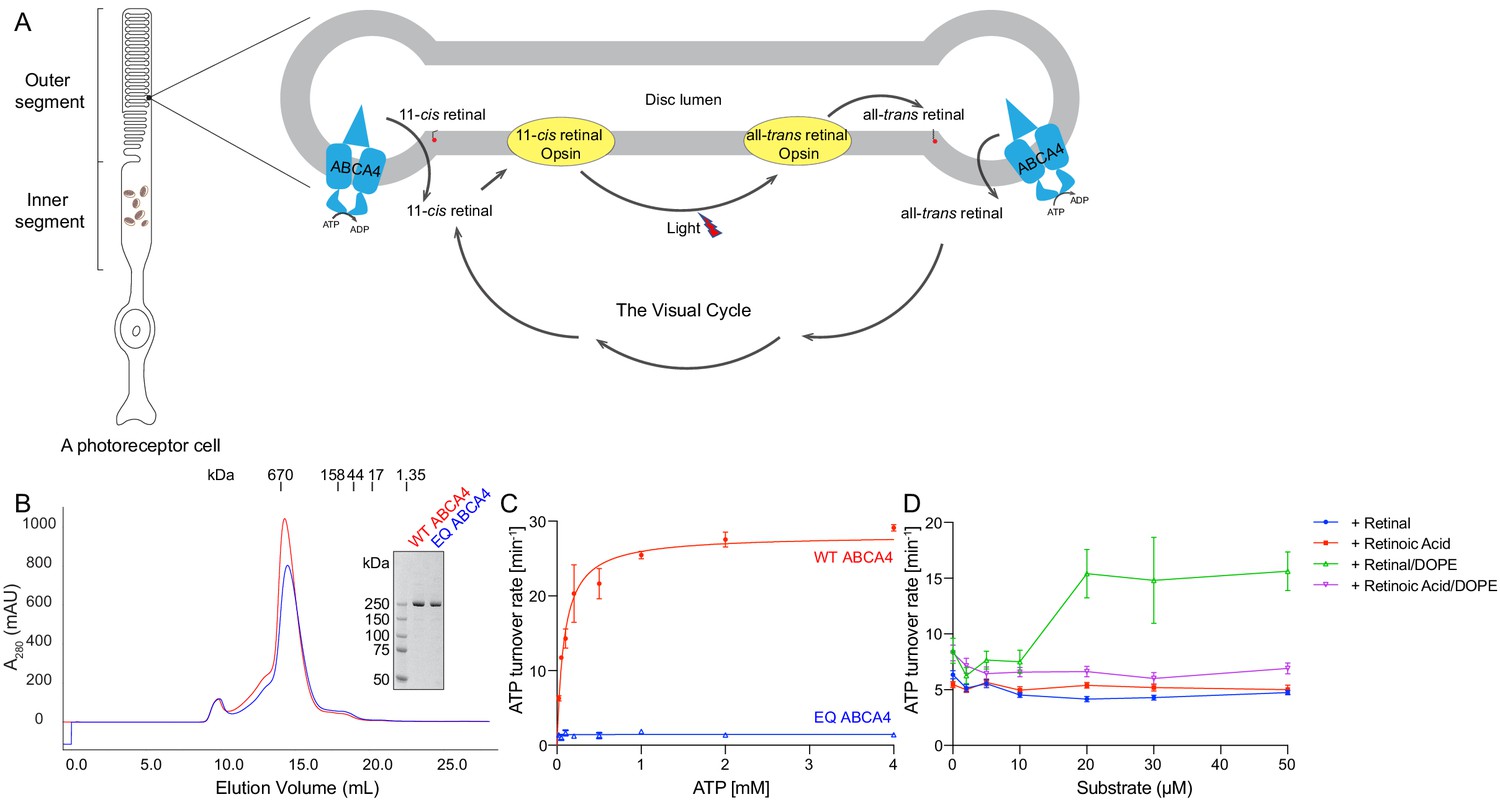
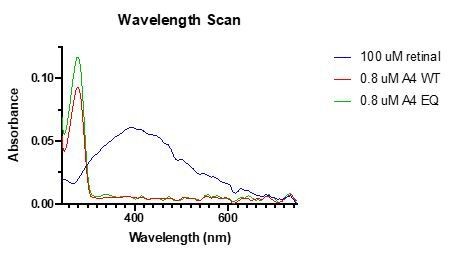
Biochemical characterization of ABCA4.
(A) An illustration showing a rod photoreceptor cell and a zoomed-in view of the outer segment disc, where ABCA4 is located. ATP-hydrolysis enables ABCA4 to transport all-trans retinal and 11-cis retinal from the disc lumen into cytosol. (B) Size exclusion profile of purified wild-type (WT) ABCA4 and the E1087Q/E2096Q mutant (EQ). (C) Basal ATPase activity measured in 0.06% digitonin at 28°C. Data points represent the means and standard deviations (SDs) of three measurements. The WT ABCA4 has a Km of 0.08 ± 0.01 mM and specific turnover rate of 28.1 ± 0.7 ATP per minute, corresponding to a maximal ATPase activity of 112.5 ± 2.8 nmol/mg/min. (D) The ATPase activity of purified ABCA4 as a function of all-trans retinal or all-trans retinoic acid in the presence or absence of 0.1 mg/mL 1,2-dioleoyl-sn-glycero-3-phosphoethanolamine (DOPE) and 100 µM ATP. Data points represent the means and SDs of three measurements from the same protein preparation.
Figure 2 with 2 supplements
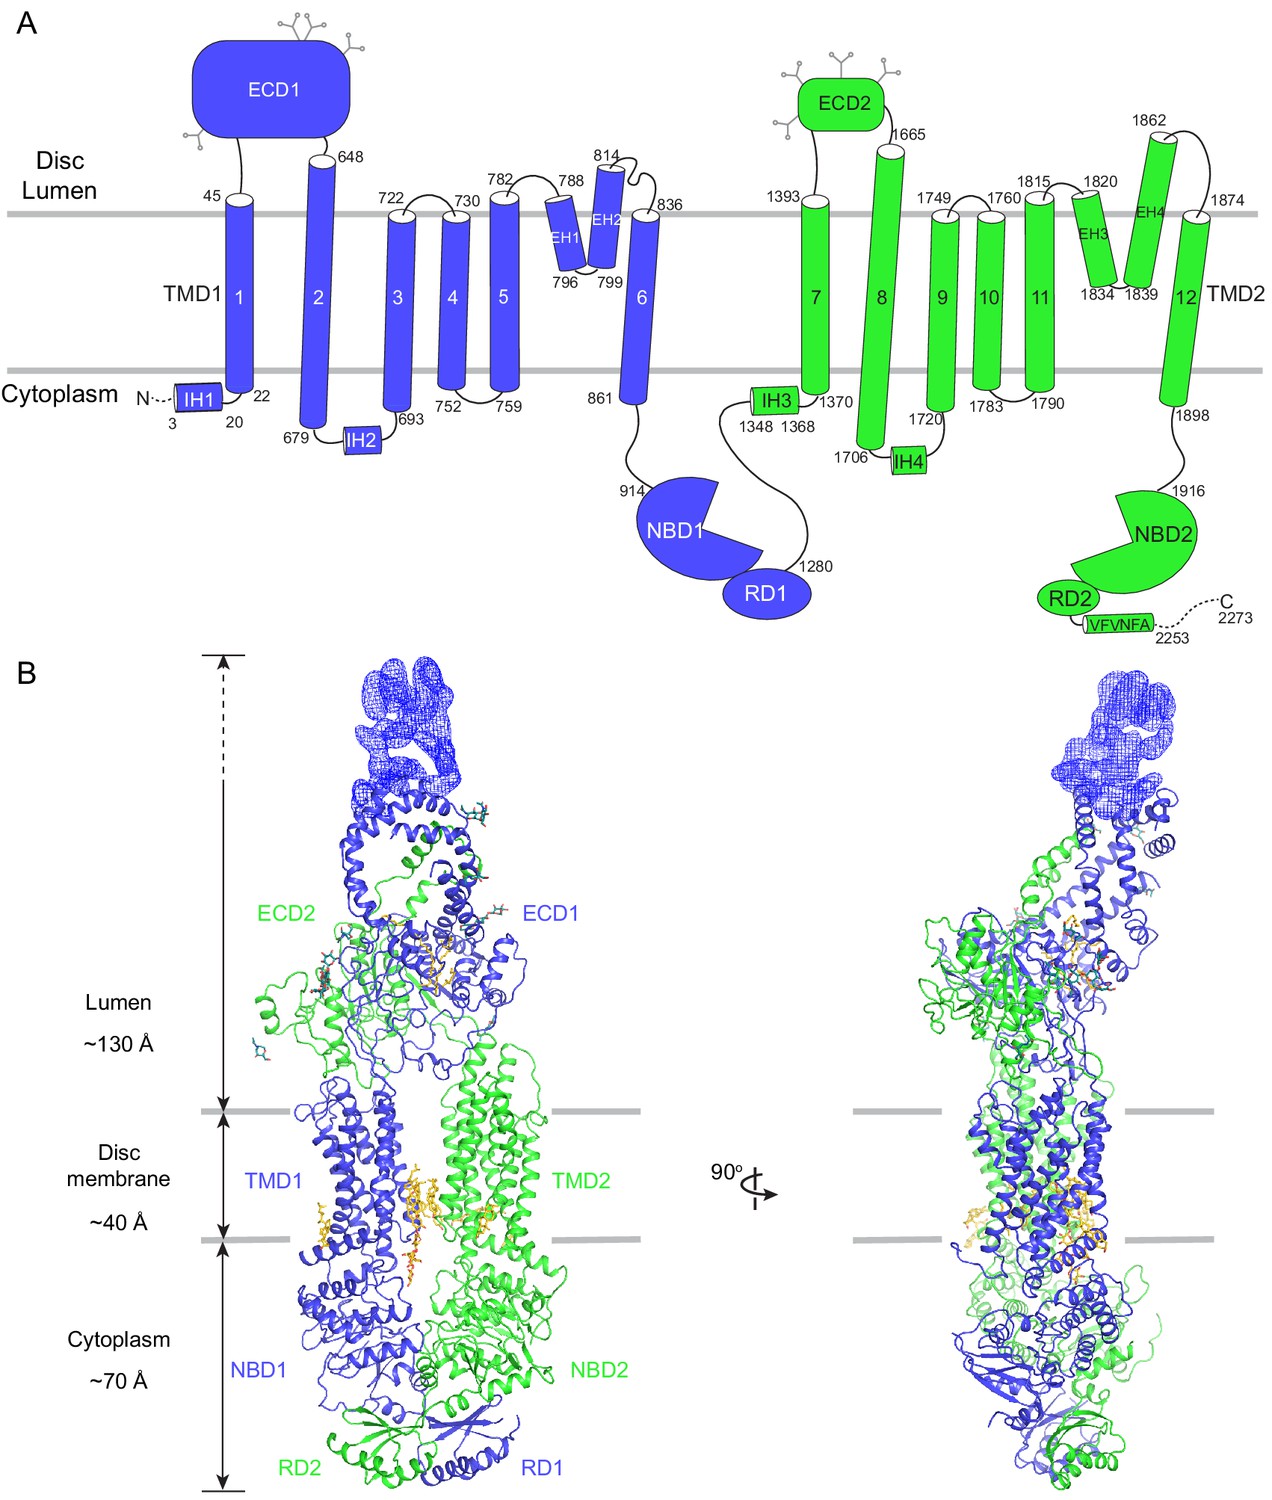
The overall structure of ABCA4 in the absence of ATP.
(A) The domain structure of ABCA4. The N- and C-terminal halves of the molecule are shown in blue and green. (B) Two orthogonal views of ABCA4 in ribbon presentation. Also shown is the electron microscopy density corresponding to residues 138–271 in ECD1. Ordered detergents, lipids, and N-linked glycans are shown as stick model. The position of the membrane is indicated by two gray lines.
Figure 2—figure supplement 1
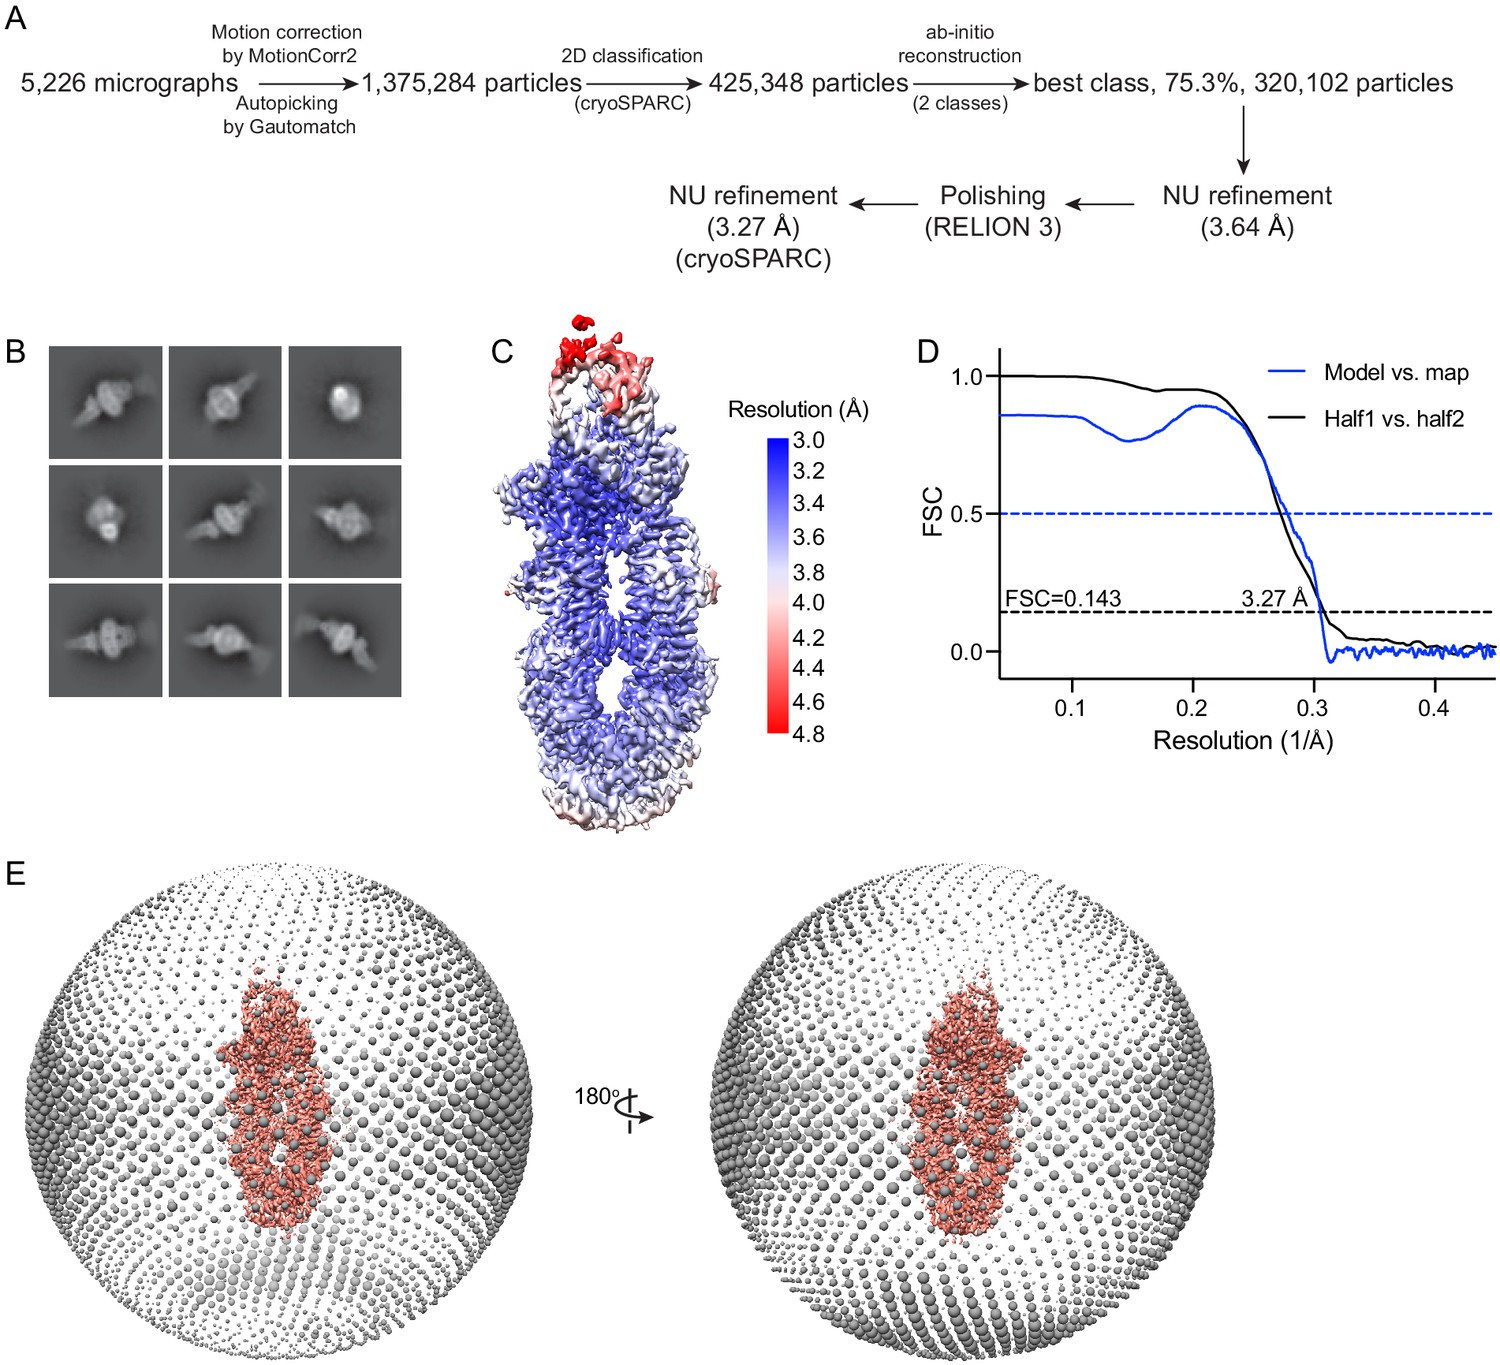
Cryo-electron microscopy reconstructions of the ATP-free, wild-type ABCA4.
(A) Summary of the image processing procedure. (B) Representative 2D class averages from cryoSPARC (Punjani et al., 2017). (C) Density map colored by local resolution estimation using RELION 3 (Scheres, 2012; Zivanov et al., 2018). (D) Fourier shell correlation (FSC) plots. Black: half map 1 versus half map 2; blue: model versus summed map. (E) Angular distribution of the particles used in the final reconstruction. Each sphere indicates the number of particles from this angle, and the size of the spheres corresponds to the number of particles.
Figure 2—figure supplement 2

Local density of the ATP-free, wild-type ABCA4 reconstruction.
Figure 3 with 1 supplement
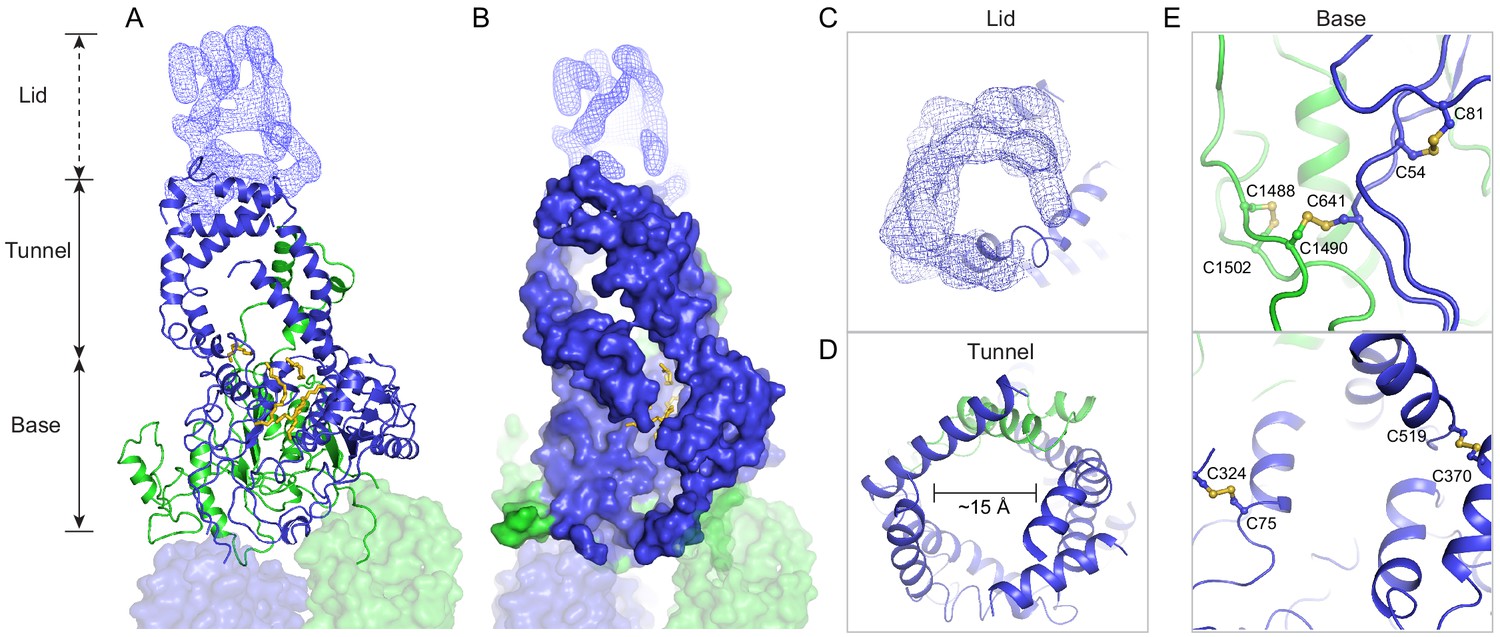
A three-tiered structure of the exocytoplasmic domains (ECDs).
(A) Ribbon and (B) surface representation of the ECDs, together with the electron microscopy (EM) density of the lid region. Bound detergents and lipids are shown as yellow sticks. (C) A luminal view of the lid; the EM density is shown as blue mesh. (D) A cross section of the tunnel region. (E) The ECDs are stabilized by inter- and intra-domain disulfide bonds.
Figure 3—figure supplement 1
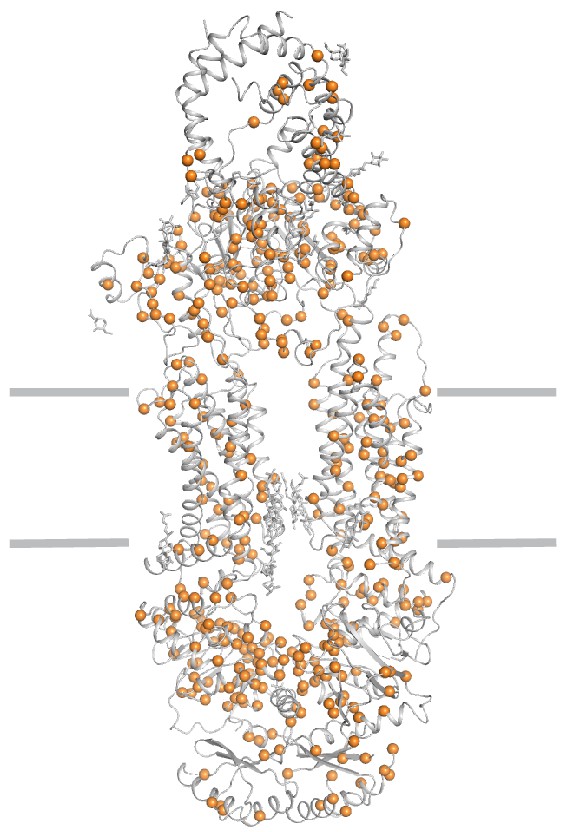
Disease-causing mutations (orange) are widely distributed throughout the structure.
Figure 4 with 1 supplement
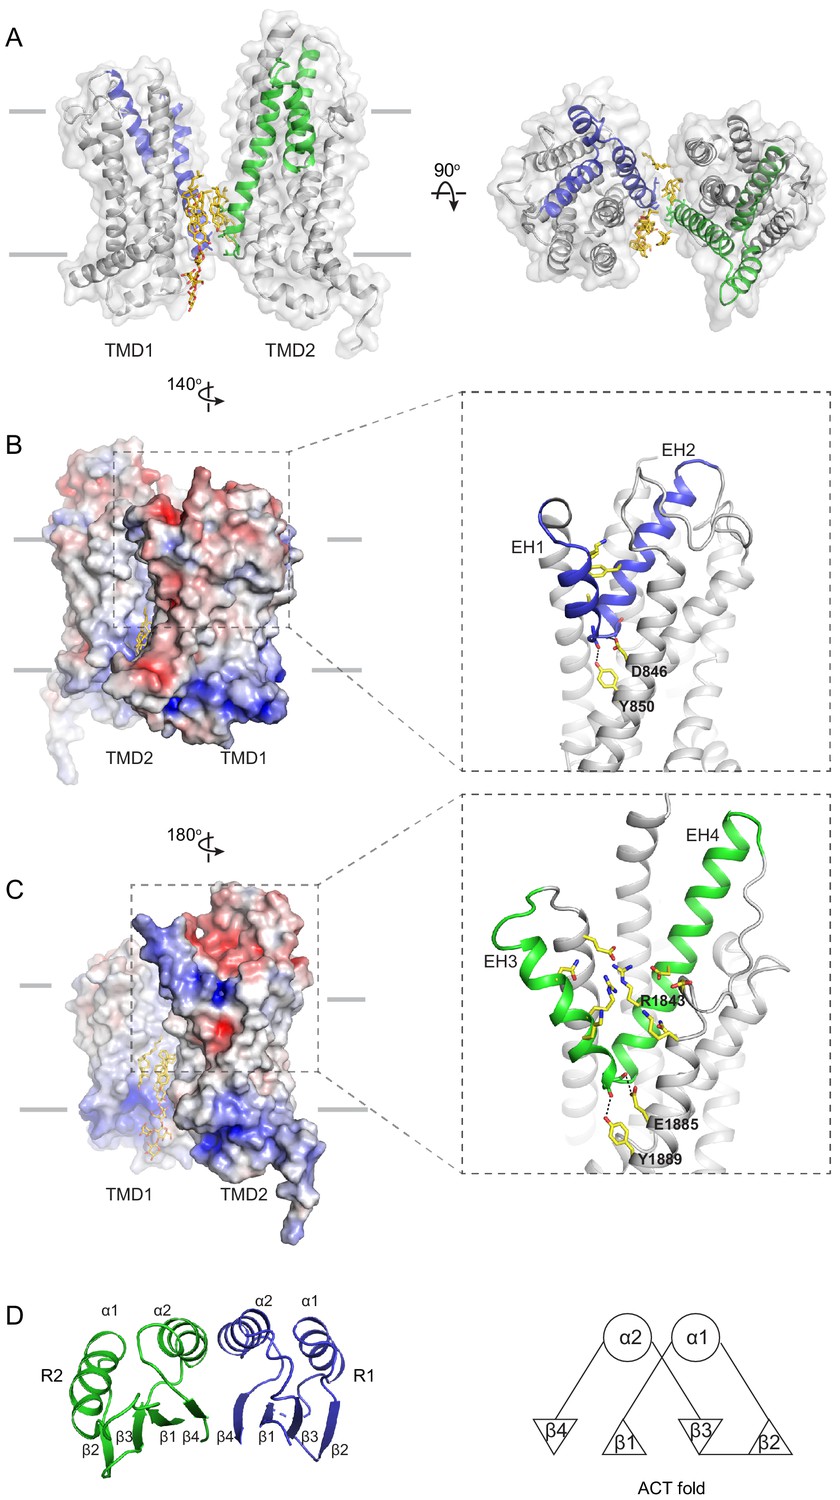
The structures of the transmembrane domains (TMDs) and regulatory domains (RDs).
(A) Two views of the TMDs. EH1, EH2, and TM5 are highlighted in blue, and EH3, EH4, and TM11 are in green. The side chain of residues making inter-subunit contacts is shown as stick model. Lipids are shown in yellow. (B) Electrostatic surface representation of the TMDs, calculated assuming a pH of 7 and a concentration of 0.15 M of both (+1) and (−1) ions. Scale: red, negative (−5 kT/e); blue, positive (+5 kT/e). The EH1-turn-EH2 insertion is highlighted as blue ribbon. (C) An orthogonal view of (B), highlighting the hydrophilic indentation formed by the EH3-turn-EH4 insertion. (D) The RDs exhibit the ACT-like fold with the βαββαβ topology. EH: exocytoplasmic helices.
Figure 4—figure supplement 1

The ACT motifs and the pinning helices (PHs) are conserved in the ABCA subfamily.
Sequence alignment and secondary structure prediction of (A) RD1 and (B) RD2, output of PROMALS3D (Pei et al., 2008). RD: regulatory domain.
Figure 5 with 2 supplements
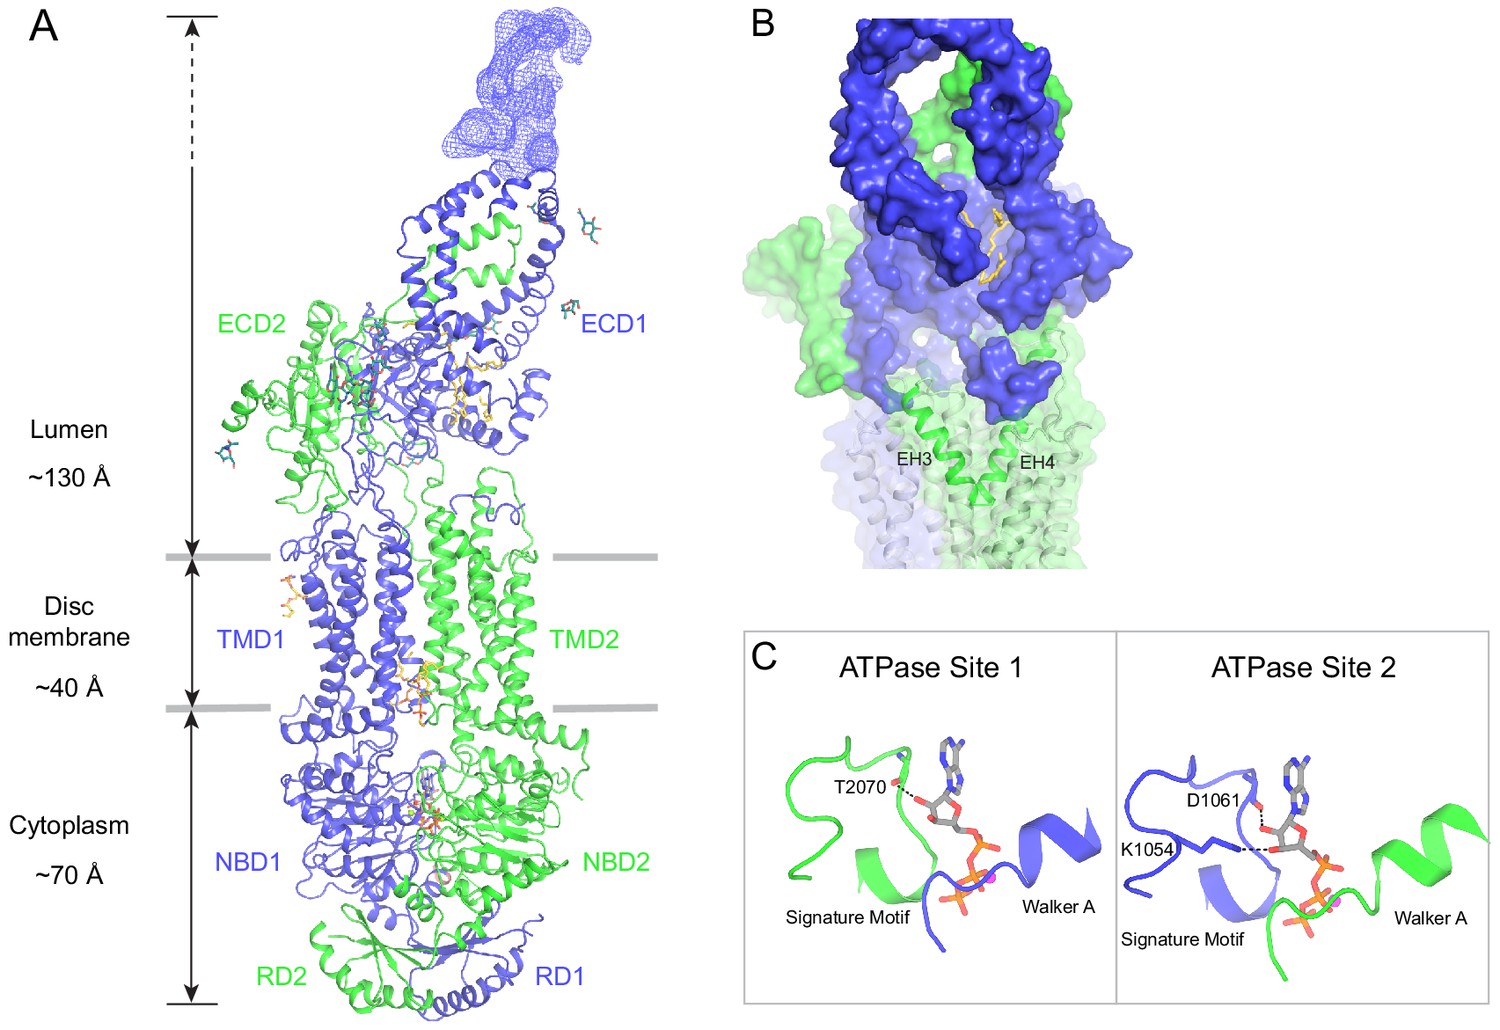
The structure of ABCA4 in the presence of ATP.
(A) Ribbon diagram of the ATP-bound ABCA4 EQ mutant, together with electron microscopy density of the lid region. (B) Surface representation of the exocytoplasmic domains. The EH3-turn-EH4 motif is shown in green ribbon; lipids are shown as stick model. (C) Structure of the two ATPase sites. ATP is shown as sticks. Dashed lines indicate the non-consensus hydrogen bonds stabilizing the ribose moiety. EH: exocytoplasmic helices.
Figure 5—figure supplement 1
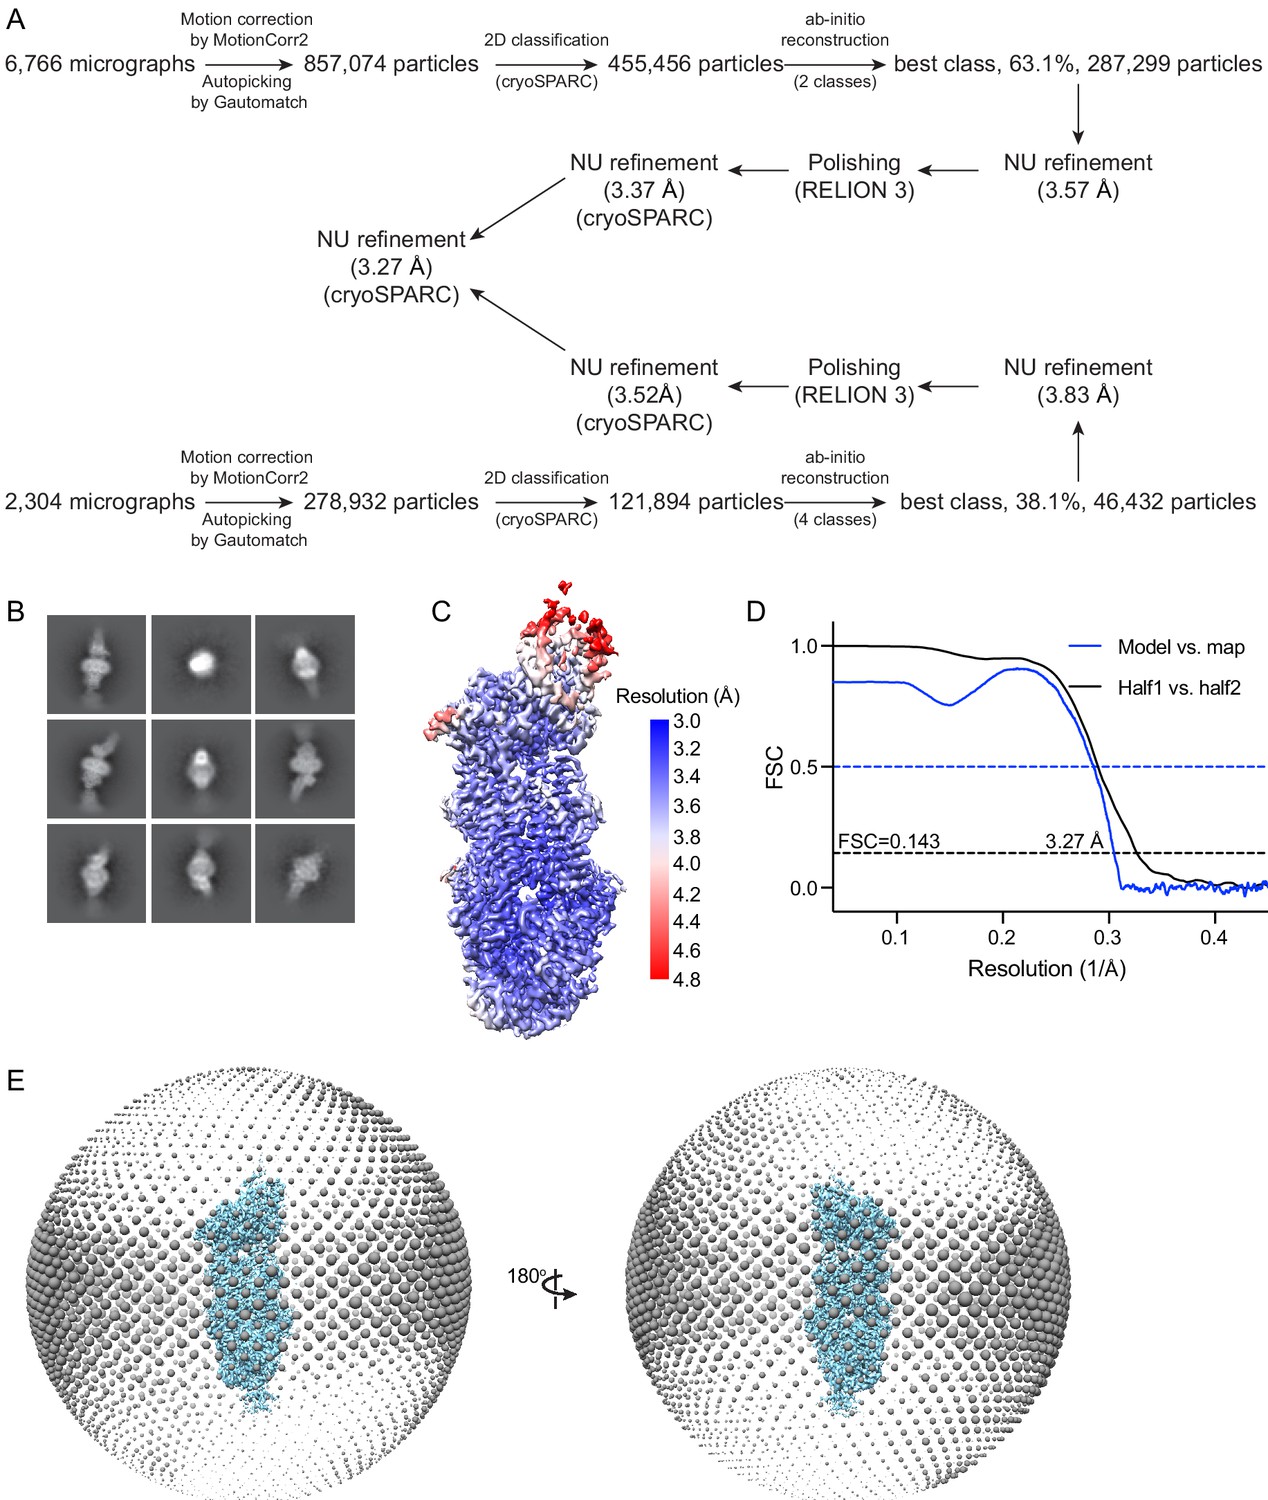
Cryo-electron microscopy reconstructions of the ATP-bound, EQ ABCA4.
(A) Summary of the image processing procedure. (B) Representative 2D class averages from cryoSPARC (Punjani et al., 2017). (C) Density map colored by local resolution estimation using RELION 3 (Scheres, 2012; Zivanov et al., 2018). (D) Fourier shell correlation (FSC) plots. Black: half map 1 versus half map 2; blue: model versus summed map. (E) Angular distribution of the particles used in the final reconstruction. Each sphere indicates the number of particles from this angle, and the size of the spheres corresponds to the number of particles.
Figure 5—figure supplement 2

Local density of the ATP-bound, EQ ABCA4 reconstruction.
Figure 6
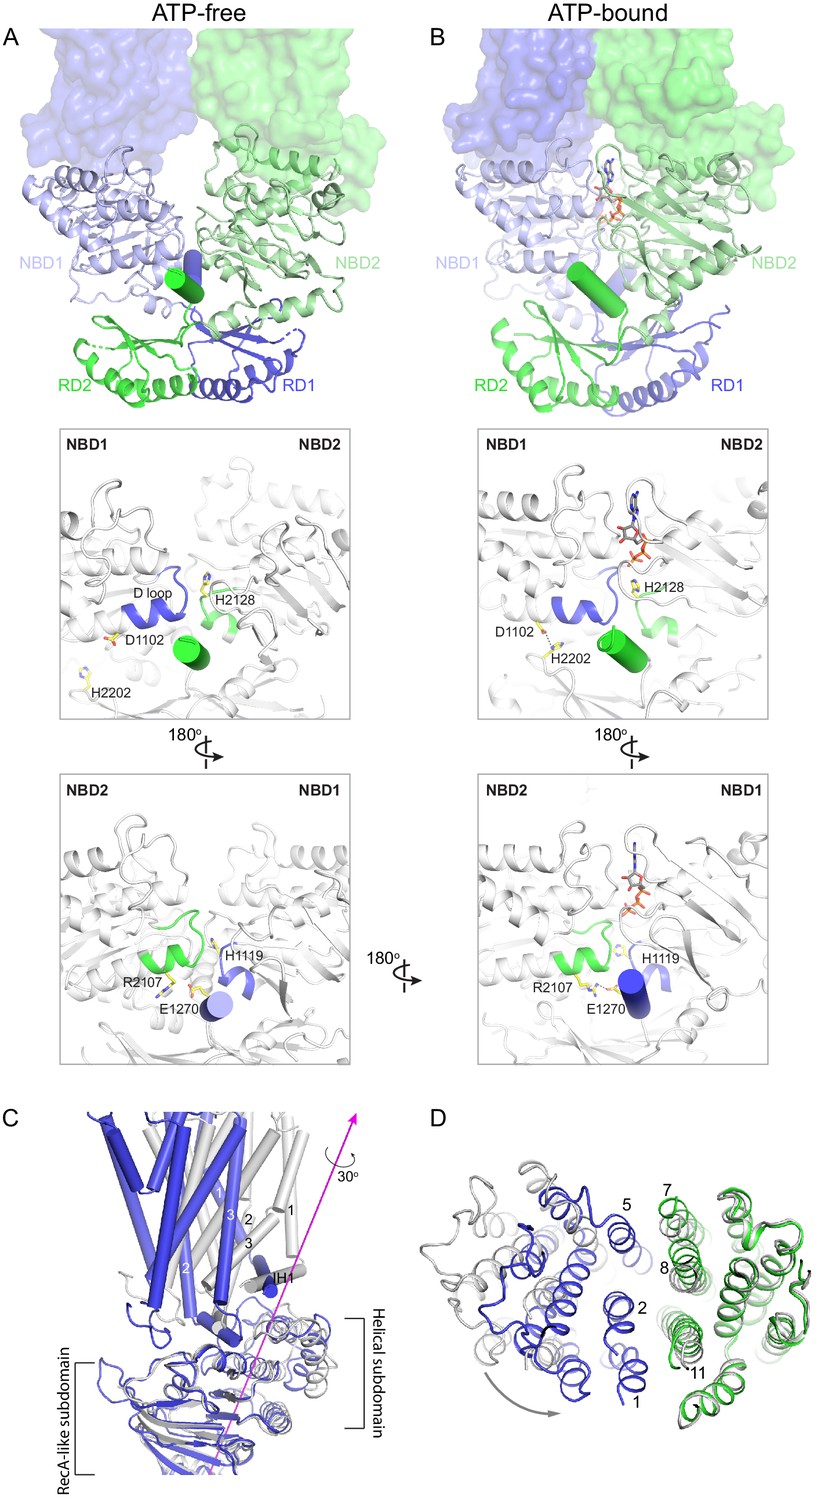
Conformational changes upon ATP binding.
(A, B) The tweezer-like motion of the nucleotide binding domains (NBDs). Transmembrane domains (TMDs) are shown as surface representations; NBDs are displayed as ribbons. The two pinning helices are highlighted as cylinders. ATPs are shown as sticks. (C) The twisting motion of TMD1. The two structures are superpositioned based on NBD1. The ATP-bound form is shown in blue and ATP-free conformation in gray. The rotation axis of TMD1 and the helical subdomain is indicated in magenta. (D) Closing of the TM cavity upon TMD1 twisting. The structures are aligned based on TMD2. ATP-bound TMDs are shown in blue and green; ATP-free conformation is shown in gray.
Figure 7 with 1 supplement
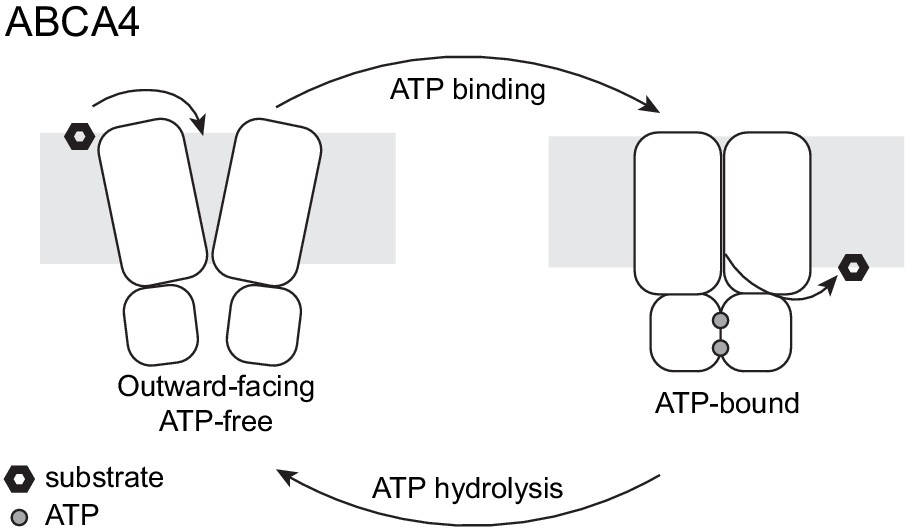
A working transport model.
For simplicity, the extracellular domains and the substrate-binding proteins are omitted from the schematic drawings.
Figure 7—figure supplement 1
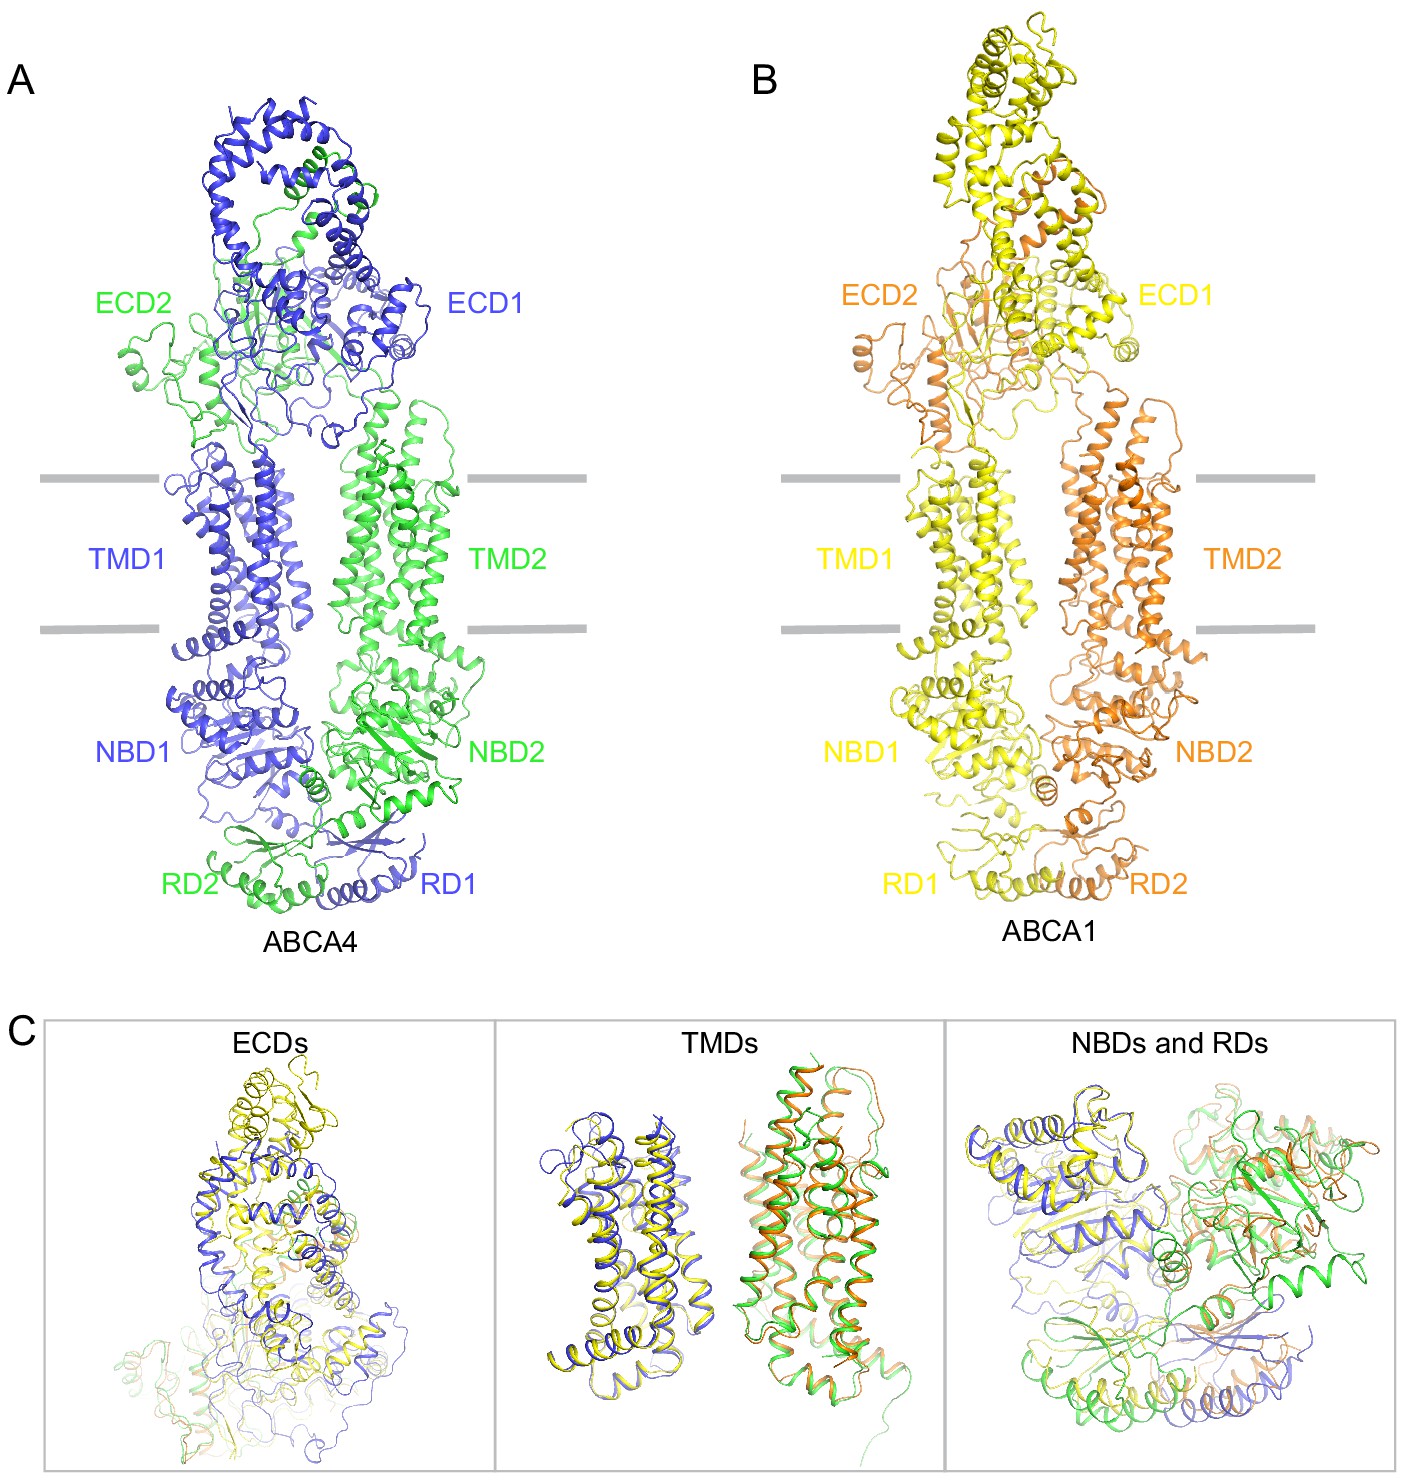
Structural comparison of ABCA4 and ABCA1.
(A) The overall structure of ABCA1 in the substrate-free, ATP-free (apo) conformation. (B) The overall structure of ABCA1 in its apo-form. (C) Local superposition of the exocytoplasmic domains (ECDs), transmembrane domains (TMDs), and nucleotide binding domain (NBD)/regulatory domain (RD).
Author response image 1
Tables
Table 1
Summary of electron microscopy data and structure refinement statistics for wild-type ABCA4.
| Data collection | |
|---|---|
| Microscope | Titan Krios (FEI) |
| Voltage (kV) | 300 |
| Detector | K2 Summit (Gatan) |
| Pixel size (Å) | 1.03 |
| Defocus range (μm) | 0.8–2.5 |
| Movies | 5226 |
| Frames/movie | 50 |
| DDose rate (electrons/pixel/s) | 8 |
| Total dose (electrons/Å2) | 75 |
| Number of particles | 1,375,284 |
| Model composition | |
| Non-hydrogen atoms | 15,789 |
| Protein residues | 1941 |
| Lipids Digitonin | 14 1 |
| Sugar molecules | 14 |
| Refinement | |
| Resolution (Å) | 3.3 |
| Sharpening B-factor (Å2) | −99.8 |
| Root-mean-square deviations | |
| Bond lengths (Å) | 0.006 |
| Bond angles (°) | 1.185 |
| Validation | |
| Molprobity score | 2.16 |
| Clashscore, all atoms | 18.86 |
| Favored rotamers (%) | 97.10 |
| Ramachandran plot (%) | |
| Favored | 94.28 |
| Allowed | 5.72 |
| Outliers | 0.0 |
Table 2
Summary of electron microscopy data and structure refinement statistics for EQ ABCA4.
| Data collection | |
|---|---|
| Microscope | Titan Krios (FEI) |
| Voltage (kV) | 300 |
| Detector | K2 Summit (Gatan) |
| Pixel size (Å) | 1.03 |
| Defocus range (μm) | 0.8–2.5 |
| Movies | 9070 |
| Frames/movie | 50 |
| Dose rate (electrons/pixel/s) | 8 |
| Total dose (electrons/Å2) | 75 |
| Number of particles | 1,136,006 |
| Model composition | |
| Non-hydrogen atoms | 15,513 |
| Protein residues | 1920 |
| Lipids ATP | 8 2 |
| Mg2+ | 2 |
| Sugar molecules | 14 |
| Refinement | |
| Resolution (Å) | 3.3 |
| Sharpening B-factor (Å2) | −93.8 |
| Root-mean-square deviations | |
| Bond lengths (Å) | 0.007 |
| Bond angles (°) | 0.898 |
| Validation | |
| Molprobity score | 2.10 |
| Clashscore, all atoms | 12.42 |
| Favored rotamers (%) | 97.99 |
| Ramachandran plot (%) | |
| Favored | 91.68 |
| Allowed | 8.32 |
| Outliers | 0.0 |
Additional files
Download links
A two-part list of links to download the article, or parts of the article, in various formats.
Downloads (link to download the article as PDF)
Open citations (links to open the citations from this article in various online reference manager services)
Cite this article (links to download the citations from this article in formats compatible with various reference manager tools)
Molecular structures of the eukaryotic retinal importer ABCA4
eLife 10:e63524.
https://doi.org/10.7554/eLife.63524


