Curcumin promotes AApoAII amyloidosis and peroxisome proliferation in mice by activating the PPARα signaling pathway
- Department of Neuro-health Innovation, Institute for Biomedical Sciences, Interdisciplinary Cluster for Cutting Edge Research, Shinshu University, Japan
- Department of Pathology, the Xiehe Hospital of Tangshan, China
- Aging Biology, Department of Biomedical Engineering, Graduate School of Medicine, Science and Technology Shinshu University, Japan
- Department of Dementia and Higher Brain Function, Tokyo Metropolitan Institute of Medical Science, Japan
- Department of Aging Biology, Institute of Pathogenesis and Disease Prevention, Shinshu University Graduate School of Medicine, Japan
- Department of Orthopedic Surgery, the Third Hospital of Hebei Medical University, China
- Department of Aging Biology, Shinshu University School of Medicine, Japan
Figures
Figure 1 with 7 supplements
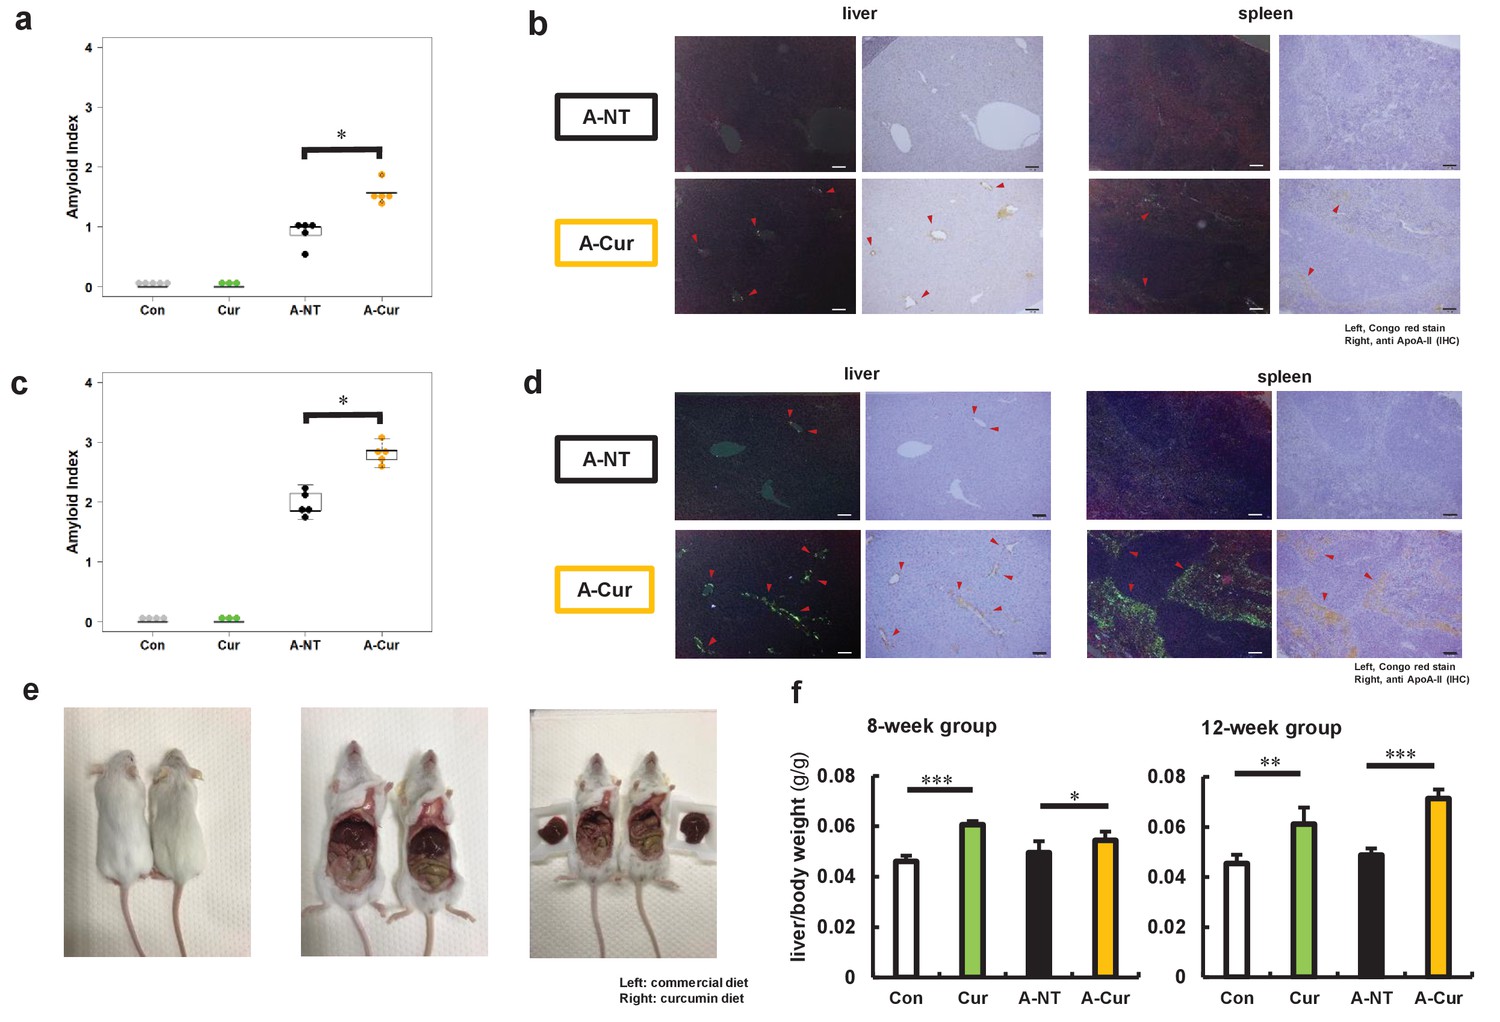
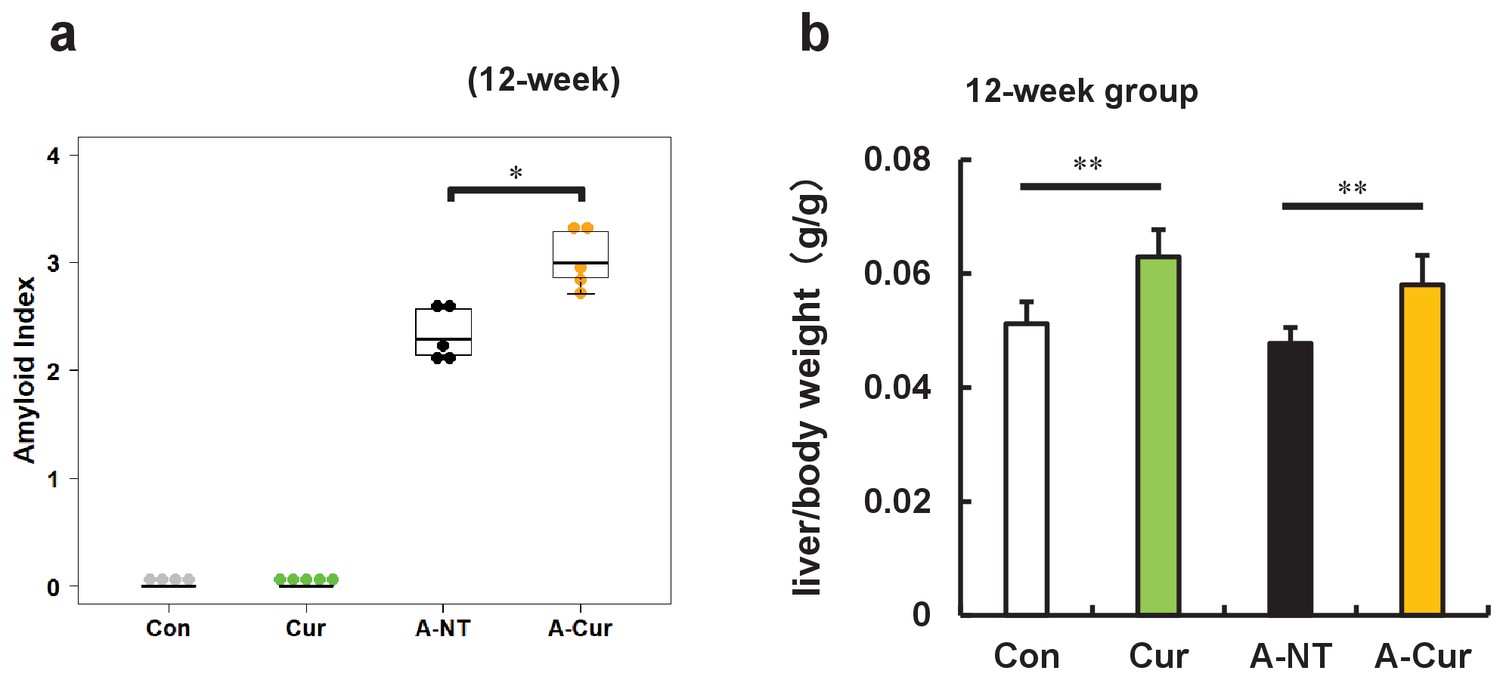
Degree of AApoAII amyloid deposition and liver weights.
(a) Amyloid index (AI) in the 8-week group. (b) Representative Congo red and IHC images of AApoAII amyloid deposition in the 8-week group. Amyloid deposits (red arrows) were identified by green birefringence in Congo red-stained sections using polarizing light microscopy. Each scale bar indicates 100 μm. (c) Amyloid index in the 12-week group. (d) Representative Congo red and IHC images of amyloid deposition in the 12-week group. (e) Mice in curcumin-supplemented group have larger livers and less adipose tissue in the abdominal cavity than mice without curcumin supplementation (left: commercial diet; right: curcumin diet). (f) Ratio of liver weight/body weight in all groups. Each dot represents an individual mouse (a, c). Data are mean ± SD (f). N = 3–5. The Kruskal–Wallis test with the Steel–Dwass test was used for the amyloid index, and the Tukey–Kramer method was used for multiple comparisons of liver weights; *p < 0.05, **p < 0.01, ***p < 0.001.
Figure 1—figure supplement 1
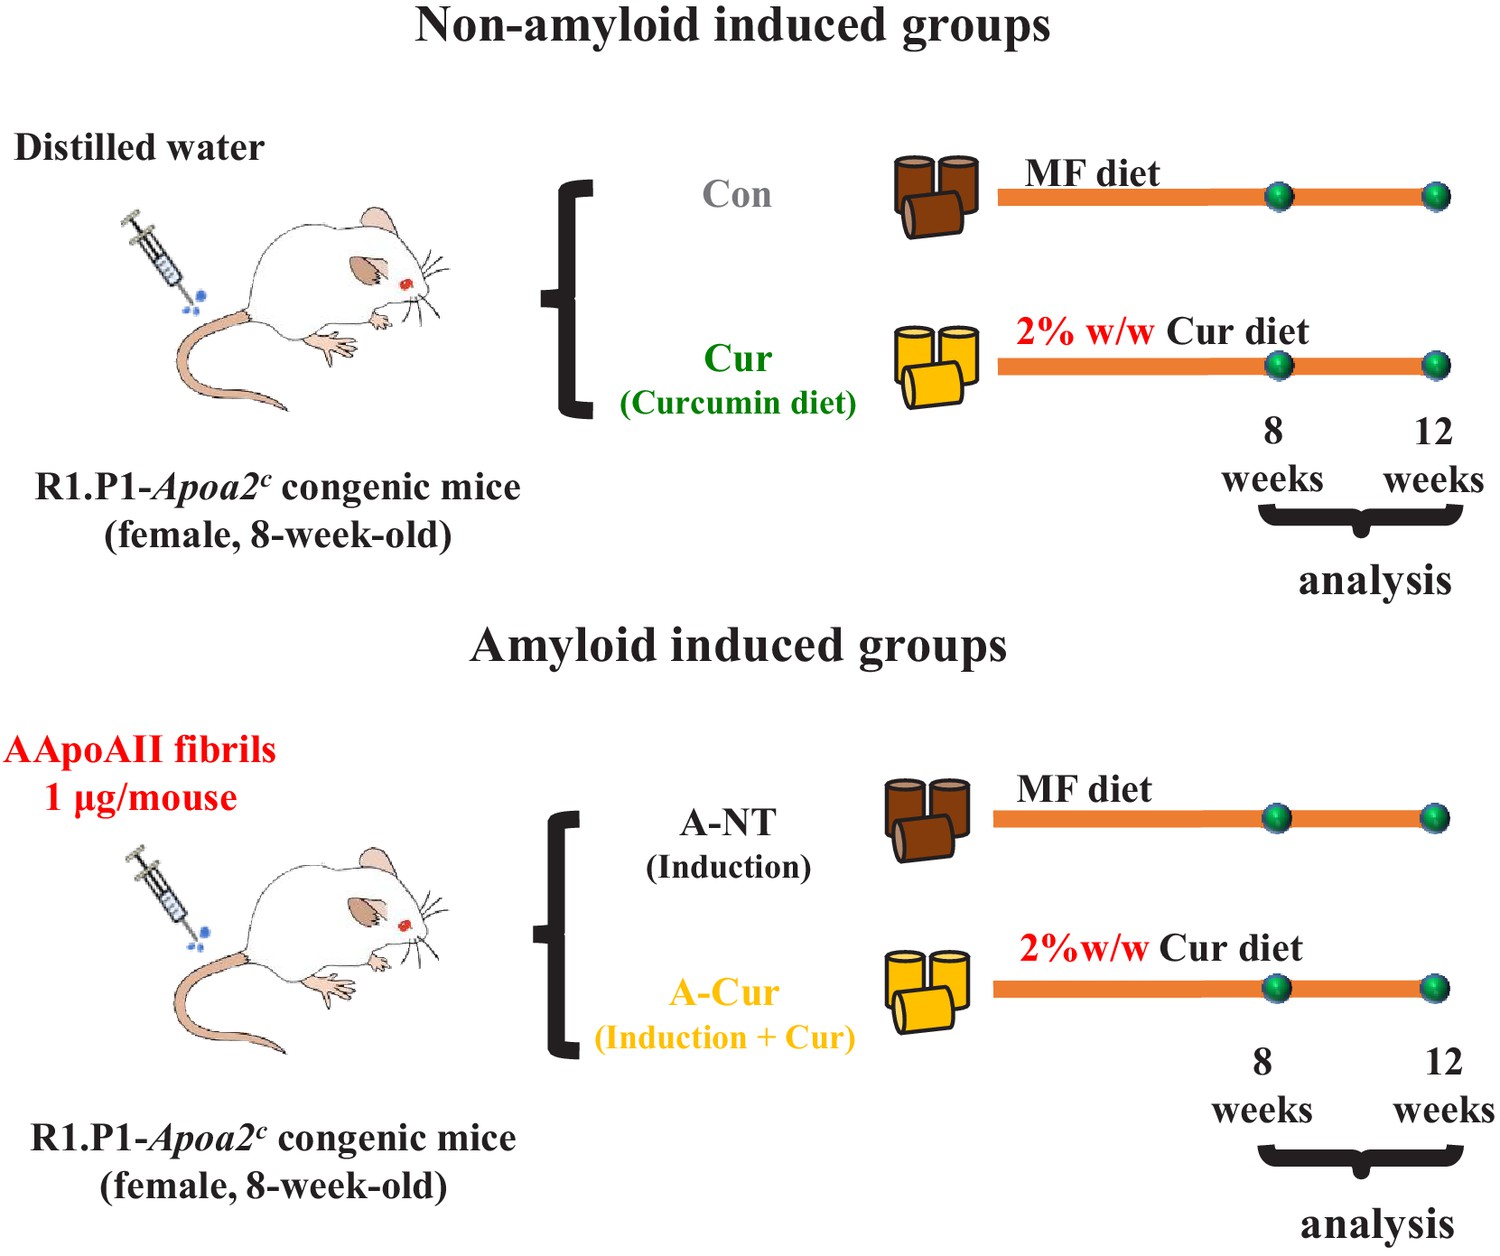
Experimental design.
Eight-week-old female R1.P1-Apoa2c mice were divided into four groups: control (Con) group, curcumin (Cur) group, amyloid and no-treatment (A-NT) group, and amyloid and curcumin (A-Cur) group. The A-NT and A-Cur groups were injected with 1 μg/mouse of AApoAII fibrils to induce amyloidosis, and the Con and Cur groups were injected with distilled water instead of amyloid fibrils. Mice in the Con and A-NT groups were fed a commercial diet from 8 weeks of age, while mice in the Cur and A-Cur groups were fed a 2% w/w curcumin diet. Mice were sacrificed for biochemical analysis and histochemical analysis after 8 weeks or 12 weeks (N = 3–5 in each group).
Figure 1—figure supplement 2
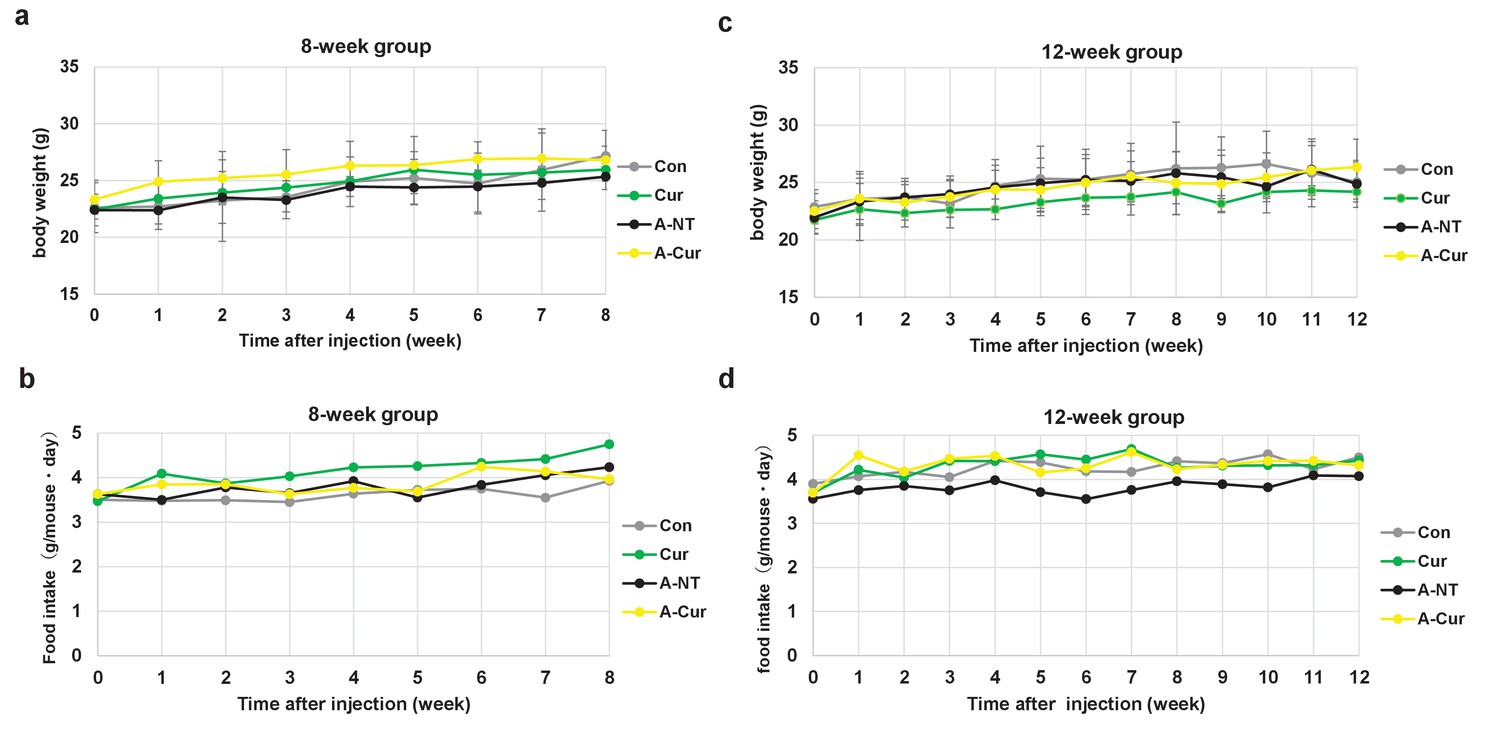
Weekly body weight and food intake measurements.
(a) Body weight and (b) food intake in the 8-week group. Each column and bar represent the mean ± S.D. (N = 3–5). (c) Body weight and (d) food intake in the 12-week group. Data are represented in g/mouse・day (food intake).
Figure 1—figure supplement 3
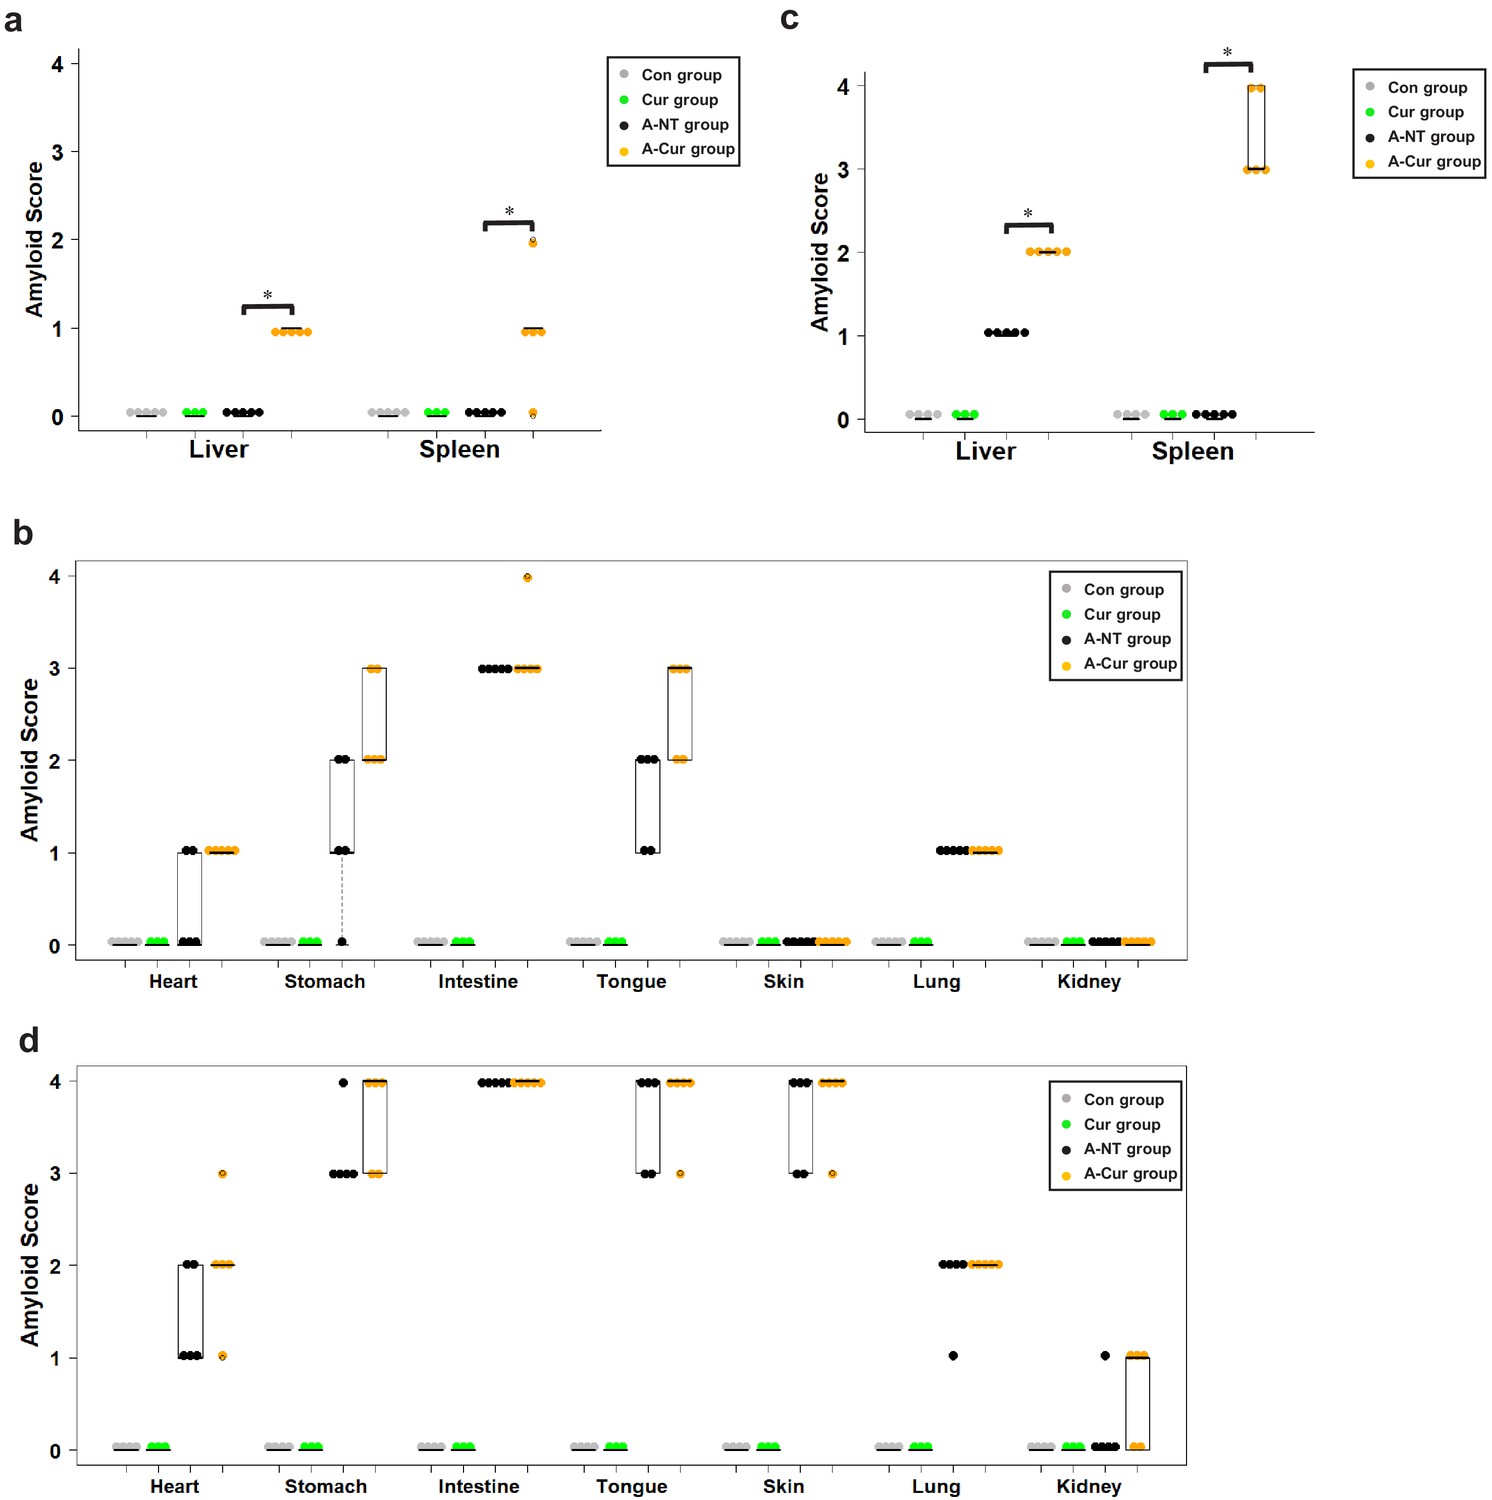
Amyloid score in various organs.
(a) Amyloid deposition in the liver and spleen is increased by supplementation with curcumin for 8 weeks. (b) Amyloid score in other organs (heart, stomach, intestine, tongue, skin, lung, and kidney) in the 8-week group. (c) Amyloid deposition in the liver and spleen is increased by supplementation with curcumin for 12 weeks. (d) Amyloid score in other organs (heart, stomach, intestine, tongue, skin, lung, and kidney) in the 12-week group. Each dot represents an individual mouse. The Kruskal–Wallis test with the Steel–Dwass test was used for comparisons of the amyloid score; *p < 0.05.
Figure 1—figure supplement 4
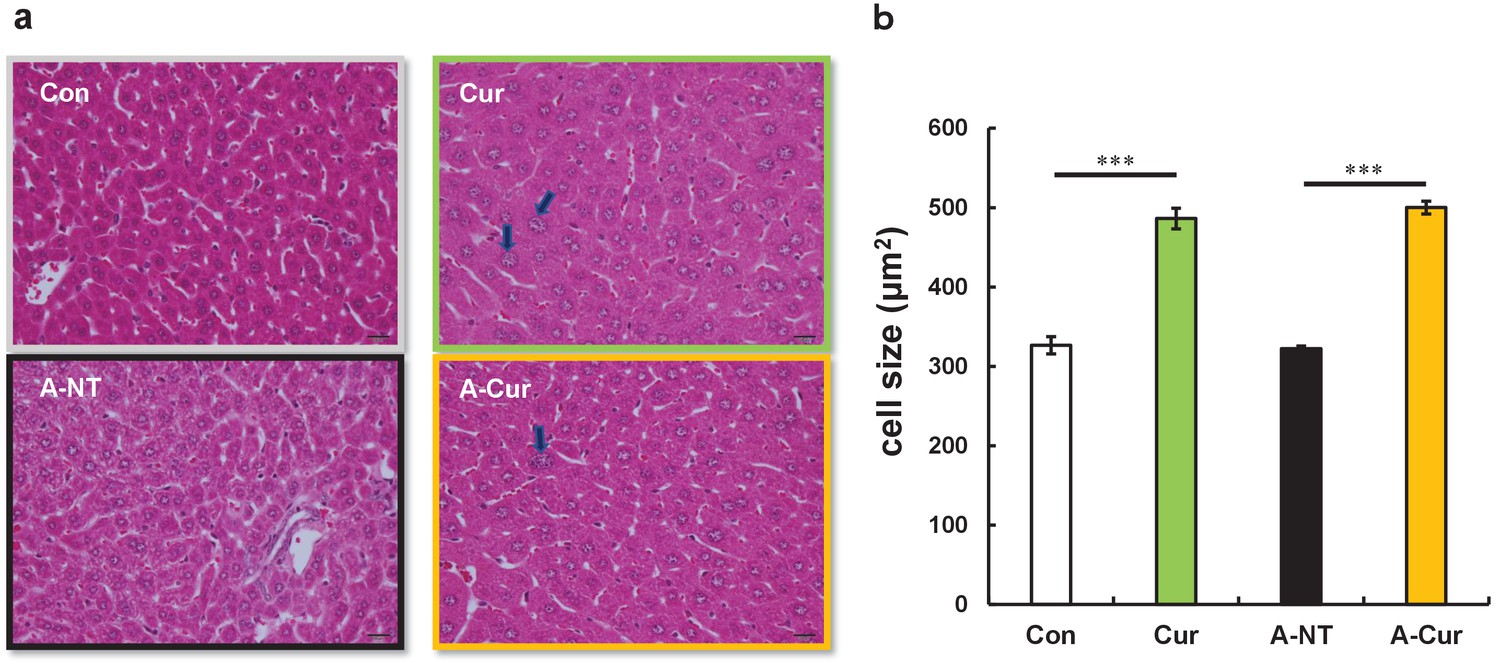
Hepatocyte hypertrophy in curcumin intake groups.
(a) Representative HE stained image of hepatocytes. Large nuclei (black arrows) were identified in curcumin intake groups. Each scale bar indicates 20 μm. (b) Average hepatocyte size in each group. Data represent the mean ± SEM. N = 3–5. The Tukey–Kramer method was used for multiple comparisons of hepatocyte size; ***p < 0.001.
Figure 1—figure supplement 5

No differences in AST and ALT plasma concentrations after curcumin intake.
AST and ALT plasma levels were detected to evaluate hepatocyte injury. (a) AST and ALT concentrations in the 8-week group. (b) AST and ALT plasma concentrations in the 12-week group. Data are mean ± SD. N = 3–5. The Tukey–Kramer method was used for multiple comparisons; *p < 0.05.
Figure 1—figure supplement 6
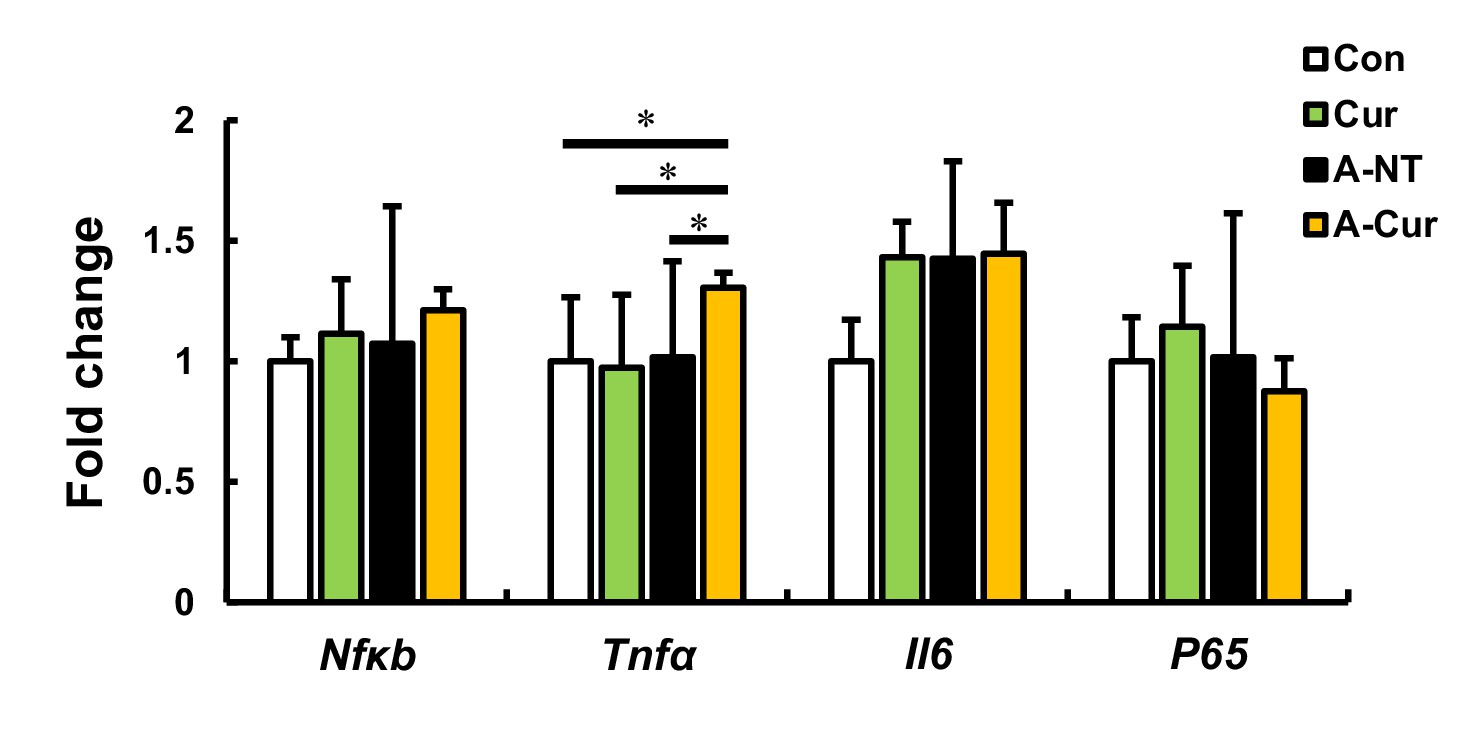
Inflammation-related gene expression in the liver in the 12-week group.
Representative genes related to inflammation were measured by real-time qPCR. Results show that curcumin does not affect the expression of inflammatory genes, but Tnfα was increased in the A-Cur group, in which mice exhibit severe amyloid deposition. Data are mean ± SD. N = 3–5. The Tukey–Kramer method was used for multiple comparisons; *p < 0.05.
Figure 1—figure supplement 7
Degree of AApoAII amyloid deposition and liver weights were significantly increased after supplementation with low dose curcumin diet (0.5% w/w).
(a) Amyloid index (AI) in the 12-week group supplemented with 0.5% curcumin diet. Each dot represents an individual mouse. (b) Ratio of liver weight/body weight in the 12-week group. Data are mean ± SD. N = 4–5. The Kruskal–Wallis test with the Steel–Dwass test was used for the amyloid index, and the Tukey–Kramer method was used for multiple comparisons of liver weights; *p < 0.05, **p < 0.01.
Figure 2 with 1 supplement
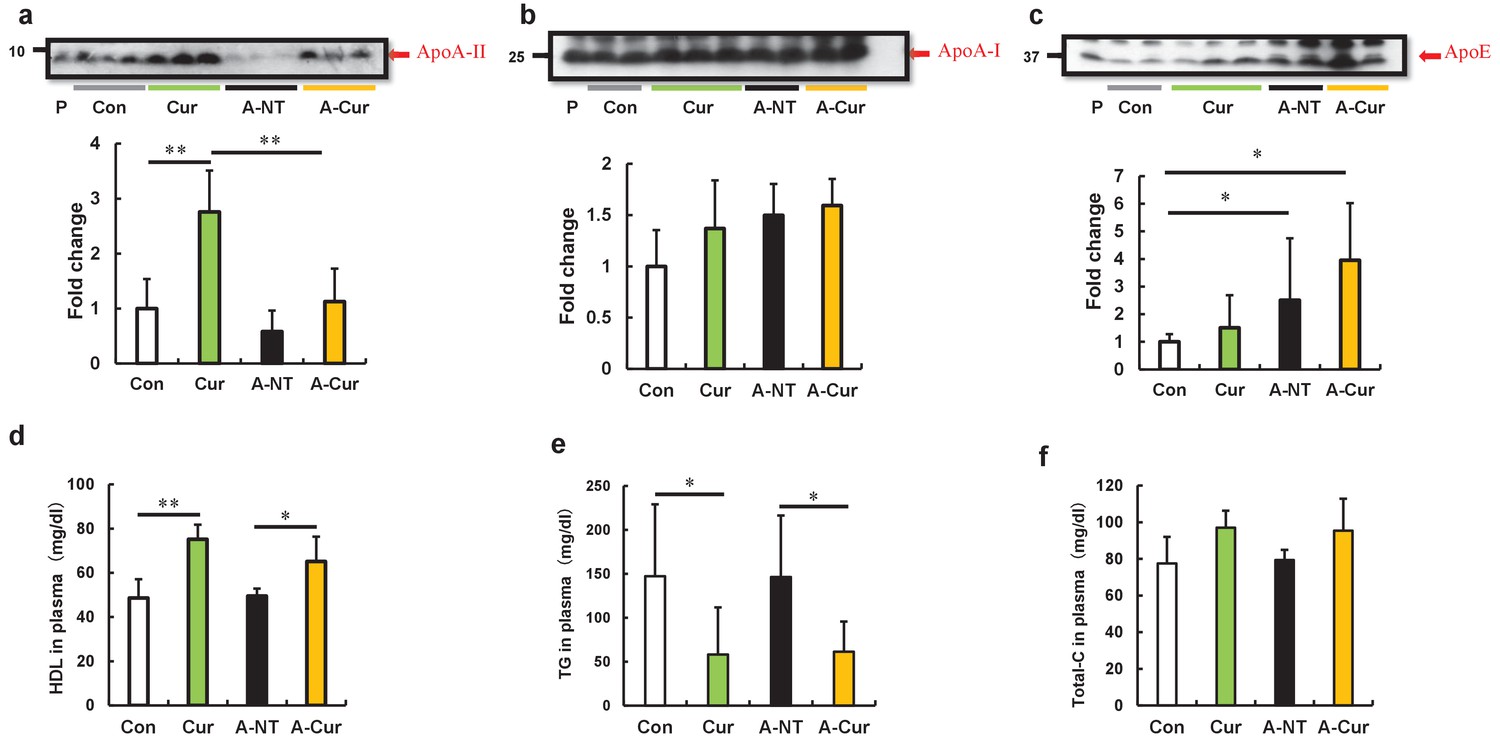
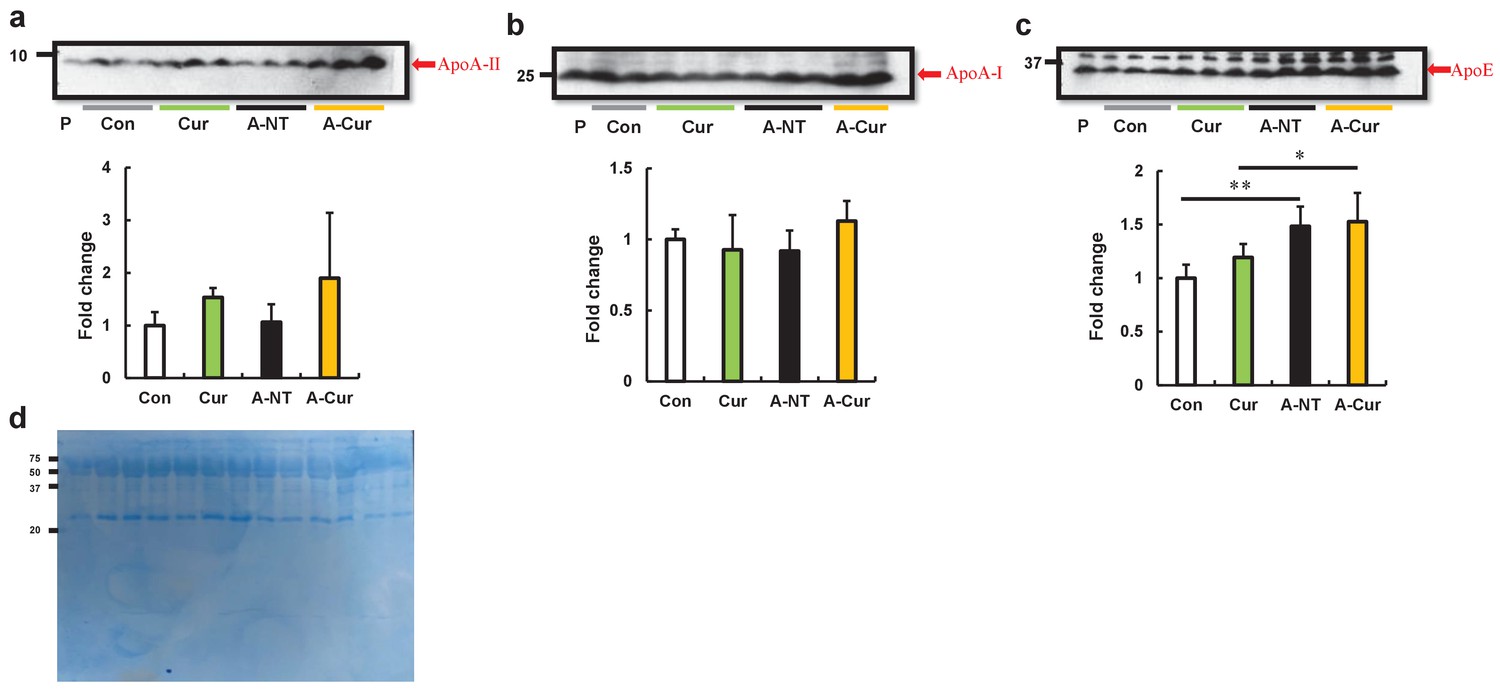
Curcumin elevated ApoA-II levels and affected lipid metabolism in mice after 12 weeks.
(a–c) Plasma concentrations of ApoA-II, ApoA-I, and ApoE were determined by densitometry of Western immunoblot after SDS-PAGE. Representative results of western blot are shown above the figures. Histograms show fold changes relative to the Con group and represent the means ± SD. P indicates the pooled plasma of female R1.P1-Apoa2c mice at 2 months of age (N = 4) that did not have AApoAII amyloid deposits, as the positive control. (d–f) Plasma concentrations of HDL cholesterol, triglycerides (TG), and total cholesterol (Total-C) were determined using quantitative assay kits. N = 3–5. The Tukey–Kramer method was used for multiple comparisons; *p < 0.05. **p < 0.05.
Figure 2—figure supplement 1
ApoA-II, ApoA-I, and ApoE plasma levels after supplementation with 2% w/w curcumin diet for 8 weeks.
(a–c) Plasma levels of ApoA-II, ApoA-I, and ApoE proteins were determined by western immunoblot. There were no obvious changes in ApoA-II and ApoA-I plasma concentrations; the concentration of ApoE increased significantly in the amyloid-induced groups. Histograms show fold changes relative to the Con group and represent the means ± S D. P indicates the pooled plasma of female R1.P1-Apoa2c mice at 2 months of age (N = 4) that did not have AApoAII amyloid deposits, as the positive control of these proteins. N = 3–5. The Tukey–Kramer method was used for multiple comparisons; *p < 0.05, **p < 0.01. (d) The CBB stain of plasma protein to show the load.
Figure 3 with 1 supplement
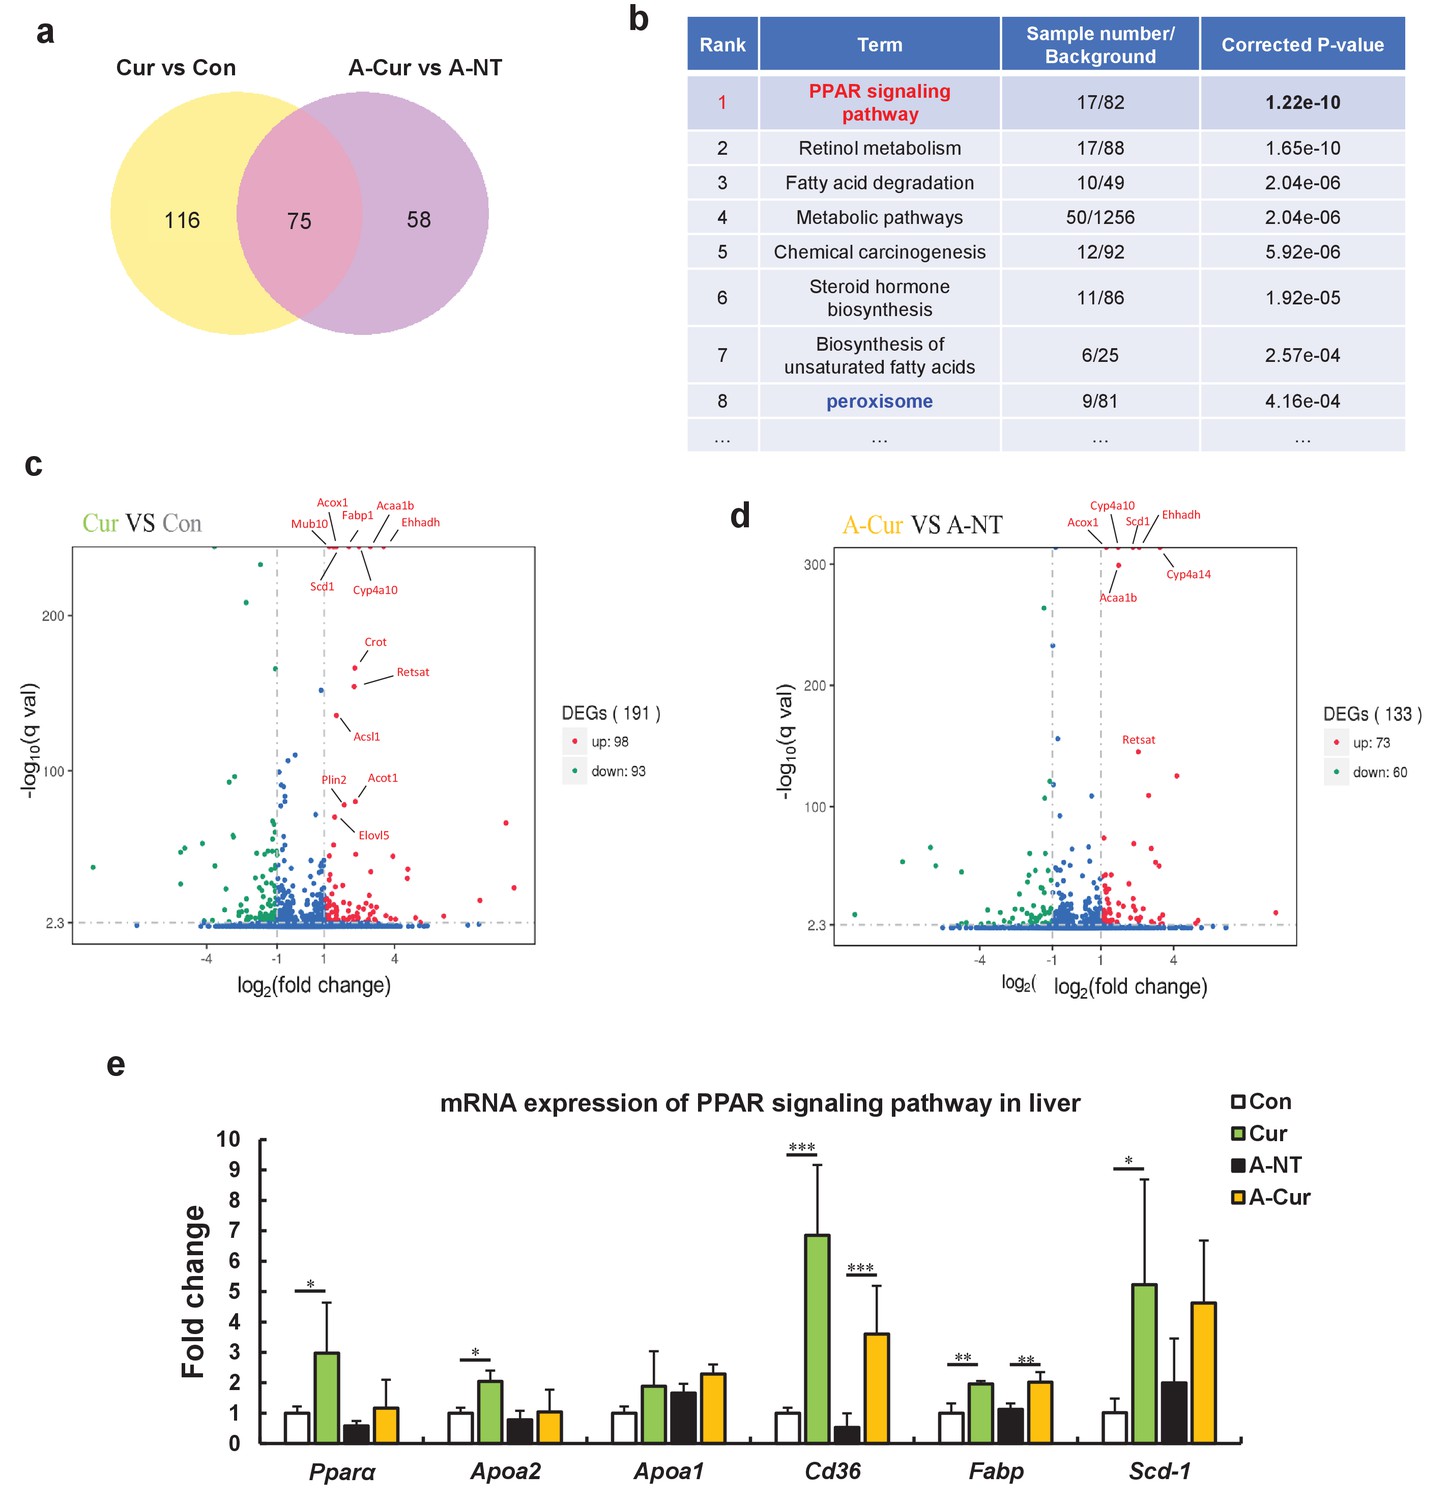
RNA sequence analysis showed that curcumin regulates many lipid metabolism-related genes via the peroxisome proliferator-activated receptor (PPAR) signaling pathway.
(a) The Venn diagram shows that 75 genes are changed in the liver by supplementation with curcumin for 12 weeks. (b) Enrichment pathway analysis based on the KEGG database. (c and d) The Volcano plot diagram shows that differentially expressed genes (DEGs) affected by curcumin are related to lipid metabolism and the PPARa pathway. (e) Regulated genes were identified by real-time qPCR. Histograms show fold changes relative to the Con group. Data are mean ± SD. The Tukey–Kramer method was used for multiple comparisons of gene changes; *p < 0.05, **p < 0.01, ***p < 0.001.
-
Figure 3—source data 1
Cur vs Con.DEG.
- https://cdn.elifesciences.org/articles/63538/elife-63538-fig3-data1-v2.xls
-
Figure 3—source data 2
ACur vs ANT.DEGs.
- https://cdn.elifesciences.org/articles/63538/elife-63538-fig3-data2-v2.xls
-
Figure 3—source data 3
the list of 75 DEGs.
- https://cdn.elifesciences.org/articles/63538/elife-63538-fig3-data3-v2.xlsx
-
Figure 3—source data 4
CurvsCon_all.DEG_KEGG_pathway_enrichment.
- https://cdn.elifesciences.org/articles/63538/elife-63538-fig3-data4-v2.xls
-
Figure 3—source data 5
ACurvsANT_all.DEG_KEGG_pathway_enrichment.
- https://cdn.elifesciences.org/articles/63538/elife-63538-fig3-data5-v2.xls
Figure 3—figure supplement 1

mRNA expression of Pparγ in the liver.
Pparγ expression in the liver is upregulated in curcumin intake groups. Histograms show fold changes relative to the Con group. Data are mean ± SD. The Tukey–Kramer method was used for multiple comparisons; ***p < 0.001.
Figure 4
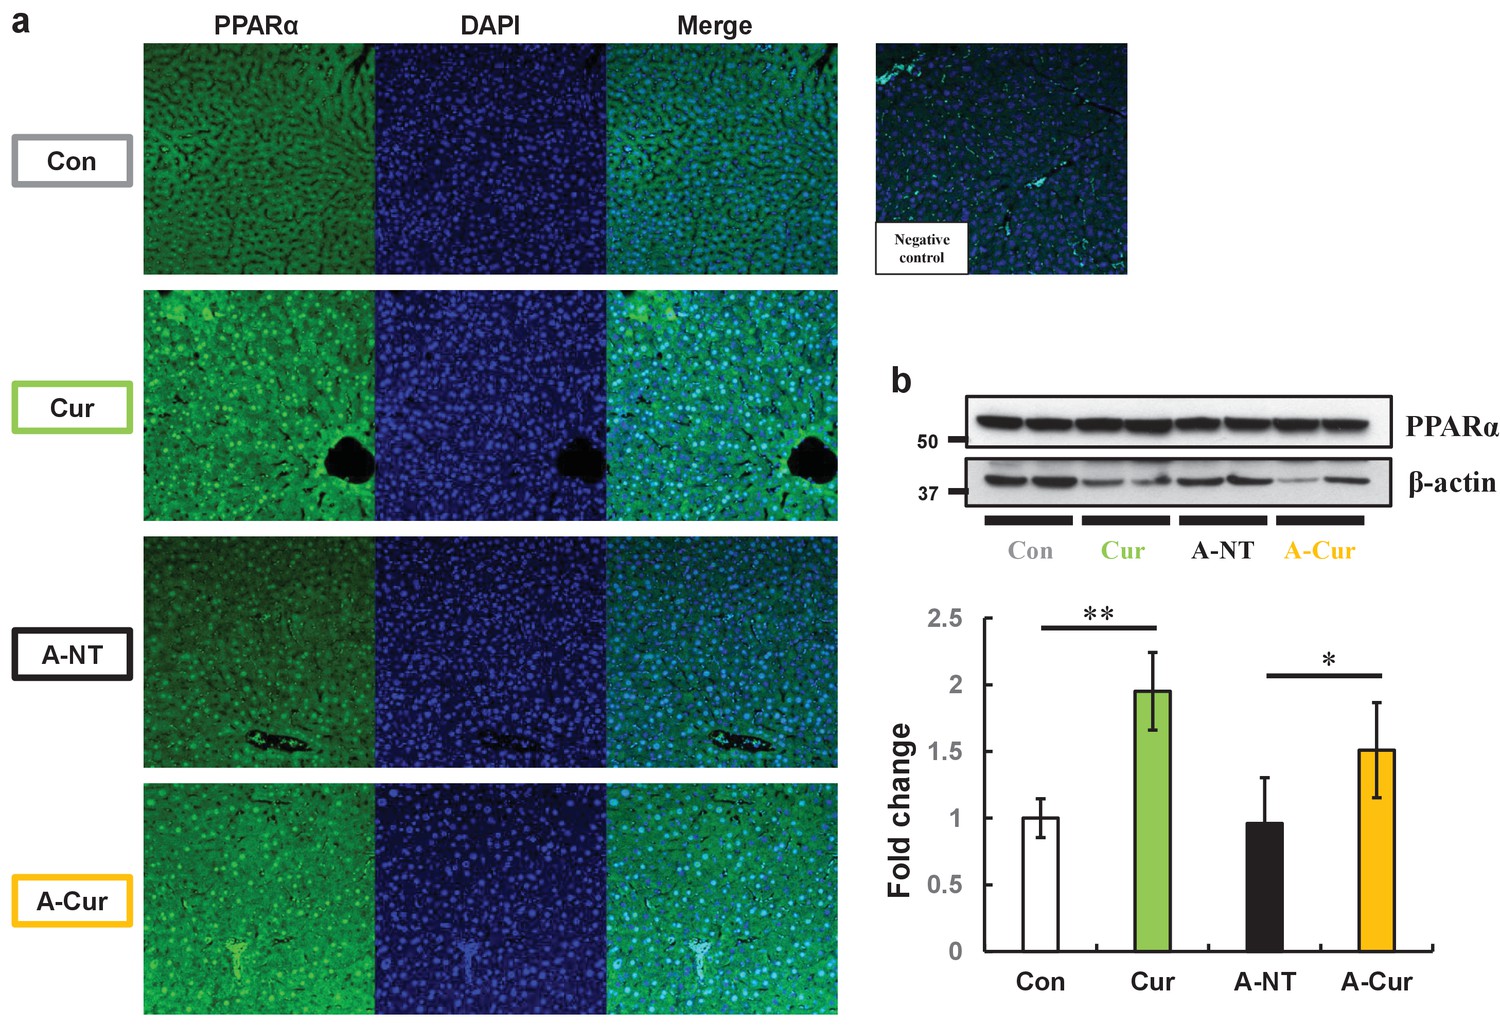
PPARα levels in the liver are increased and show more intranuclear localization in curcumin-supplemented mice.
(a) Immunofluorescence results of PPARa showed obvious intranuclear signal accumulation and extranuclear signal enhancement after curcumin ingestion. (b) Levels of PPARa proteins in the liver were determined by western immunoblot. Data are mean ± SD. The Tukey–Kramer method was used for multiple comparisons; *p < 0.05, **p < 0.01.
Figure 5
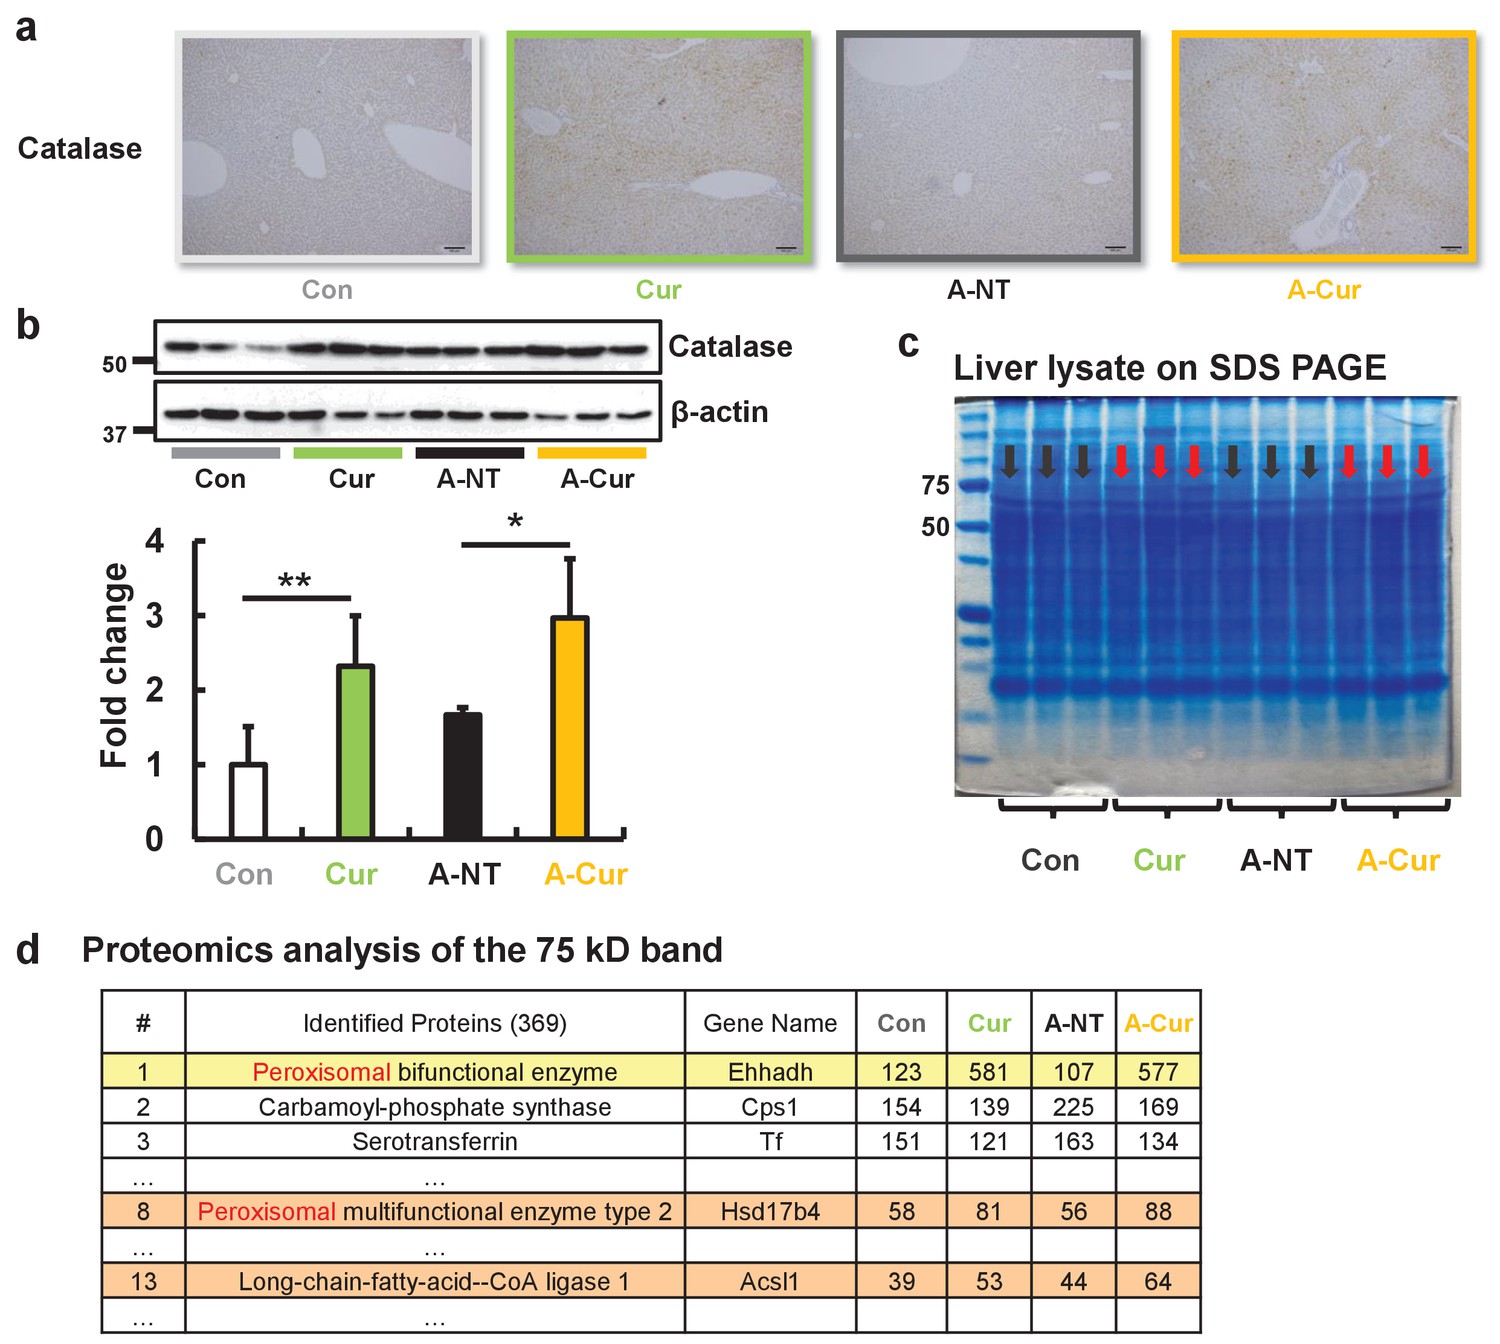
Peroxisome and fatty acid oxidative enzymes are increased in the liver.
IHC (a) and western blot (b) results confirmed that catalase was significantly increased after curcumin supplementation. (c) The protein band near 75 kD of liver lysates exhibited different expression levels for the commercial diet and curcumin diet groups. (d) Three peroxisomal proteins were identified in the band that were found to be upregulated by LC-MS/MS. Data are mean ± SD. The Tukey–Kramer method was used for multiple comparisons; *p < 0.05, **p < 0.01.
Figure 6
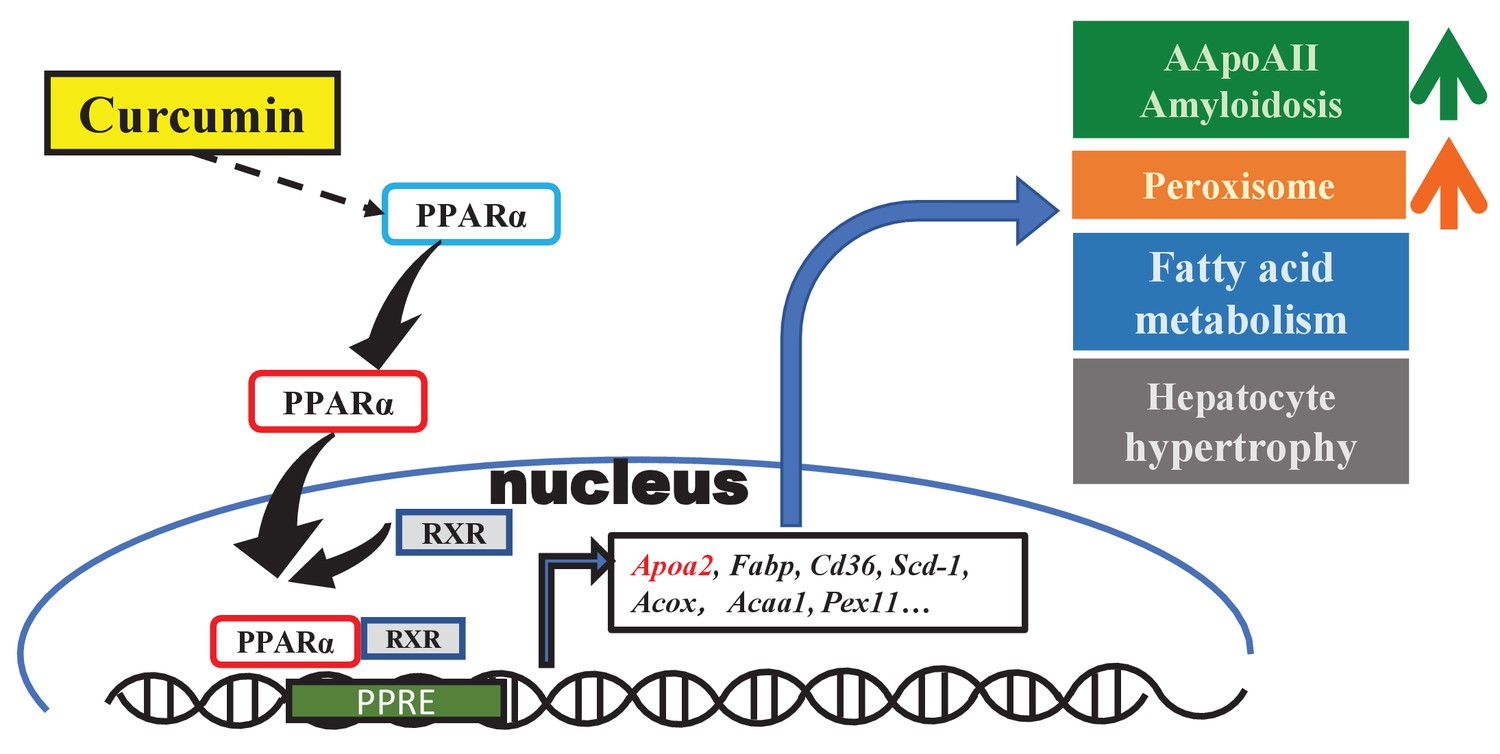
Schematic diagram of the effect of curcumin mediated by PPARa in mouse liver.
Curcumin regulates gene expression via PPARa activation and exhibits biological activities involved in amyloidosis, peroxisome proliferation, lipid metabolism, and hepatocyte hypertrophy.
Additional files
-
Supplementary file 1
Liver and body weight.
- https://cdn.elifesciences.org/articles/63538/elife-63538-supp1-v2.xlsx
-
Supplementary file 2
70KD-proteomics.
- https://cdn.elifesciences.org/articles/63538/elife-63538-supp2-v2.xlsx
-
Supplementary file 3
Primers.
- https://cdn.elifesciences.org/articles/63538/elife-63538-supp3-v2.docx
-
Transparent reporting form
- https://cdn.elifesciences.org/articles/63538/elife-63538-transrepform-v2.docx
Download links
A two-part list of links to download the article, or parts of the article, in various formats.
Downloads (link to download the article as PDF)
Open citations (links to open the citations from this article in various online reference manager services)
Cite this article (links to download the citations from this article in formats compatible with various reference manager tools)
Curcumin promotes AApoAII amyloidosis and peroxisome proliferation in mice by activating the PPARα signaling pathway
eLife 10:e63538.
https://doi.org/10.7554/eLife.63538


