Functional specialization within the inferior parietal lobes across cognitive domains
- Lise Meitner Research Group Cognition and Plasticity, Max Planck Institute for Human Cognitive and Brain Sciences Leipzig, Germany
- Department of Biomedical Engineering, McConnell Brain Imaging Centre, Montreal Neurological Institute, Faculty of Medicine, McGill University, Canada
- Mila - Quebec Artificial Intelligence Institute, Canada
Figures
Figure 1 with 1 supplement
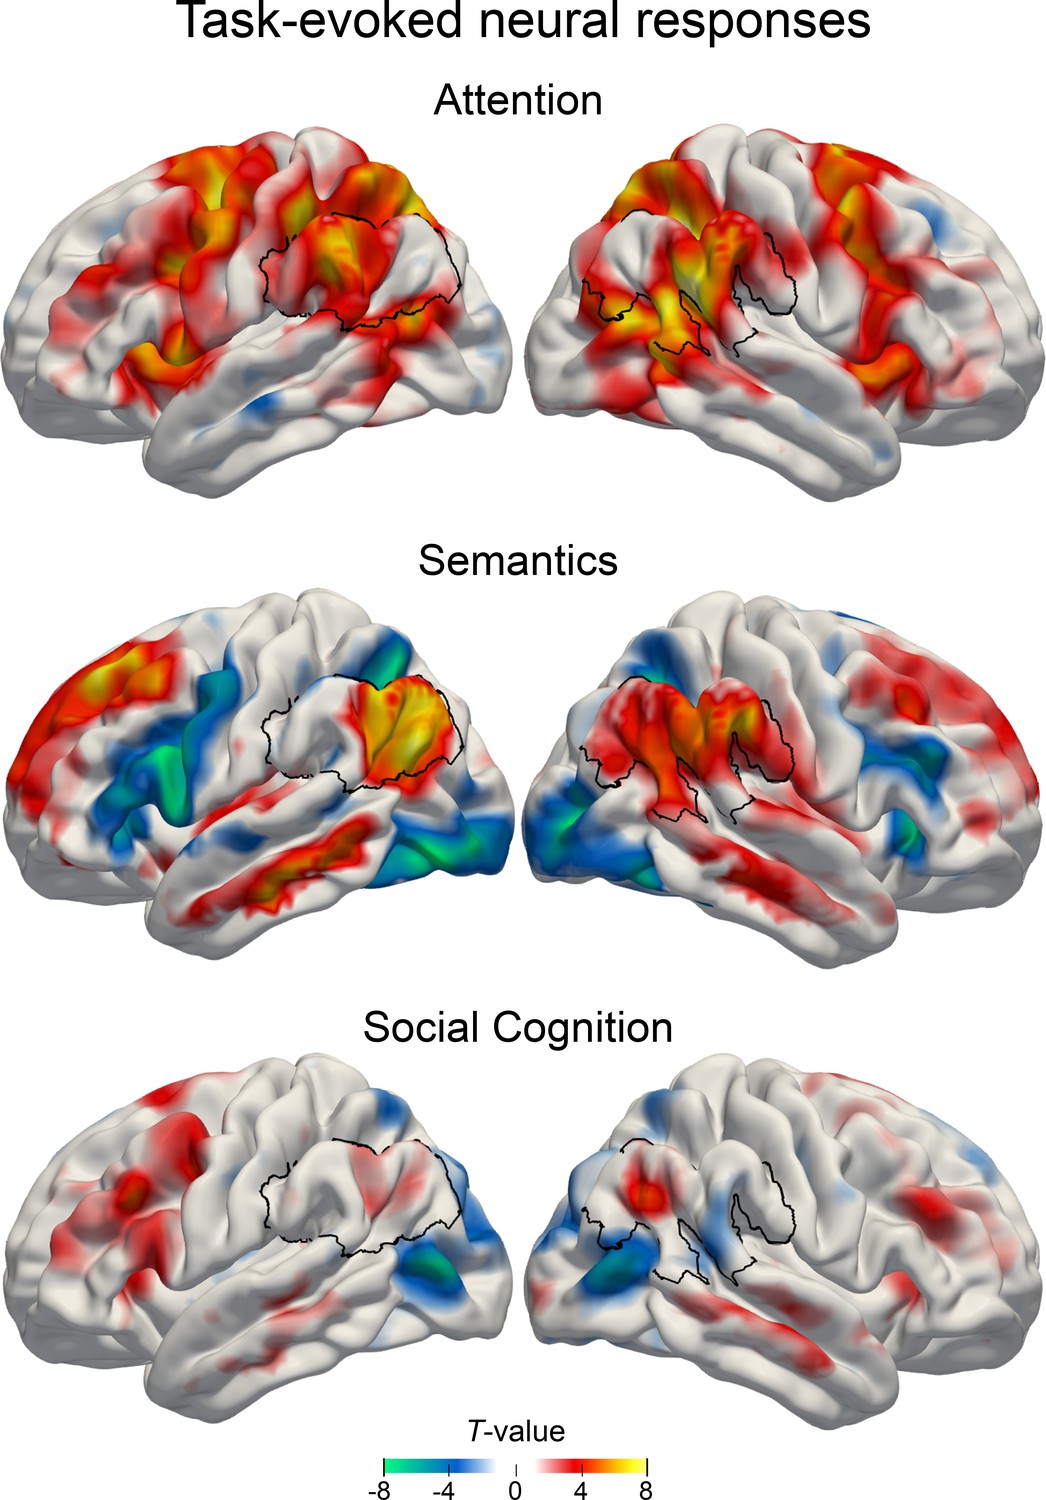
Main effects of estimated neural activity in the three cognitive domains.
Task-dependent BOLD responses were quantified first using common mass-univariate analyses at the whole-brain level. Attentional reorienting task: invalid > valid contrast. Lexical decision task: word > pseudoword contrast. Perspective taking task: false belief > true belief contrast. Colors indicate unthresholded T-values for display purposes. Warm colors: higher GLM beta estimates for the target conditions. Cold colors: higher GLM beta estimates for the control condition. Black outline: region of interest in the inferior parietal lobe.
Figure 1—figure supplement 1
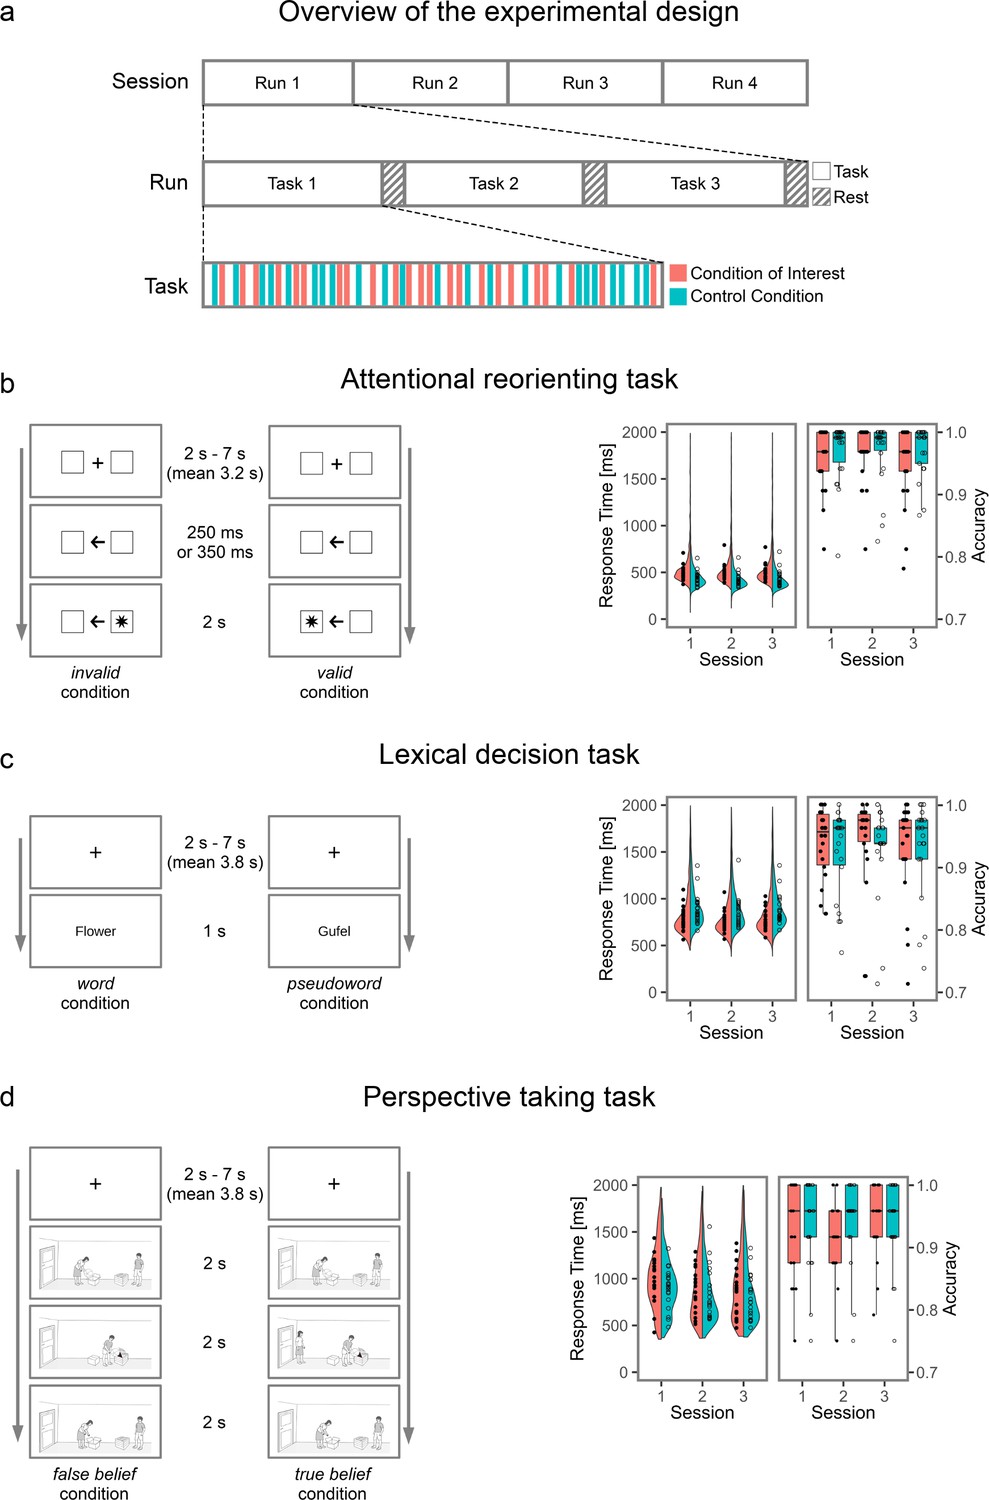
Experimental design and behavioral results.
(a) Experimental design. Each of the four sessions consisted of four fMRI runs. In each run, all three tasks were presented in a pseudo-randomized order and analyzed in an event-related fashion. (b) Attentional reorienting task. In each trial, a directional arrow appeared at the center of the screen to direct the subject’s attention to the left or right. In 75% of the trials, the arrow correctly predicted the position of the target (valid condition), in 20% of the trials, the target appeared on the opposite side and subjects had to reorient their attention (invalid condition). In 5% of the trials, no response was prompted (catch condition). Subjects indicated the side of the target via button press. (c) Lexical decision task. Participants performed lexical decisions (word or pseudoword condition) based on concrete German nouns or well-matched pseudowords. (d) Perspective taking task. In each trial, character A places a target object in a container. Thereafter, character B changes the location of the target object. Character A has left the room (false belief condition) or watches the relocation of the object (true belief condition). Character A then searches for the target object at the location congruent with her / his knowledge (expected) or at the contradicting location (unexpected). Participants had to indicate via button press whether character A searched at the expected location or not. Behavioral results for each task are shown in the right panel, separately for each session. Single subject data is overlaid as circles.
Figure 2 with 3 supplements
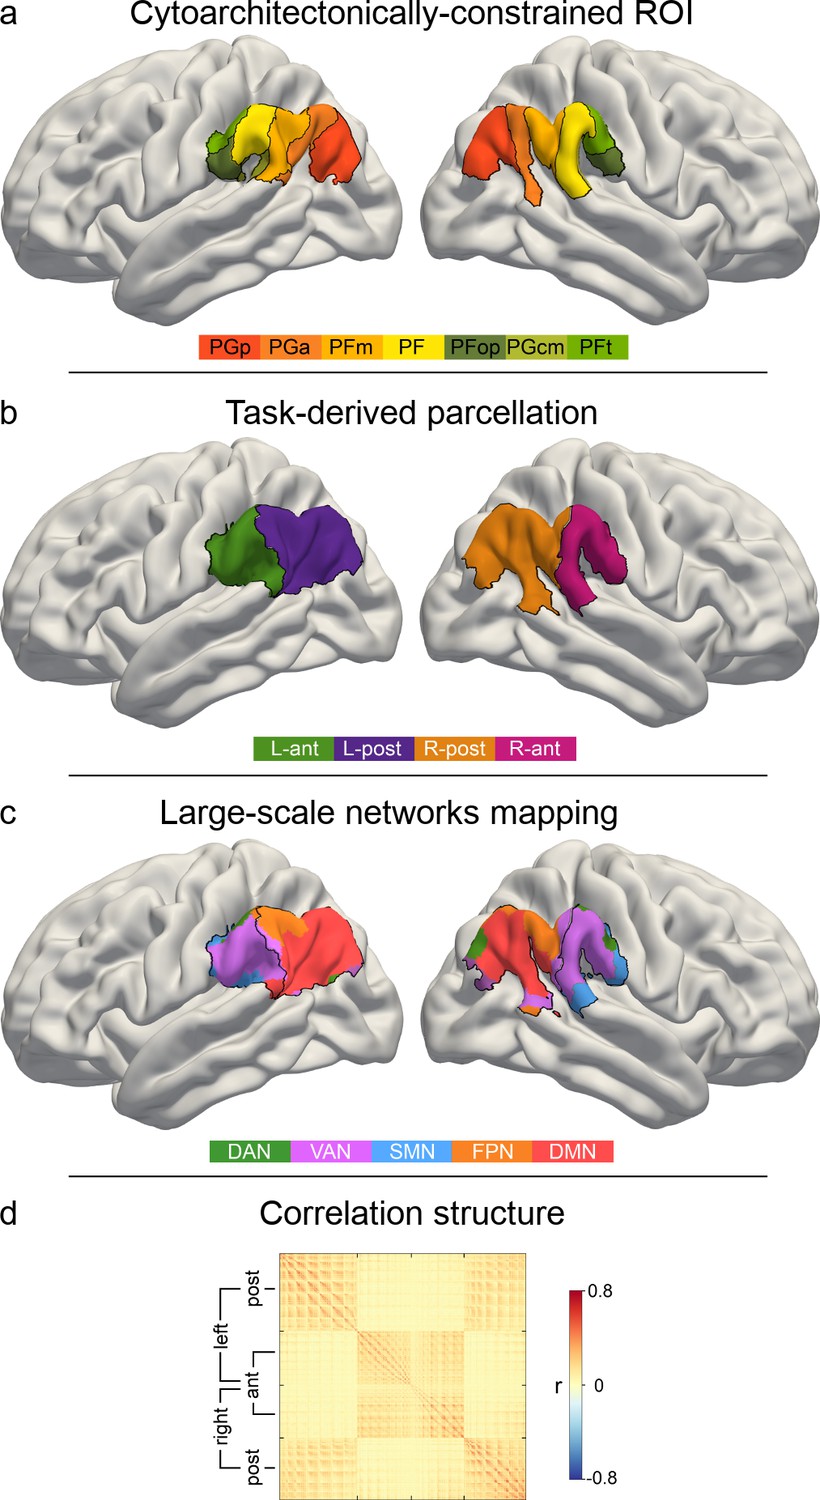
IPL parcellation extracted from neural activity responses across attention, semantics, and social cognition.
Neural activity estimates from all three task experiments were pooled to achieve a data-driven segregation of the inferior parietal lobe, separately in each hemisphere. (a) Cytoarchitectonic boundaries defined the contours of our region of interest (ROI) (Zilles and Amunts, 2010). (b) The derived ROI was submitted to automatic parcellation into subregions to capture neural activity profiles of the three domains in each hemisphere. L-ant: left anterior subregion. L-post: left posterior subregion. R-ant: right anterior subregion. R-post: right posterior subregion. (c) Mapping of large-scale brain networks (Yeo et al., 2011) to the ROI. Posterior subregions are predominantly populated by the default mode network (DMN), while the anterior regions mainly host the ventral attention network (VAN). DAN: dorsal attention network. FPN: fronto-parietal network. SMN: somatomotor network. (d) Similarity matrix of voxel-wise neural activity estimates of single trials, reordered according to (c). The similarity structure reproduces the parcellation results.
Figure 2—figure supplement 1
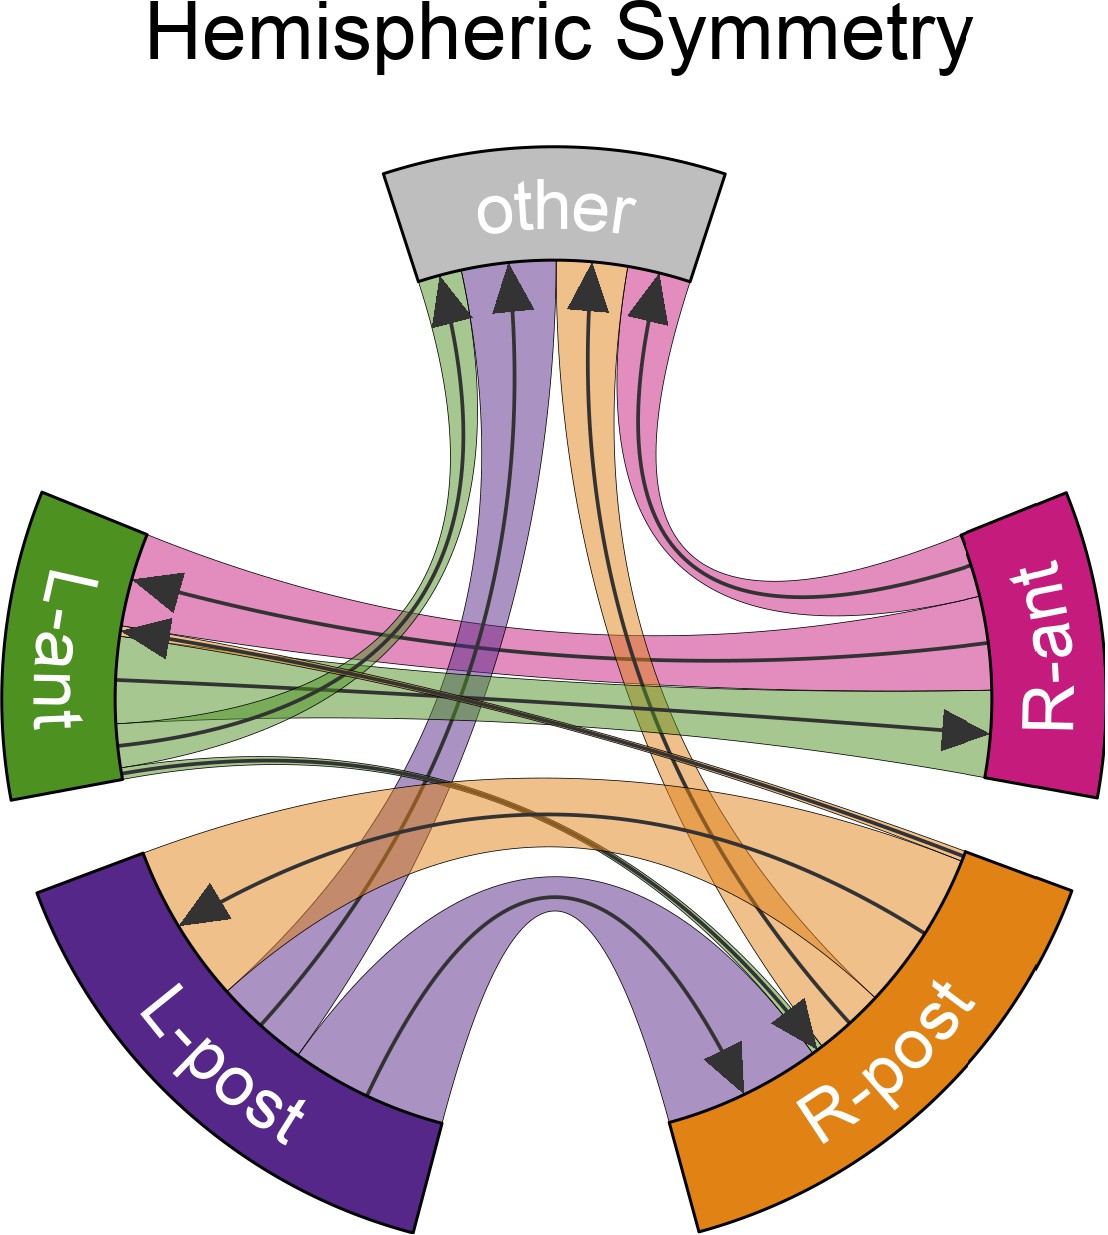
The final subregion solution shows a high degree of symmetry between hemispheres.
Evidence supporting the hemispheric symmetry of the final two-subregion solution in the region of interest parcellation by clustering algorithms. The illustration shows the proportion of subregion-voxels falling into the homologue by flipping the x-axis, and the proportion of subregion-voxels falling into other areas.
Figure 2—figure supplement 2
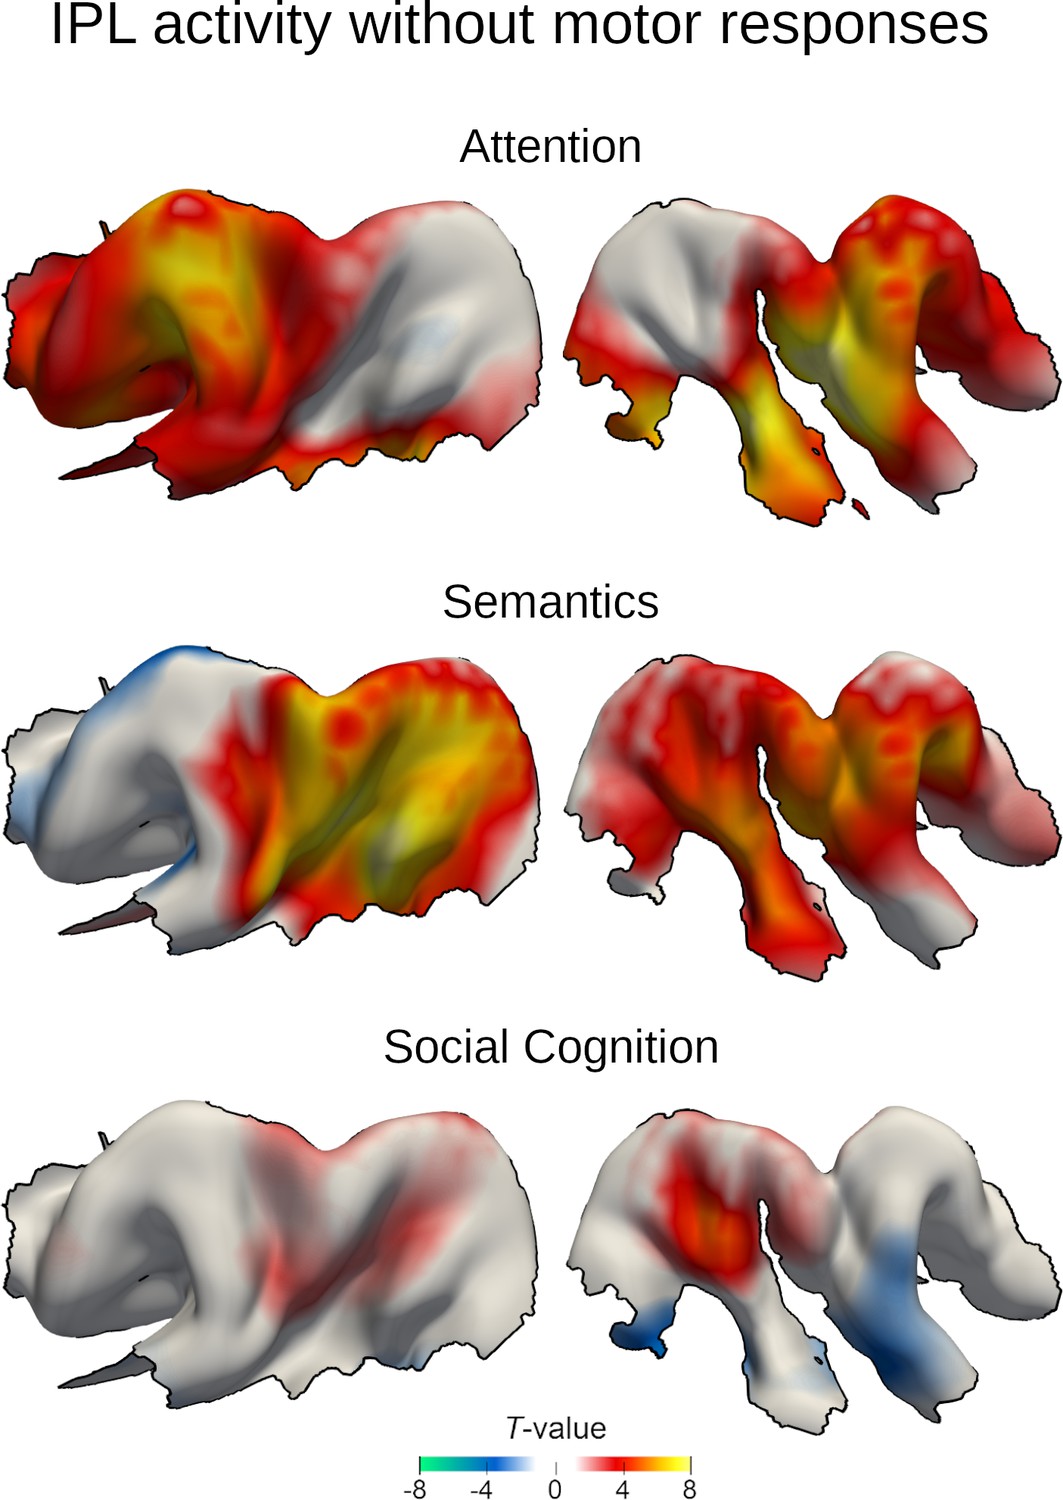
Task-evoked neural responses in the IPL region with explicit modeling of motor responses.
Task-dependent BOLD responses from the model that explicitly accounts for general motor responses across tasks (GLMcond+RT) resemble results from the original model (GLMcond, Figure 1). Colors indicate unthresholded T-values. Warm colors: higher GLM beta estimates for the target conditions. Cold colors: higher GLM beta estimates for the control condition.
Figure 2—figure supplement 3
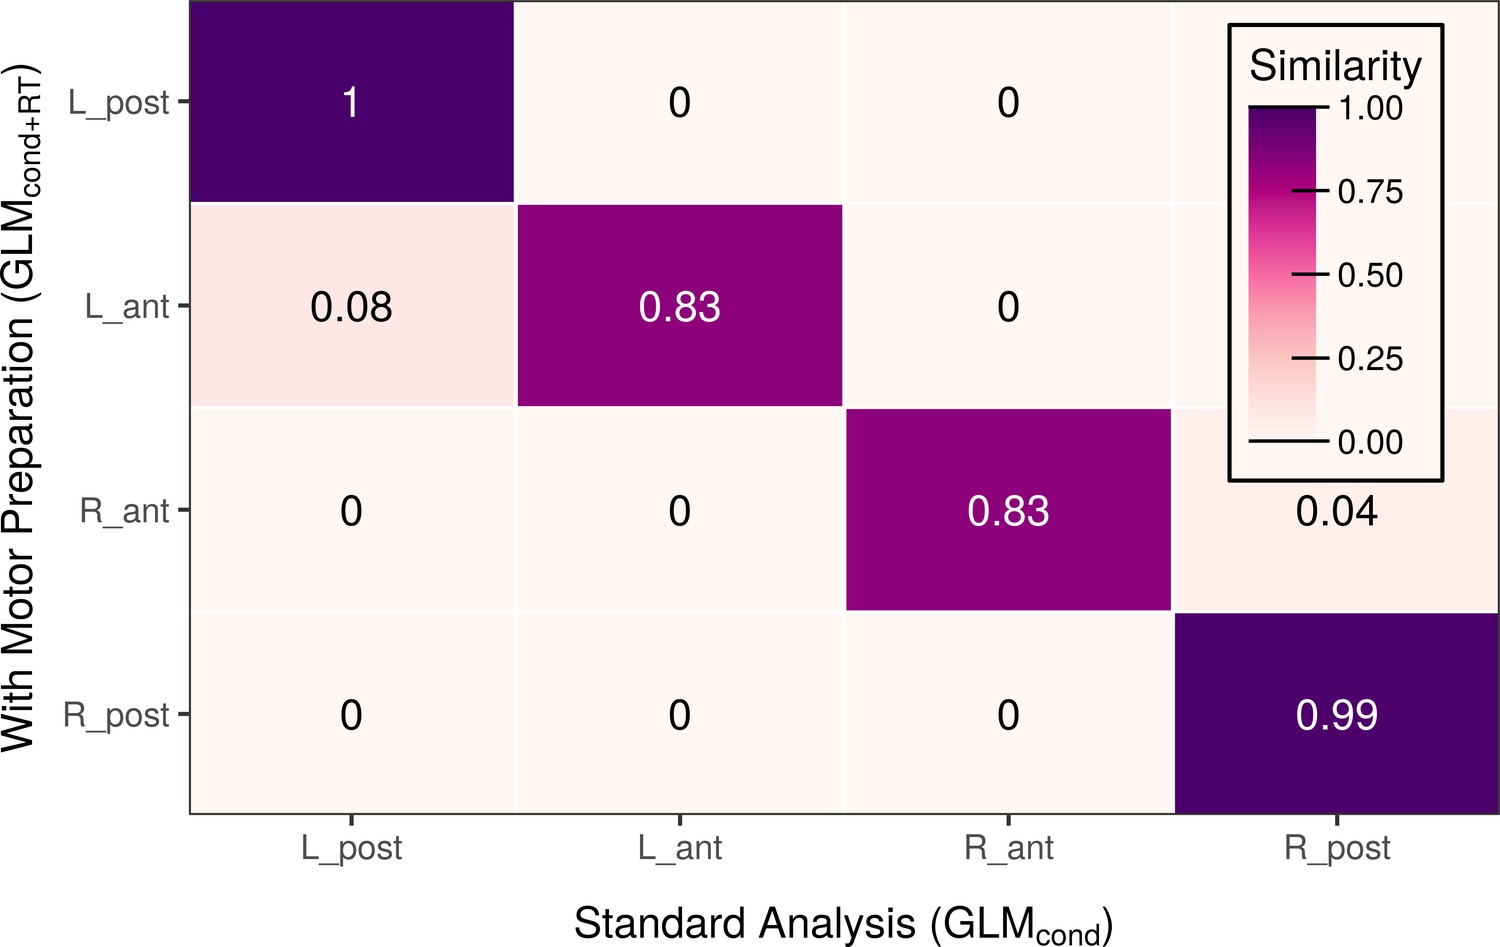
Explicitly modeling motor responses yields a similar clustering solution.
The illustration shows the cluster-wise similarity of the parcellation solution based on the model that captured preparatory motor responses across tasks (GLMcond+RT) compared to the basic model (GLMcond).
Figure 3 with 1 supplement
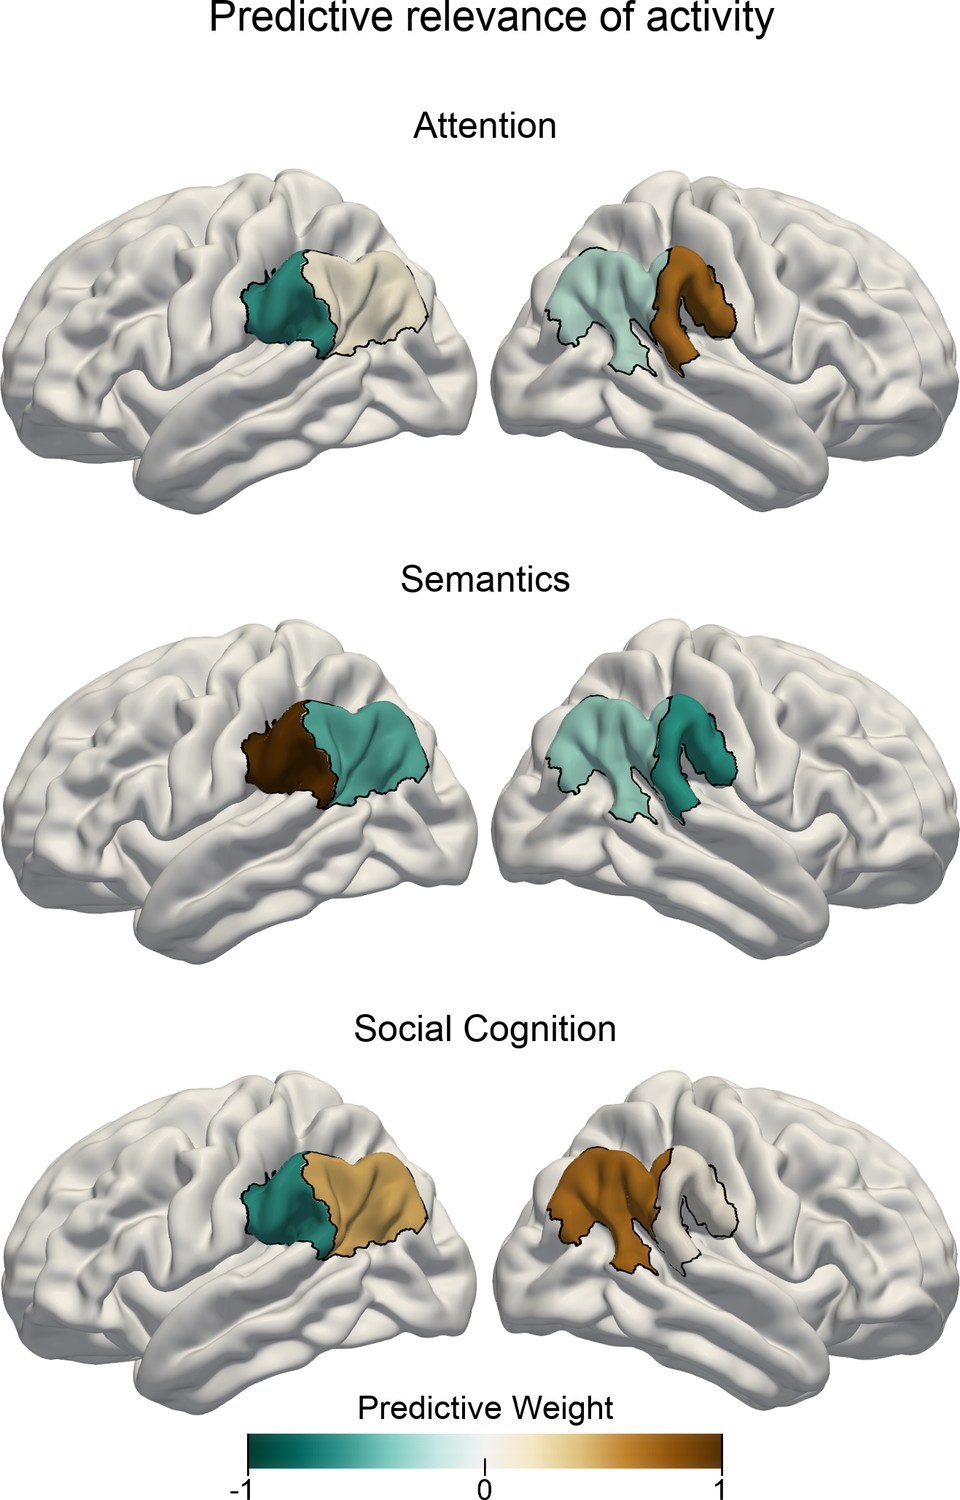
Task-specific predictive contributions of IPL subregions.
Pattern-learning algorithms extracted predictive rules from neural activity estimates aggregated in the left vs. right anterior vs. posterior IPL subregions from the three target experimental conditions for attentional reorienting (top), lexical decisions (center), and perspective taking of others’ mental states (bottom). Colors show the predictive signature with relative contributions of each of the four IPL subregions in detecting the presence of the three cognitive states from neural activity responses. A more positive subregion weight (brown color) for a given task implies that neural activity from this subregion carried information that increased the probability of a specific task being represented in trial brain scans. A leave-one-subject-out cross-validation was implemented to fit the predictive model. Negative values (cold colors) denote driving the prediction decision toward the respective other tasks.
Figure 3—figure supplement 1
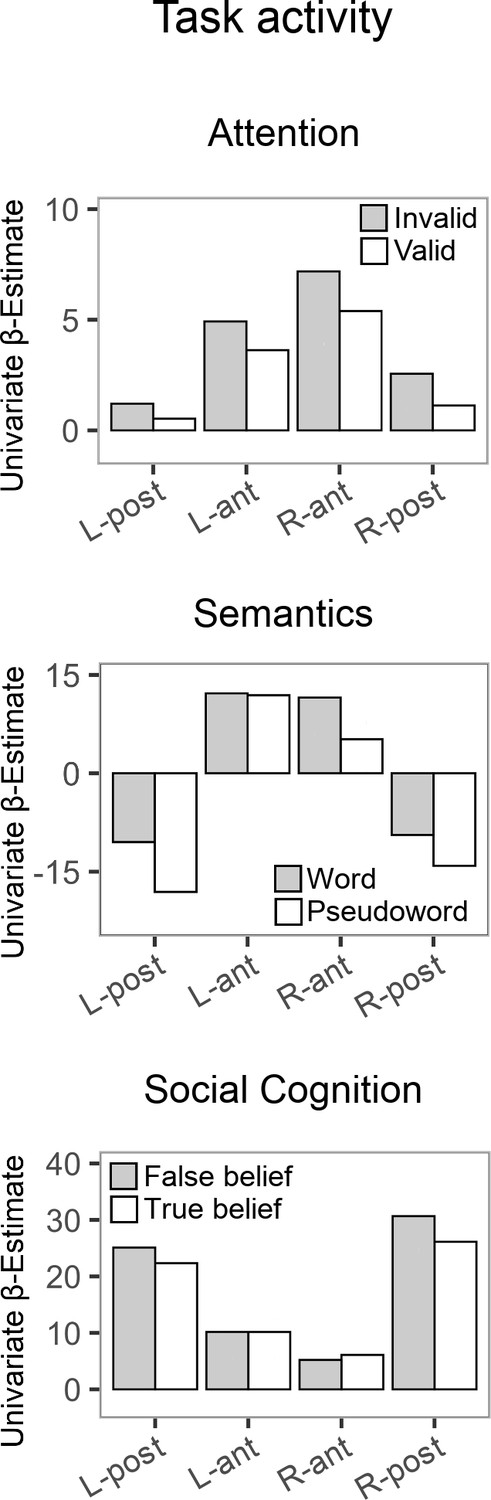
Neural activity estimates for the target and control conditions of the three tasks.
For visualization purposes, beta estimates were extracted from GLMcond at the center of mass for each IPL subregion.
Figure 4 with 1 supplement
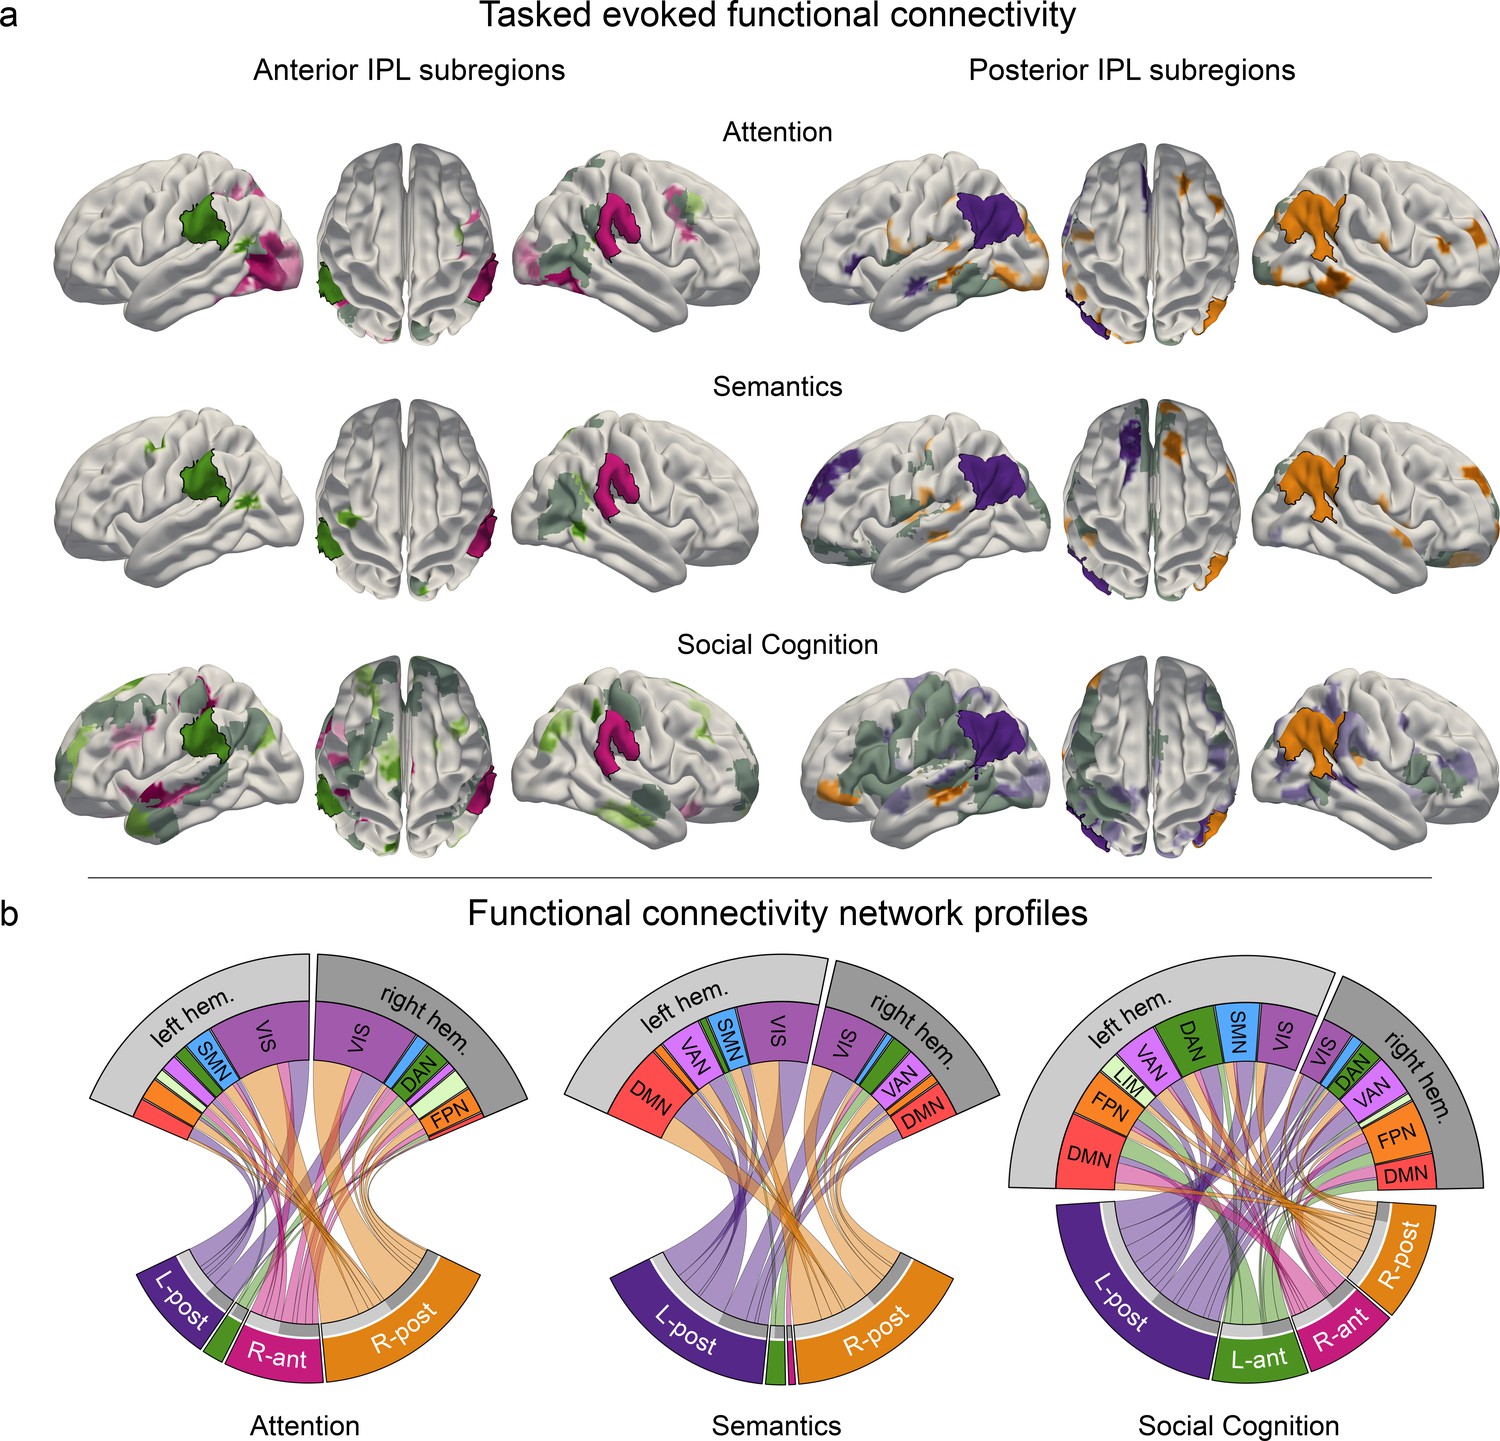
Task-induced shifts in cortex-wide functional connectivity.
Task-dependent functional connectivity profiles of the four IPL subregions with other coupling partners, compared to the respective other tasks. (a) Task-specific correlation between anterior (left) and posterior (right) IPL subregions and brain-wide cortical regions. All results are statistically significant at p < 0.05, tested against the null hypothesis of indistinguishable connectivity strength between a given IPL subregion and the rest of the brain across all three tasks. L-ant: left anterior IPL subregion; L-post: left posterior IPL subregion; R-ant: right anterior IPL subregion; R-post: right posterior IPL subregion. Dark gray: mutual connectivity target. (b) Task-specific connectivity profiles of the four IPL subregions with seven large-scale brain networks (Yeo et al., 2011). DAN: dorsal attention network. DMN: default mode network. FPN: fronto-parietal network. LIM: limbic network. VAN: ventral attention network. SMN: somatomotor network. VIS: visual network.
Figure 4—figure supplement 1
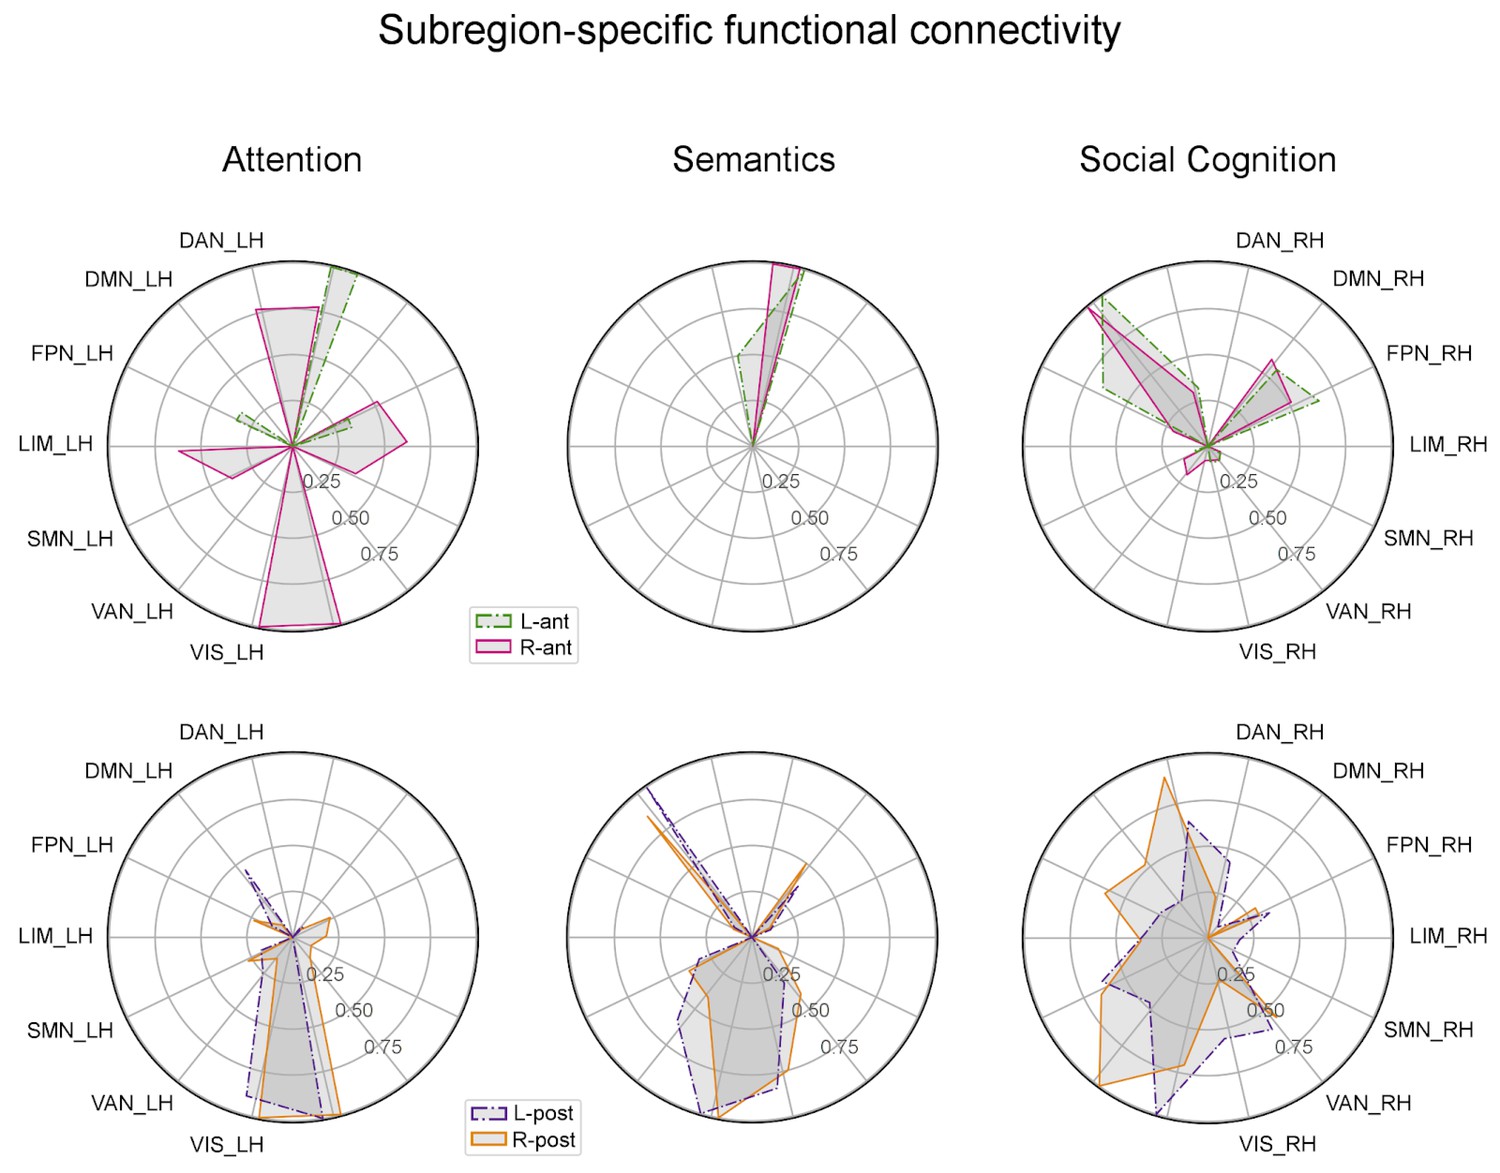
Subregion-specific functional connectivity.
The preferred connectivity between IPL subregions and brain-wide cortical regions identified task-specific coupling motifs of the four subregions. Large-scale brain networks were split into their left and right hemispheric parts. Functional connectivity was normalized per subregion and task. Anterior IPL subregions (top row) connect in a hemisphere specific way, while posterior IPL subregions (bottom row) connect in a more bilateral-symmetric way. LH/RH: left/right hemispheric network parts. See main text for details on the connectivity metric. Network acronyms as defined in the main text.
Figure 5
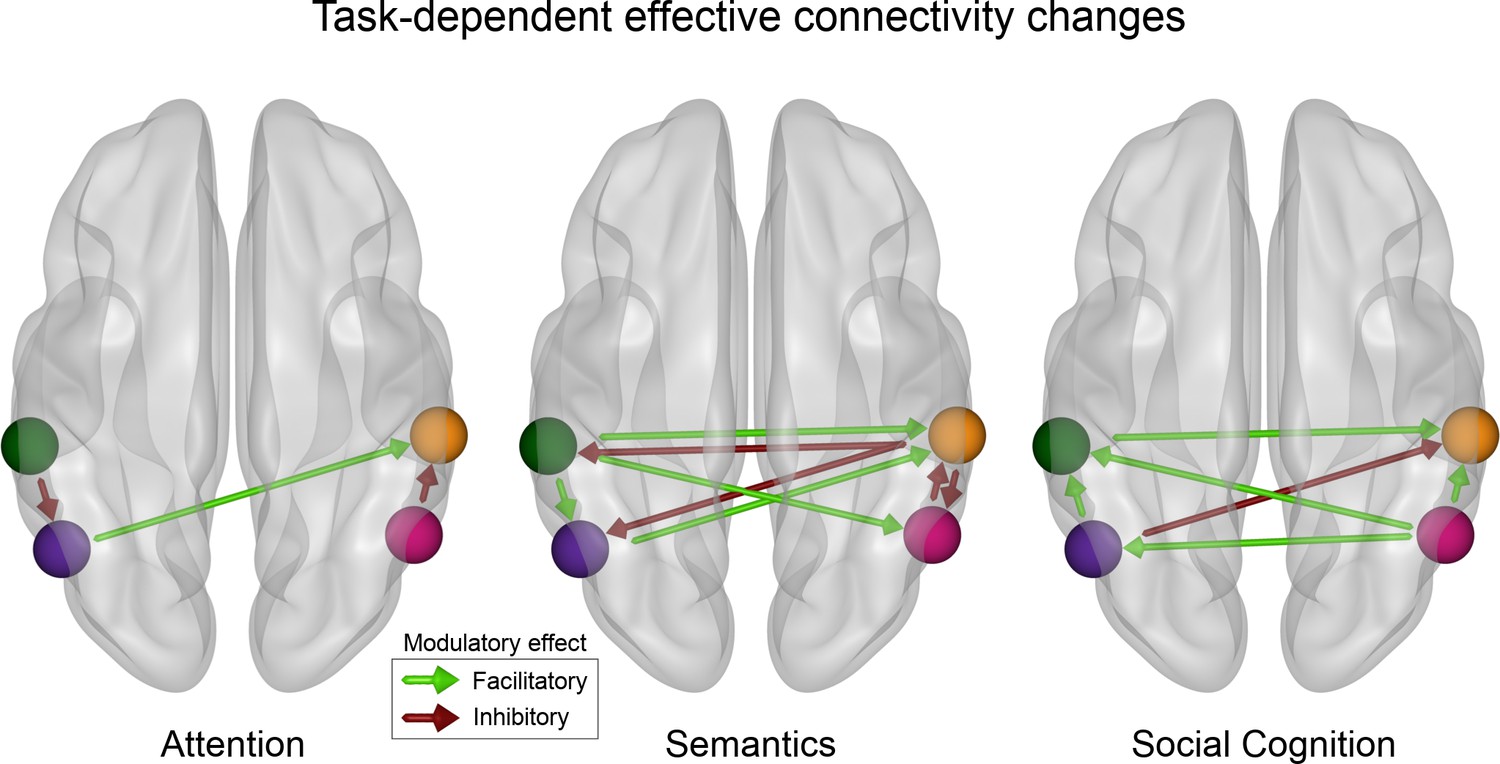
Tasks cause different effective connectivity modulations among IPL subregions.
The modulation assessed by dynamic causal modeling (DCM) of directed connectivity among the four IPL subregions differs between attentional reorienting, lexical decisions, and perspective taking. Only significant modulatory parameters (α ≤ 0.01) are shown (based on the non-parametric permutation analysis). Attentional reorienting induces comparatively simple connectivity modulations, while both other tasks are characterized by richer changes in the modulatory influences between subregions. Lexical decisions increase facilitatory influences from the left to the right hemisphere and inhibition from the right to the left. Perspective taking causes bilateral increases in the facilitatory influence from posterior to anterior subregions. Green: DCM node in the left anterior subregion (L-ant). Violet: DCM node in the left posterior subregion (L-post). Orange: DCM node in the right anterior subregion (R-ant). Pink: DCM node in the right posterior (R-post) subregion.
Tables
Table 1
Task-derived IPL subregions.
| Hemisphere | Position | Label | Volume | Center of mass | Cytoarchitectonic area |
|---|---|---|---|---|---|
| Left | Anterior | L-ant | 11.6 cm3 | −57,–32, 30 | PF, PFop, PGcm, PFt |
| Left | Posterior | L-post | 20.7 cm3 | −48,–61, 33 | PGa, PGp, PFm, PF |
| Right | Anterior | R-ant | 12.9 cm3 | 58,–29, 28 | PF, PFop, PGcm, PFt |
| Right | Posterior | R-post | 19.8 cm3 | 51,–57, 32 | PGa, PGp, PFm |
-
Note: Cytoarchitectonic assignment was performed with the SPM Anatomy Toolbox. Center of mass is given in MNI coordinates (x, y, z).
Table 2
Task-specific effective connectivity modulation.
| Source subregion | Target subregion | Modulation strength | p-value | |
|---|---|---|---|---|
| Attention | ||||
| L-ant | → | R-post | −1.93 | 0.0017 |
| L-post | → | R-ant | 3.01 | 0.0033 |
| R-post | → | R-ant | −1.50 | 0.0007 |
| Semantics | ||||
| L-ant | → | L-post | 1.08 | 0.0012 |
| L-ant | → | R-ant | 0.97 | <0.0001 |
| L-ant | → | R-post | 1.27 | 0.0026 |
| L-post | → | R-ant | 1.26 | <0.0001 |
| R-ant | → | L-ant | −1.49 | 0.0031 |
| R-ant | → | L-post | −2.45 | 0.0001 |
| R-ant | → | R-post | −3.24 | <0.0001 |
| R-post | → | R-ant | −0.22 | <0.0001 |
| Social cognition | ||||
| L-ant | → | R-ant | 0.30 | 0.0078 |
| L-post | → | L-ant | 1.23 | <0.0001 |
| L-post | → | R-ant | −0.57 | 0.0013 |
| R-post | → | L-ant | 1.76 | <0.0001 |
| R-post | → | L-post | 1.43 | <0.0001 |
| R-post | → | R-ant | 2.13 | <0.0001 |
-
Note: Significant modulatory parameters (‘B-matrix’, α ≤0.01) of connectivity between subregions. Based on a random effects permutation test for the null hypothesis ‘no parameter difference between tasks’. The strength is given as posterior expectation from the optimum Bayesian parameter average model.
Additional files
-
Supplementary file 1
Mass-univariate activation peaks for the three functional domains.
- https://cdn.elifesciences.org/articles/63591/elife-63591-supp1-v2.docx
-
Supplementary file 2
Intrinsic effective connectivity and task-specific self-connectivity modulation.
- https://cdn.elifesciences.org/articles/63591/elife-63591-supp2-v2.docx
-
Transparent reporting form
- https://cdn.elifesciences.org/articles/63591/elife-63591-transrepform-v2.pdf
Download links
A two-part list of links to download the article, or parts of the article, in various formats.
Downloads (link to download the article as PDF)
Open citations (links to open the citations from this article in various online reference manager services)
Cite this article (links to download the citations from this article in formats compatible with various reference manager tools)
Functional specialization within the inferior parietal lobes across cognitive domains
eLife 10:e63591.
https://doi.org/10.7554/eLife.63591


