Genome-wide CRISPR screen identifies noncanonical NF-κB signaling as a regulator of density-dependent proliferation
- Department of Cell and Developmental Biology Vanderbilt University School of Medicine Nashville, United States
Figures
Figure 1 with 2 supplements
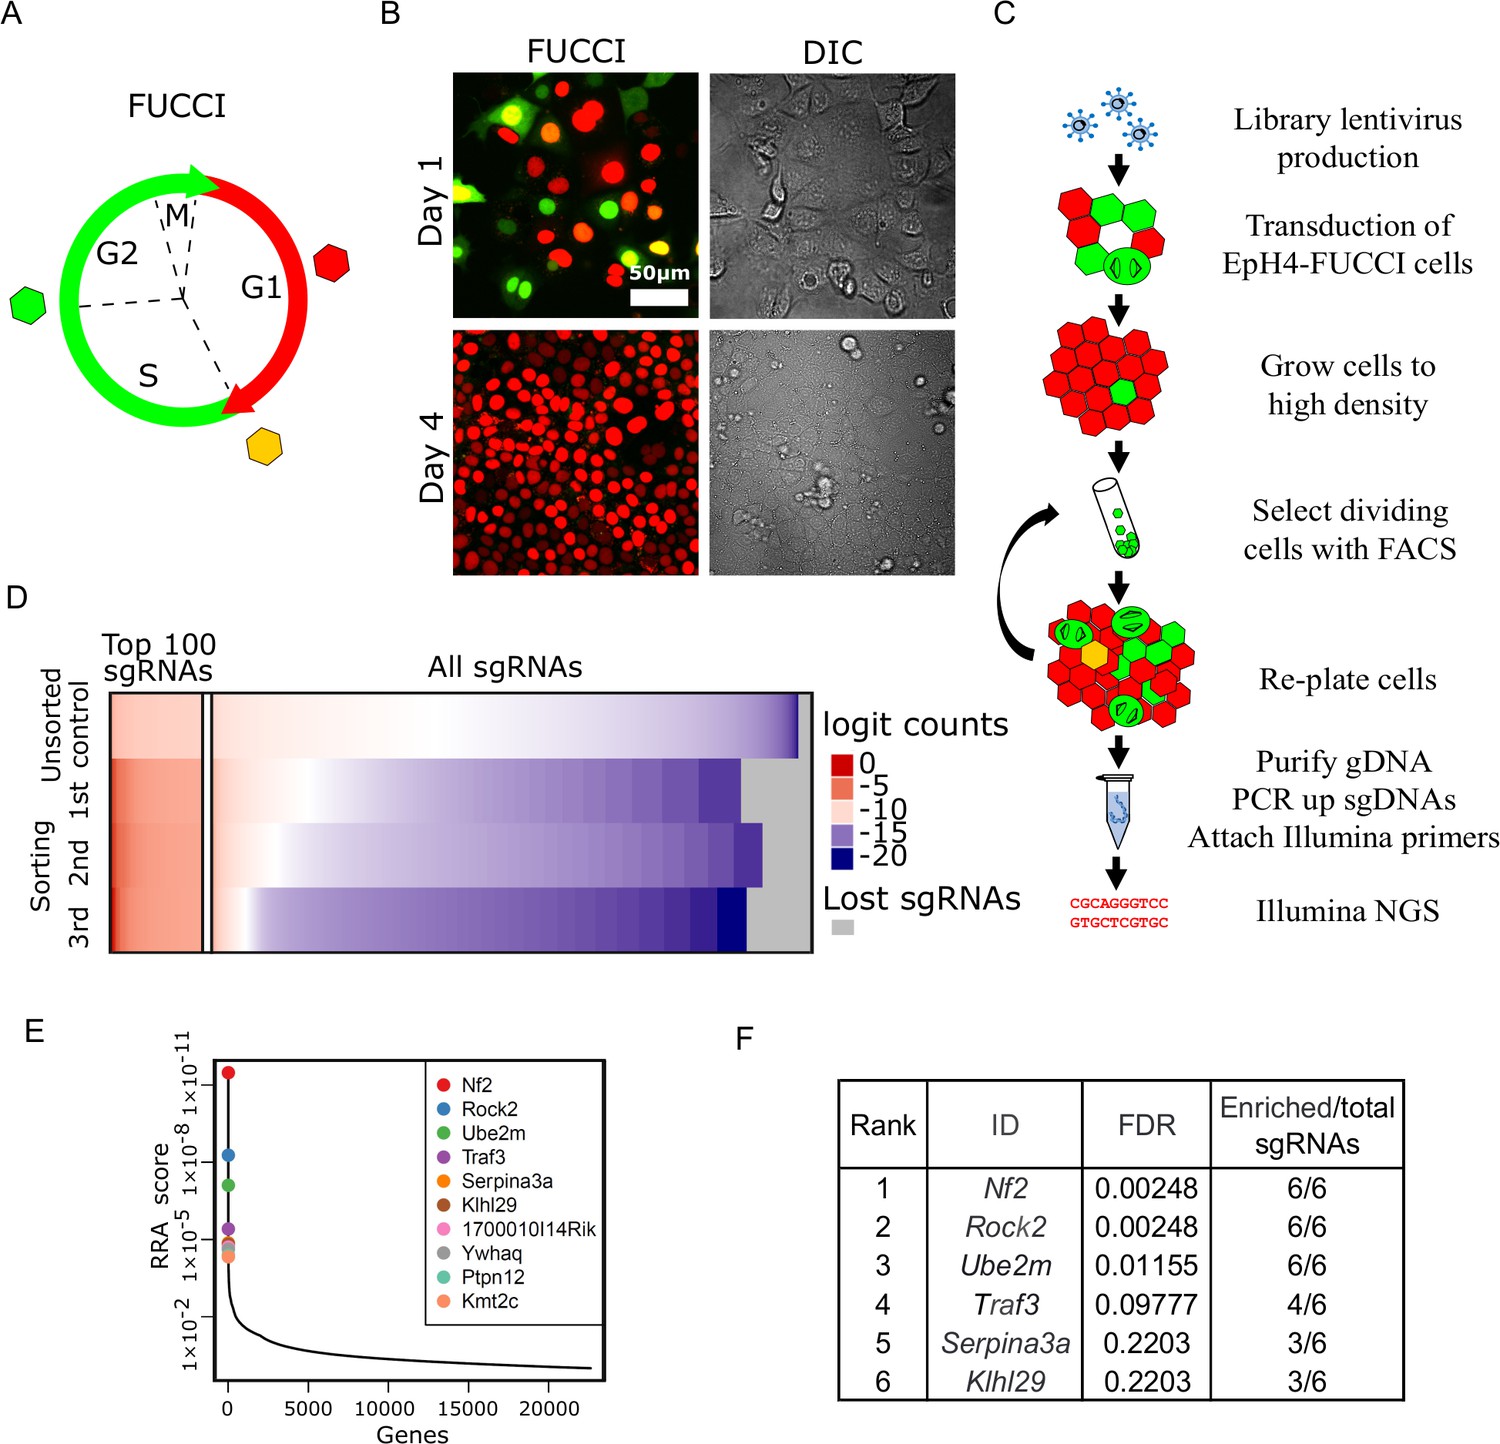
Whole-genome screening for genes that inhibit proliferation at homeostatic cell density.
(A) Schematic of fluorescence ubiquitination cell cycle indicator (FUCCI) color transitions through cell cycle. (B) EpH4-FUCCI stable cell line grown to 1 and 4 days post-confluency. (C) Whole-genome CRISPR Knock Out screening strategy. (D) Read count distribution for samples before sorting and after different rounds of sorting. Data are logit transformed (f(p) = log2(p/1 - p) where p is the proportion of a given sgRNA in the total number of sgRNAs in a sample). Color coding shows depleted sgRNAs in blue, enriched sgRNAs in red, and sgRNA with no enrichment in white. Gray shows lost sgRNAs. (E) Genes plotted based on their RRA enrichment score (third sorting). (F) List of genes with FDR below 0.25 and ≥3 sgRNAs enriched compared to control after third sort.
-
Figure 1—source data 1
Source data file for Figure 1.
- https://cdn.elifesciences.org/articles/63603/elife-63603-fig1-data1-v2.xlsx
Figure 1—figure supplement 1
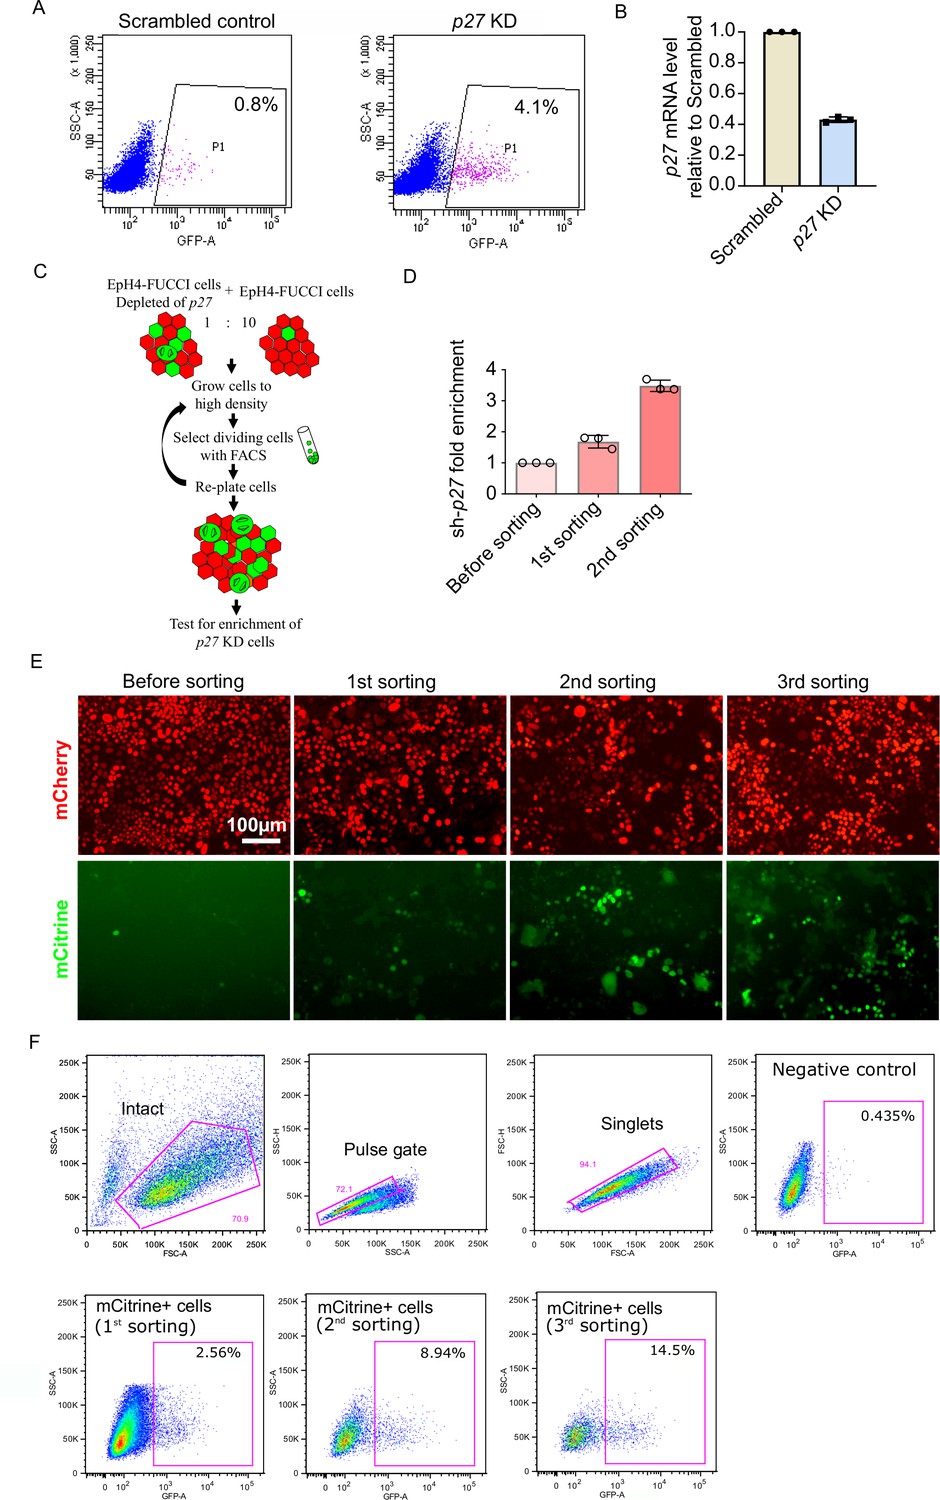
Proof of principle experiments for the whole-genome screen.
Accumulation of mCitrine+ cells after FACS rounds. (A) Sorting of EpH4-fluorescence ubiquitination cell cycle indicator (FUCCI) cells by fluorescenceactivated cell sorting (FACS). The number of mCitrine+ cells is increased by depletion of p27. (B) p27 mRNA level in p27 KD cells relative to scrambled control cells measured by qPCR. (C) Strategy for proof-of-principle experiments. (D) Enrichment of sh-p27 after first and second round of FACS, compared to sh-p27 content before FACS, measured by qPCR. Histogram shows mean ± 1 s.d. (n = 3 technical repeats). (E) Imaging of EpH4-FUCCI cells at 4 days post-confluency before sorting and after different rounds of FACS. (F) Gating for sorting EpH4-FUCCI cells by FACS. The number of mCitrine+ cells increases after each round of sorting.
-
Figure 1—figure supplement 1—source data 1
Source data file for Figure 1—figure supplement 1.
- https://cdn.elifesciences.org/articles/63603/elife-63603-fig1-figsupp1-data1-v2.xlsx
Figure 1—figure supplement 2
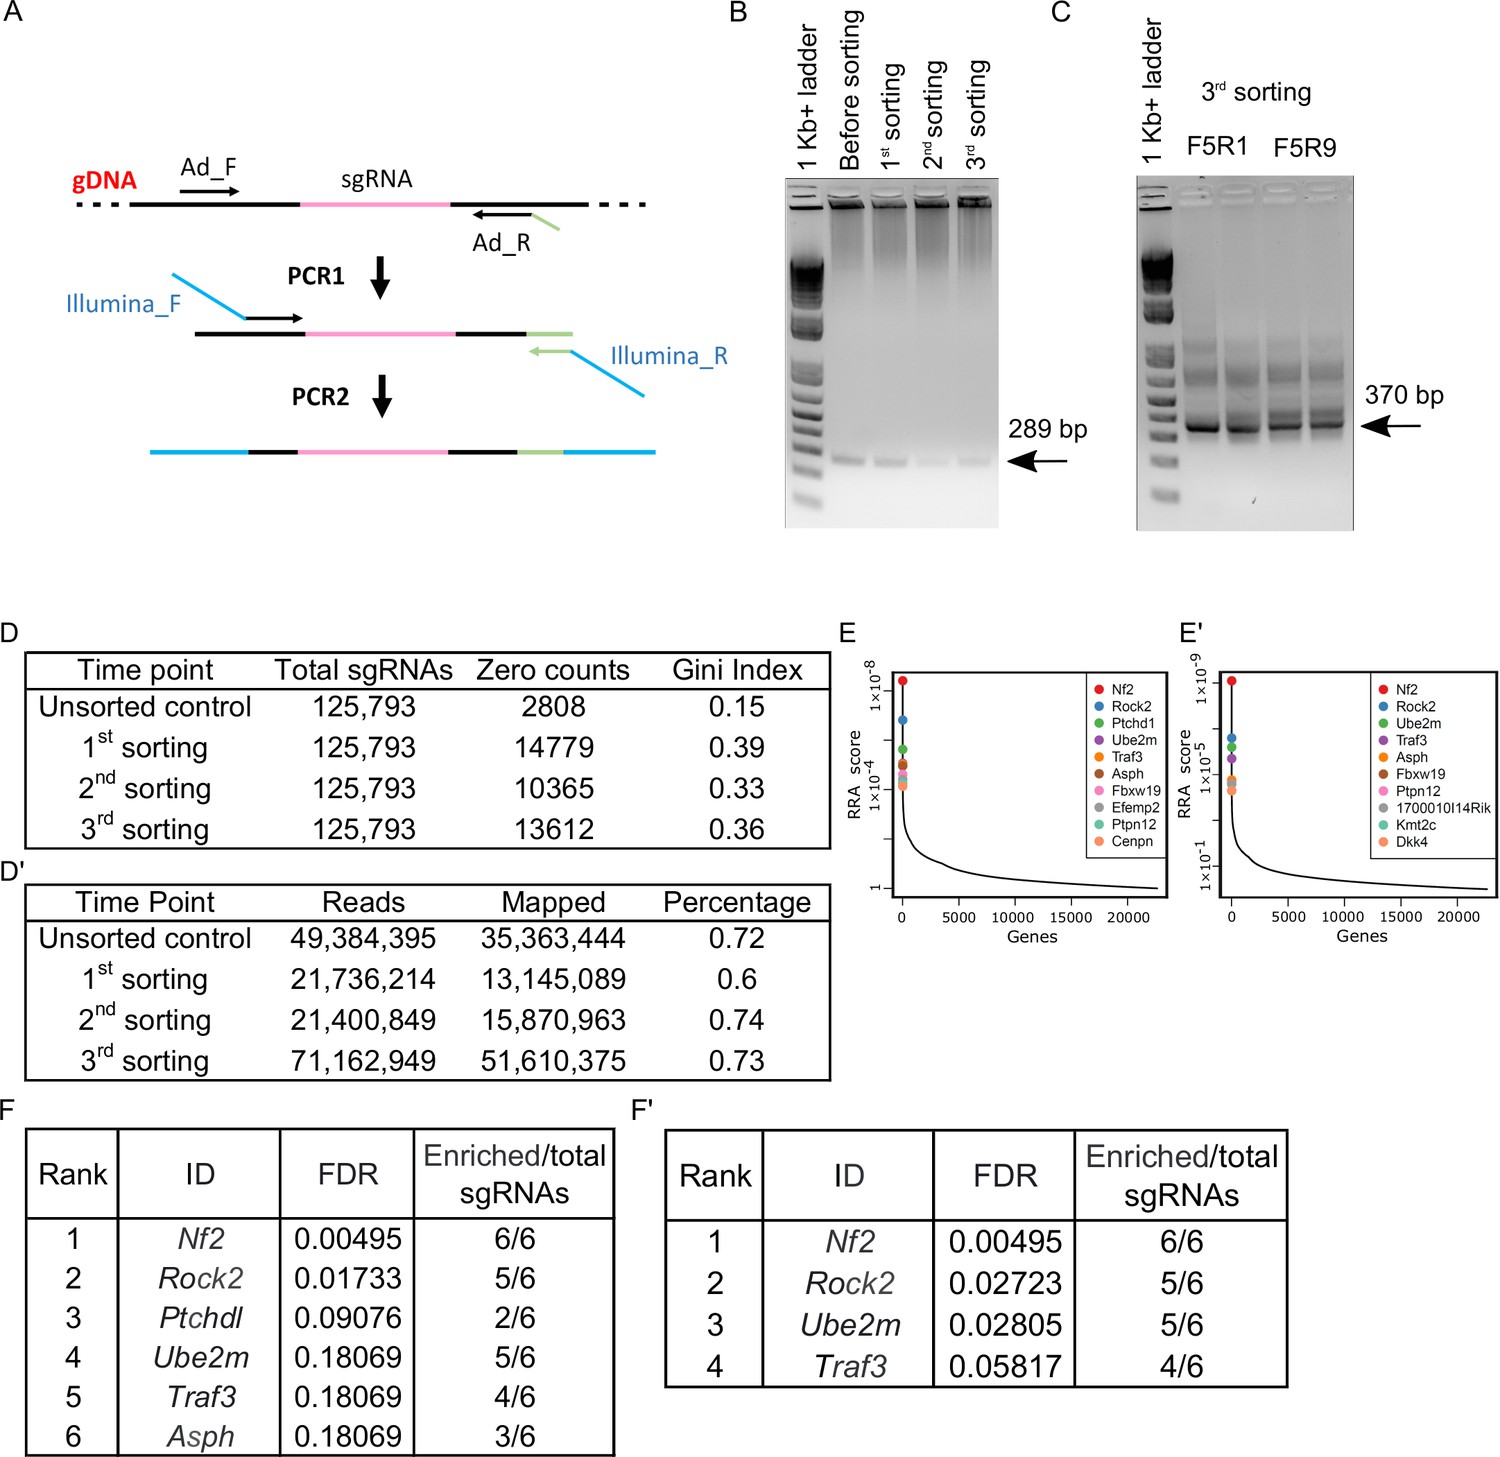
sgRNA sequence PCR for next-generation sequencing (NGS) and sequence processing.
(A) Schematic of PCR reactions aimed to amplify sgRNA containing fragments from gDNA (PCR1) and attach Illumina primers (PCR2) for NGS. (B) The agarose gel with DNA amplified from gDNA of control samples and samples after different rounds of sorting (PCR1). (C) An agarose gel with PCR2 products for the third sorting sample with different Illumina primer pairs shown as an example of PCR2 reaction products. (D) The number of lost sgRNA (zero counts) and Gini index in samples before sorting and after different rounds of sorting. (D’) Total number of reads, number of mapped reads, and the fraction of mapped reads in samples before sorting and after different rounds of sorting. (E), (E’) RRA score plots for samples after first and second sorts, respectively. (F), (F’) The list of genes with FDR below 0.25 and more or equal to three sgRNAs enriched compared to control after first and second sorts, respectively.
Figure 2 with 1 supplement
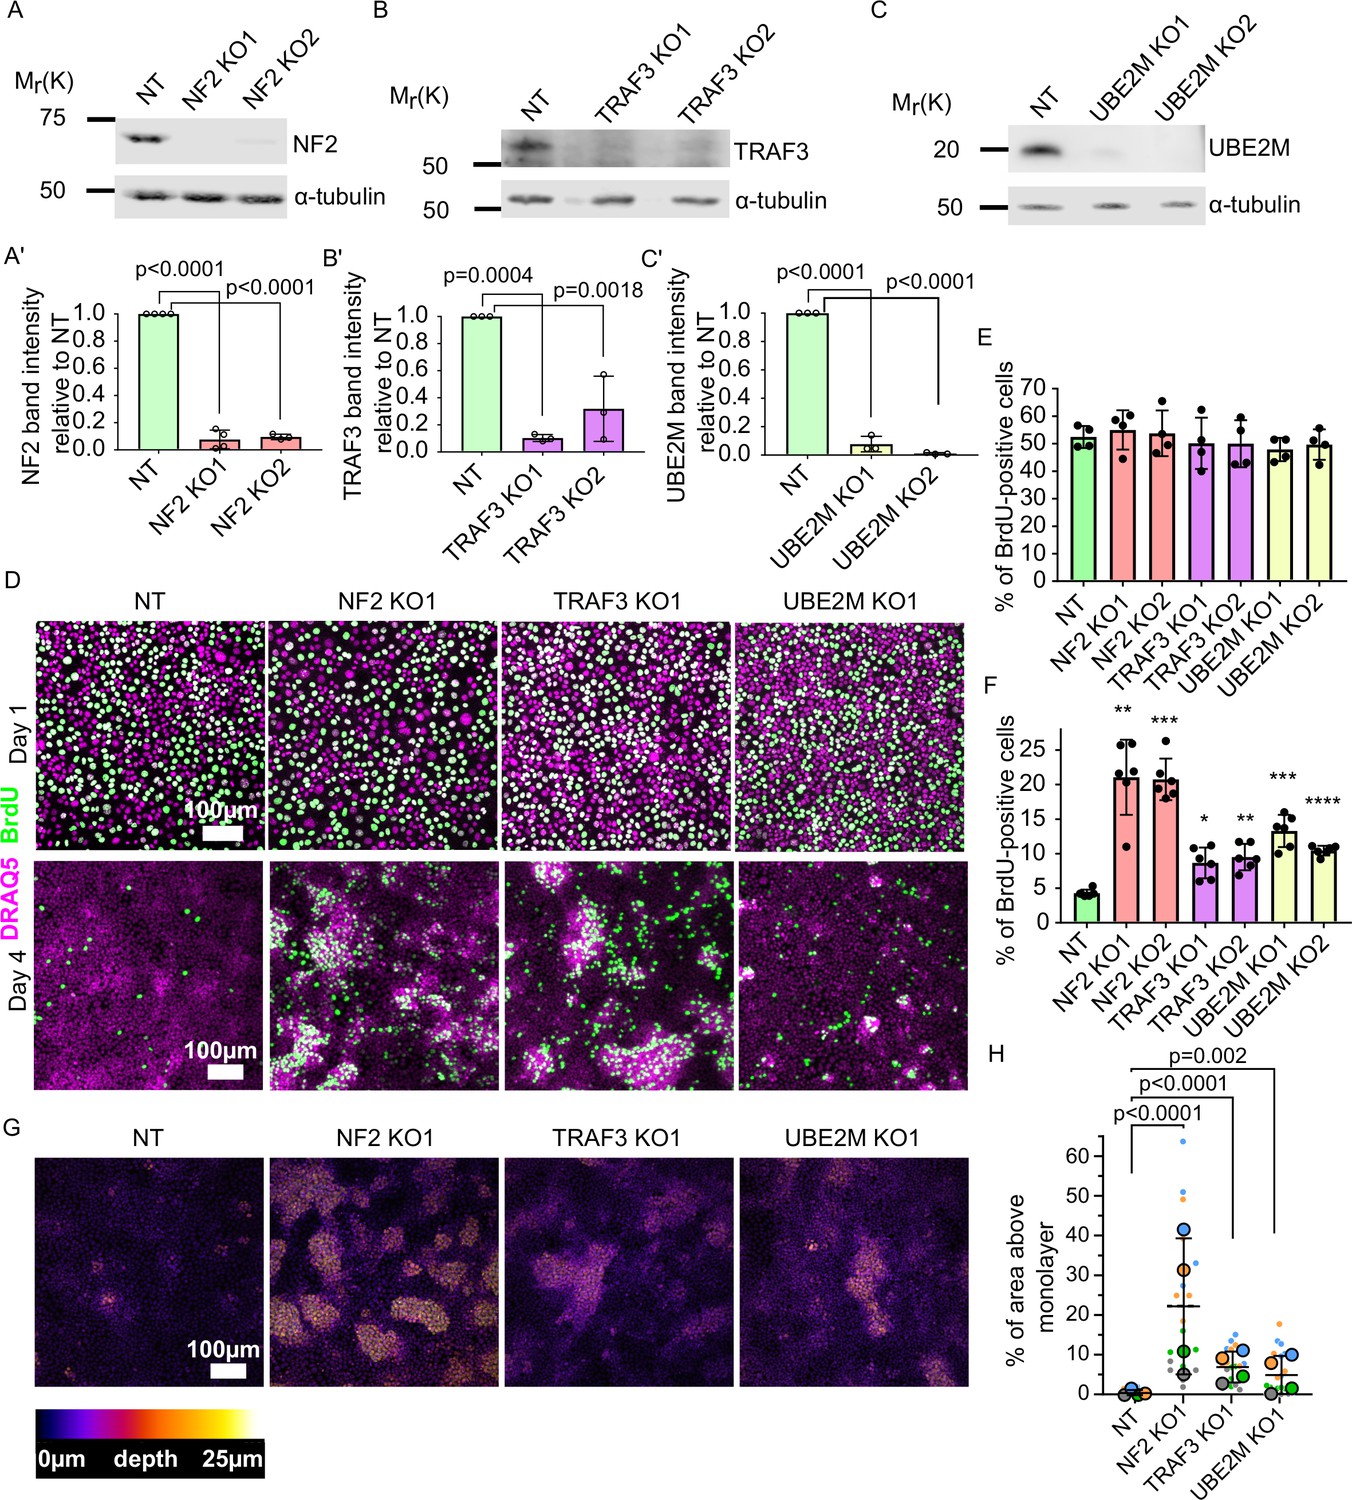
Validation of candidate genes identified from the screen.
(A–C) Immunoblots of NT control and NF2 (A), TRAF3 (B), and UBE2M (C) KO EpH4 cells for NF2, TRAF3, and UBE2M, respectively. α-tubulin or GAPDH was used as a loading control. (A’–C’) Quantification of NF2 (A’), TRAF3 (B’), and UBE2M (C’) levels based on immunoblotting in (A–C). (A’C’) Histograms show mean ± 1 s.d. (n = 3). p-values were calculated by one-way ANOVA followed by Dunnett’s multiple comparisons test. (D) NT control, NF2, TRAF3, and UBE2M KO cells grown for 1 or 4 days post-confluency. BrdU was added for 1 hr, and then cells were fixed and stained for BrdU, with DAPI as a nuclear marker. (E and F) Cytometric analysis of NT control, NF2, TRAF3, and UBE2M KO cells stained for BrdU to assess proliferation at 1 or 4 DPC, respectively. n = 4 (E) and n = 6 (F), histograms show mean ± 1 s.d. p-values were calculated by one-way ANOVA followed by Dunnett’s multiple comparisons test. (G) Control and KO cells stained with Hoechst dye. Confocal images are depth color coded. The color code scale is shown below. (H) Five fields of view in four biological repeats were used to quantify the level of multilayering. Data shown as a SuperPlot (Lord et al., 2020). p-values were calculated by mixed model two-way ANOVA.
-
Figure 2—source data 1
Source data file for Figure 2.
- https://cdn.elifesciences.org/articles/63603/elife-63603-fig2-data1-v2.xlsx
Figure 2—figure supplement 1
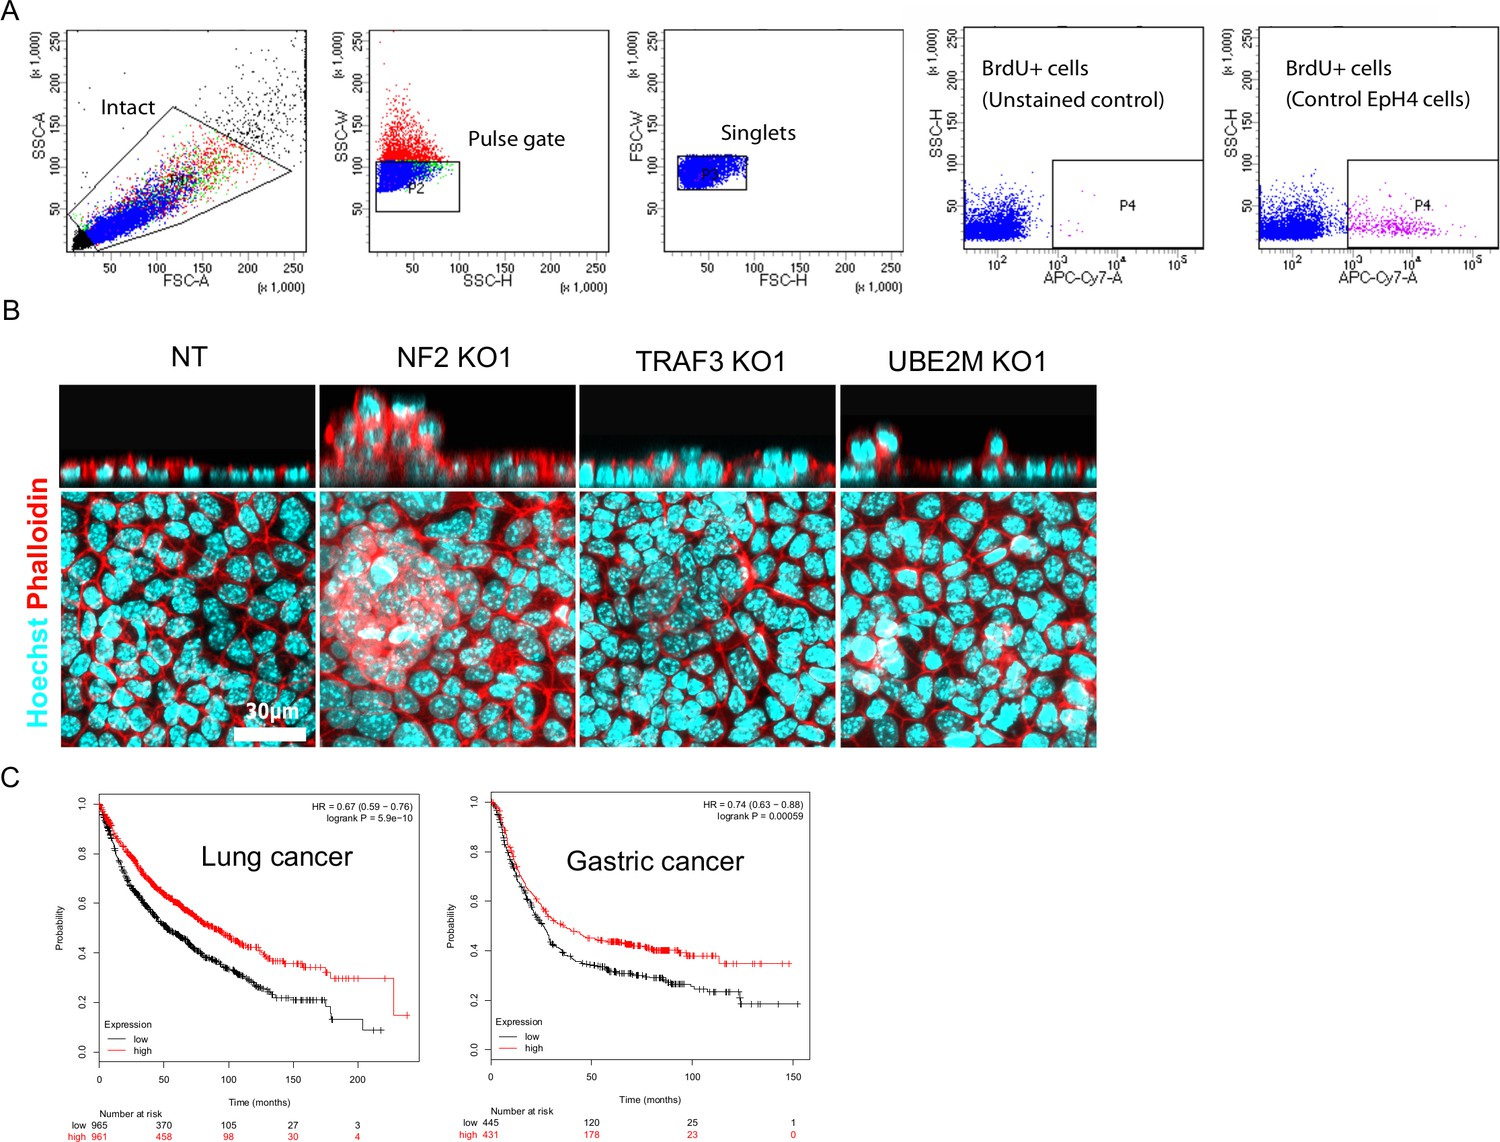
BrdU+ cell cytometry gates and cancer survival based on Traf3 expression level.
(A) Flow cytometry gating for cells stained for BrdU. (B) Control and KO cells stained by phalloidin and Hoechst. Top panel shows xz view. (C) Kaplan–Meier plots show overall survival in all lung and gastric cancer based on Traf3 expression level. Red and black curves reflect patients with high and low Traf3 expression, respectively.
Figure 3 with 1 supplement
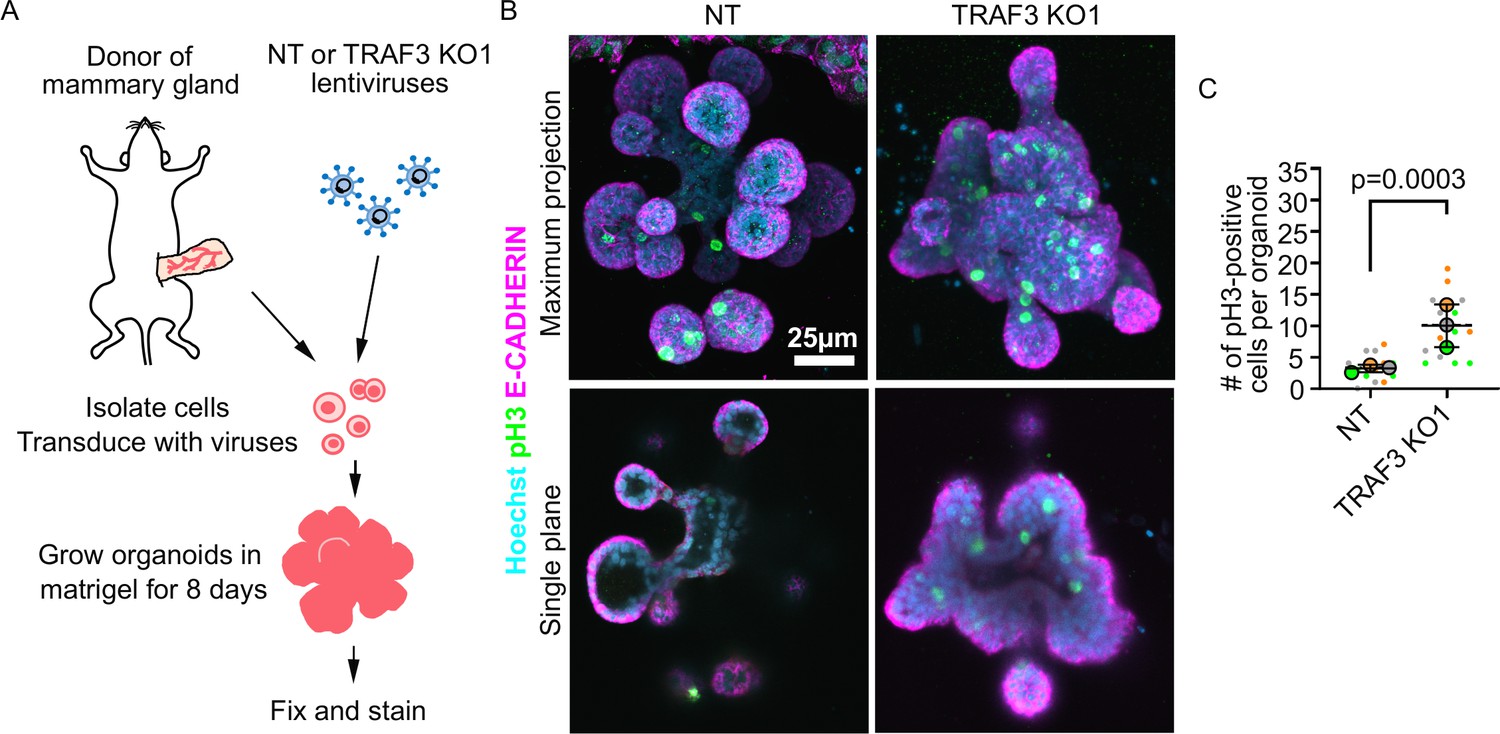
Loss of TRAF3 causes over-proliferation in primary mammary organoids.
(A) Primary mammary organoid experiment workflow. (B) Maximum intensity projection of NT and TRAF3 KO1 mammary organoids stained for phospho-HISTONE H3 (pH3), E-CADHERIN, and DNA (Hoechst). Bottom panel – single confocal plane of NT and TRAF3 KO1 organoids. (C) Quantifications of the number of pH3-positive cells per organoid; 5–10 organoids of comparable size were quantified per condition per repeat. Data shown as a SuperPlot (n = 3). p-values were calculated by mixed model two-way ANOVA.
-
Figure 3—source data 1
Source data file for Figure 3.
- https://cdn.elifesciences.org/articles/63603/elife-63603-fig3-data1-v2.xlsx
Figure 3—figure supplement 1
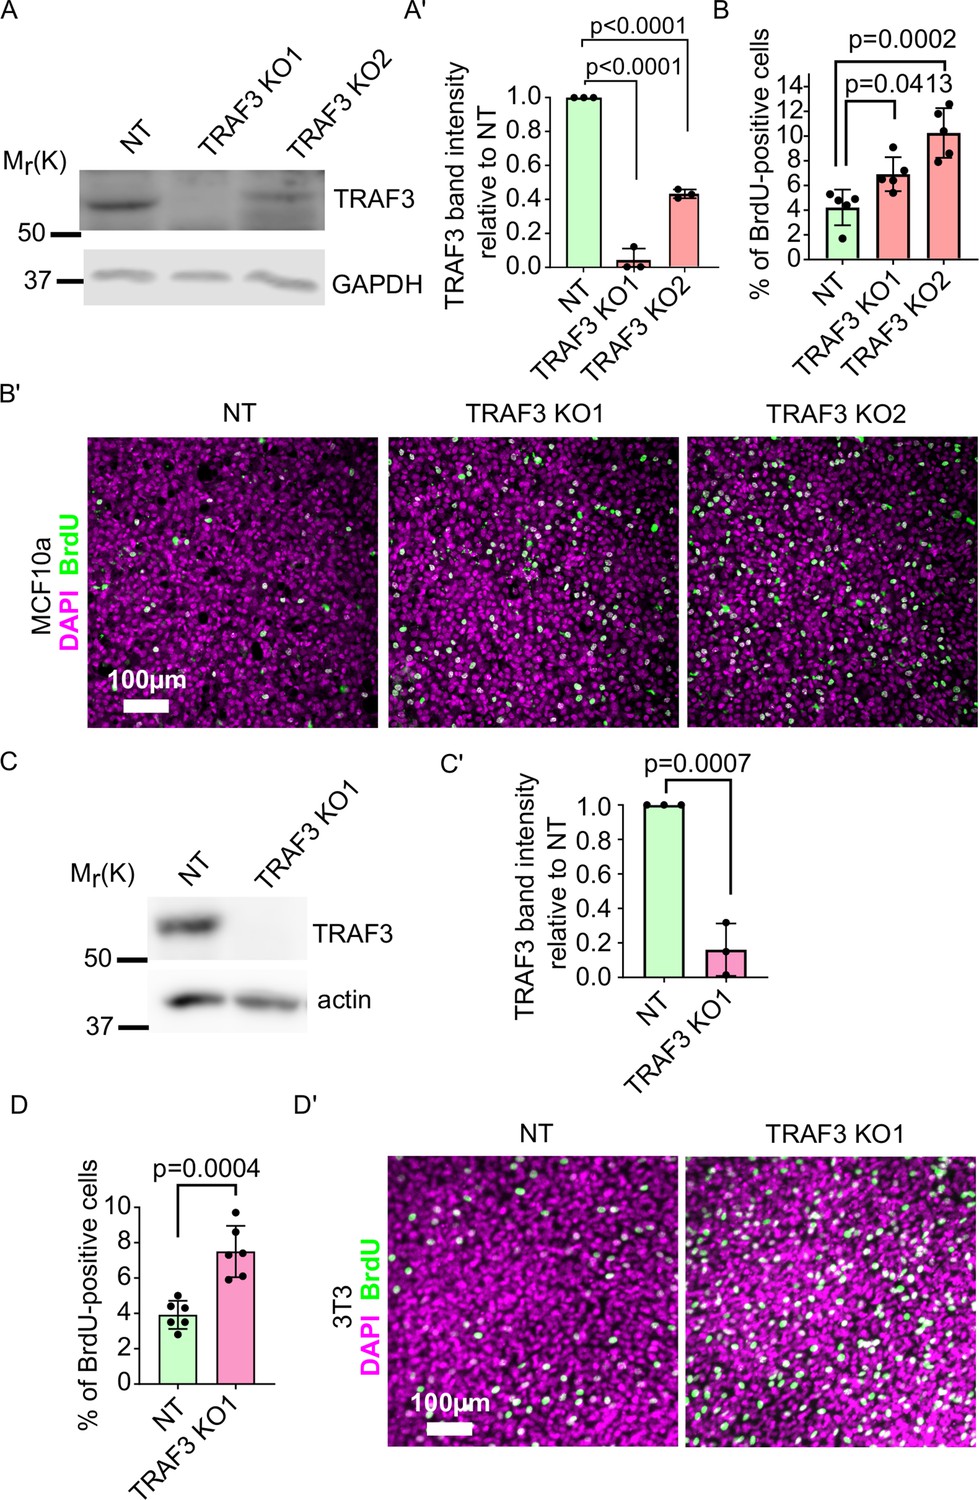
Loss of TRAF3 in MCF10a and NIH 3T3 cells causes over-proliferation.
(A) Immunoblotting of NT and TRAF3 KO MCF10a cells for TRAF3. GAPDH was used as a loading control. (A’) Quantifications of TRAF3 levels based on western blots (A) Histogram shows mean ± 1 s.d. (n = 3). p-values were calculated by one-way ANOVA followed by Dunnett’s multiple comparisons test. (B) Cytometric analysis of NT control and TRAF3 KO MCF10a cells stained for BrdU to assess proliferation at 5 days post-confluency. Histogram shows mean ± 1 s.d.(n = 3). p-values were calculated by one-way ANOVA followed by Dunnett’s multiple comparisons test. (B’) NT control and TRAF3 KO MCF10a cells at 5 days post-confluency were treated and stained for BrdU and DAPI as nuclear marker. (C) Immunoblotting of NT and TRAF3 KO NIH 3T3 cells for TRAF3. Actin was used as a loading control. (C’) Quantifications of TRAF3 levels based on western blots (C) Histogram shows mean ± 1 s.d. (n = 3). p-values were calculated by Student’s t-test. (D) Cytometric analysis of NT control and TRAF3 KO NIH 3T3 cells stained for BrdU to assess proliferation at 4 days post-confluency. Histogram shows mean ± 1 s.d. (n = 3). p-values were calculated by Student’s t-test. (D’) NT control and TRAF3 KO NIH 3T3 cells at 4 days post-confluency were treated and stained for BrdU and DAPI as nuclear marker.
-
Figure 3—figure supplement 1—source data 1
Source data file for Figure 3—figure supplement 1.
- https://cdn.elifesciences.org/articles/63603/elife-63603-fig3-figsupp1-data1-v2.xlsx
Figure 4
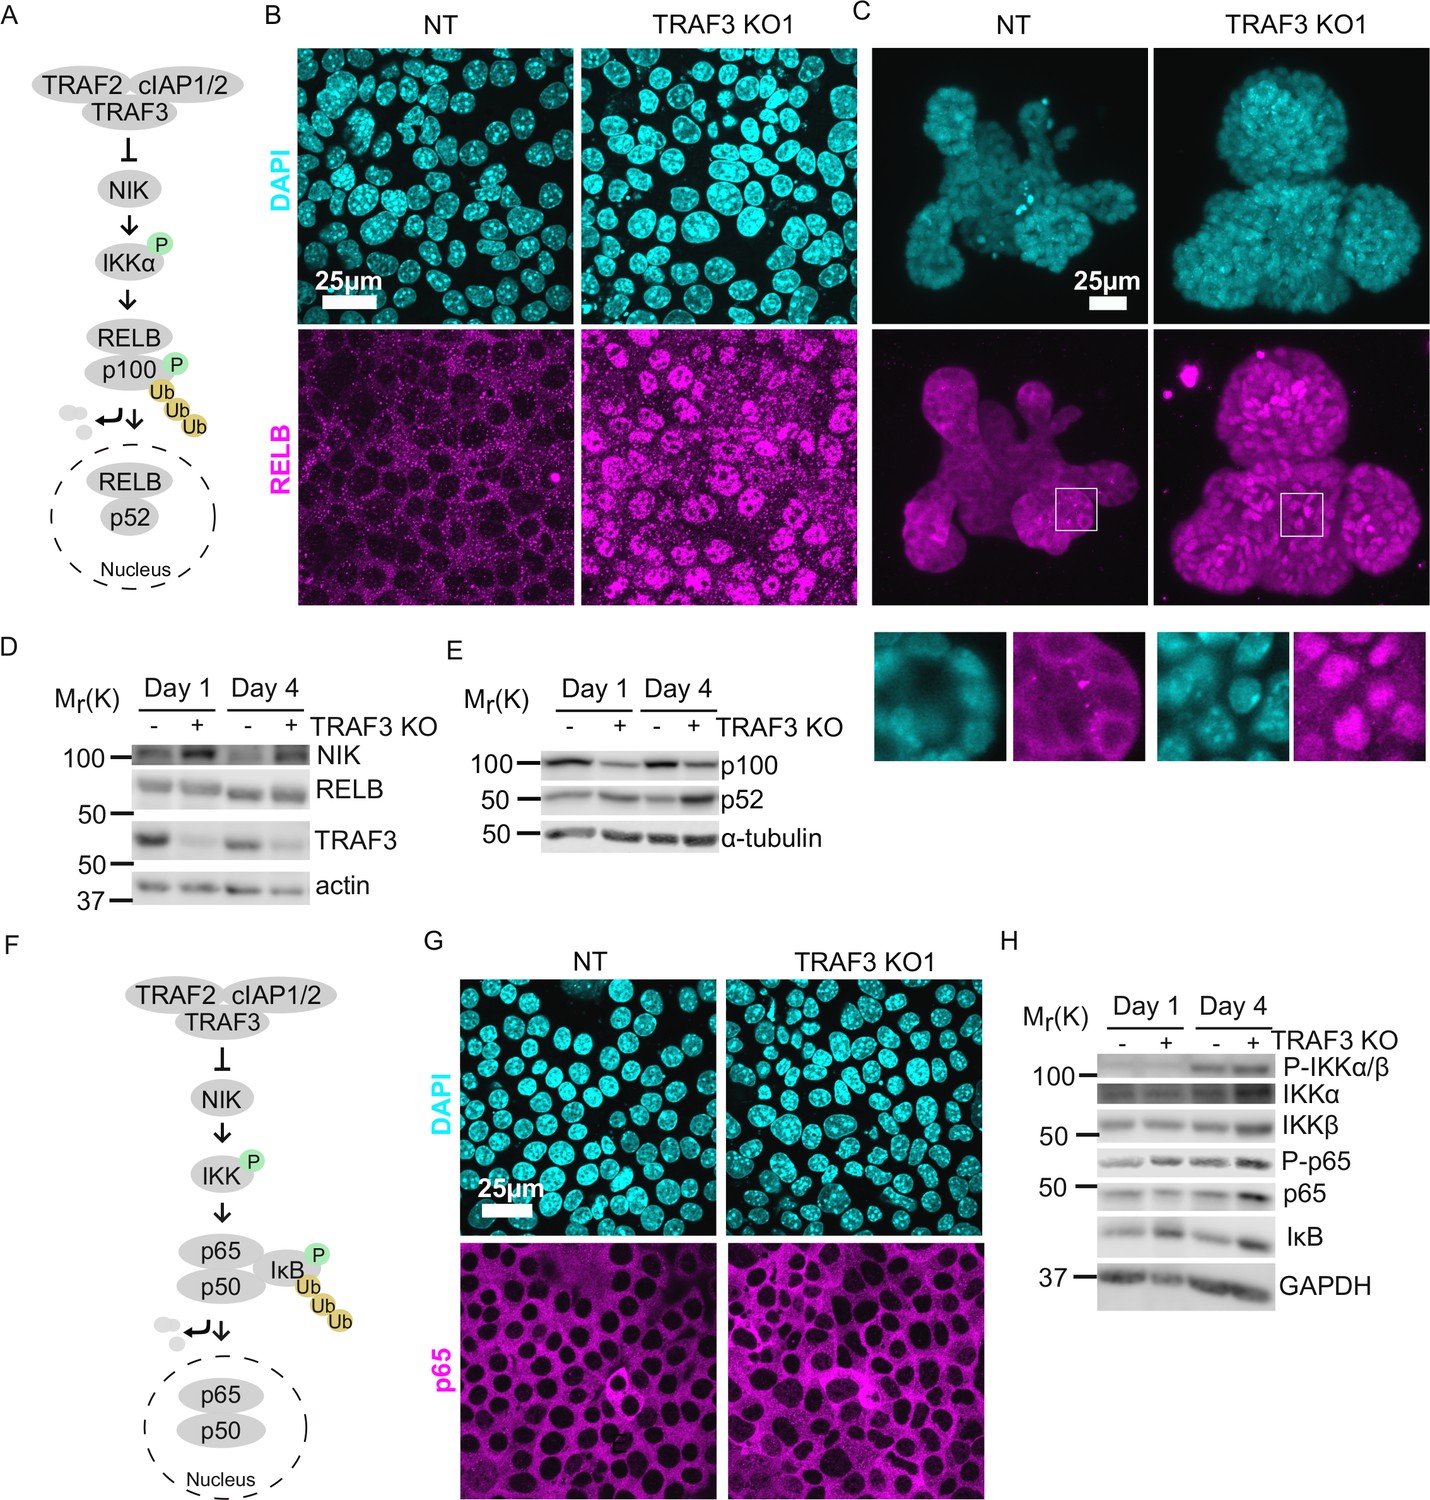
Loss of TRAF3 specifically activates noncanonical but not canonical NF-κB pathway.
(A) Simplified schematic of noncanonical NF-κB pathway. TRAF3 sends NIK for degradation. In the absence of TRAF3, NIK levels increase, and it activates the downstream cascade, resulting in increased p100 processing to p52. RELB/p52 enters the nucleus where it regulates transcription of target genes. In experiments (B) and (C) RELB localization was tested in NT and TRAF3 KO1 cells. (B and C) Fluorescence staining of NT and TRAF3 KO1 EpH4 cells (B) and organoids (C) with anti-RELB antibodies and DAPI. (B) Single confocal planes. (C) Maximum intensity projection. White boxed ROIs are shown in enlarged images as single confocal planes. (D) Immunoblots of NT and TRAF3 KO1 lysates grown to 1 or 4 days post-confluency probed for NIK, RELB, TRAF3, and actin as loading control. (E) Immunoblots of NT and TRAF3 KO1 lysates grown to 1 or 4 days post-confluency probed for p100/p52 and α-tubulin as loading control. (F) A schematic of TRAF3-dependent activation of canonical NF-κB pathway. (G) Fluorescence staining of NT and TRAF3 KO1 cells with antibodies against p65 and with DAPI. (H) Western blotting of NT and TRAF3 KO1 cells at 1 and 4 days post-confluency probed for components of canonical NF-κB pathway and GAPDH as loading control.
Figure 5
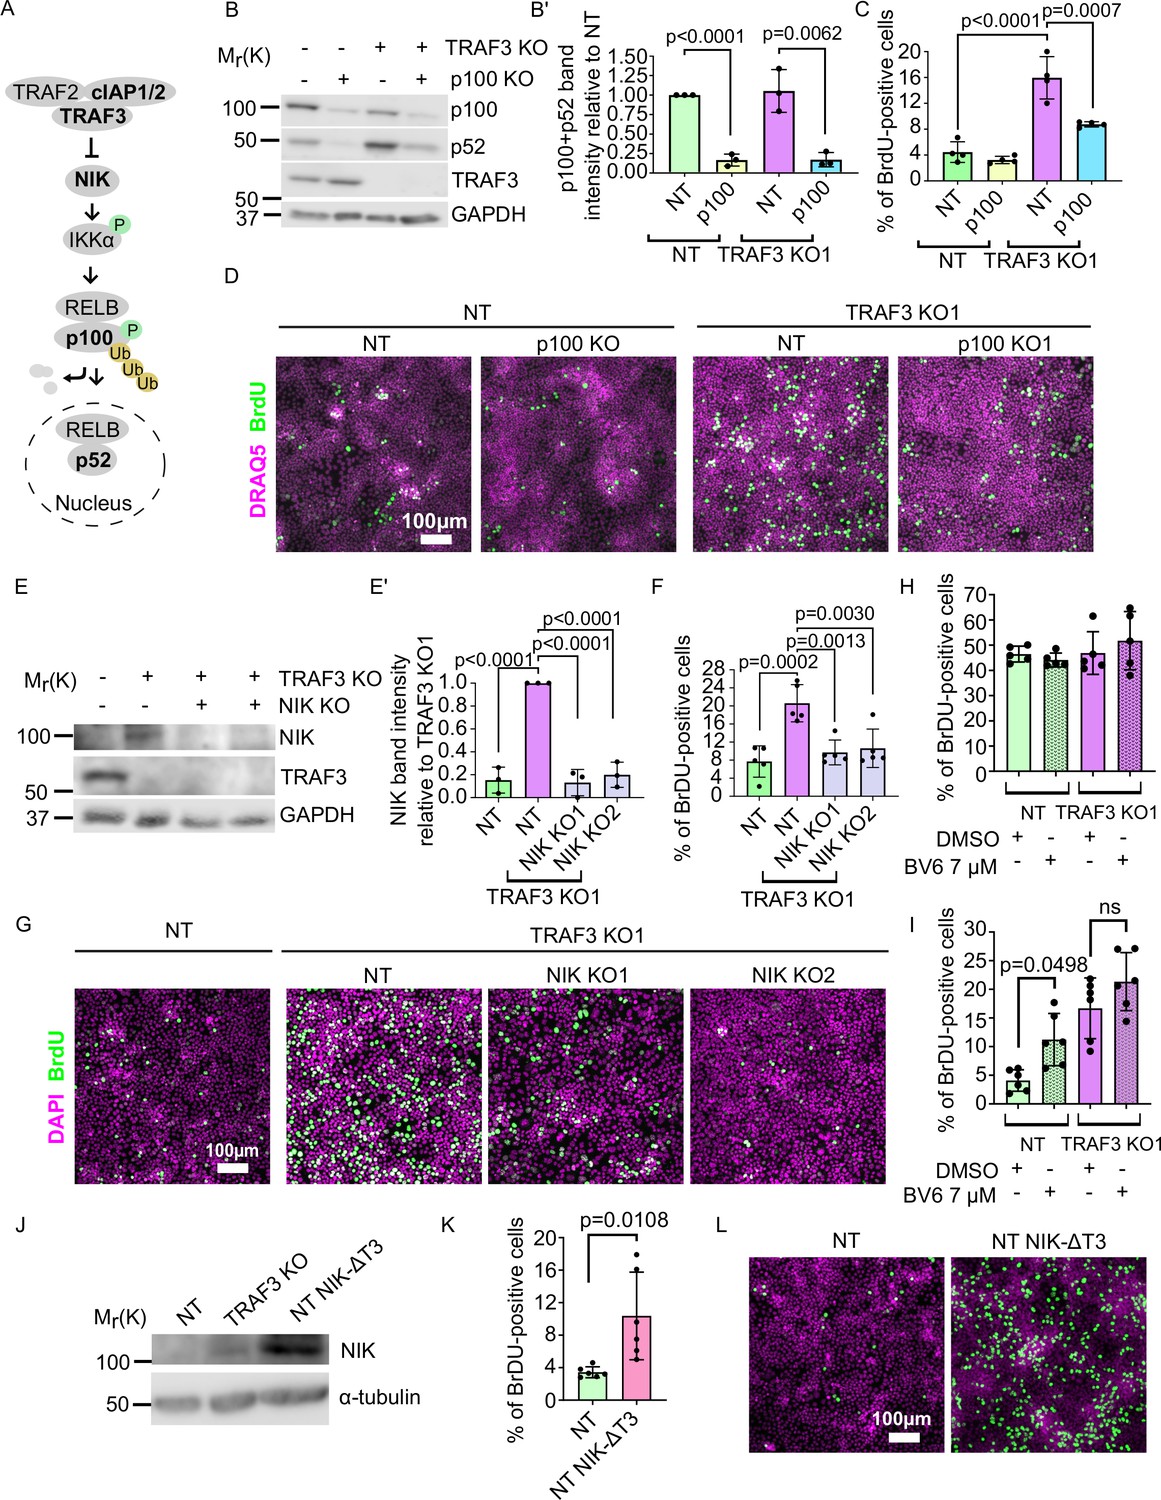
Noncanonical NF-κB signaling is necessary and sufficient for over-proliferation in TRAF3 KO cells.
(A) Noncanonical NF-κB pathway schematic. Proteins shown in bold were manipulated in this study. (B) Immunoblotting of NT and TRAF3 KO1 cells transduced with pLVTHM GFP NT or p100 sgRNAs. Blot was stained for p100/p52, TRAF3, and GAPDH (loading control). (B′) Quantifications of western blot (B). Histogram shows mean ± 1 s.d. (n = 3). p-values were calculated by Student’s t-test. (C) Cytometric analysis of NT and TRAF3 KO cells transduced with pLVTHM GFP NT or p100 sgRNAs. Graph shows mean ± s.d. (n = 4). p-values were calculated by one-way ANOVA followed by Tukey’s multiple comparisons test. (D) NT and TRAF3 KO1 cells transduced with pLVTHM GFP NT or p100 sgRNAs were treated with BrdU at 4 days post-confluency and immunostained for BrdU and DAPI. (E) Immunoblot of NT and TRAF3 KO1 cells transduced with NT, NIK KO1 or KO2. Blot was stained for NIK, TRAF3, and GAPDH (loading control). (E’) Quantifications of western blot (E). Histogram shows mean ± 1 s.d (n = 3). p-values were calculated by one-way ANOVA followed by Tukey’s multiple comparisons test. (F) Cytometric analysis of NT cells and TRAF3 KO1 cells transduced with control NT, NIK KO1 and KO2. Histogram shows mean ± 1 s.d. (n = 5). p-values were calculated by one-way ANOVA followed by Tukey’s multiple comparisons test. (G) NT and TRAF3 KO1 cells transduced with control NT, NIK KO1 and KO2 were treated with BrdU at 4 days post-confluency and immunostained for BrdU and DAPI. (H and I) Cytometric analysis of NT and TRAF3 KO cells treated with 7 µM BV6 at low (H) and high (I) density. Histogram shows mean ± 1 s.d. (n = 5 (H), n = 6 (I)). p-values were calculated by one-way ANOVA followed by Dunnett’s (H) or Tukey’s (I) multiple comparisons test. (J) Immunoblot of NT, TRAF3 KO1 (positive control), and NT cells expressing pWPI mScarlet NIK-ΔT3. Blot was stained for NIK and GAPDH (loading control). (K) Cytometric analysis of NT cells and NT pWPI mScarlet NIK-ΔT3 cells. Histogram shows mean ± 1 s.d. (n = 6). p-values were calculated by Student’s t-test. (L) NT and NT pWPI mScarlet NIK-ΔT3 cells were treated with BrdU at 4 days post-confluency and immunostained for BrdU and DAPI.
-
Figure 5—source data 1
Source data file for Figure 5.
- https://cdn.elifesciences.org/articles/63603/elife-63603-fig5-data1-v2.xlsx
Figure 6
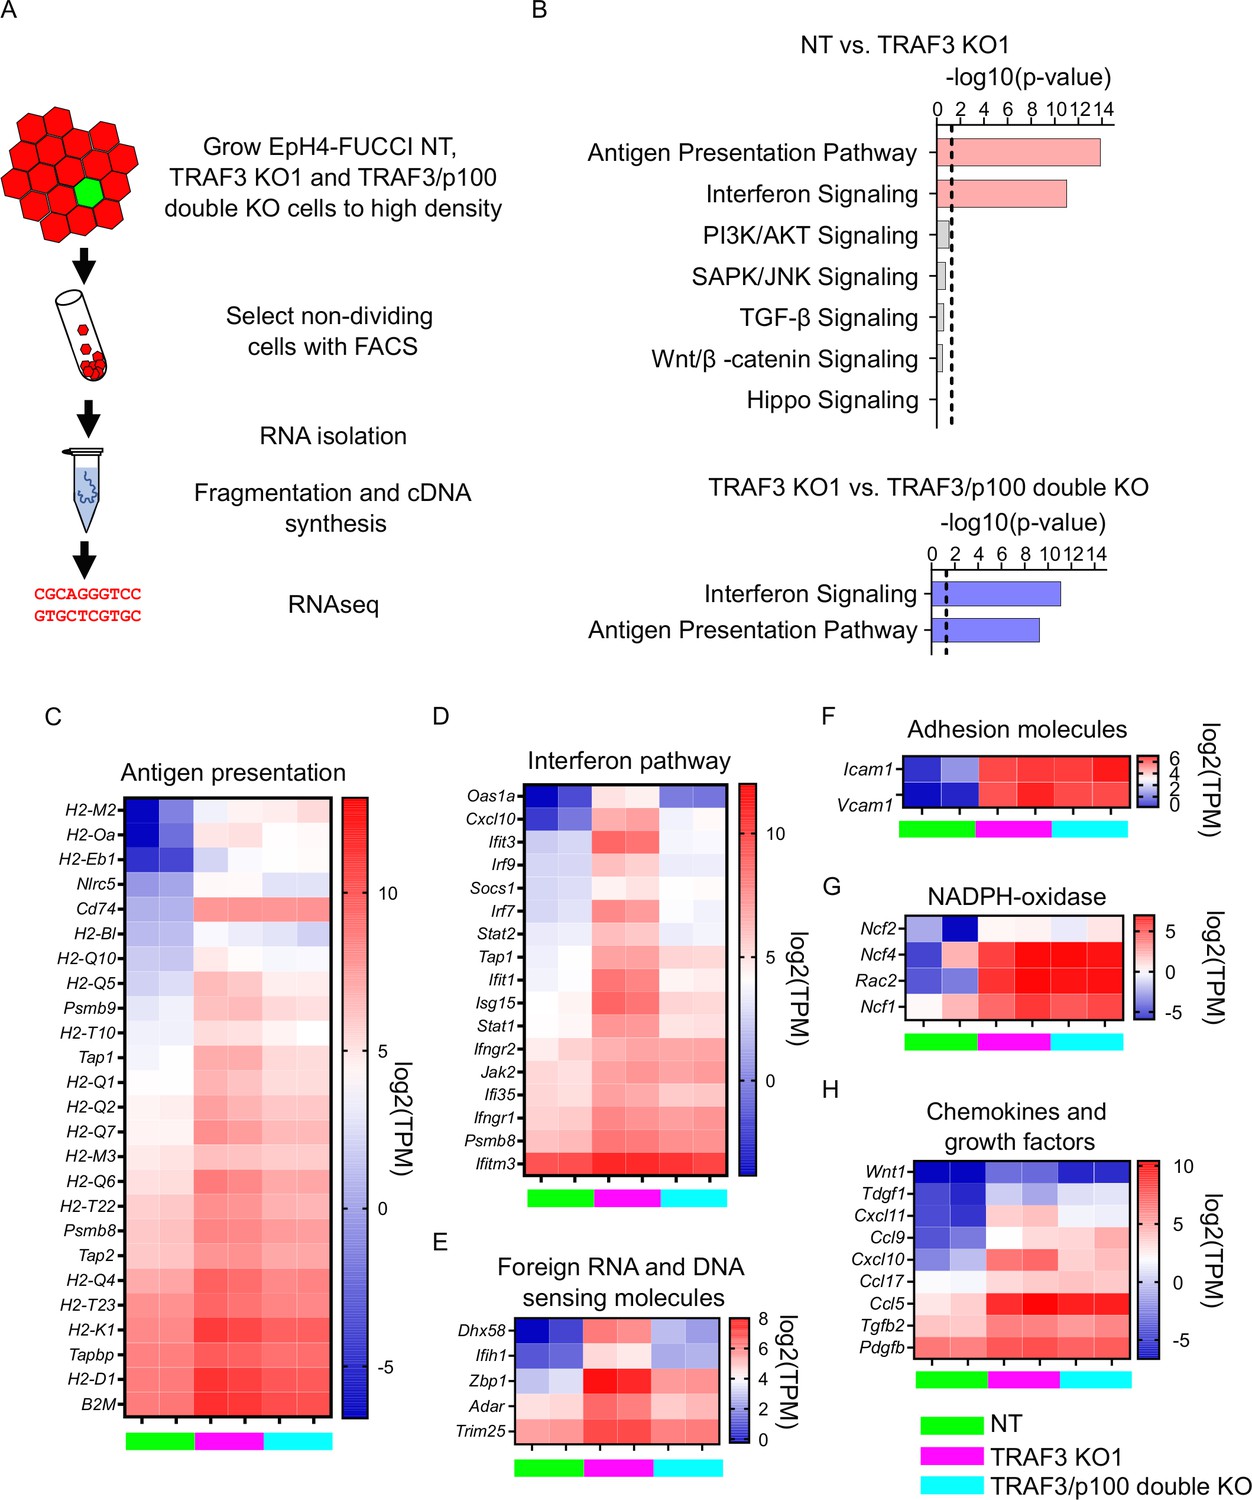
Loss of TRAF3 in EpH4 cells induces immune response pathways.
(A) RNAseq experiment workflow. (B) Ingenuity Pathway Analysis (IPA) of RNAseq data showing significant upregulation of pathways related to infection response in TRAF3 KO cells compared to NT control (top, pink bars), and significant reduction of these pathways in TRAF3/p100 double KO cells compared to TRAF3 KO cells (bottom, blue bars). Notably, Hippo signaling and other pathways that regulate proliferation were unchanged. Threshold line is p<0.05. (C–H) Heatmaps comparing mRNA levels of antigen presentation (C), interferon (D), foreign RNA and DNA recognition (E) pathway components, adhesion molecules (F), NADPH-oxidase components (G), and chemokines and growth factors (H) between NT, TRAF3 KO1, and TRAF3/p100 double KO in two experimental repeats. NT, TRAF3 KO1, and TRAF3/p100 double KO are color coded with green, purple, and light blue, respectively. Data are presented as log2 of transcripts per million (TPM).
-
Figure 6—source data 1
Source data file for Figure 6.
- https://cdn.elifesciences.org/articles/63603/elife-63603-fig6-data1-v2.xlsx
Figure 7 with 2 supplements
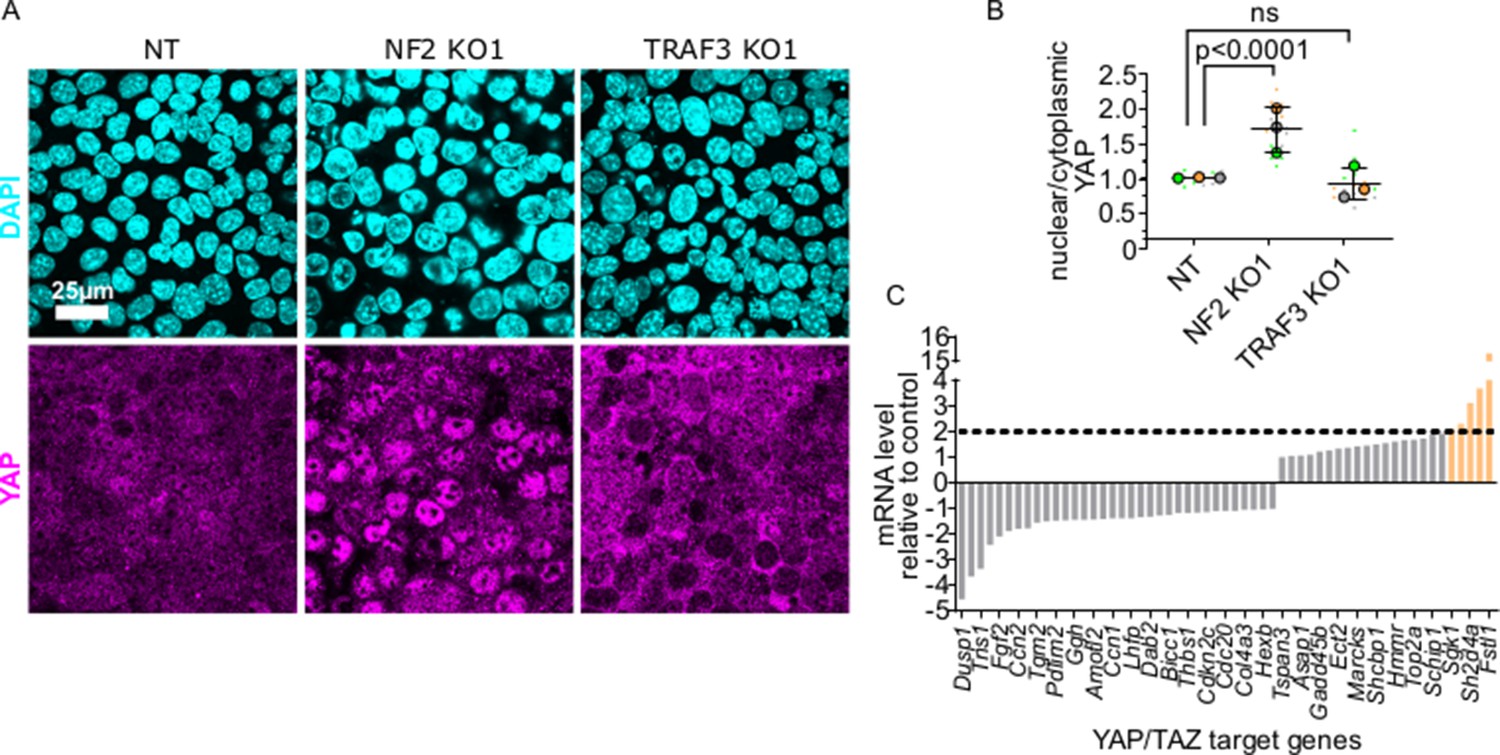
YAP/TAZ signaling is not activated by loss of TRAF3.
(A) NT, NF2 KO1, and TRAF3 KO1 cells stained for YAP and DAPI. (B) Quantifications of nuclear to cytoplasmic YAP ratio in NT, NF2 KO1, and TRAF3 KO1 cells. Measurements were of at least 12 fields of view per condition per experimental replicate, and the average ratio was calculated. Data are presented as a SuperPlot (n = 3). p-values were calculated by mixed model two-way ANOVA. (C) Conserved YAP/TAZ gene signature expression in TRAF3 KO1 cells shown as fold differences between NT control and TRAF3 KO1. Dashed threshold line is based on 2× increase in gene expression.
-
Figure 7—source data 1
Source data file for Figure 7.
- https://cdn.elifesciences.org/articles/63603/elife-63603-fig7-data1-v2.xlsx
Figure 7—figure supplement 1
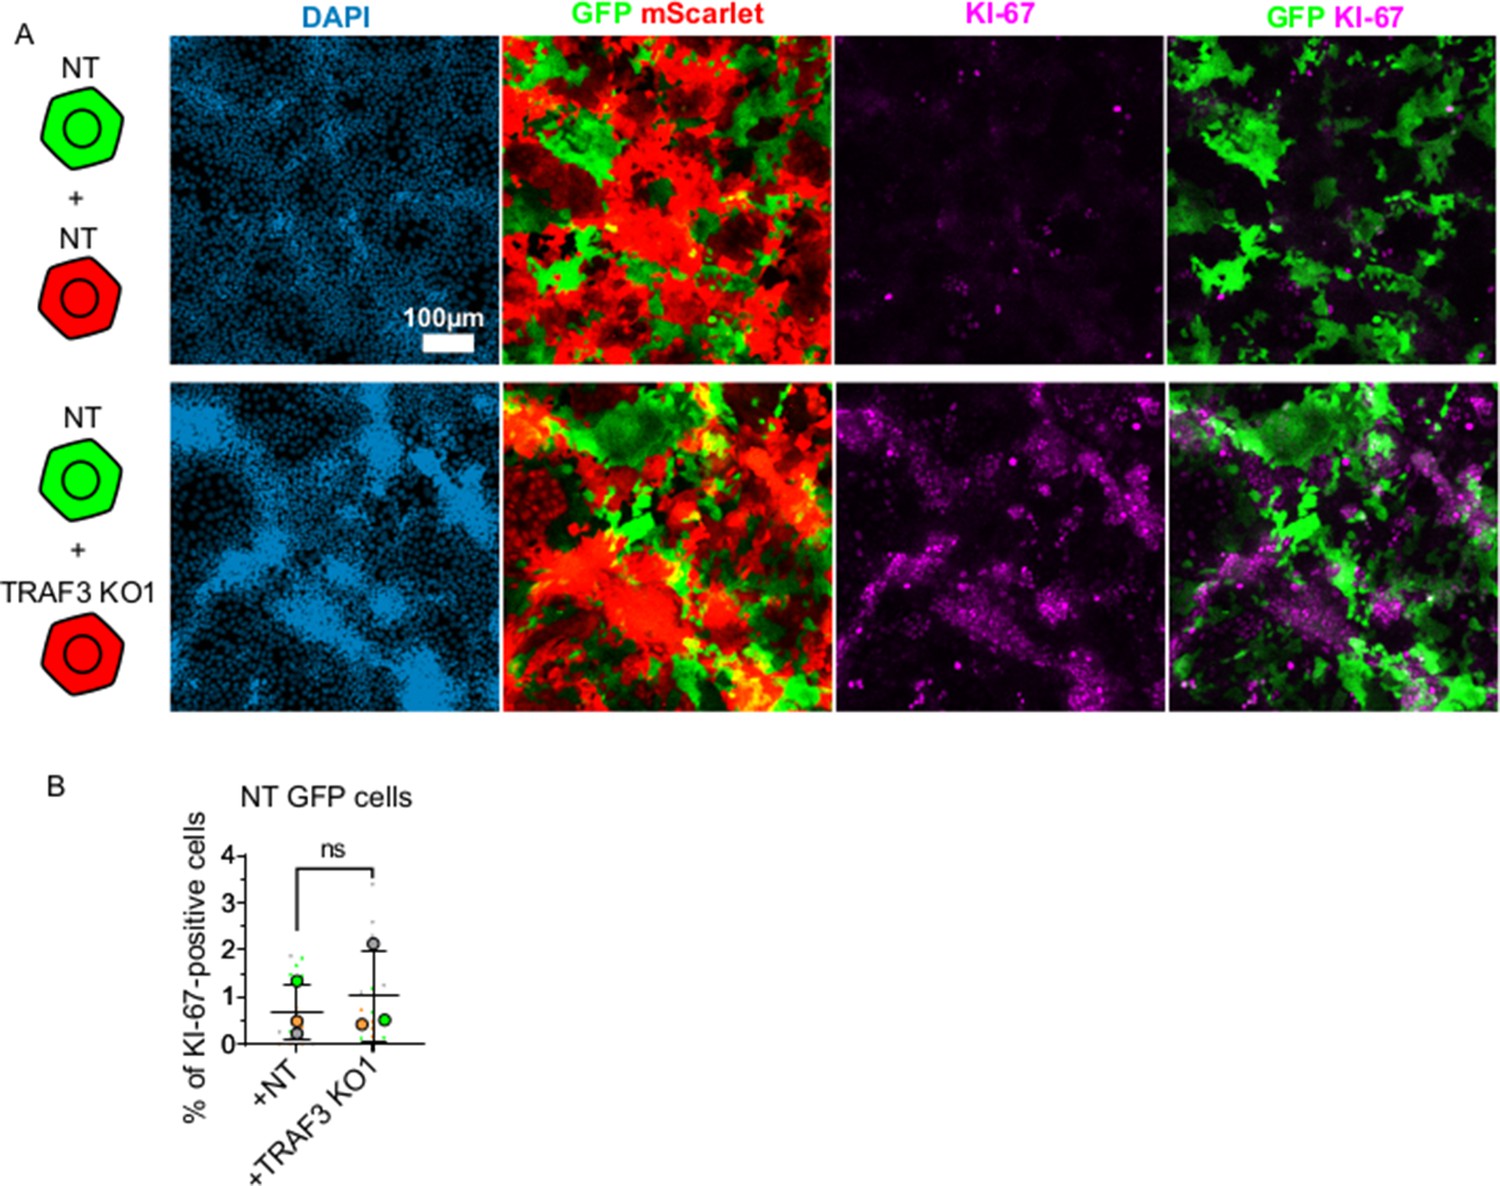
TRAF3 KO cells over-proliferate cell autonomously.
(A) NT and TRAF3 KO1 cells labeled with GFP or mScarlet were mixed at a 1:1 ratio (NT GFP + NT mScarlet, NT GFP + TRAF3 KO1 mScarlet) and grown to 4 days post-confluency. Cells were stained for KI-67 and DAPI. (B) Quantifications of NT GFP cell proliferation in mixture with NT mScarlet or TRAF3 KO1 mScarlet. Proliferation was measured as percent of KI-67-positive cells to the total number of NT GFP cells. Data are presented as a SuperPlot (n = 3). p-value was calculated by mixed model two-way ANOVA.
-
Figure 7—figure supplement 1—source data 1
Source data file for Figure 7—figure supplement 1.
- https://cdn.elifesciences.org/articles/63603/elife-63603-fig7-figsupp1-data1-v2.xlsx
Figure 7—figure supplement 2
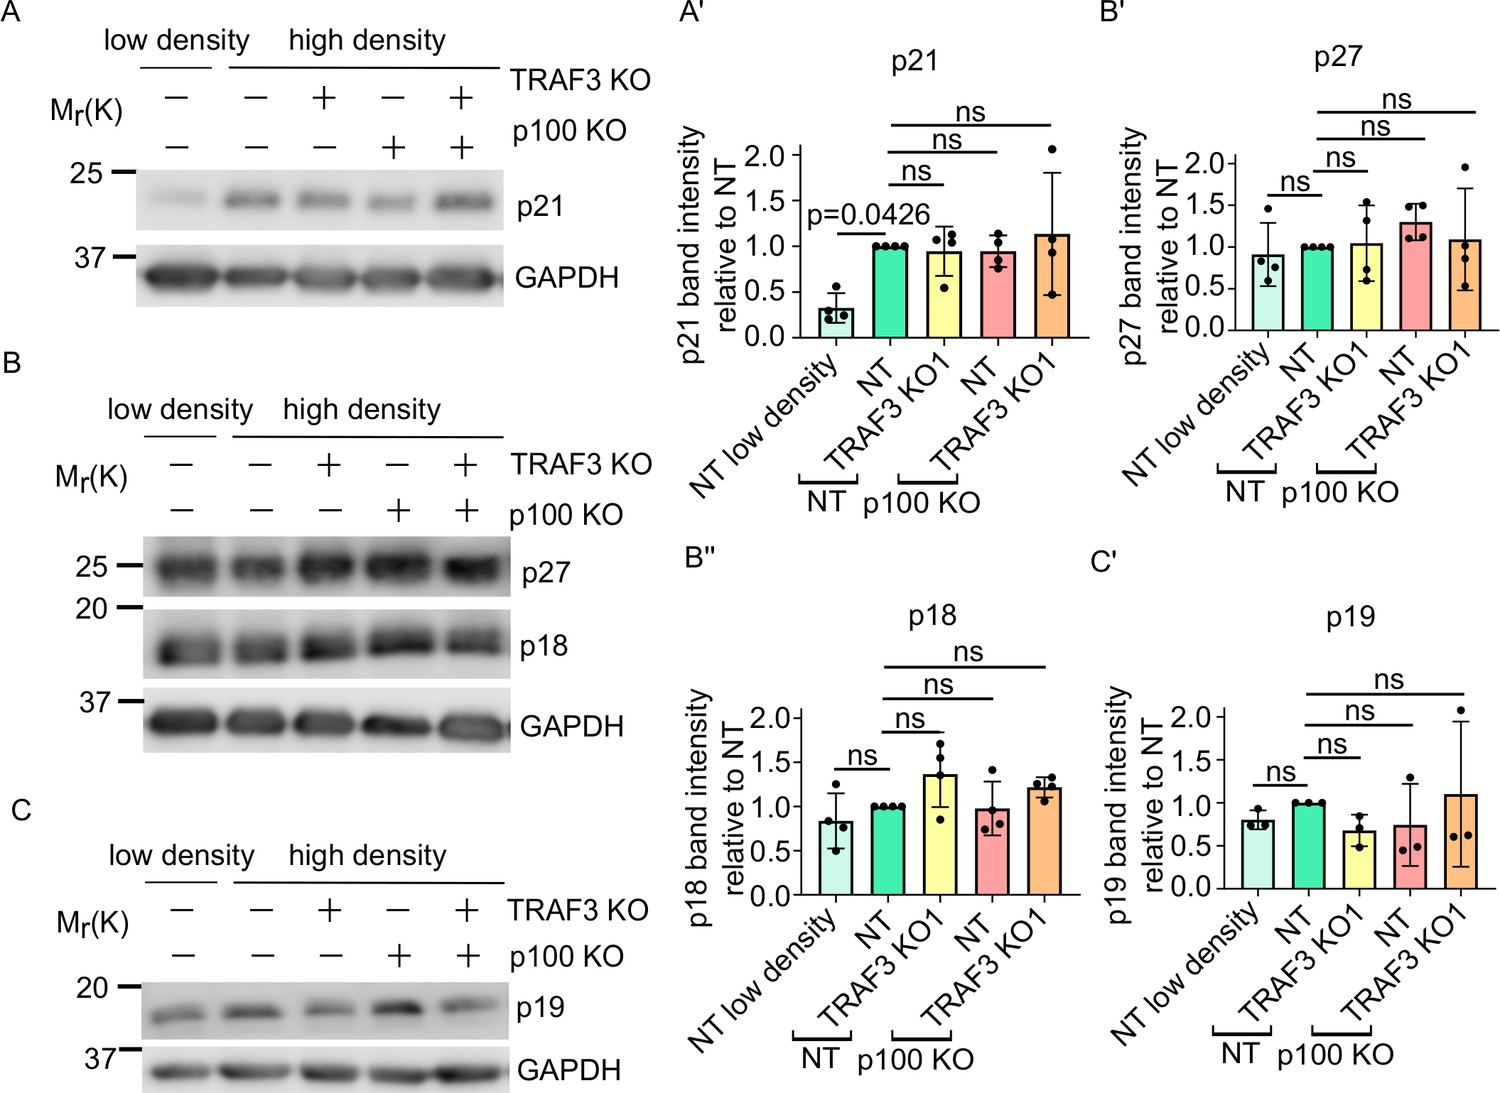
Loss of Traf3 does not affect CKI levels.
(A) Immunoblotting for p21 in sparse NT cells, dense NT, TRAF3 KO1, NT/p100 KO, and TRAF3/p100 double KO cells. GAPDH was used as a loading control. (B) Western blotting for p27 and p18 in sparse NT cells, dense NT, TRAF3 KO1, NT/p100 KO, and TRAF3/p100 double KO cells. GAPDH was used as a loading control. (C) Western blotting for p19 in sparse NT cells, dense NT, TRAF3 KO1, NT/p100 KO, and TRAF3/p100 double KO cells. GAPDH was used as a loading control. (A’–C’) Quantifications of the blots (A–C). n = 4 for blots (A and B). n = 3 for blot (C). Histograms show mean ± 1 s.d. p-values were calculated by one-way ANOVA followed by Dunnett’s multiple comparisons test.
-
Figure 7—figure supplement 2—source data 1
Source data file for Figure 7—figure supplement 2.
- https://cdn.elifesciences.org/articles/63603/elife-63603-fig7-figsupp2-data1-v2.xlsx
Figure 8
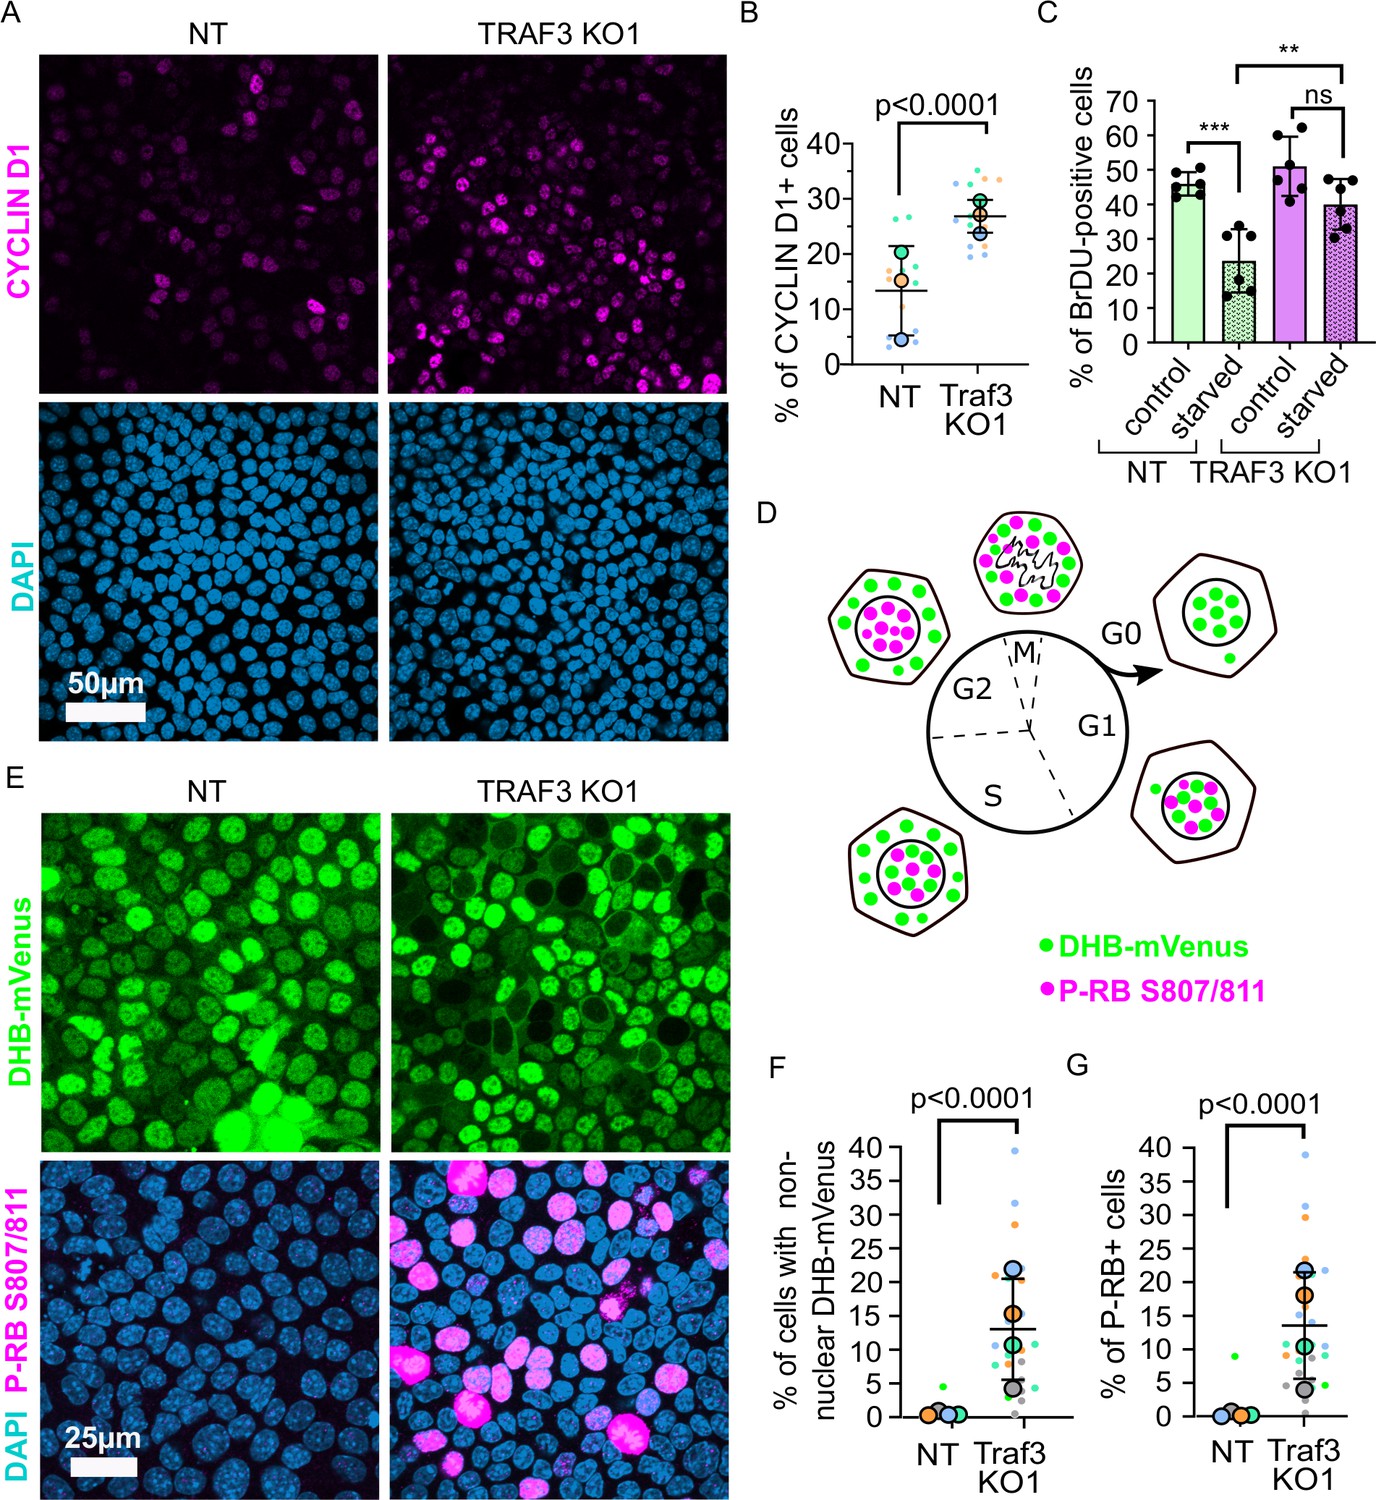
Loss of TRAF3 prevents cells from entering G0.
(A) NT and TRAF3 KO1 cells stained for CYCLIN D1 and DAPI. (B) Quantifications of CYCLIN D1 positive cells in NT and TRAF3 KO cells. Data are presented as a SuperPlot (n = 3). p-value was calculated by mixed model two-way ANOVA. (C) NT and TRAF3 KO1 cells grown for 24 hr in regular media or media without FBS (starved) were treated with BrdU and analyzed by flow cytometry. (D) A schematic of DHB-mVenus and phospho-RB S807/811 localization at different phases of cell cycle. (E) NT and TRAF3 KO1 cells stably expressing DHB-mVenus were grown to 4 days post-confluency and stained for phospho-RB S807/811 and DAPI. (F) Quantifications of cells with non-nuclear DHB-mVenus localization. Data are presented as a SuperPlot (n = 4). p-value was calculated by mixed model two-way ANOVA. (G) Quantification of phospho-RB positive cells. Data are presented as a SuperPlot (n = 4). p-value was calculated by mixed model two-way ANOVA.
-
Figure 8—source data 1
Source data file for Figure 8.
- https://cdn.elifesciences.org/articles/63603/elife-63603-fig8-data1-v2.xlsx
Figure 9
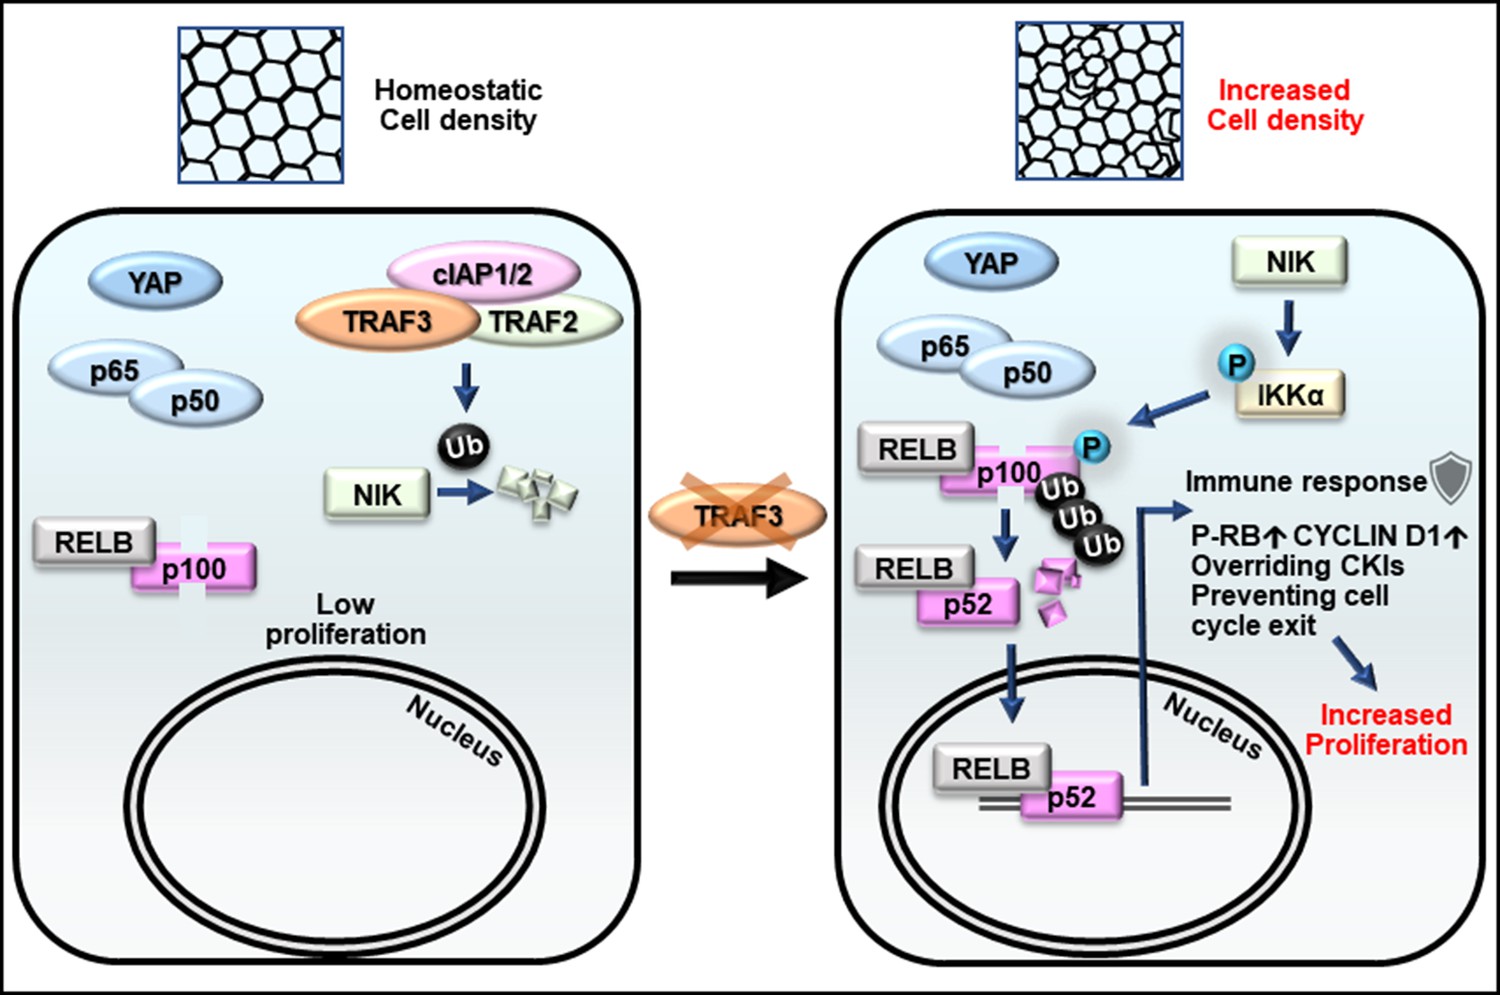
Model for the role of TRAF3 in density-dependent proliferation.
Cells at high density rarely proliferate (on the left). They have active Hippo signaling (YAP is cytoplasmic), inactive canonical NF-κB (p65/p50 is cytoplasmic) and inactive noncanonical NF-κB signaling (NIK is low, p100 is not processed to p52, and RELB is cytoplasmic). Upon loss of TRAF3, Hippo and canonical NF-κB signaling remain unaltered, but noncanonical NF-κB signaling is activated (on the right). NIK levels rise in the absence of TRAF3, activates the downstream cascade, resulting in increased p100 processing to p52. The RELB/p52 complex activates innate immune response genes, including antigen presentation and interferon pathway components. It also overrides CKIs, induces CYCLIN D1 expression, and prevents entering G0 as shown by increased number of cells with active CDK2 and phosphorylated RB. Altogether it results in cell over-proliferation at high density.
Tables
Key resources table
| Reagent type (species) or resource | Designation | Source or reference | Identifiers | Additional information |
|---|---|---|---|---|
| Recombinant DNA reagent (Mus musculus) | GeCKO v2 KO Pooled Library | Sanjana et al., 2014, PMID:25075903; Addgene | CAT: 1000000052 | |
| Recombinant DNA reagent (Mus musculus) | Scrambled control shRNA | Sigma MISSION shRNA library | CAT: SHC016-1EA | |
| Recombinant DNA reagent (Mus musculus) | The p27 shRNA | Sigma MISSION shRNA library | CAT: TRCN0000287390 | |
| Recombinant DNA reagent (Mus musculus) | p27-qPCR-FWD primer | This paper | N/A | TCAAACGTGAGAGTGTCTAACG |
| Recombinant DNA reagent (Mus musculus) | p27-qPCR-REV primer | This paper | N/A | CCGGGCCGAAGAGATTTCTG |
| Recombinant DNA reagent (Mus musculus) | Puromycin-qPCR-FWD primer | This paper | N/A | CTGCAAGAACTCTTCCTCACG |
| Recombinant DNA reagent (Mus musculus) | Puromycin-qPCR-REV primer | This paper | N/A | GGGAACCGCTCAACTCGG |
| Recombinant DNA reagent (Mus musculus) | Control non-targeting (NT) sgRNA | This paper | N/A | GCGAGGTATTCGGCTCCGCG |
| Recombinant DNA reagent (Mus musculus) | Nf2 sgRNA KO1 | This paper | N/A | CGAGATGGAGTTCAACTGCG |
| Recombinant DNA reagent (Mus musculus) | Nf2 sgRNA KO2 | This paper | N/A | ATACTGCAGTCCAAAGAACC |
| Recombinant DNA reagent (Mus musculus) | Traf3 sgRNA KO1 | This paper | N/A | GTGCTCGTGCCGGAGCAAGG |
| Recombinant DNA reagent (Mus musculus) | Traf3 sgRNA KO2 | This paper | N/A | TGGCCCTTCAGGTCTACTGT |
| Recombinant DNA reagent (Mus musculus) | Ube2m sgRNA KO1 | This paper | N/A | GCGCAGCTCCGGATTCAGAA |
| Recombinant DNA reagent (Mus musculus) | Ube2m sgRNA KO2 | This paper | N/A | GAGTCGGCCGGCGGCACCAA |
| Recombinant DNA reagent (Mus musculus) | Nfkb2/p100 sgRNA KO1 | This paper | N/A | CTGAGCGTGATAAATGACGT |
| Recombinant DNA reagent (Mus musculus) | Nfkb2/p100 sgRNA KO2 | This paper | N/A | CTGTTCCACAATCACCAGAT |
| Recombinant DNA reagent (Mus musculus) | Map3k14/NIK sgRNA KO1 | This paper | N/A | TCAGAGCGCATTTTCATCGC |
| Recombinant DNA reagent (Mus musculus) | Map3k14/NIK sgRNA KO2 | This paper | N/A | GTCGAGGCAGTACCGGTCGC |
| Recombinant DNA reagent (Homo sapiens) | Traf3 sgRNA KO1 | This paper | N/A | AGATTCGCGACTACAAGCGG |
| Recombinant DNA reagent (Homo sapiens) | Traf3 sgRNA KO2 | This paper | N/A | CCTCACATGTTTGCTCTCGC |
| Recombinant DNA reagent (Homo sapiens) | DHB-mVenus | Spencer et al., 2013, PMID:24075009; Addgene | CAT: 136461, RRID:Addgene_136461 | |
| Recombinant DNA reagent (synthetic) | ES-FUCCI | Sladitschek and Neveu, 2015, PMID:25909630; Addgene | CAT: 62451, RRID:Addgene_62451 | |
| Recombinant DNA reagent (Mus musculus) | pWPI mScarlet NIK-ΔT3 | This paper | N/A | Mouse NIK with deleted TRAF3 binding motif (amino acids 78–84) cloned into pWPI-mScarlet vector |
| Antibody | Anti-NF2/MERLIN (rabbit monoclonal) | CST | CAT: 6995S, RRID:AB_10828709 | (1:750), WB |
| Antibody | Anti-TRAF3 (mouse monoclonal) | Santa Cruz | CAT: sc-6933, RRID:AB_628390 | (1:200), WB |
| Antibody | Anti-UBE2M (rabbit polyclonal) | Proteintech | CAT: 14520–1-AP | (1:500), WB |
| Antibody | Anti-NF-κB2 p100/p52 (rabbit polyclonal) | CST | CAT: 4882, RRID:AB_10695537 | (1:750), WB |
| Antibody | Anti-NIK (rabbit polyclonal) | CST | CAT: 4994S, RRID:AB_2297422 | (1:500), WB |
| Antibody | Anti-RELB (rabbit monoclonal) | Abcam | CAT: ab180127 | (1:1000), WB; (1:300), IF |
| Antibody | Anti-NF-kappaB Pathway Sampler Kit Antibody | CST | CAT: 9936, RRID:AB_561197 | (1:1000), WB |
| Antibody | Anti-CDKN1B/p27 (rabbit polyclonal) | BD Transduction Laboratories | CAT: 610241, RRID:AB_610241 | (1:1000), WB |
| Antibody | Anti-p21 (mouse monoclonal) | Invitrogen | CAT: ma5-14353, RRID:AB_10986834 | (1:1000), WB |
| Antibody | Anti-p19 (rabbit polyclonal) | Santa Cruz | CAT: sc-1063, RRID:AB_2078865 | (1:200), WB |
| Antibody | Anti-p18 (rabbit polyclonal) | Santa Cruz | CAT: sc-1064, RRID:AB_2078729 | (1:200), WB |
| Antibody | Anti-GAPDH (rabbit monoclonal) | CST | CAT: 2118S, RRID:AB_561053 | (1:2000), WB |
| Antibody | Anti-α-tubulin (mouse monoclonal) | Sigma-Aldrich | CAT: T-9026, RRID:AB_477593 | (1:4000), WB |
| Antibody | Anti-actin (mouse monoclonal) | Sigma-Aldrich | CAT: A4700, RRID:AB_476730 | (1:4000), WB |
| Antibody | Anti-BrdU antibodies (rat monoclonal) | Abcam | CAT: ab6326, RRID:AB_305426 | (1:800), IF, Flow |
| Antibody | Anti-YAP (rabbit polyclonal) | Novus Biologicals | CAT: NB110-58358, RRID:AB_922796 | (1:200), IF |
| Antibody | Anti-phospho-RB Ser807/811 (rabbit monoclonal) | CST | CAT: 8516S, RRID:AB_11178658 | (1:1000), IF |
| Antibody | Anti-CYCLIN D1 (mouse monoclonal) | Invitrogen | CAT: MA5-11387, RRID:AB_10987096 | (1:50), IF |
| Antibody | Anti-KI-67 (rabbit polyclonal) | Invitrogen | CAT: 18-0191Z, RRID:AB_86661 | 1:70, IF |
| Antibody | Anti-Phospho-HISTONE H3 (Ser10) (mouse monoclonal) | CST | CAT: 9706S, RRID:AB_331748 | 1:300, IF |
| Antibody | Anti-E-CADHERIN (rat monoclonal) | Thermo Fisher Scientific | CAT: 14-3249-80, RRID:AB_1210459 | 1:500, IF |
| Others | Hoechst 33342 Fluorescent dye | Life Technologies | CAT: 62249 | 1:1000, IF |
| Others | DAPI Fluorescent dye | Sigma-Aldrich | CAT: 422801 | 1:500, IF |
| Others | DRAQ5 Fluorescent dye | CST | CAT: 4084 | 1:1000, IF |
| Cell line (Mus musculus) | EpH4 | Dr. Jurgen Knoblich, Institute of Molecular Biotechnology, Vienna, Austria | Identity verified by RNAseq, DNA sequencing and immunofluorescent staining for epithelial markers | |
| Cell line (Homo sapiens) | HEK293T | ATCC | RRID:CVCL_0063 | |
| Cell line (Homo sapiens) | MCF10a | ATCC | RRID:CVCL_0598 | |
| Cell line (Mus musculus) | NIH 3T3 | ATCC | RRID:CVCL_0594 | |
| Strain (Mus musculus) | C3H/HeNCrl | Charles River Laboratories | CAT: CRL:025, RRID:IMSR_CRL:025 | |
| Chemical compound, drug | BV6 | ApexBio | CAT: B4653 | |
| Software, algorithm | GraphPad Prism | GraphPad | RRID:SCR_002798 | |
| Software, algorithm | CLC Genomics Workbench | QIAGEN | RRID:SCR_011853 | |
| Software, algorithm | Ingenuity Pathway Analysis (Qiagen) | QIAGEN | SCR_008653 | |
| Software, algorithm | Fiji is just ImageJ | N/A | RRID:SCR_002285 | |
| Software, algorithm | MAGeCK software | Li et al., 2014, PMID:25476604 | N/A |
Additional files
Download links
A two-part list of links to download the article, or parts of the article, in various formats.
Downloads (link to download the article as PDF)
Open citations (links to open the citations from this article in various online reference manager services)
Cite this article (links to download the citations from this article in formats compatible with various reference manager tools)
Genome-wide CRISPR screen identifies noncanonical NF-κB signaling as a regulator of density-dependent proliferation
eLife 9:e63603.
https://doi.org/10.7554/eLife.63603


