Simultaneous trimodal single-cell measurement of transcripts, epitopes, and chromatin accessibility using TEA-seq
- Allen Institute for Immunology, United States
- Department of Biomedical Informatics and Medical Education (BIME), University of Washington, United States
- Department of Pediatrics, University of Washington, United States
Figures
Figure 1 with 6 supplements

Improvements to scATAC-seq methods to enable permeabilized cell profiling.
(a) Schematic overview of major steps in snATAC, scATAC, and ICICLE-seq methods. (b) Comparison of quality control characteristics of ATAC-seq libraries generated from nuclei isolation and permeabilized cells, with and without fluorescence-activated cell sorting. Top panels show signal-to-noise as assessed by fraction of reads in peaks on the y-axis and quantity of unique fragments per cell barcode on the x-axis. Lower panels display fragment length distributions obtained from paired-end sequencing of ATAC libraries. Colored lines represent barcodes that pass QC filters; gray lines represent barcodes failing QC (non-cell barcodes). All libraries were equally downsampled to 200 million total sequenced reads for comparison. Colors in (b) are reused in remaining panels. (c) Total coverage of Tn5 footprints summed across all transcription start sites (TSS). Tn5 footprints are 29 bp regions comprising the 9 bp target-site duplication (TSD) and 10 bp on either side, which represent accessible chromatin for each transposition event. (d) Total coverage of TSD centers summed over a set of 100,000 genomic CTCF motifs found in previously published DNase-hypersensitive sites (Meuleman et al., 2020). TSD centers are obtained by shifting +4 and −5 bp from the 5' and 3' ends of uniquely aligned fragments, respectively. (e) Barplot representations of the fraction of total aligned reads in various QC categories. Fragments overlapping a previously published peak set for peripheral blood mononuclear cell dscATAC-seq (Lareau et al., 2019) are in the 'Overlap Peaks' category. Unique fragments are the remaining uniquely aligned fragments that do not overlap peak regions. 'Waste' reads were not aligned or were assigned to cell barcodes with fewer than 1000 total reads. (f) Violin plots showing distributions of QC metrics. Median (wide bar) and 25th and 75th quantiles (whiskers and narrow bars) are overlaid on violin plots. Median values are also in Table 1. Note that the y-axis of the first panel is on a logarithmic scale; remaining panels are linear. snATAC: single-nucleus assays for transposase-accessible chromatin; scATAC: single-cell assays for transposase-accessible chromatin; ICICLE-seq: integrated cellular indexing of chromatin landscape and epitopes.
-
Figure 1—source data 1
Single cell metadata and QC metrics for scATAC-seq experiments .
- https://cdn.elifesciences.org/articles/63632/elife-63632-fig1-data1-v2.zip
-
Figure 1—source data 2
Fragment size distribution data .
- https://cdn.elifesciences.org/articles/63632/elife-63632-fig1-data2-v2.zip
-
Figure 1—source data 3
TSS Footprint pileups.
- https://cdn.elifesciences.org/articles/63632/elife-63632-fig1-data3-v2.zip
-
Figure 1—source data 4
CTCF Tn5 target site duplication center pileups.
- https://cdn.elifesciences.org/articles/63632/elife-63632-fig1-data4-v2.zip
-
Figure 1—source data 5
Fraction of reads per alignment category.
- https://cdn.elifesciences.org/articles/63632/elife-63632-fig1-data5-v2.zip
Figure 1—figure supplement 1
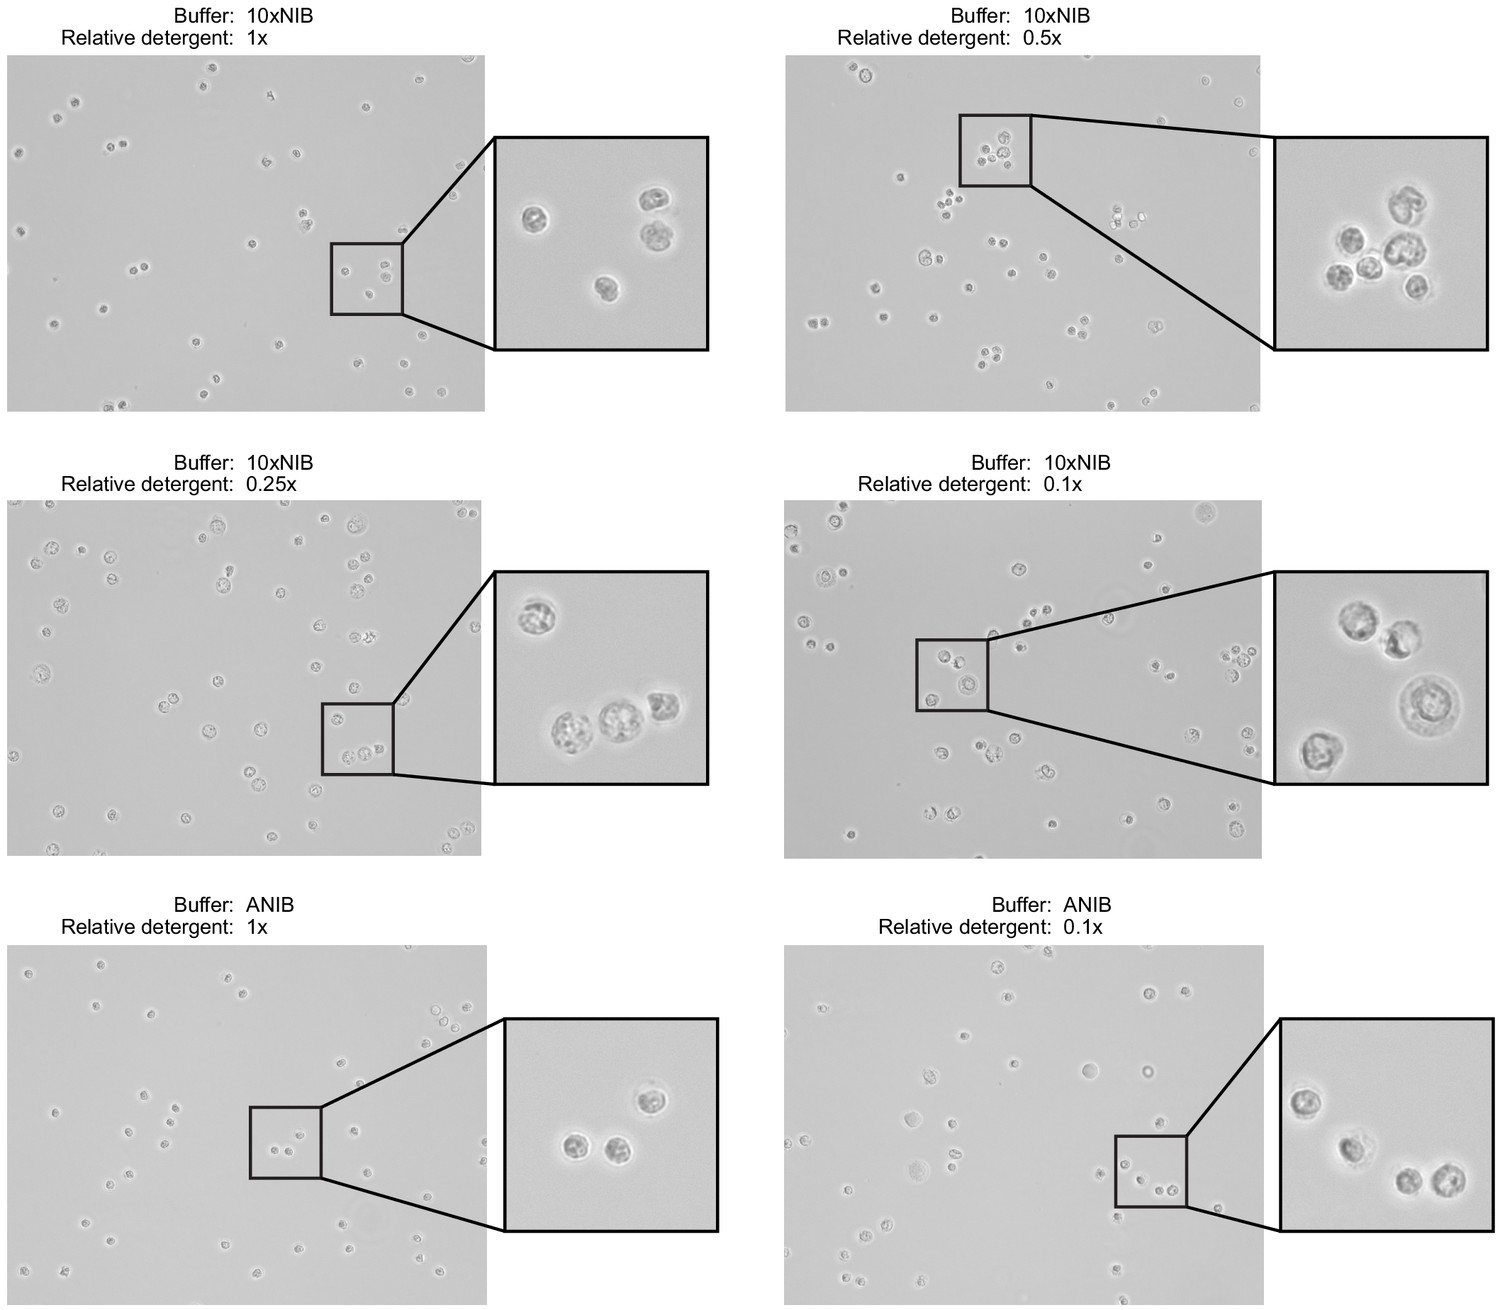
Nuclei were isolated from peripheral blood mononuclear cells using two buffer compositions and varying detergent concentrations.
The two buffers, 10xNIB and ANIB, are defined in Materials and methods, and the concentration of the detergent components of the buffers was varied for each sample. After isolation, nuclei were imaged using an EVOS M5000 Imaging System in transmitted light mode at ×40 magnification to assess completeness of isolation and the condition of nuclei. Ideally, nuclei will not retain cell membranes and will have round, well-defined edges with minimal blebbing.
Figure 1—figure supplement 2
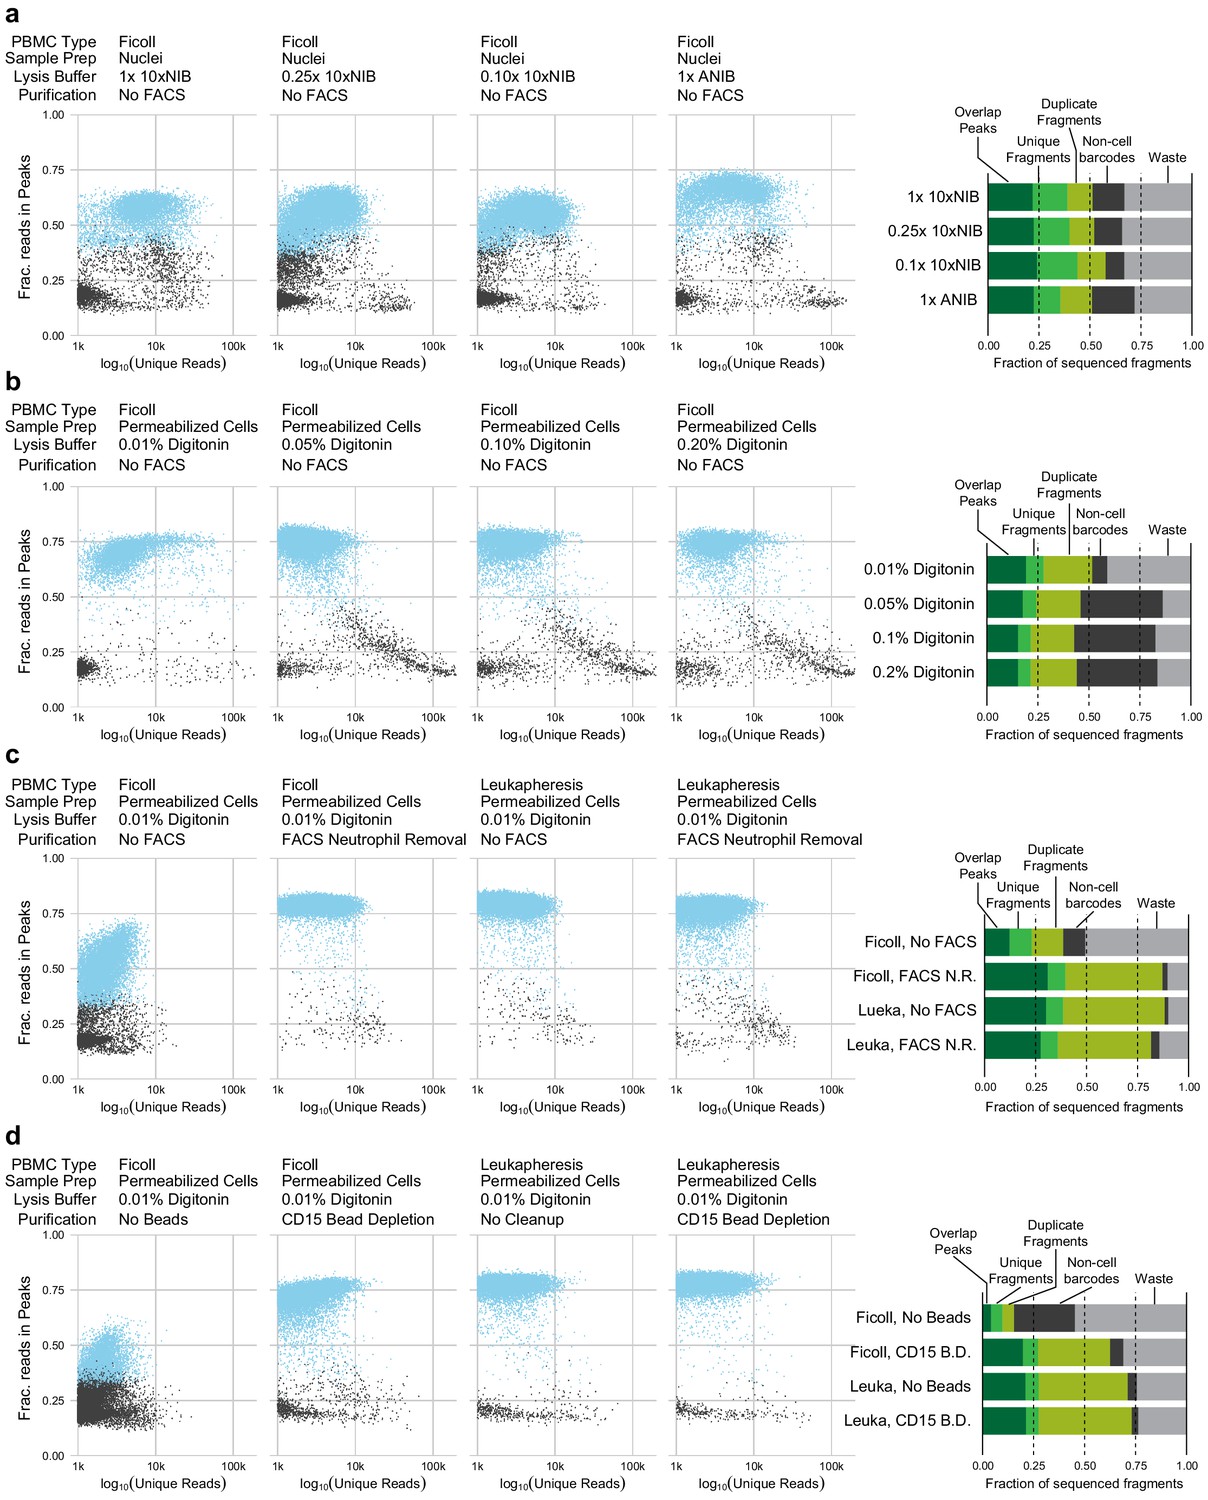
Quality control plots for single-nucleus assays for transposase-accessible chromatin (snATAC-seq) and single-cell assays for transposase-accessible chromatin ( scATAC-seq) experimental conditions.
Each plot compares the quantity of data obtained from each cell (x-axis, log-scaled unique fragment counts) against signal-to-noise as measured by fraction of reads in peaks (y-axis, fraction of reads in peaks [FRIP]). Each point represents a single 10x Genomics cell barcode. Blue points are barcodes that pass QC cutoffs (>1,000 unique fragments, FRIP > 0.2, FRITSS > 0.2, and fraction of reads in ENCODE index peaks > 0.5); gray points are barcodes that fail QC. To the right of each row, a barplot presents the fraction of sequenced fragments that fall into each QC category. The order of the barplots, from top to bottom, matches the order of scatterplots, from left to right, within each row. (a) Comparisons of nuclei isolation buffer compositions. Components of 10xNIB and ANIB buffers are defined in Materials and methods. (b) Comparisons of cell permeabilization conditions by varying the concentration of digitonin. Additional buffer components are defined in Materials and methods. (c) Comparisons of neutrophil removal by fluorescence-activated cell sorting on Ficoll-purified peripheral blood mononuclear cells (PBMCs) (left two panels) and leukapheresis-purified PBMCs (right two panels). Neutrophil removal was performed using the gating scheme shown in Figure 1—figure supplement 4. (d) Comparisons of neutrophil removal by anti-CD15 magnetic bead depletion on Ficoll-purified PBMCs (left two panels) and leukapheresis-purified PBMCs (right two panels).
Figure 1—figure supplement 3
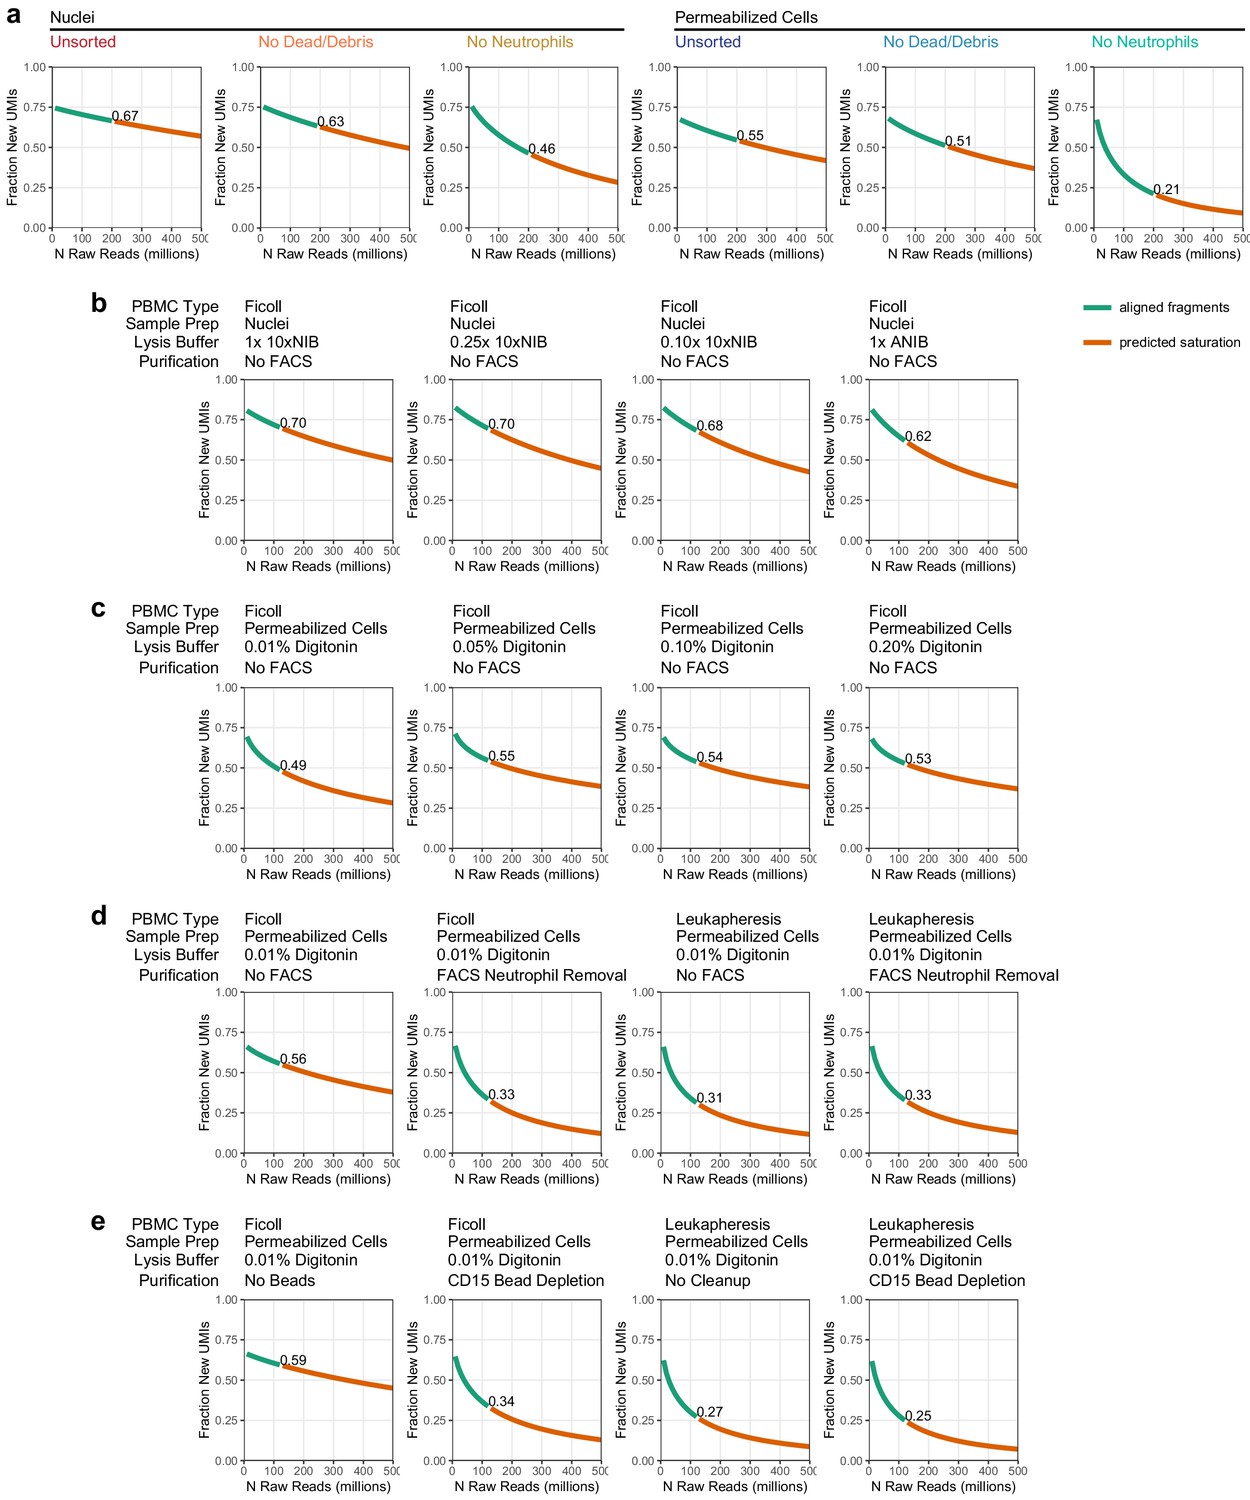
Sequencing depth calculation and projection.
Each line plot represents the fraction of new unique fragments (called unique molecule indexes [UMIs] in these plots) that are found as sequencing depth is increased (i.e., the fraction of new UMIs in every 10 million read depth step). Green lines show the actual aligned fragments used for analysis. Orange lines are predicted depth extrapolated from the aligned fragments (Materials and methods). Text labels in each plot show the fraction of new unique UMIs at the aligned sequence depth. (a) Depth projections for the experiments presented in Figure 1 (downsampled to 200 million reads per sample). (b) Depth projections for the experiments presented in Figure 1—figure supplement 2a: nuclei preparation conditions (downsampled to 125 million reads per sample). (c) Depth projections for the experiments presented in Figure 1—figure supplement 2b: cell permeabilization conditions (downsampled to 125 million reads per sample). (d) Depth projections for the experiments presented in Figure 1—figure supplement 2c: fluorescence-activated cell sorting-based neutrophil removal in Ficoll and Leukapheresis-derived samples (downsampled to 125 million reads per sample). (e) Depth projections for the experiments presented in Figure 1—figure supplement 2d: magnetic bead-based neutrophil removal in Ficoll and Leukapheresis-derived samples (downsampled to 125 million reads per sample).
Figure 1—figure supplement 4
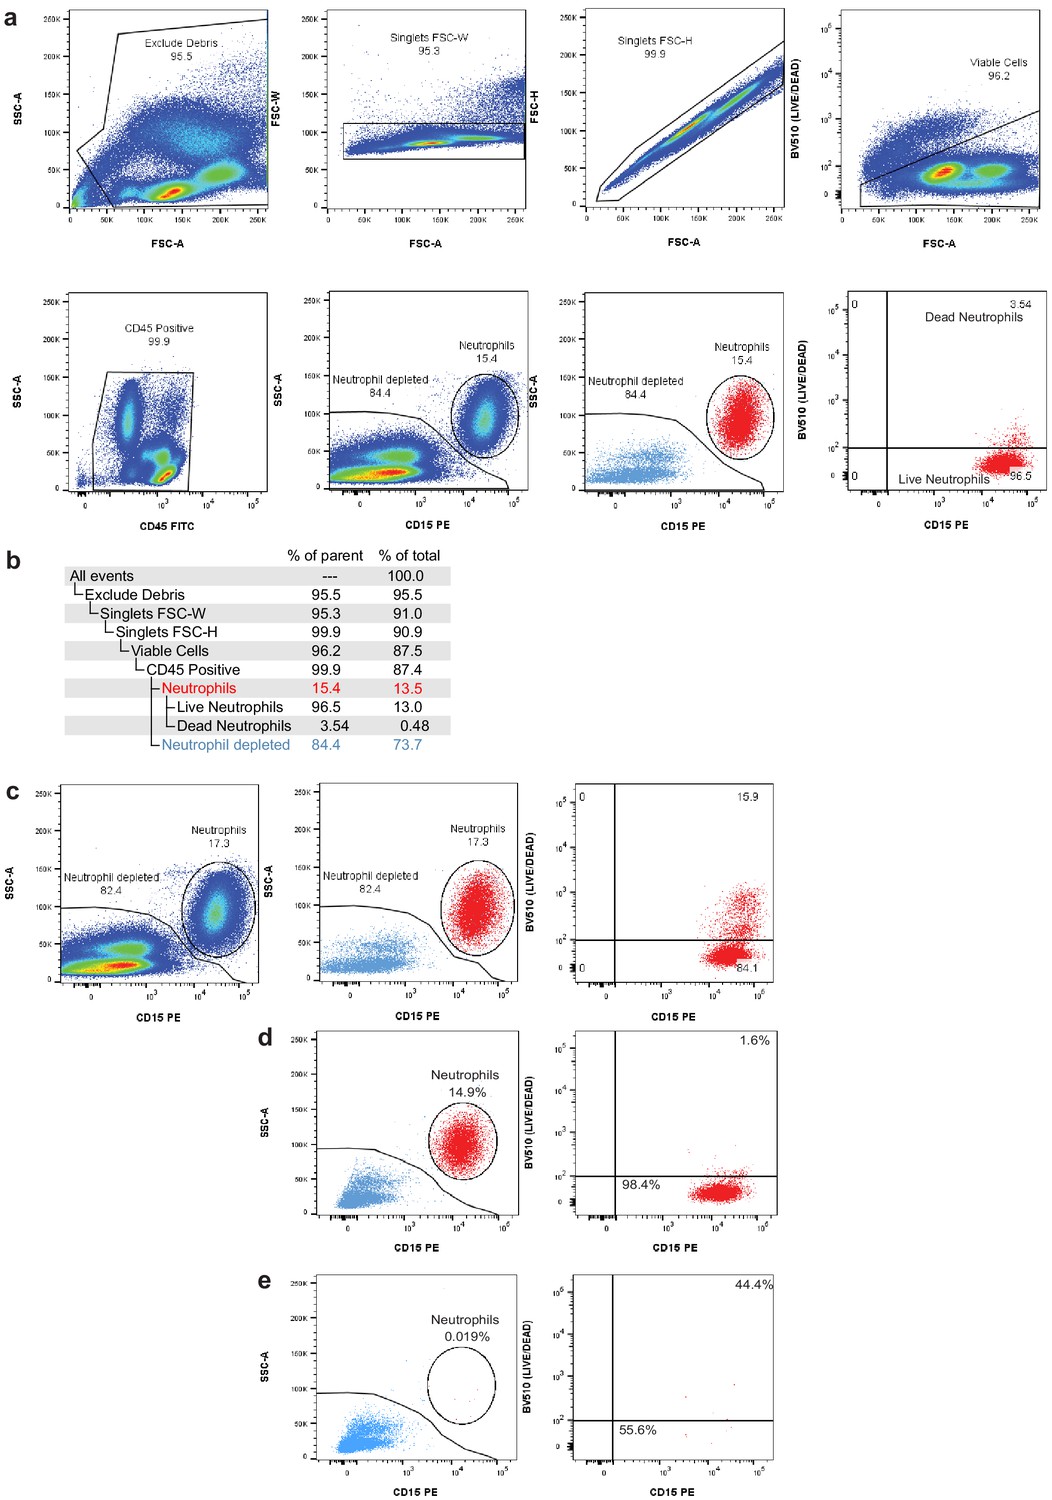
Flow cytometry gating to assess neutrophil depletion.
(a) Gating strategy for fluorescence-activated cell sorting (FACS) removal of debris, doublets, dead cells, and neutrophils. (b) Gating hierarchy for FACS neutrophil depletion shown in (a) with demonstration data used to provide percentages of parent gates and total cells. (c) Pre-sort collection sequential gating shows the live/dead proportion of total neutrophils. During FACS, dead neutrophils are removed using the live/dead gate and CD15/SSC gate, leading to an underestimation of the total neutrophil content in the sample. (d) Post-sort analysis of neutrophil content after debris, doublet, and dead cell removal. Left panel displays the percentage of viable singlets in the neutrophil gate (CD45+ gate in b). Right panel displays the percentage neutrophils that are live (bottom-right) and dead (top-right). (e) Post-sort analysis of neutrophil content and viability after neutrophil exclusion sort (neutrophil-depleted gate in b).
Figure 1—figure supplement 5
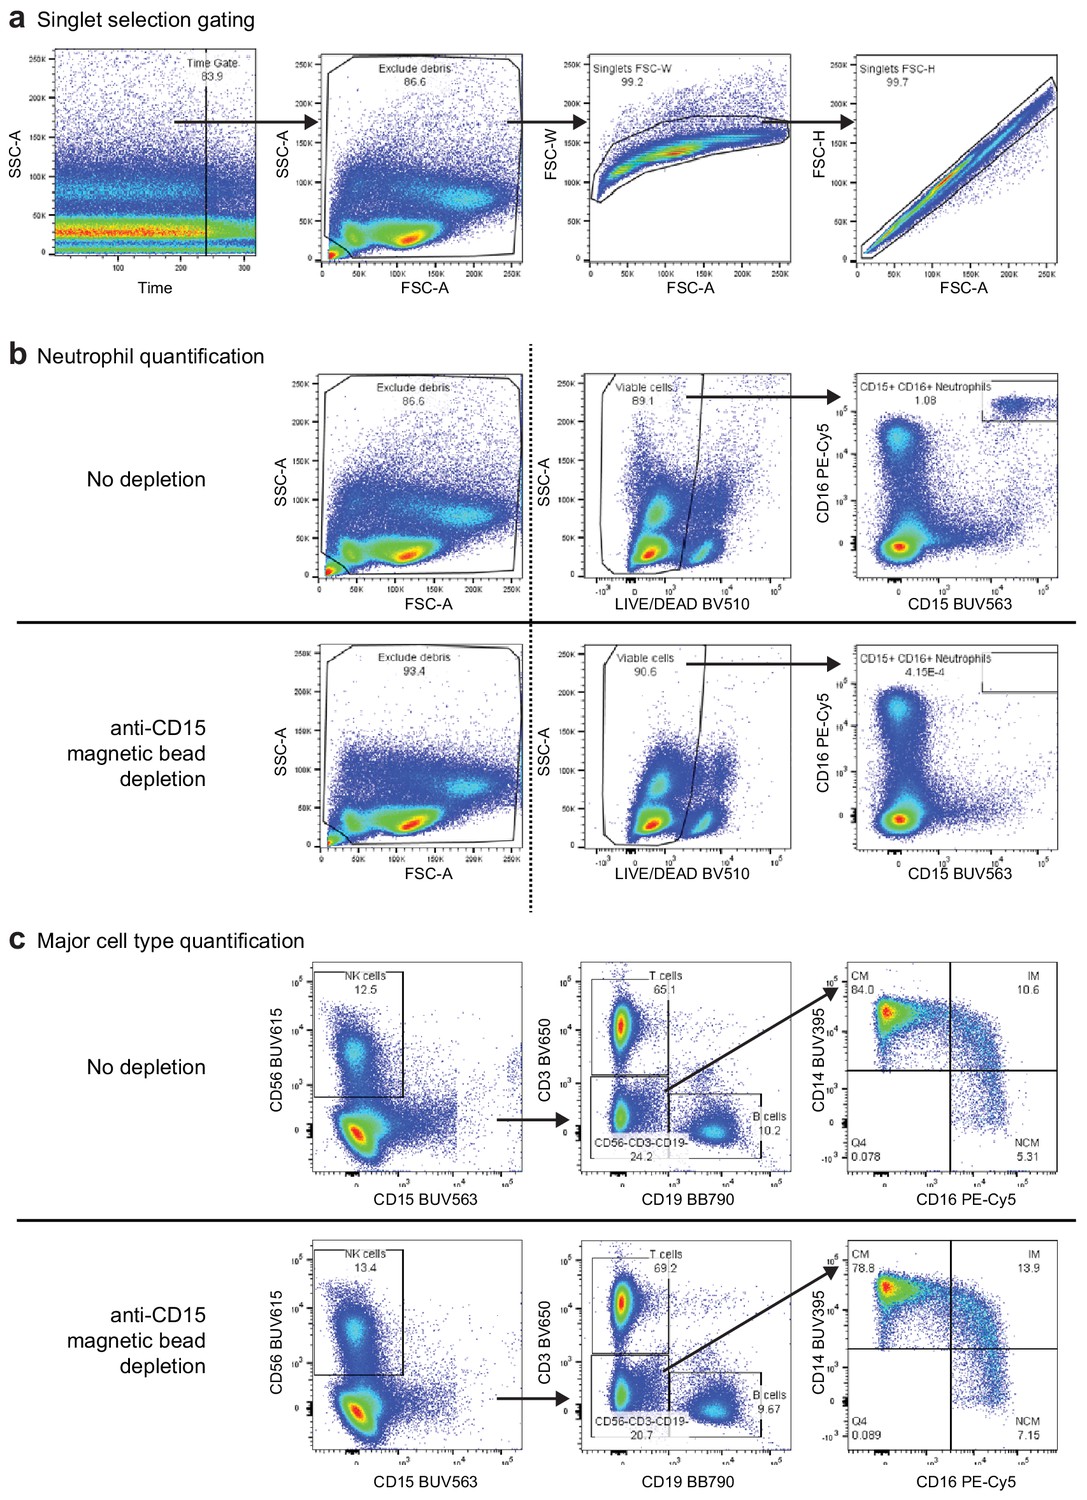
Gating strategy for the eight-color flow cytometry panel used to evaluate anti-CD15 bead-based neutrophil removal.
(a) Preparatory gating used to select high-quality events (plot 1), exclude debris (plot 2), and select singlet events (plots 3 and 4) (b) Comparison of select gated populations of the peripheral blood mononuclear cell (PBMC) sample before (top) and after depletion (bottom). The dashed line indicates that events from the left panel were not the parent gates for the two plots to the right, which were filtered first by the singlet gates described in (a). Dead cells and debris were slightly reduced following depletion (leftfmost plots). CD15+/CD16+ neutrophils were depleted from 1.080% to < 0.001% following depletion (rightmost plots). (c) Gating strategy for identification of major cells types in the PBMC sample before (top) and after depletion (bottom). Following time, debris, singlet, live/dead, and CD45+ gating, NK cells were defined as CD15-/CD56+, T cells were defined as CD3+/CD19-, and B cells were defined as CD3-/CD19+. Cells in the CD3-/CD19-/CD56- gate were used to identify monocyte subsets. Classical monocytes were defined as CD14+/CD16-, intermediate monocytes were defined as CD14+/CD16+, and non-classical monocytes were defined as CD14-/CD16+. We observed modest depletion of some classical monocytes (CM, from 84.0% to 78.8% of monocytes) with corresponding increases in the proportion of intermediate (IM) and non-classical (NCM) monocytes after bead depletion.
Figure 1—figure supplement 6
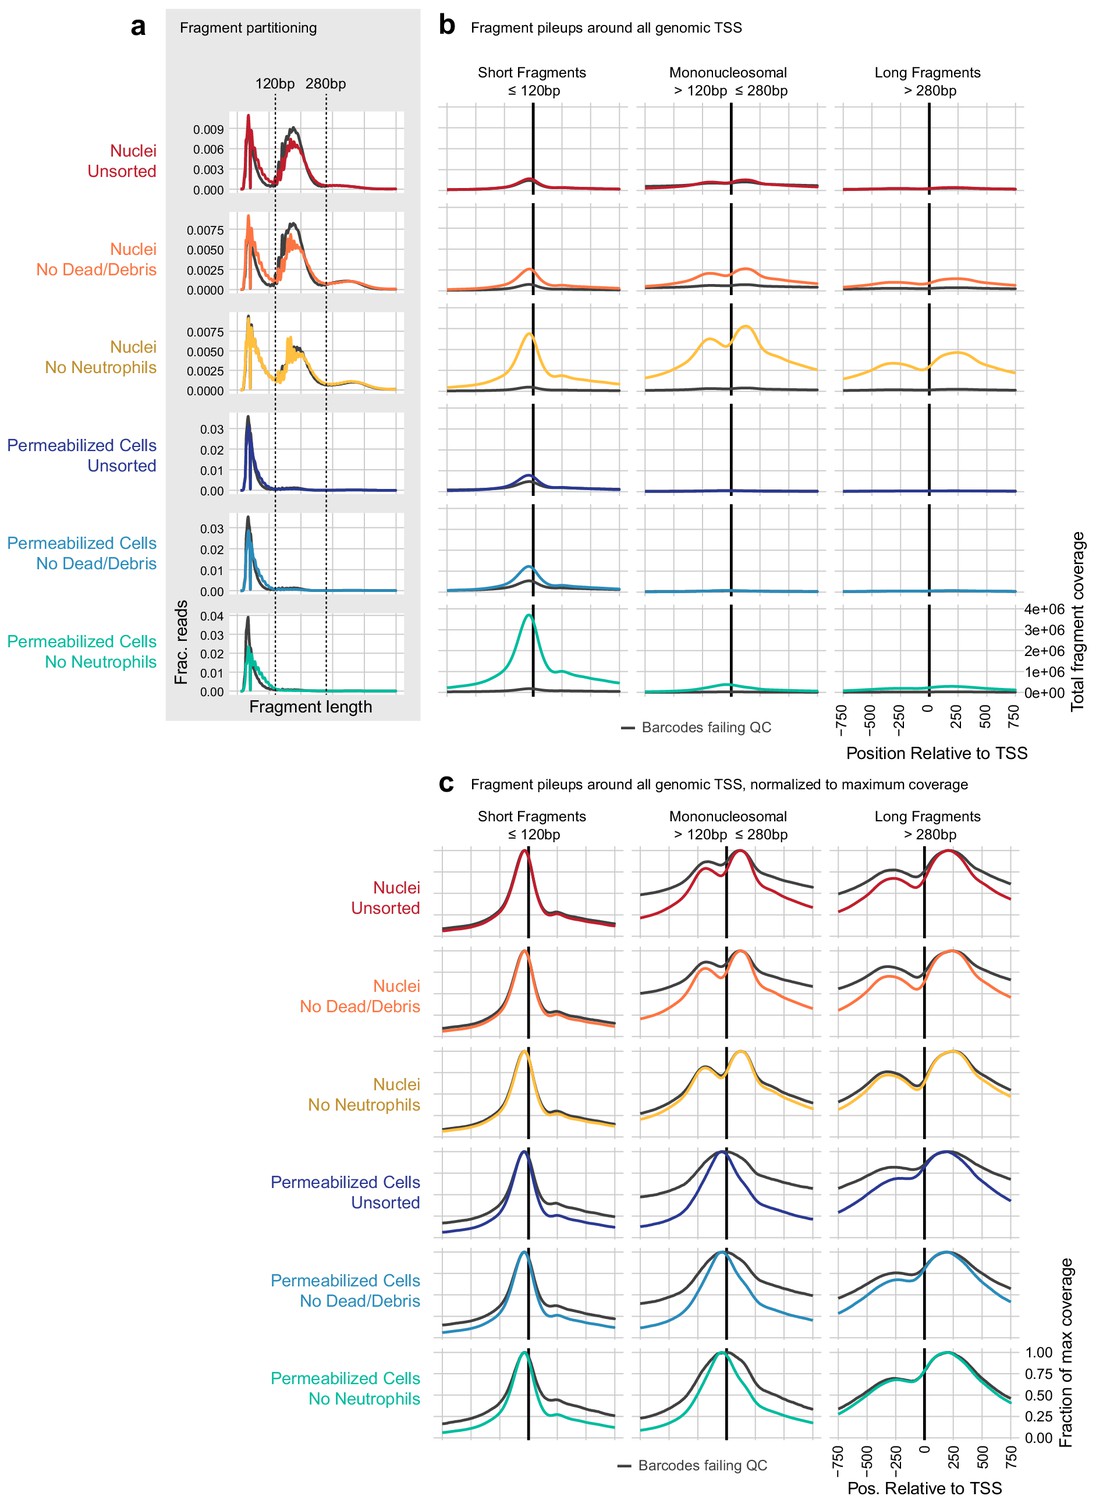
Examination of transcription start site-proximal fragment positions across scATAC methods.
(a) To compare the contribution of nucleosomal fragments to signal near genomic transcription start sites (TSS), we partitioned unique, aligned fragments into three categories: short subnucleosomal fragments (≤120 bp), mononucleosomal fragments (>120 and ≤280 bp), and longer fragments including di- and tri-nucleosomal fragments (>280 bp). The distribution of fragment lengths for each sample is displayed as a line plot, where colored lines show the distribution of cell barcode fragments and gray lines show the distribution of fragments from non-cell barcodes. (b) All fragments that overlapped a window around all genomic TSS ± 2000 bp were assembled, and the overlaps of fragments in each of the three size categories defined in (a) are plotted relative to the TSS ± 750 bp. Axis labels shown on the bottom-right panel apply to all plots in (b). Nucleosomal fragments flanking the TSS are clearly visible for the nuclei: no neutrophils sample (third row, gold). These are less frequent in all permeabilized cell samples (rows 4–6, blue colors). (c), as in (b), but each line has been scaled by dividing by the maximum coverage value for that line to make the shape of each distribution visible. Here, we can see nucleosomal positioning in each of the nuclei samples (top three rows, warm colors) and a lack of mononucleosomal positioning in permeabilized cell samples (bottom three rows, blue colors). However, longer flanking fragments (third column) have a similar qualitative shape in both nuclei and permeabilized cells.
Figure 2 with 2 supplements
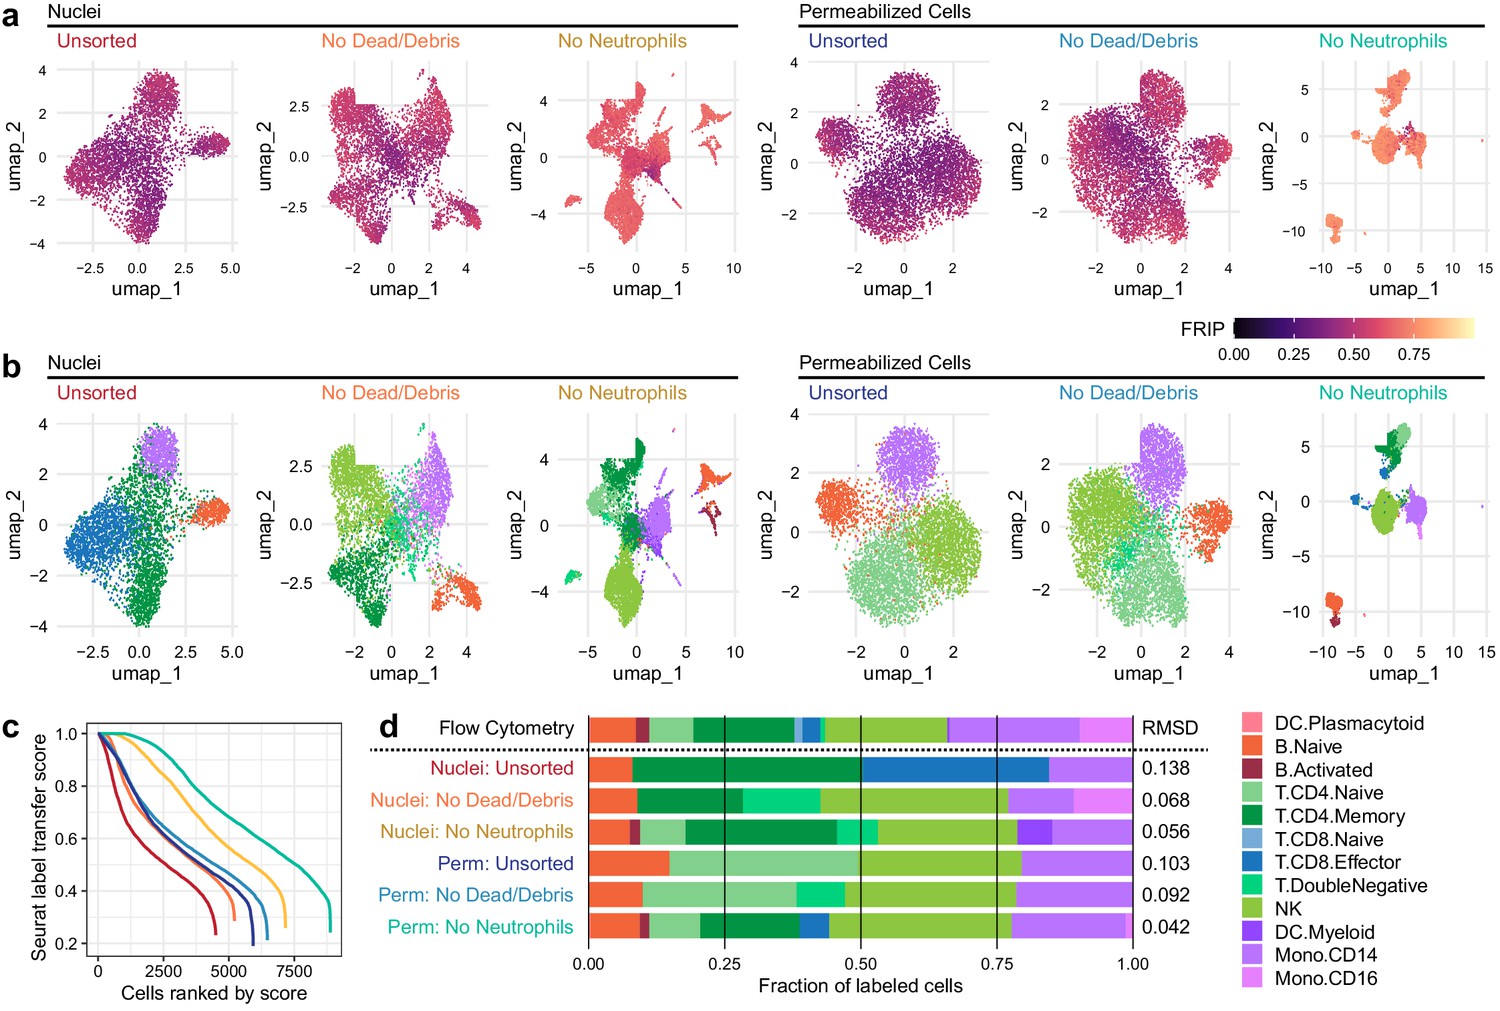
Improvements to 2D projection and label transfer for scATAC-seq data.
(a) Uniform manifold approximation and projection (UMAP) projection plots for corresponding datasets in Figure 1. Points are colored based on a common scale of fraction of reads in peaks, bottom right. The number of cells in each panel is displayed in Figure 1b. (b) UMAP projection plots colored based on cell type obtained by label transfer from scRNA-seq (Materials and methods). Colors for cell types are below, to the right. (c) To visualize the number and quality of transferred labels, we ranked all cells based on the Seurat label transfer score obtained from label transfer results and plotted lines through the score (y-axis) vs. rank (x-axis) values. (d) Barplot showing the fraction of cells in each dataset that were assigned each cell-type label. The top row shows cell-type proportions for the same peripheral blood mononuclear cell sample obtained by 25-color immunotyping flow cytometry (Materials and methods, Supplementary file 3, and Figure 2—figure supplement 1). Root-mean-square deviation values were computed by comparison of labeled cell-type proportions to values derived from flow cytometry (Supplementary file 4). Colors for cell types are to the right of the barplot.
-
Figure 2—source data 1
Single cell UMAP coordinates and labeling scores.
- https://cdn.elifesciences.org/articles/63632/elife-63632-fig2-data1-v2.zip
-
Figure 2—source data 2
Fractions of cells assigned to each type by flow cytometry and scATAC-seq.
- https://cdn.elifesciences.org/articles/63632/elife-63632-fig2-data2-v2.zip
Figure 2—figure supplement 1
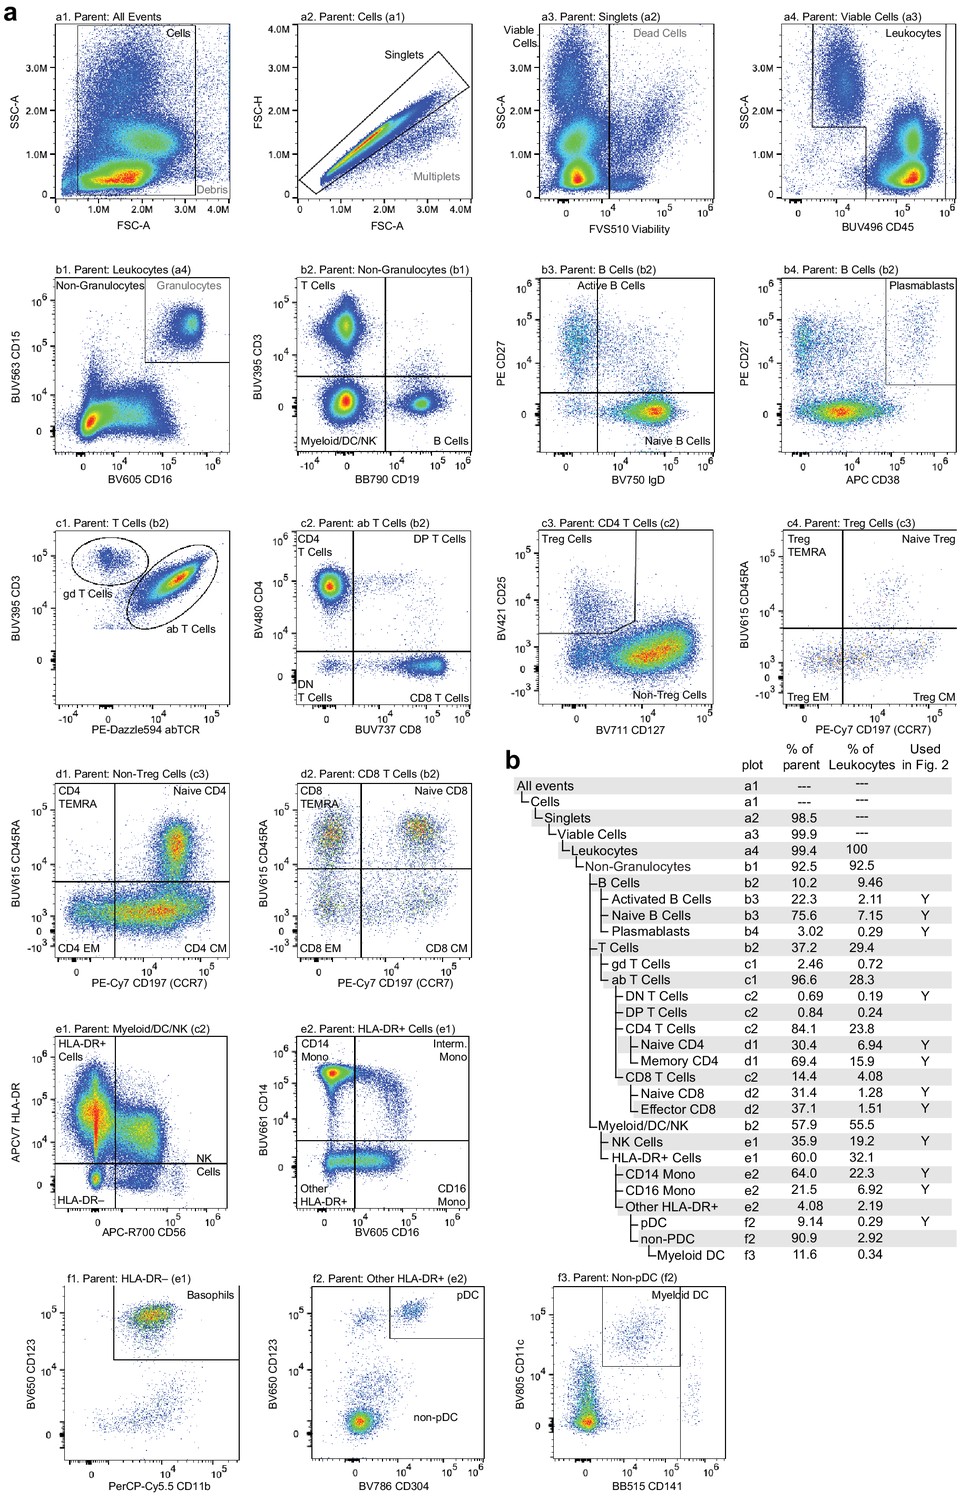
Flow cytometry gating used to classify and quantify cell-type abundance.
Cells were stained with a panel of 25 fluorescently labeled antibodies in total, fluorescence was measured using a Cytek Aurora spectral flow cytometer, and events were manually gated to assess cell-type abundance. (a) Pairwise feature plots show the gates used for cell-type assessment. Plots are arranged in rows (labeled a–f) and columns (labeled 1–4). The plot and label of the parent gate are at the top of each plot, and gates derived from each set of markers are labeled within the plots. (b) Gating hierarchy used to quantify cell types, with references to the plot in which each gate is defined. Cell-type labels used to generate reference proportions in Figure 2 are specified in the last column.
Figure 2—figure supplement 2
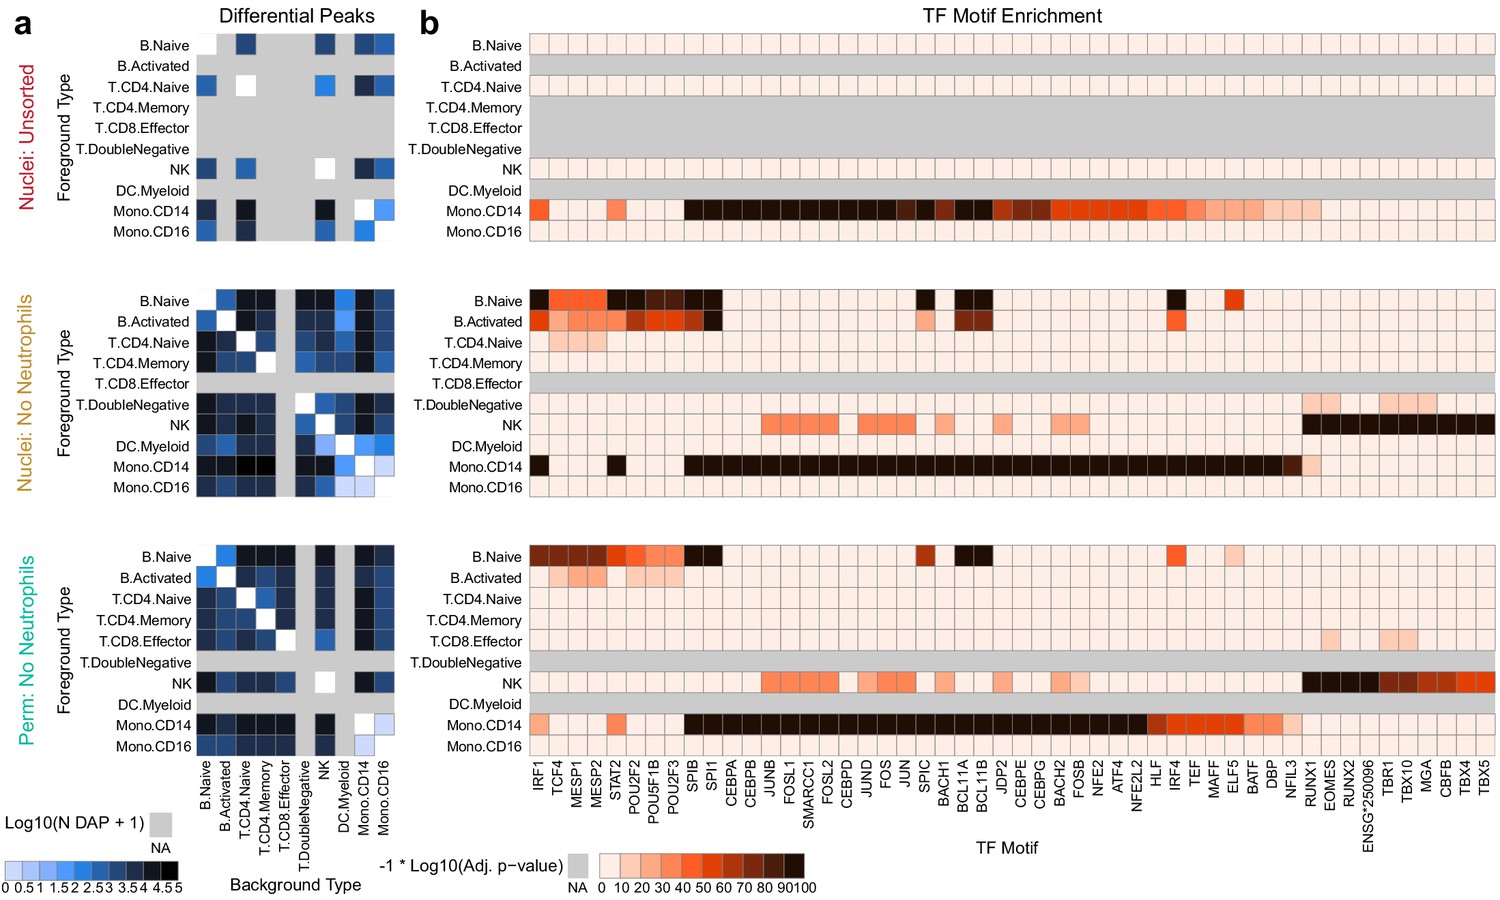
Improved diffential peak and motif detection.
(a) Heatmap plots of pairwise differentially accessible peaks (DAPs) between each pair of types as computed with Wilcoxon tests using the ArchR package (Granja et al., 2020) (Materials and methods). Values shown are the number of peaks more highly accessible in the foreground type (y-axis) compared to the background type (x-axis). Colors represent log10-scaled and binned counts of DAPs, as shown in the scale to the bottom-left. Gray regions represent cell types that were not observed in a dataset. (b) Heatmap plots of enriched transcription factor binding site motifs. Colors represent −1 × log10-scaled and binned adjusted p-values for tests of enrichment (Materials and methods). Values > 100 are colored black.
Figure 3 with 2 supplements

Simultaneous profiling of chromatin accessibility and cell surface epitopes.
(a) Uniform manifold approximation and projection (UMAP) projection plot of integrated cellular indexing of chromatin landscape and epitopes (ICICLE-seq) cells based on single-cell assays for transposase-accessible chromatin (scATAC-seq) data. Cells are colored based on fraction of reads in peaks. n = 10,227 cells passing QC criteria are displayed. (b) UMAP projection of scATAC-seq data, as in (a). Cells are colored based on cell-type labels obtained by ArchR label transfer (Materials and methods). (c) UMAP projection plot of ICICLE-seq cells based on antibody-derived tag (ADT) data. Cells are colored according to the total number of unique molecule indexes across all markers. (d) UMAP projection based on ADT data, as in (c), colored according to cell-type labels derived from marker expression (Materials and methods). (e) Heatmap of median ADT count values for each marker in each cell type labeled in (d). Values are separately scaled in each row between zero and the maximum value (right column) for each marker.
-
Figure 3—source data 1
Cell type labels and UMAP coordinates for ICICLE-seq cells.
- https://cdn.elifesciences.org/articles/63632/elife-63632-fig3-data1-v2.zip
-
Figure 3—source data 2
ADT count data for ICICLE-seq.
- https://cdn.elifesciences.org/articles/63632/elife-63632-fig3-data2-v2.zip
Figure 3—figure supplement 1
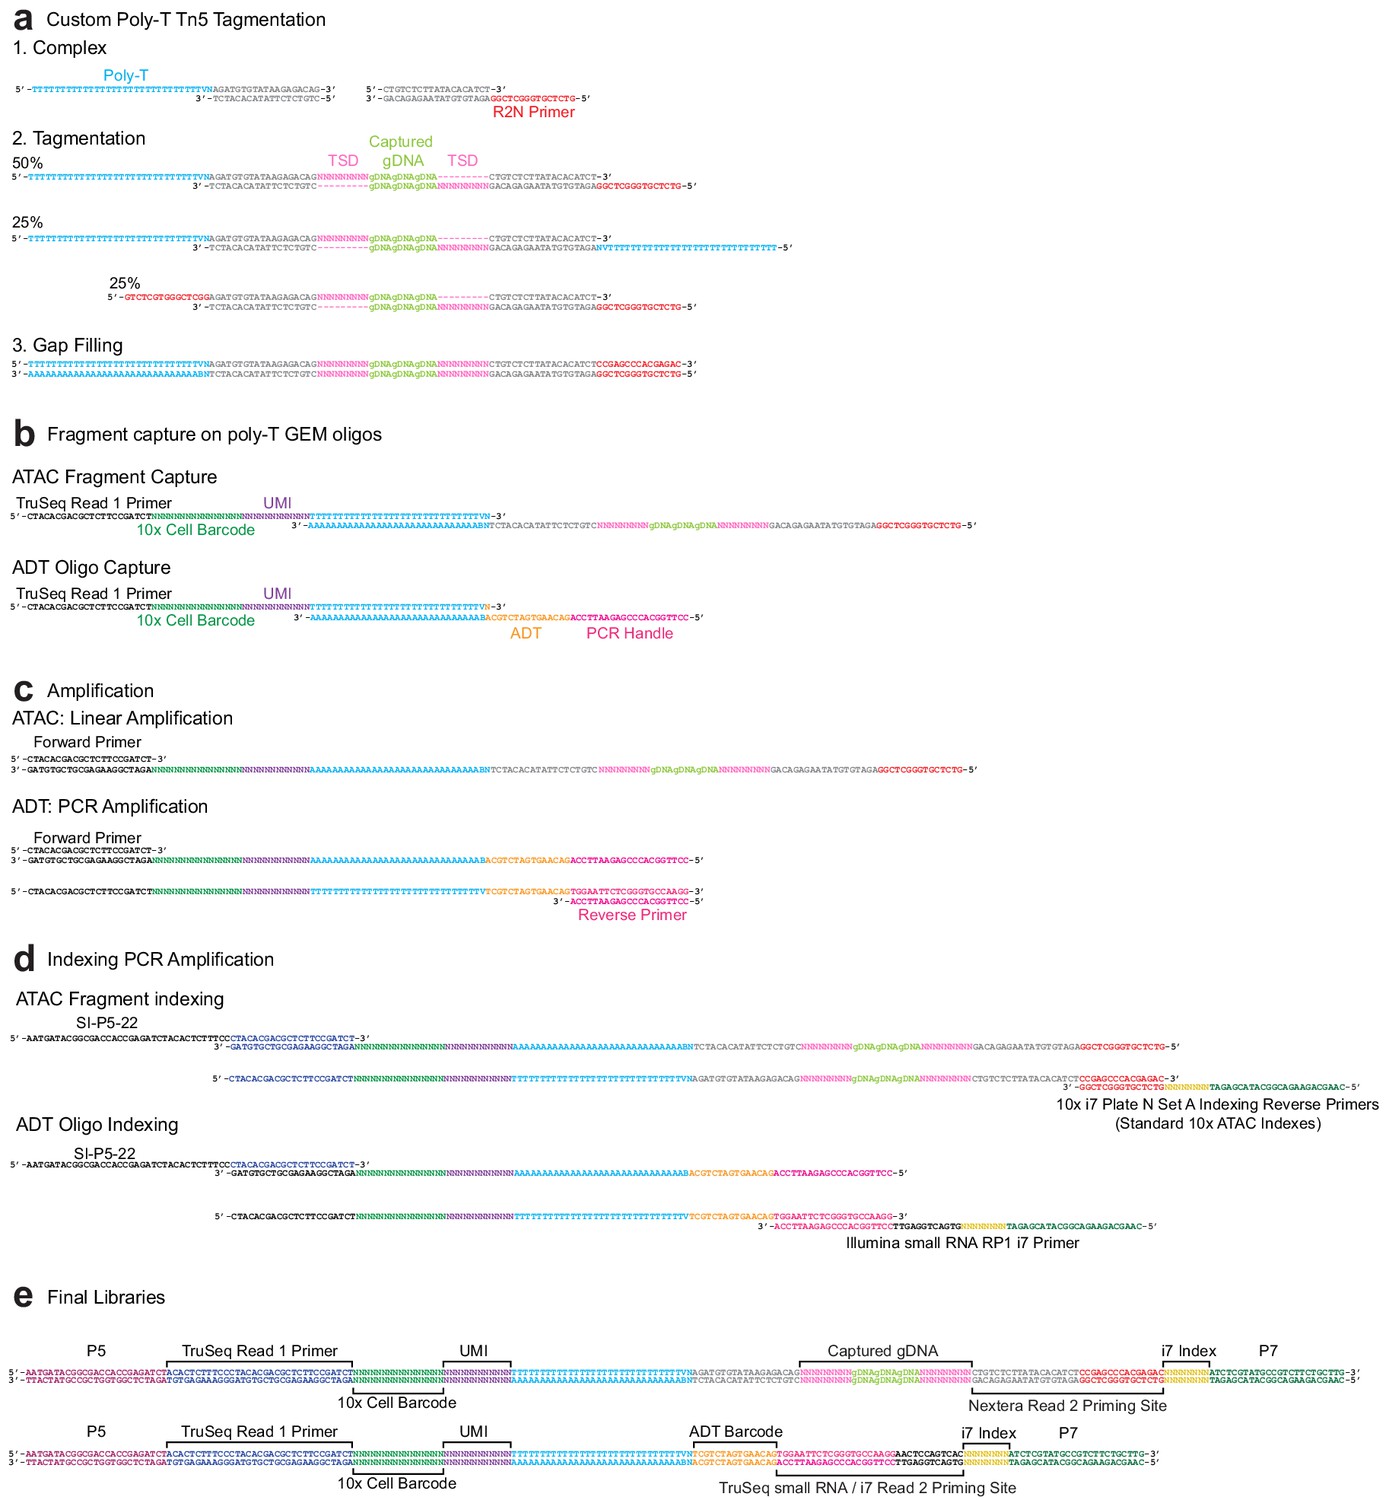
Sequence-level integrated cellular indexing of chromatin landscape and epitopes design and workflow.
(a) Tn5 transposase complexes are formed by annealing Poly-T and Nextera R2N top oligos to mosaic-end bottom oligos to form double-stranded DNA complexes. Complexes are bound to Tn5 transposase in the mosaic-end regions and transposed into target gDNA via a tagmentation reaction. Approximately half of the resulting assays for transposase-accessible chromatin (ATAC) fragments have both a Poly-T and R2N overhang and are capable of being barcoded and indexed in subsequent amplification reactions. (b) Following GEM generation and gap-filling, DNA fragments are denatured to allow annealing to 10x Genomics 3′ bead oligos and extension by a DNA polymerase, resulting in the addition of cell barcode and unique molecule index (UMI) sequences. (c) Barcoded ATAC fragments are amplified linearly using a forward primer, while barcoded antibody-derived tags (ADT) fragments are amplified exponentially by PCR through the addition of an ADT specific reverse primer. (d) Intermediate libraries are amplified and Illumina P5 and indexed P7 adapter sequences are added by PCR. Prior to amplification, libraries are divided into separate ATAC and ADT reactions and amplified using library-specific P7 primers. (e) Final ATAC and ADT library structure includes all components required for sequencing. The TruSeq Read 1 Primer reads the 10x cell barcode and UMI for both libraries as Read 1, followed by readout of the i7 index sequence with the Nextera Read 2 Priming Site (ATAC) or TruSeq small RNA/i7 Read 2 Priming site (ADT). After strand switching, these two latter binding sites are used to read out the captured gDNA sequence (ATAC) or ADT barcode as Read 2.
Figure 3—figure supplement 2
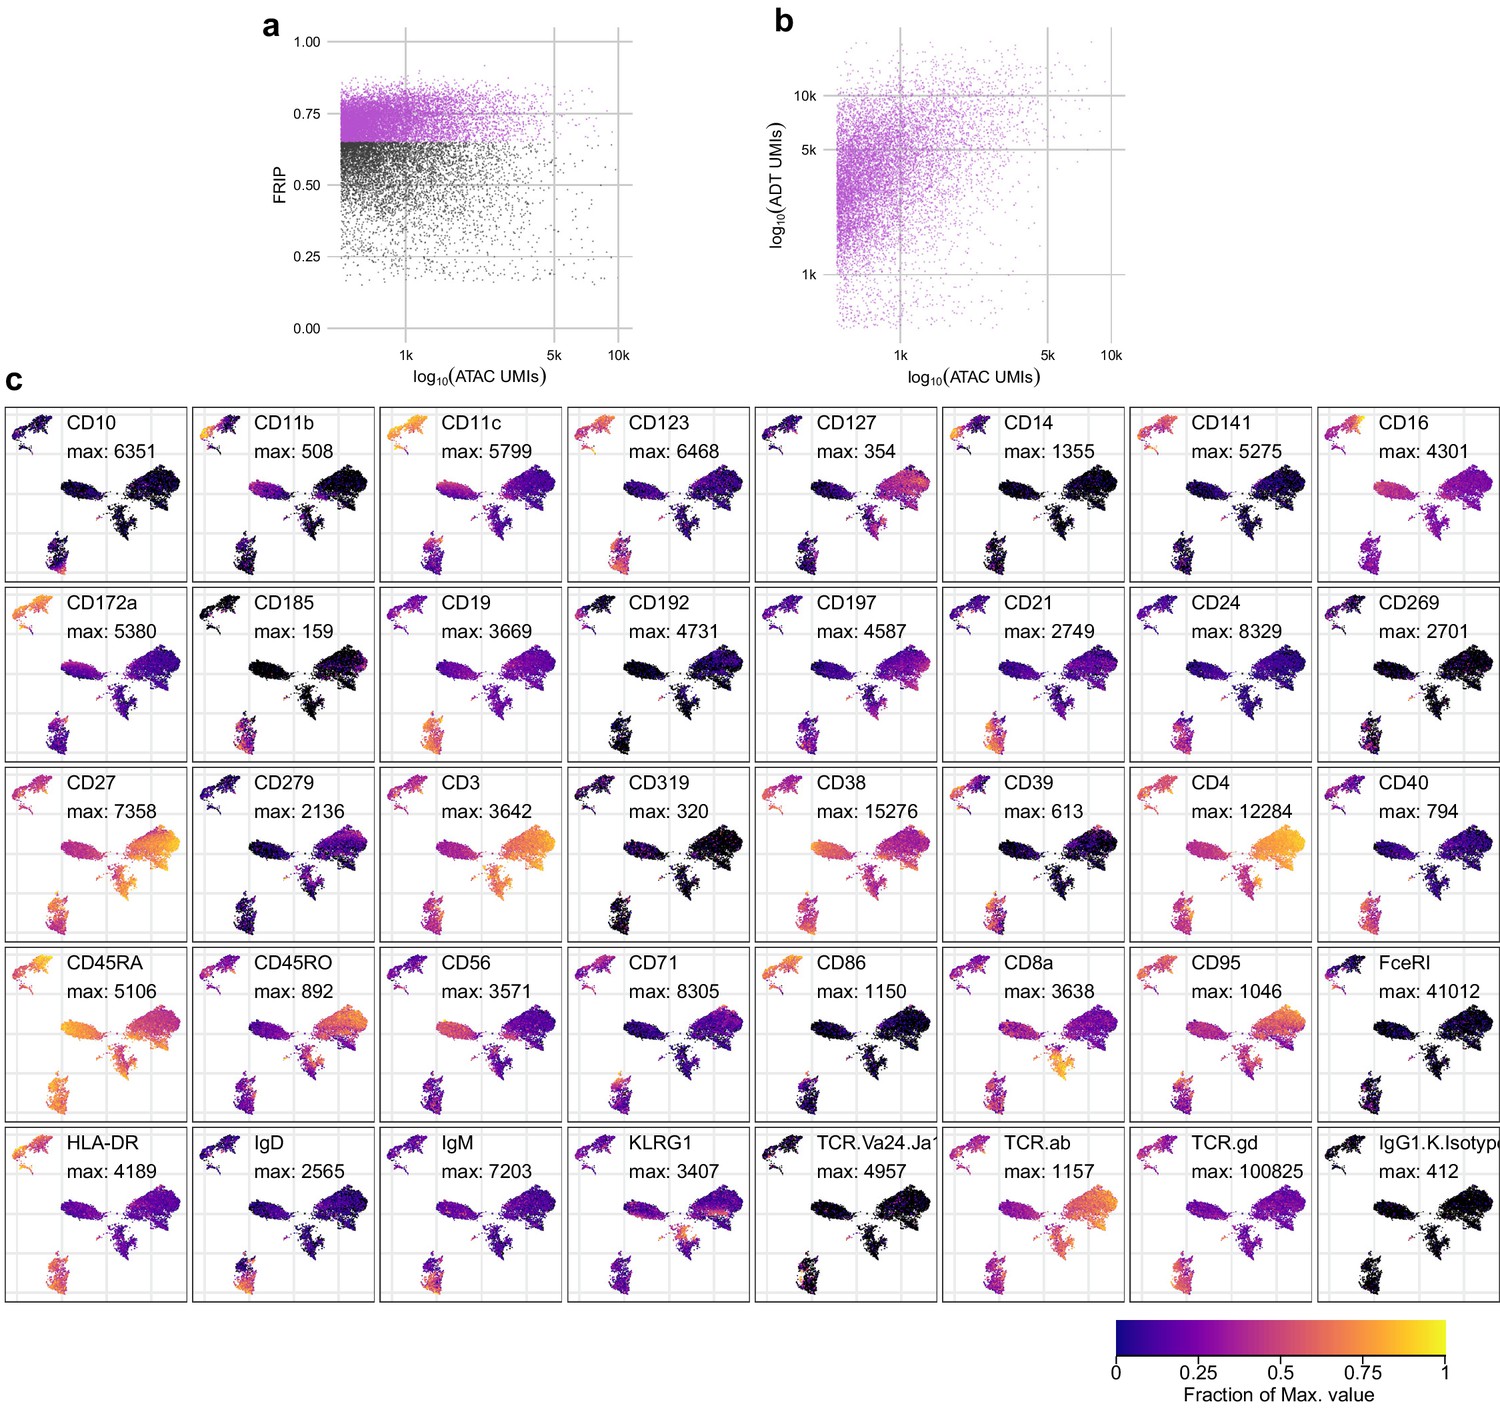
Quality metrics and epitope detection for ICICLE-seq.
(a) QC metrics plot for the assays for transposase-accessible chromatin (ATAC-seq) component of integrated cellular indexing of chromatin landscape and epitopes (ICICLE-seq). Cell barcodes with fraction of reads in peaks > 0.65 (purple points) were selected for downstream analysis. (b) Comparison of the number of ATAC unique molecule indexes (UMIs) (x-axis) to antibody-derived tags (ADT) UMIs (y-axis) for each cell barcode that passed the QC cutoff in (a). (c) Uniform manifold approximation and projection plots based on ADT UMI counts. Each panel shows log-transformed expression of a different marker, and values scaled between zero (black) and the maximum observed value (yellow). The color legend at the bottom-right applies to all panels.
Figure 4 with 4 supplements
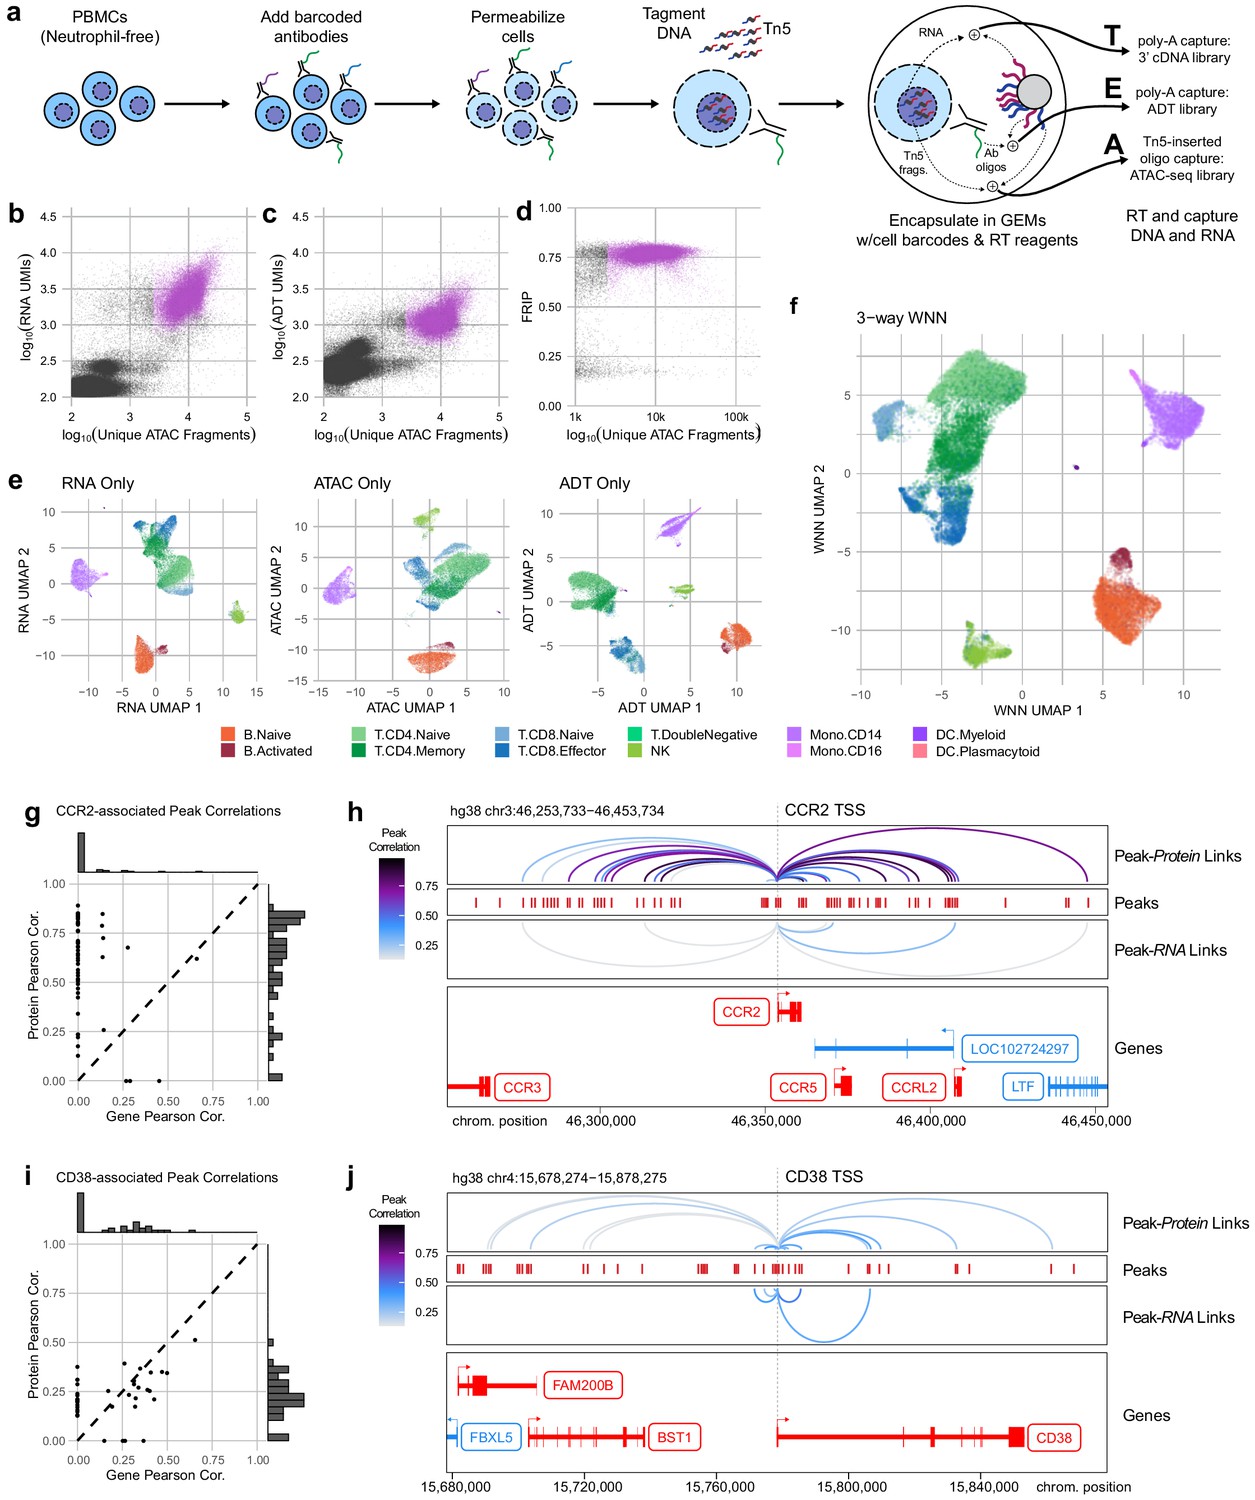
Trimodal measurement of transcription, epitopes, and accessibility.
(a) Workflow diagram for the major steps in transcription, epitopes, and accessibility (TEA-seq). (b) Scatterplot comparing unique single-cell assays for transposase-accessible chromatin (scATAC-seq) fragments and scRNA-seq unique molecule indexes (UMIs) for each TEA-seq cell barcode. In (a, b, d, and e), n = 227,390 barcodes are displayed in total; 29,264 passing QC criteria are represented by purple points. (c) Scatterplot comparing unique scATAC-seq fragments and antibody-derived tags UMIs for each cell barcode. (d) scATAC-seq QC scatterplot comparing unique scATAC-seq fragments and fraction of reads in peaks scores for each cell barcode. n = 34,757 total cells are displayed (those with >1,000 unique ATAC fragments); 29,264 passing QC criteria are represented by purple points. (e) Uniform manifold approximation and projection (UMAP) projections generated using each of the three modalities separately. Only cells passing QC (n = 7,939 barcodes) are presented in (e, f). (f) A joint UMAP projection generated using three-way weighted nearest neighbors that leverages all three of the measured modalities. (g) Scatterplot showing the peak-to-RNA correlations (x-axis) and peak-to-protein (y-axis) correlation values for each peak (points) that was found to be correlated with the CCR2 gene or CD192 antibody in TEA-seq data. Histograms at the margins show the distribution of scores for RNA correlations (top) and protein correlations (right). Dashed line shows 1:1 correspondence. Peaks not found to be correlated in each method were assigned a score of 0. (h) Genome tracks showing links between peaks (red hashes) and the CCR2 gene based on protein expression (above peaks) and gene expression (below peaks). Correlations are represented by arcs colored based on the correlation score (color scale for both panels to the left). The bottom panel shows the gene neighborhood around CCR2. All coordinates are from the Hg38 genome assembly. (i), as in (g), for the CD38 gene and correlated peaks. (j), as in (h), for the CD38 gene locus.
-
Figure 4—source data 1
Single cell quality metrics for TEA-seq samples.
- https://cdn.elifesciences.org/articles/63632/elife-63632-fig4-data1-v2.zip
-
Figure 4—source data 2
Cell type labels and UMAP coordinates for TEA-seq samples.
- https://cdn.elifesciences.org/articles/63632/elife-63632-fig4-data2-v2.zip
-
Figure 4—source data 3
Peak to gene and peak to protein link correlations.
- https://cdn.elifesciences.org/articles/63632/elife-63632-fig4-data3-v2.zip
Figure 4—figure supplement 1
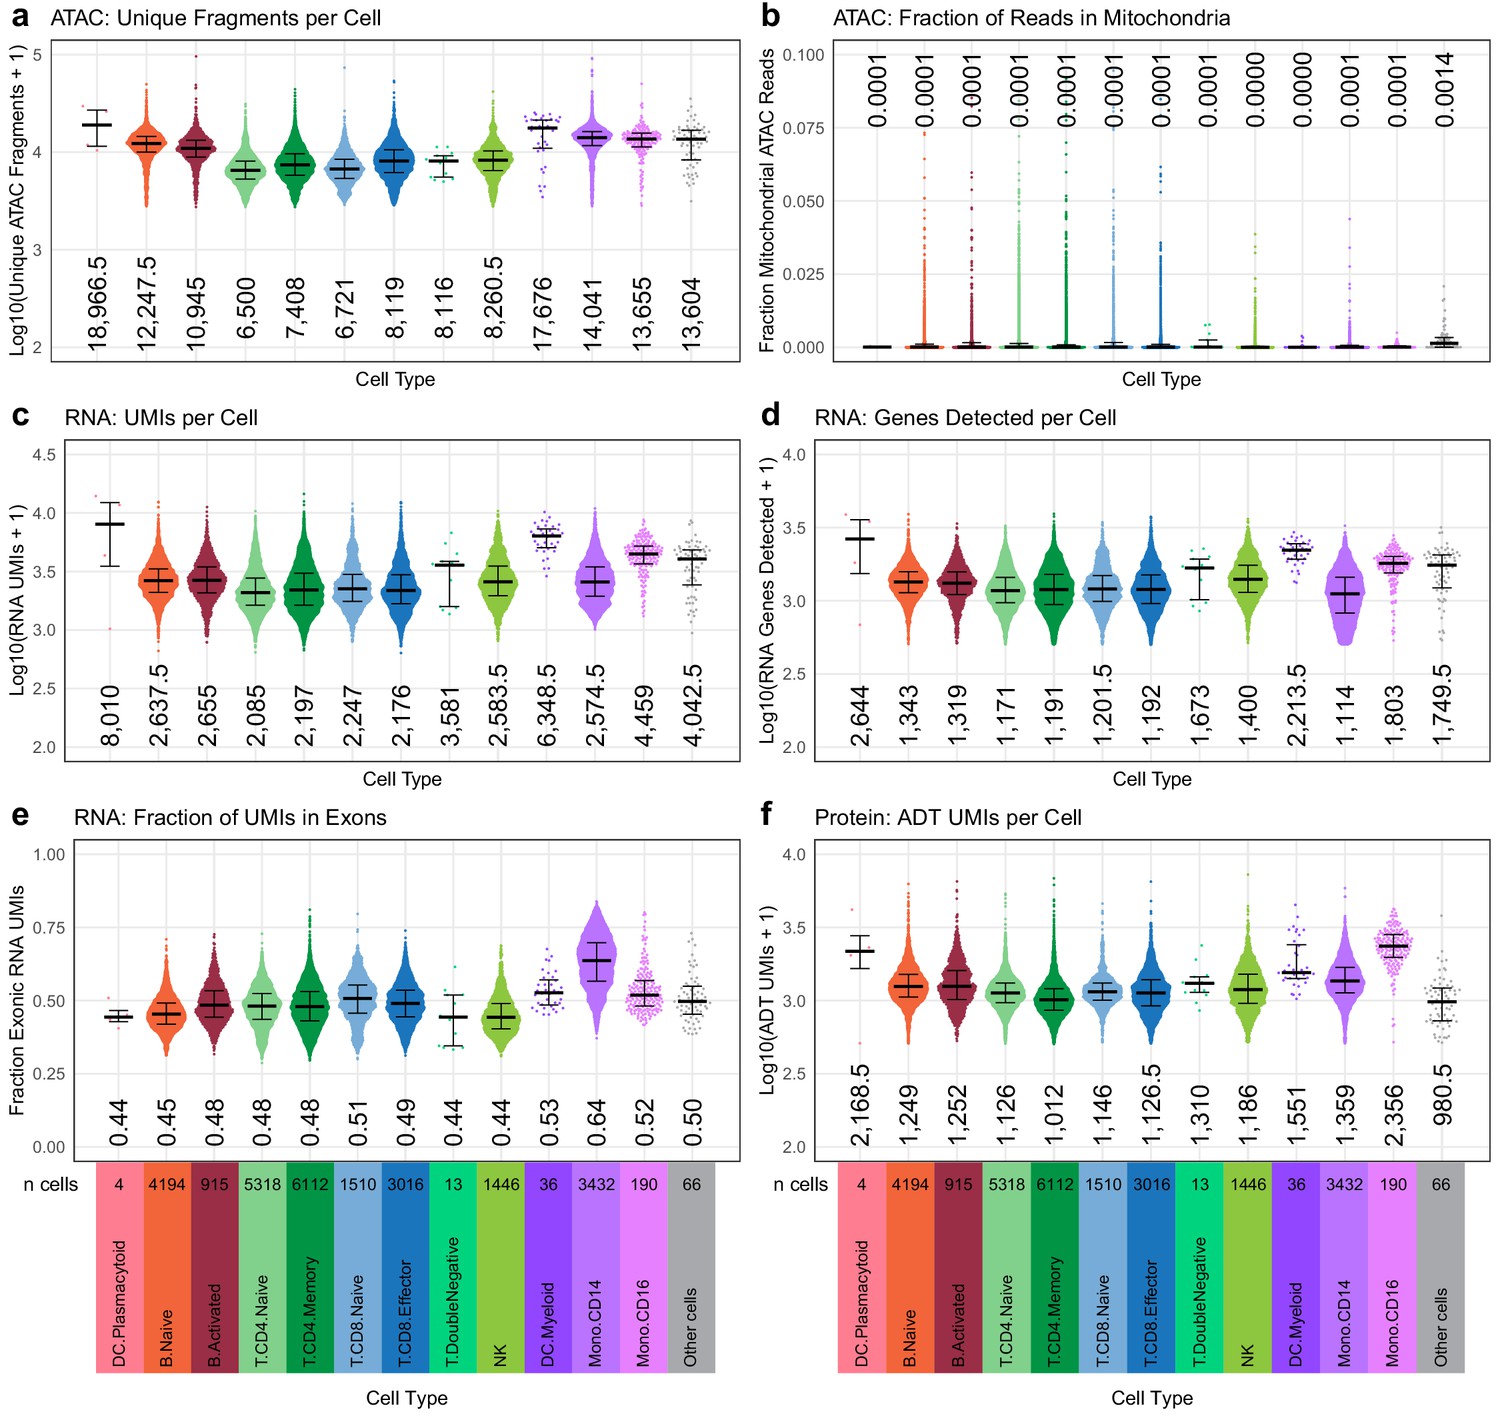
Quasirandom-jittered plots (jittered only on x-axis) showing various QC metrics from transcription, epitopes, and accessibility (TEA-seq) cells that passed all QC criteria (Materials and methods).
In each panel, cells are separated by cell type based on cell-type labels assigned by RNA-seq label transfer (x-axis). Median values per cell type for each metric are printed within the plot region at the x-axis position corresponding to each cell type. Types and number of cells in each category are displayed below the bottom row and apply to all plots in each column. (a) Number of unique assays for transposase-accessible chromatin (ATAC) fragments detected per cell (y-axis, log10 scale). (b) Fraction of raw ATAC fragments that were aligned to mitochondrial regions (y-axis, linear scale, max = 0.1). (c) Number of RNA unique molecule indexes (UMIs) assigned to each cell (y-axis, log10 scale). (d) Number of genes detected by RNA-seq for each cell (y-axis, log10 scale). (e) Fraction of RNA UMIs from exonic regions (y-axis, linear scale). (f) Number of antibody-derived tags UMIs assigned to each cell (y-axis, log10 scale).
Figure 4—figure supplement 2
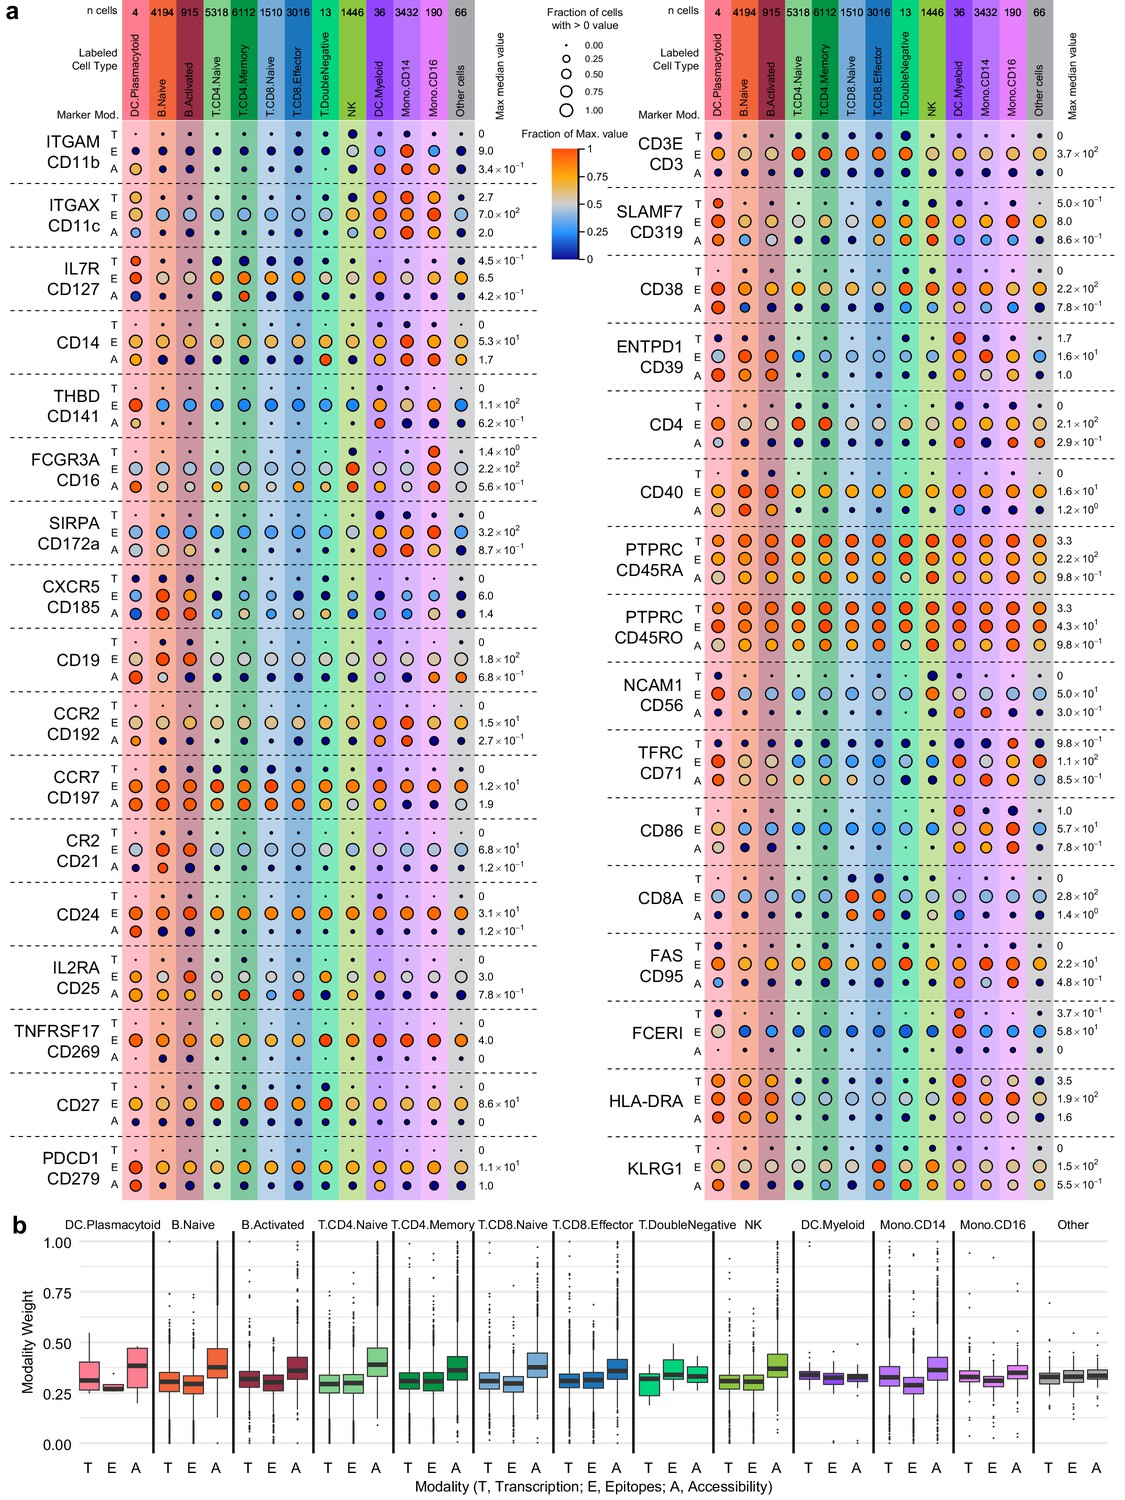
Cell-type marker expression and modality weights.
In each panel, cells are grouped by cell-type labels assigned by RNA-seq label transfer. (a) Detection of 36 protein markers with corresponding single-cell assays for transposase-accessible chromatin (scATAC-seq) GeneScores and RNA unique molecule indexes (UMIs) from transcription, epitopes, and accessibility (TEA-seq) cells. Markers included in the antibody-derived tags set (Supplementary file 6) were filtered to retain only those with both corresponding GeneScores and RNA UMI counts. Each horizontal section of the plot, separated by dashed lines, presents detection for a single marker. When gene symbols differ from the protein marker name, the gene name is shown above the antibody name. Each section is subdivided into rows for each of the three assays (T, transcription; E, epitope detection; A, chromatin accessibility). The size of each point represents the fraction of cells within each cell type (columns) with > 0 detection for each marker within each modality (larger points = greater fraction). The color of each point represents the median of the detected value for each assay, normalized within each row between zero (dark blue) and the maximum value for each feature and modality (provided at the right of each row). Color and size legends between the left and right panels apply to all points. For the comparison to PTPRC/CD45RA and PTPRC/CD45RO, the transcription (T) and accessibility (A) values are repeated. Mod, modality. (b) Weight contributions of each modality to the weighted nearest neighbors graph used to generate the uniform manifold approximation and projection . Boxplots represent the modality weight distribution of individual cells within each cell type; heavy lines mark the median value, box boundaries represent the 25th and 75th quantiles, and whiskers extend to 1.5 times the interquartile range above the box boundaries.
Figure 4—figure supplement 3
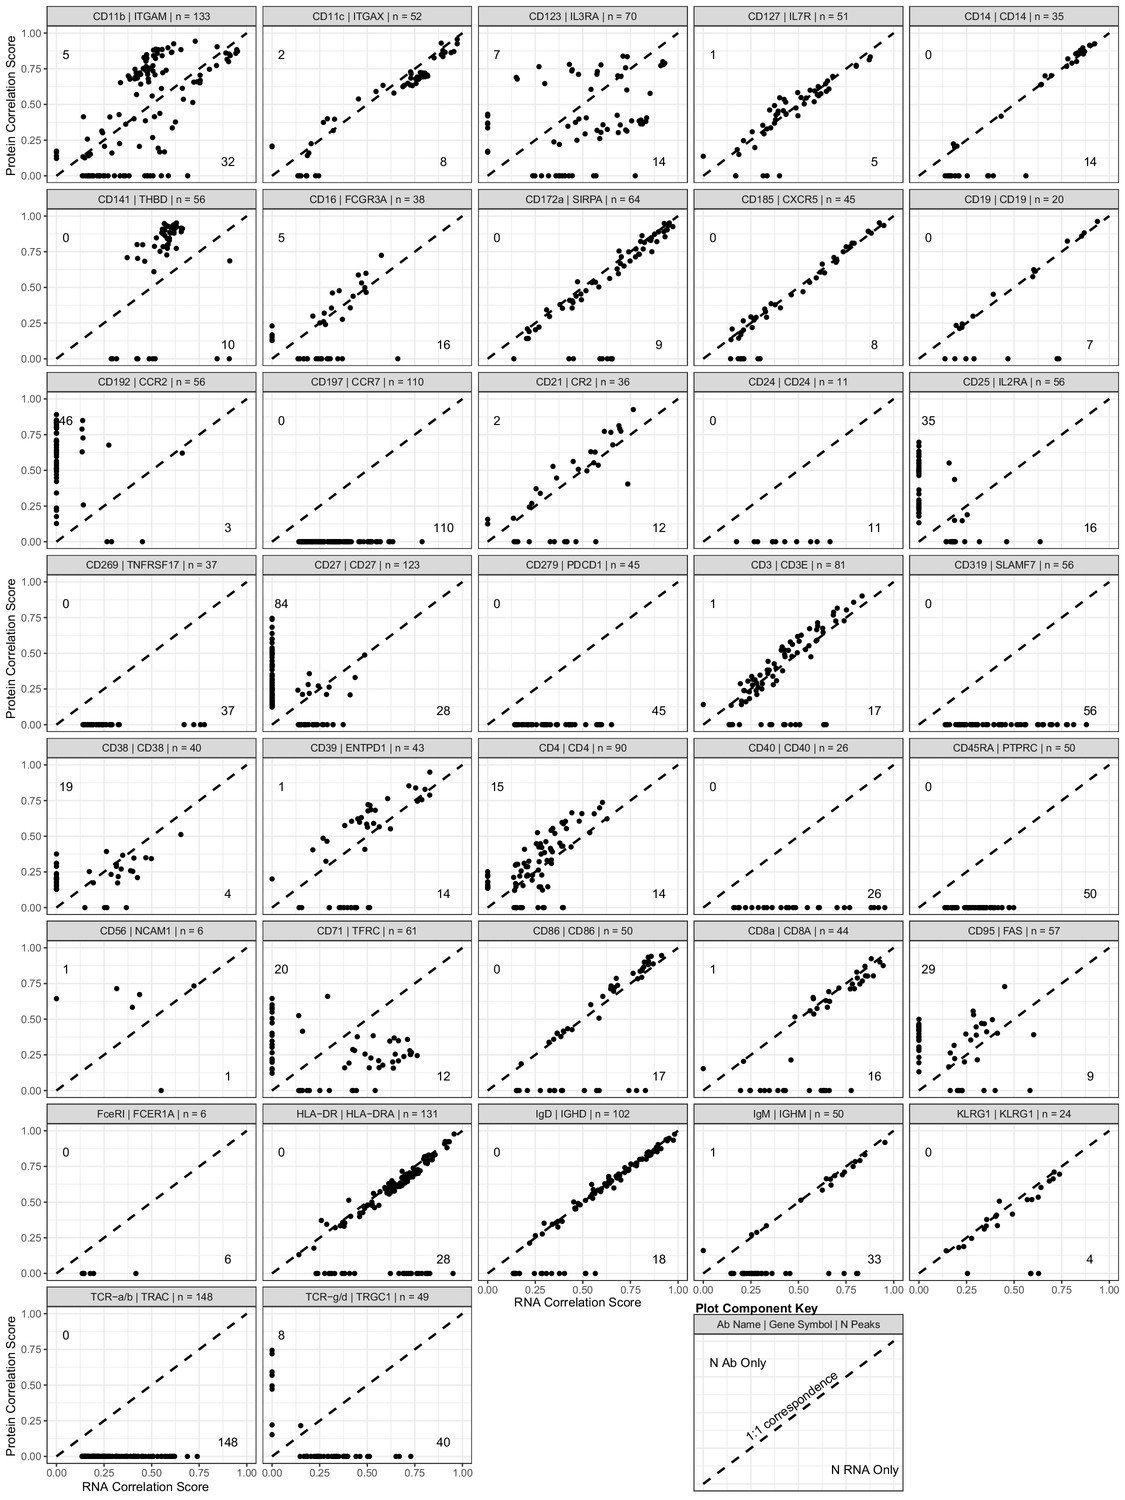
Scatterplot showing the peak-to-RNA correlations (x-axis) and peak-to-protein (y-axis) correlation values for each peak (points) that was found to be correlated with the genes in our antibody-derived tags antibody panel used for transcription, epitopes, and accessibility (TEA-seq) experiments.
The header of each plot shows the antibody and gene names used to profile each target, as well as the total number of peaks found to be linked to either RNA or protein expression. Dashed line shows 1:1 correspondence. Peaks not found to be correlated in each method were assigned a score of 0. The number of peaks found only by protein correlation or RNA correlation is shown near the end of their respective axes (top-left for protein; bottom-right for RNA). See the plot component key at the bottom-right of the figure for a visual guide.
Figure 4—figure supplement 4
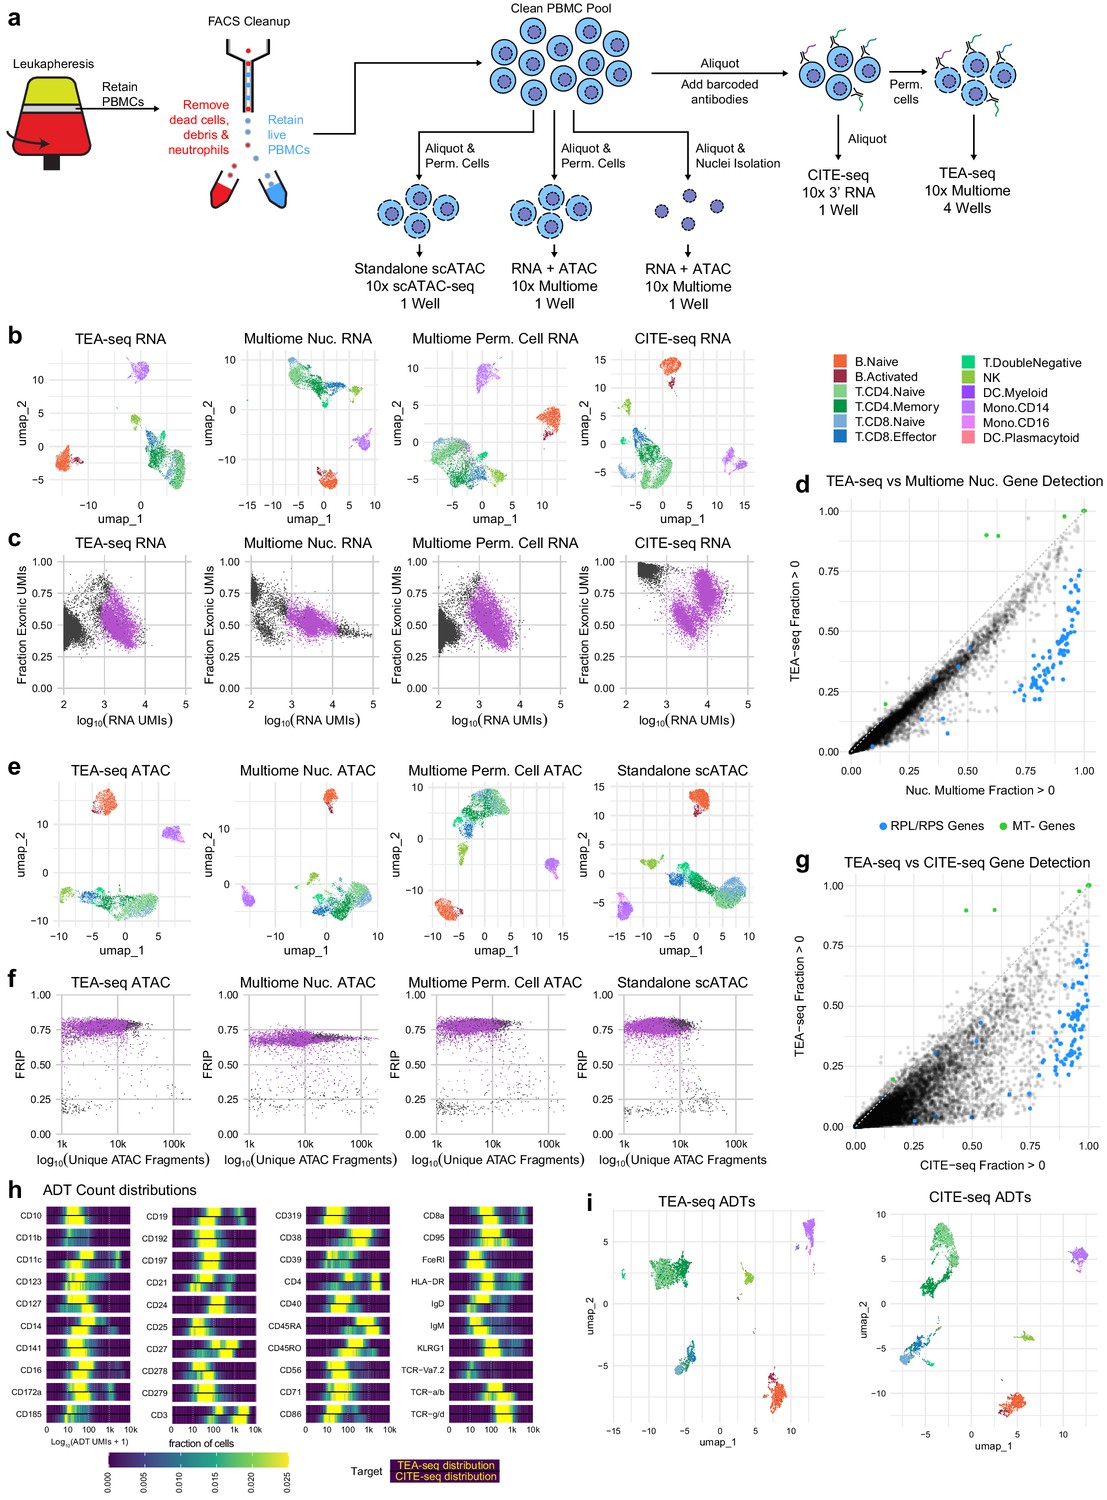
Direct comparisons of TEA-seq, scATAC-seq, CITE-seq, and 10x Multiome.
(a) Experimental workflow diagram for the comparative experiments demonstrating shared cell sources and aliquot branching to highlight the relationships between the datasets. (b) Qualitative assessment of scRNA-seq data from transcription, epitopes, and accessibility (TEA-seq), non-stained 10x Multiomics datasets, and a cellular indexing of transcriptomes and epitopes (CITE-seq) dataset generated using the 10x 3′ RNA-seq kit using whole cells by uniform manifold approximation and projection (UMAP) projection visualization. Each point represents a single cell; points are colored based on cell-type labels generated by RNA-seq label transfer. (c) Comparison of the number of scRNA-seq unique molecule indexes to the fraction of scRNA-seq reads derived from exons for each experiment in (b). Barcodes passing QC are highlighted in purple. (d) Pairwise comparison of gene detection frequencies in purified nuclei used for 10x Multiome analysis (x-axis) and TEA-seq (y-axis). Each point represents a single gene. Blue points highlight ribosomal protein genes (RPL/S); green points highlight mitochondrial genes (MT-). Black points are all other genes. (e) Qualitative assessment of scATAC-seq data from TEA-seq, non-stained 10x Multiomics datasets, and standalone 10x Genomics scATAC-seq by UMAP projection visualization. Each point represents a single cell; points are colored based on cell-type labels generated by ATAC-seq GeneScore label transfer compared to a RNA-seq reference. (f) scATAC-seq QC scatterplot comparing unique scATAC-seq fragments and fraction of reads in peaks scores per cell barcode for each experiment in (e). Barcodes passing QC are highlighted in purple. (g) Pairwise comparison of gene detection frequencies in purified nuclei used for CITE-seq (x-axis) and TEA-seq (y-axis), as in (d). (h) Heatmaps of log10-transformed antibody-derived tags (ADT) count distributions. In the panel for each target, we show the fraction of cells falling into each of 400 bins between 1 and 10,000 (0 and 4 on a log scale). The color scale at the bottom of the plots is used for all targets. Within each target panel, the top distribution is that obtained from TEA-seq, and the bottom from CITE-seq based on equally downsampled datasets, as described in Materials and methods. (i) Qualitative assessment of ADT data from TEA-seq and CITE-seq by UMAP projection visualization. Each point represents a single cell; points are colored based on cell-type labels generated by RNA-seq label transfer.
Tables
Table 1
QC metrics summary for experiments displayed in Figure 1.
| Source type | FACS depletion | N pass QC | Median N fragments | Median mitochondrial reads | Median unique | Median in TSS | Median in peaks |
|---|---|---|---|---|---|---|---|
| Nuclei | Unsorted | 4719 | 7344 | 43 | 0.6% | 5247 | 71.6% | 1332 | 24.9% | 2306 | 43.9% |
| Nuclei | Dead/debris | 5526 | 10,526 | 59 | 0.6% | 7284 | 69.4% | 2186.5 | 30.1% | 3647 | 50.5% |
| Nuclei | Dead/debris/neutrophils | 7769 | 19,972 | 136 | 0.9% | 11,528 | 59.1% | 4846 | 41.5% | 7503 | 64.8% |
| Permeabilized cells | Unsorted | 6329 | 5541 | 100 | 1.9% | 3308 | 59.8% | 871 | 26.4% | 1390 | 42.2% |
| Dead/debris | 6956 | 6733.5 | 120 | 2.0% | 3795.5 | 56.8% | 1219.5 | 32.6% | 1874 | 50.2% | |
| Dead/debris/neutrophils | 9849 | 14,069 | 514 | 4.0% | 4756 | 34.3% | 2536 | 54.4% | 3650 | 76.8% | |
| For all metrics to the right of median N fragments, both the absolute number and a percentage are provided. Median % mitochondrial and median % unique were calculated as a fraction of total fragments; % in TSS and % in peaks were calculated as a fraction of unique fragments. TSS: transcription start sites; FACS: fluorescence-activated cell sorting. | |||||||
Key resources table
| Reagent type (species) or resource | Designation | Source or reference | Identifiers | Additional information |
|---|---|---|---|---|
| Biological sample (Homo sapiens) | Primary peripheral blood mononuclear cells | BioIVT, Westbury, NY, USA | SERATRIALS-18002; sample BRH1291132 | WIRB protocol # 20190318; Ficoll-purified |
| Biological sample (Homo sapiens) | Primary peripheral blood mononuclear cells | BioIVT, Westbury, NY, USA | SERATRIALS-18002; sample HMN85396 | WIRB protocol # 20190318; leukapheresis-purified |
| Biological sample (Homo sapiens) | Primary peripheral blood mononuclear cells | BioIVT, Westbury, NY, USA | SERATRIALS-18002; sample RG1131 | WIRB protocol # 20190318; Ficoll-purified |
| Biological sample (Homo sapiens) | Primary peripheral nlood mononuclear cells | Bloodworks NW, Seattle, WA, USA | BT001; sample 5716BW | WIRB protocol # 20141589; Ficoll-purified |
| Biological sample (Homo sapiens) | Primary peripheral blood mononuclear cells | Bloodworks NW, Seattle, WA, USA | BT001; sample 7811BW | WIRB protocol # 20141589; Ficoll-purified |
| Antibody | Biotin anti-human CD15 (SSEA-1) antibody (mouse monoclonal) | BioLegend | Cat# 301913, RRID:AB_2561325 | (0.15 µL per million cells) |
| Antibody | BUV395 anti-human CD14 antibody (mouse monoclonal) | BD Biosciences | Cat# 563561, RRID:AB_2744288 | (1 µL per million cells) |
| Antibody | BUV496 mouse anti-human CD45 antibody (mouse monoclonal) | BD Biosciences | Cat# 750179, RRID:AB_2868405 | (1 µL per million cells) |
| Antibody | BUV563 mouse anti-human CD15 antibody (mouse monoclonal) | BD Biosciences | Cat# 741417, RRID:AB_2868406 | (1 µL per million cells) |
| Antibody | BUV615 mouse anti-human CD56 antibody (mouse monoclonal) | BD Biosciences | Cat# 613001, RRID:AB_2868413 | (2 µL per million cells) |
| Antibody | Brilliant Violet 650 anti-human CD3 antibody (mouse monoclonal) | BioLegend | Cat# 300468, RRID:AB_2629574 | (2 µL per million cells) |
| Antibody | Mouse anti-human CD19 High Parameter Custom Antibody BB790-P Conjugate (mouse monoclonal) | BD Biosciences | Cat# 624296 | Custom reagent; conjugate of mouse anti-human CD19 (clone HIB19) and BB790-P (1 µL per million cells) |
| Antibody | PE/Cy5 anti-human CD16 antibody (mouse monoclonal) | BioLegend | Cat# 302009, RRID:AB_314209 | (1 µL per million cells) |
| Antibody | BUV395 mouse anti-human CD3 antibody (mouse monoclonal) | BD Biosciences | Cat# 563546, RRID:AB_2744387 | Custom reagent; conjugate of mouse anti-human CD3 (clone UCHT1) and BUV395 (1:50 in 100 µL volume) |
| Antibody | Mouse anti-human CD45RA High Parameter Custom Antibody BUV615-P Conjugate (mouse monoclonal) | BD Biosciences | Cat# 624297 | Custom reagent; conjugate of mouse anti-human CD45RA (clone HI100) and BUV615-P (1:5 in 100 µL volume) |
| Antibody | BUV661 mouse anti-human CD14 antibody (mouse monoclonal) | BD Biosciences | Cat# 741684, RRID:AB_2868407 | (1:50 in 100 µL volume) |
| Antibody | BUV737 mouse anti-human CD8 antibody (mouse monoclonal) | BD Biosciences | Cat# 749367, RRID:AB_2868408 | (1:5 in 100 µL volume) |
| Antibody | BUV805 mouse anti-human CD11c antibody (mouse monoclonal) | BD Biosciences | Cat# 742005, RRID:AB_2868409 | (1:33 in 100 µL volume) |
| Antibody | BV421 mouse anti-human CD25 antibody (mouse monoclonal) | BD Biosciences | Cat# 562442, RRID:AB_11154578 | (1:50 in 100 µL volume) |
| Antibody | BV480 mouse anti-human CD4 (mouse monoclonal) | BD Biosciences | Cat# 566104, RRID:AB_2739506 | (1:5 in 100 µL volume) |
| Antibody | BV605 mouse anti-Human CD16 (FcγRIII) antibody (mouse monoclonal) | BD Biosciences | Cat# 563172, RRID:AB_2744297 | (1:50 in 100 µL volume) |
| Antibody | Brilliant Violet 650 anti-human CD123 antibody (mouse monoclonal) | BioLegend | Cat# 306020, RRID:AB_2563827 | (1:50 in 100 µL volume) |
| Antibody | Brilliant Violet 711 anti-human CD127 (IL-7Rα) antibody (mouse monoclonal) | BioLegend | Cat# 351328, RRID:AB_2562908 | (1:50 in 100 µL volume) |
| Antibody | BV750 mouse anti-human IgD antibody (mouse monoclonal) | BD Biosciences | Cat# 747484, RRID:AB_2868411 | (1:20 in 100 µL volume) |
| Antibody | BV786 mouse anti-human neuropilin-1 (CD304) antibody (mouse monoclonal) | BD Biosciences | Cat# 743132, RRID:AB_2741299 | (1:50 in 100 µL volume) |
| Antibody | BB515 mouse anti-human CD141 antibody (mouse monoclonal) | BD Biosciences | Cat# 565084, RRID:AB_2739058 | (1:33 in 100 µL volume) |
| Antibody | CD11b monoclonal antibody, PerCP-Cy5.5 conjugated (rat monoclonal) | BD Biosciences | Cat# 561114, RRID:AB_2033995 | (1:5 in 100 µL volume) |
| Antibody | PE anti-human CD27 antibody (mouse monoclonal) | BioLegend | Cat# 302808, RRID:AB_314300 | (1:20 in 100 µL volume) |
| Antibody | PE/Dazzle 594 anti-human TCRα/βantibody (mouse monoclonal) | BioLegend | Cat# 306726, RRID:AB_2566599 | (1:33 in 100 µL volume) |
| Antibody | Mouse anti-CD34 monoclonal antibody, PE-Cy5 conjugated (mouse monoclonal) | BD Biosciences | Cat# 555823, RRID:AB_396152 | (1:20 in 100 µL volume) |
| Antibody | PE/Cy7 anti-human CD197 (CCR7) antibody (mouse monoclonal) | BioLegend | Cat# 353226, RRID:AB_11126145 | (1:33 in 100 µL volume) |
| Antibody | APC anti-human CD38 antibody (mouse monoclonal) | BioLegend | Cat# 356606, RRID:AB_2561902 | (1:20 in 100 µL volume) |
| Antibody | APC-R700 mouse anti-human CD56 (NCAM-1) antibody (mouse monoclonal) | BD Biosciences | Cat# 565139, RRID:AB_2744429 | (1:20 in 100 µL volume) |
| Antibody | APC/Cyanine7 anti-human HLA-DR antibody (mouse monoclonal) | BioLegend | Cat# 307618, RRID:AB_493586 | (1:20 in 100 µL volume) |
| Antibody | TotalSeq-A0062 anti-human CD10 antibody (mouse monoclonal) | BioLegend | Cat# 312231, RRID:AB_2734286 | (0.5 µg per million cells) |
| Antibody | TotalSeq-A0161 anti-human CD11b antibody (mouse monoclonal) | BioLegend | Cat# 301353, RRID:AB_2734249 | (0.05 µg per million cells) |
| Antibody | TotalSeq-A0053 anti-human CD11c antibody (mouse monoclonal) | BioLegend | Cat# 371519, RRID:AB_2749971 | (0.025 µg per million cells) |
| Antibody | TotalSeq-A0064 anti-human CD123 antibody (mouse monoclonal) | BioLegend | Cat# 306037, RRID:AB_2749977 | (0.1 µg per million cells) |
| Antibody | TotalSeq-A0390 anti-human CD127 (IL-7Rα) antibody (mouse monoclonal) | BioLegend | Cat# 351352, RRID:AB_2734366 | (0.025 µg per million cells) |
| Antibody | TotalSeq-A0081 anti-human CD14 antibody (mouse monoclonal) | BioLegend | Cat# 301855, RRID:AB_2734254 | (0.2 µg per million cells) |
| Antibody | TotalSeq-A0163 anti-human CD141 (thrombomodulin) antibody (mouse monoclonal) | BioLegend | Cat# 344121, RRID:AB_2783229 | (0.1 µg per million cells) |
| Antibody | TotalSeq-A0083 anti-human CD16 antibody (mouse monoclonal) | BioLegend | Cat# 302061, RRID:AB_2734255 | (0.05 µg per million cells) |
| Antibody | TotalSeq-A0408 anti-human CD172a (SIRPα) antibody (mouse monoclonal) | BioLegend | Cat# 372109, RRID:AB_2783285 | (0.25 µg per million cells) |
| Antibody | TotalSeq-A0144 anti-human CD185 (CXCR5) antibody (mouse monoclonal) | BioLegend | Cat# 356937, RRID:AB_2750356 | (0.125 µg per million cells) |
| Antibody | TotalSeq-A0050 anti-human CD19 antibody (mouse monoclonal) | BioLegend | Cat# 302259, RRID:AB_2734256 | (0.2 µg per million cells) |
| Antibody | TotalSeq-A0242 anti-human CD192 (CCR2) antibody (mouse monoclonal) | BioLegend | Cat# 357229, RRID:AB_2750501 | (0.5 µg per million cells) |
| Antibody | TotalSeq-A0148 anti-human CD197 (CCR7) antibody (mouse monoclonal) | BioLegend | Cat# 353247, RRID:AB_2750357 | (0.5 µg per million cells) |
| Antibody | TotalSeq-A0181 anti-human CD21 antibody (mouse monoclonal) | BioLegend | Cat# 354915, RRID:AB_2750006 | (0.05 µg per million cells) |
| Antibody | TotalSeq-A0180 anti-human CD24 antibody (mouse monoclonal) | BioLegend | Cat# 311137, RRID:AB_2750374 | (0.5 µg per million cells) |
| Antibody | TotalSeq-A0085 anti-human CD25 antibody (mouse monoclonal) | BioLegend | Cat# 302643, RRID:AB_2734258 | (0.08 µg per million cells) |
| Antibody | TotalSeq-A0056 anti-human CD269 (BCMA) antibody (mouse monoclonal) | BioLegend | Cat# 357521, RRID:AB_2749974 | (0.5 µg per million cells) |
| Antibody | TotalSeq-A0191 anti-mouse/rat/human CD27 antibody (Armenian hamster monoclonal) | BioLegend | Cat# 124235, RRID:AB_2750344 | (0.125 µg per million cells) |
| Antibody | TotalSeq-A0171 anti-human/mouse/rat CD278 (ICOS) antibody (Armenian hamster monoclonal) | BioLegend | Cat# 313555, RRID:AB_2800824 | (0.01 µg per million cells) |
| Antibody | TotalSeq-A0088 anti-human CD279 (PD-1) antibody (mouse monoclonal) | BioLegend | Cat# 329955, RRID:AB_2734322 | (0.1 µg per million cells) |
| Antibody | TotalSeq-A0034 anti-human CD3 antibody (mouse monoclonal) | BioLegend | Cat# 300475, RRID:AB_2734246 | (0.05 µg per million cells) |
| Antibody | TotalSeq-A0406 anti-human CD304 (neuropilin-1) antibody | BioLegend | Cat# 354525, RRID:AB_2783261 | (0.1 µg per million cells) |
| Antibody | TotalSeq-A0830 anti-human CD319 (CRACC) antibody (mouse monoclonal) | BioLegend | Cat# 331821, RRID:AB_2800872 | (0.5 µg per million cells) |
| Antibody | TotalSeq-A0410 anti-human CD38 antibody (mouse monoclonal) | BioLegend | Cat# 356635, RRID:AB_2800967 | (0.05 µg per million cells) |
| Antibody | TotalSeq-A0176 anti-human CD39 antibody (mouse monoclonal) | BioLegend | Cat# 328233, RRID:AB_2750005 | (0.05 µg per million cells) |
| Antibody | TotalSeq-A0072 anti-human CD4 antibody (mouse monoclonal) | BioLegend | Cat# 300563, RRID:AB_2734247 | (0.1 µg per million cells) |
| Antibody | TotalSeq-A0031 anti-human CD40 antibody (mouse monoclonal) | BioLegend | Cat# 334346, RRID:AB_2749968 | (0.25 µg per million cells) |
| Antibody | TotalSeq-A0063 anti-human CD45RA antibody (mouse monoclonal) | BioLegend | Cat# 304157, RRID:AB_2734267 | (0.0625 µg per million cells) |
| Antibody | TotalSeq-A0087 anti-human CD45RO antibody (mouse monoclonal) | BioLegend | Cat# 304255, RRID:AB_2734268 | (0.1 µg per million cells) |
| Antibody | TotalSeq-A0047 anti-human CD56 (NCAM) antibody (mouse monoclonal) | BioLegend | Cat# 362557, RRID:AB_2749970 | (0.15 µg per million cells) |
| Antibody | TotalSeq-A0166 anti-human CD66b antibody (mouse monoclonal) | BioLegend | Cat# 392905, RRID:AB_2750372 | (0.25 µg per million cells) |
| Antibody | TotalSeq-A0394 anti-human CD71 antibody (mouse monoclonal) | BioLegend | Cat# 334123, RRID:AB_2800884 | (0.025 µg per million cells) |
| Antibody | TotalSeq-A0005 anti-human CD80 antibody (mouse monoclonal) | BioLegend | Cat# 305239, RRID:AB_2749958 | (0.5 µg per million cells) |
| Antibody | TotalSeq-A0006 anti-human CD86 antibody (mouse monoclonal) | BioLegend | Cat# 305443, RRID:AB_2734273 | (0.05 µg per million cells) |
| Antibody | TotalSeq-A0080 anti-human CD8a antibody (mouse monoclonal) | BioLegend | Cat# 301067, RRID:AB_2734248 | (0.2 µg per million cells) |
| Antibody | TotalSeq-A0156 anti-human CD95 (Fas) antibody (mouse monoclonal) | BioLegend | Cat# 305649, RRID:AB_2750368 | (0.1 µg per million cells) |
| Antibody | TotalSeq-A0352 anti-human FcεRIα antibody (mouse monoclonal) | BioLegend | Cat# 334641, RRID:AB_2750503 | (0.5 µg per million cells) |
| Antibody | TotalSeq-A0159 anti-human HLA-DR antibody (mouse monoclonal) | BioLegend | Cat# 307659, RRID:AB_2750001 | (0.25 µg per million cells) |
| Antibody | TotalSeq-A0384 anti-human IgD antibody (mouse monoclonal) | BioLegend | Cat# 348243, RRID:AB_2783238 | (0.05 µg per million cells) |
| Antibody | TotalSeq-A0090 Mouse IgG1, κ isotype Ctrl antibody (mouse monoclonal) | BioLegend | Cat# 400199, RRID:AB_2868412 | (0.5 µg per million cells) |
| Antibody | TotalSeq-A0136 anti-human IgM antibody (mouse monoclonal) | BioLegend | Cat# 314541, RRID:AB_2749992 | (0.05 µg per million cells) |
| Antibody | TotalSeq-A0153 anti-human KLRG1 (MAFA) antibody (mouse monoclonal) | BioLegend | Cat# 367721, RRID:AB_2750373 | (0.25 µg per million cells) |
| Antibody | TotalSeq-A0584 anti-human TCR Vα24-Jα18 (iNKT cell) antibody (mouse monoclonal) | BioLegend | Cat# 342923, RRID:AB_2783227 | (0.5 µg per million cells) |
| Antibody | TotalSeq-A0581 anti-human TCR Vα7.2 antibody (mouse monoclonal) | BioLegend | Cat# 351733, RRID:AB_2783246 | (0.05 µg per million cells) |
| Antibody | TotalSeq-A0224 anti-human TCR α/β antibody (mouse monoclonal) | BioLegend | Cat# 306737, RRID:AB_2783167 | (0.125 µg per million cells) |
| Antibody | TotalSeq-A0139 anti-human TCR γ/δ antibody (mouse monoclonal) | BioLegend | Cat# 331229, RRID:AB_2734325 | (0.5 µg per million cells) |
| Sequence-based reagent | MOSAIC_Bot | Integrated DNA Technologies | Tn5 complex oligo | 5'-/5phos/CTGTCTCTTATACACATCT-'3; standard desalting |
| Sequence-based reagent | Tn5ME-s7_Top | Integrated DNA Technologies | Tn5 complex oligo | 5'-GTCTCGTGGGCTCGGAGA TGTGTATAAGAGACAG-3'; standard desalting |
| Sequence-based reagent | Poly-A Top-L | Integrated DNA Technologies | Tn5 complex oligo | 5'-TTTTTTTTTTTTTTT TTTTTTTTTTTTTTT VNAGATGTGTATAAGAGACAG -3'; standard desalting |
| Sequence-based reagent | SI-P5-22 | Integrated DNA Technologies | PCR primer | 5'-AATGATACGGCGACCACCG AGATCTACACTCTTTCCCTACAC GACGCTCTTCCGATCT-3'; standard desalting |
| Sequence-based reagent | F BC primer | Integrated DNA Technologies | PCR primer | 5'-CTACACGACGCT CTTCCGATCT-3'; standard desalting |
| Sequence-based reagent | ADT-Rev-AMP | Integrated DNA Technologies | PCR primer | 5'-CCTTGGCACCCGAGAATTCC-3'; standard desalting |
| Sequence-based reagent | TruSeq R1 Seq primer | Integrated DNA Technologies | PCR primer | 5'-ACACTCTTTCCCTACACG ACGCTCTTCCGATCT-3'; standard desalting |
| Sequence-based reagent | ADT-i7 primer | Integrated DNA Technologies | PCR primer | 5'-CAAGCAGAAGACGGCA TACGAGATNNNNNNNN GTGACTGGAGTTCCT TGGCACCCGAGAATTCC*A-3'; PAGE purification; * = phosphorothioate bond; N’s indicate barcode position |
| Sequence-based reagent | SI-PCR-Oligo | Integrated DNA Technologies | PCR primer | 5'-AATGATACGGCGACCA CCGAGATCTACACTCTT TCCCTACACGACGCTC-3'; standard desalting |
| Peptide, recombinant protein | Tn5 transposase | Beta Lifescience | TN5-BL01 | |
| Commercial assay or kit | Chromium Next GEM Single Cell 3' GEM, Library & Gel Bead Kit v3.1 | 10x Genomics | 1000121 | |
| Commercial assay or kit | Next GEM Chip G Single Cell Kit | 10x Genomics | 1000120 | |
| Commercial assay or kit | Single Index Kit T Set A | 10x Genomics | 1000213 | |
| Commercial assay or kit | Chromium Next GEM Single Cell ATAC Library & Gel Bead Kit v1.1 | 10x Genomics | 1000175 | |
| Commercial kit or assay | Next GEM Chip H Single Cell Kit | 10x Genomics | 1000161 | |
| Commercial kit or assay | Single Index Kit N Set A | 10x Genomics | 1000212 | |
| Commercial kit or assay | Chromium Next GEM Single Cell Multiome ATAC + Gene Expression Reagent Bundle | 10x Genomics | 1000283 | |
| Commercial kit or assay | Next GEM Chip J Single Kit | 10x Genomics | 1000234 | |
| Commercial kit or assay | Dual Index Kit TT Set A | 10x Genomics | 1000215 | |
| Commercial kit or assay | Quant-iT PicoGreen dsDNA Assay Kit | Thermo Fisher Scientific | P7589 | |
| Commercial kit or assay | Library Quantification Kit, Illumina Platform | KAPA Biosystems | KK4844 | |
| Commercial kit or assay | Bioanalyzer high-sensitivity DNA analysis | Agilent Technologies | 5067-4626 | |
| Software, algorithm | R | The R Foundation | RRID:SCR_001905 | v3.6.3 and >4.0.2 |
| Software, algorithm | ArchR | Jeffrey Granja and Ryan Corces | v1.0.1 | |
| Software, algorithm | BarCounter | Elliott Swanson; this study | ||
| Software, algorithm | cellranger | 10x Genomics | v5.0.0 | |
| Software, algorithm | cellranger-atac | 10x Genomics | v1.1.0 and v1.2.0 | |
| Software, algorithm | cellranger-arc | 10x Genomics | v1.0.0 | |
| Software, algorithm | Seurat | Paul Hoffman, Satija Lab, and Collaborators | RRID:SCR_016341 | v4.0-beta |
| Software, algorithm | FlowJo | BD | v10.7 | |
| Other | Digitonin | MP Biomedicals | 0215948082 | |
| Other | Human TruStain FcX | BioLegend | 422302 | |
| Other | ViaStain acridine orange/propidium iodide solution | Nexcelom Bioscience | CS2-0106-25mL | |
| Other | Dynabeads MyOne SILANE | Thermo Fisher Scientific | 37002D | |
| Other | Fixable Viability Stain 510 | BD Biosciences | 564406 | |
| Other | IGEPAL-CA630 | Sigma | I8896 | CAS 9002-93-1 |
| Other | SPRIselect | Beckman Coulter | B23319 | |
| Other | NEBNext Ultra II Q5 Master Mix | New England Biolabs | M0544 | |
| Other | KAPA HiFi HotStart ReadyMix | KAPA Biosystems | KM2602 | |
| Other | Protector RNase Inhibitor | Sigma-Aldrich | 03335399001 | |
| Other | Fixable Viability Stain 510 | BD Biosciences | Cat# 564406, RRID:AB_2869572 |
Additional files
-
Supplementary file 1
Antibody-fluorophore conjugates used to characterize peripheral blood mononuclear cell cell-type abundance by flow cytometry before and after anti-CD15 bead-based neutrophil depletion.
- https://cdn.elifesciences.org/articles/63632/elife-63632-supp1-v2.xlsx
-
Supplementary file 2
Quantification of major cell populations by flow cytometry before (pre-depletion) and after (post-depletion) anti-CD15 bead-based neutrophil depletion of either Ficoll-purified or leukapheresis-purified peripheral blood mononuclear cells.
The gating strategy used to assess these populations is presented in Figure 1—figure supplement 4.
- https://cdn.elifesciences.org/articles/63632/elife-63632-supp2-v2.xlsx
-
Supplementary file 3
Antibody-fluorophore conjugates used to assess peripheral blood mononuclear cell cell-type populations for evaluation of cell-type labeling.
- https://cdn.elifesciences.org/articles/63632/elife-63632-supp3-v2.xlsx
-
Supplementary file 4
Quantification of peripheral blood mononuclear cell cell-type populations using the antibody panel provided in Supplementary file 3.
The gating strategy used to assess these populations is presented in Figure 2—figure supplement 1. Type labels and proportions used for comparisons of scATAC-seq cell-type labeling in Figure 2d are provided in the last two columns. When two gated populations are combined to tabulate a single cell type, the same cell-type label is listed beside each gate. Cell-type proportions are listed only at the first instance of each cell type.
- https://cdn.elifesciences.org/articles/63632/elife-63632-supp4-v2.xlsx
-
Supplementary file 5
Custom oligonucleotide sequences used to generate ICICLE-seq libraries.
- https://cdn.elifesciences.org/articles/63632/elife-63632-supp5-v2.xlsx
-
Supplementary file 6
Antibody-oligo conjugates (BioLegend TotalSeq-A) used for ICICLE-seq and TEA-seq experiments to label peripheral blood mononuclear cell cell types.
- https://cdn.elifesciences.org/articles/63632/elife-63632-supp6-v2.xlsx
-
Supplementary file 7
Sources and presentation of human biological specimens utilized in this study.
- https://cdn.elifesciences.org/articles/63632/elife-63632-supp7-v2.xlsx
-
Transparent reporting form
- https://cdn.elifesciences.org/articles/63632/elife-63632-transrepform-v2.docx
Download links
A two-part list of links to download the article, or parts of the article, in various formats.
Downloads (link to download the article as PDF)
Open citations (links to open the citations from this article in various online reference manager services)
Cite this article (links to download the citations from this article in formats compatible with various reference manager tools)
Simultaneous trimodal single-cell measurement of transcripts, epitopes, and chromatin accessibility using TEA-seq
eLife 10:e63632.
https://doi.org/10.7554/eLife.63632


