Stem cell transplantation rescued a primary open-angle glaucoma mouse model
- Department of Ophthalmology, University of Pittsburgh, United States
- Eye Center of Xiangya Hospital, Central South University, China
- Hunan Key Laboratory of Ophthalmology, China
- Research Institute of Ophthalmology, Egypt
- Department of Developmental Biology, University of Pittsburgh, United States
- McGowan Institute for Regenerative Medicine, University of Pittsburgh, United States
Figures
Figure 1 with 2 supplements
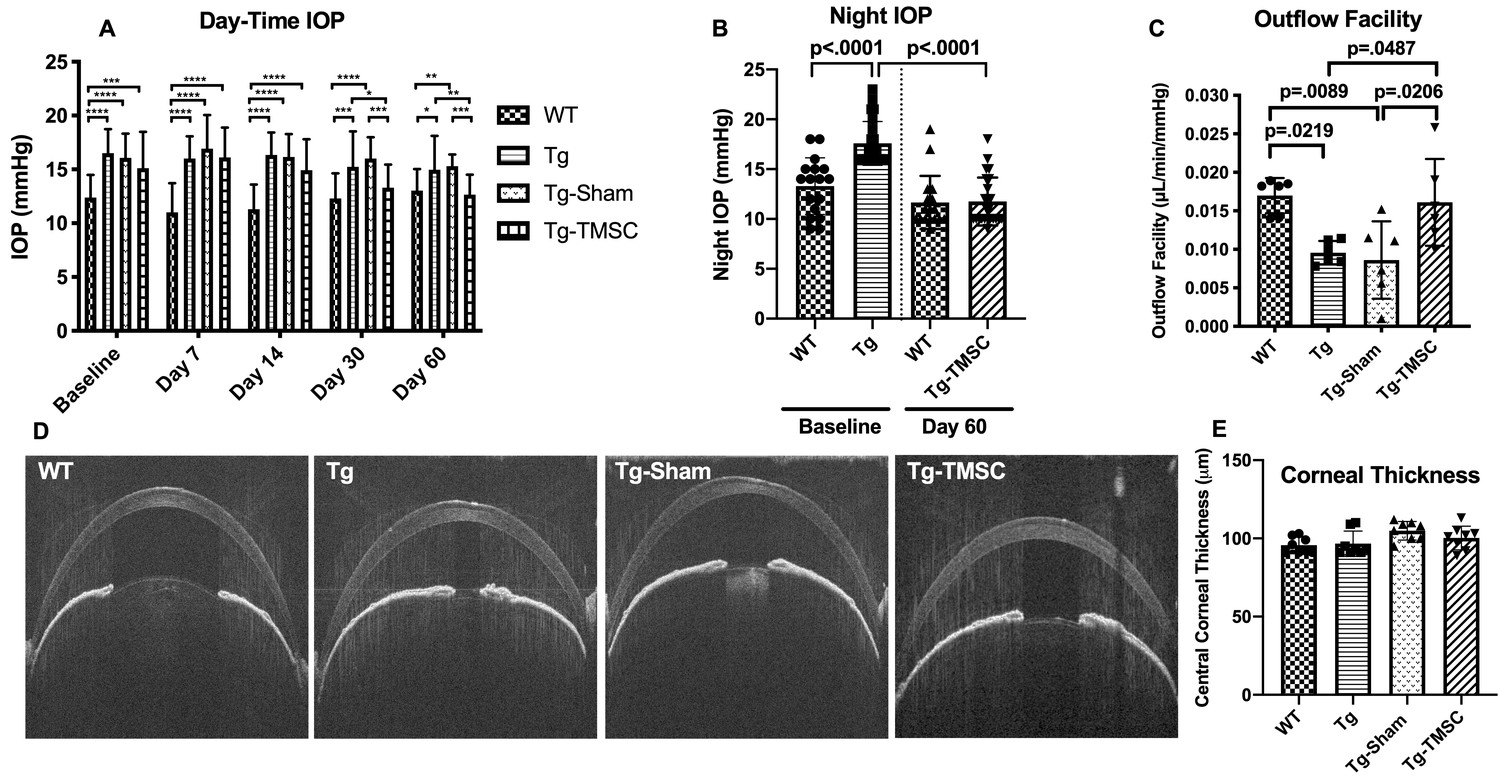
Transplanted TMSCs reduce the IOP and increase the outflow facility of Tg-MyocY437H mice.
(A) Day-time IOP was measured in the wildtype mice (WT, n=26), Tg-MyocY437H mice (Tg, n=26), Tg mice treated with basal medium (Tg-Sham, n=26) and Tg mice with TMSC transplantation (Tg-TMSC, n=26). (B) Night IOP was measured in WT mice (n=17) and Tg-MyocY437H mice (n=24) before the treatment and 2 months post treatment. Data are presented as mean ± SD. (C) Outflow facility was evaluated at 2-month after TMSC transplantation (n=6 eyes/group). (D) Representative pictures of anterior OCT show the corneal thickness and anterior chamber angle in the mice at 2 months after transplantation. (E) The central corneal thickness was calculated from the OCT images (n=8 eyes/group). Data are presented as mean ± SD. Two-way ANOVA (A) or one-way ANOVA (B,C,E) followed by Tukey’s multiple comparisons test. *p<0.05, **p<0.01, ***p<0.001, **** p<0.0001.
-
Figure 1—source data 1
Raw day-time IOP data for Figure 1A; Raw night IOP data for Figure 1B; Individual outflow facility for Figure 1C; Individual central corneal thickness for Figure 1E.
- https://cdn.elifesciences.org/articles/63677/elife-63677-fig1-data1-v2.xlsx
Figure 1—figure supplement 1
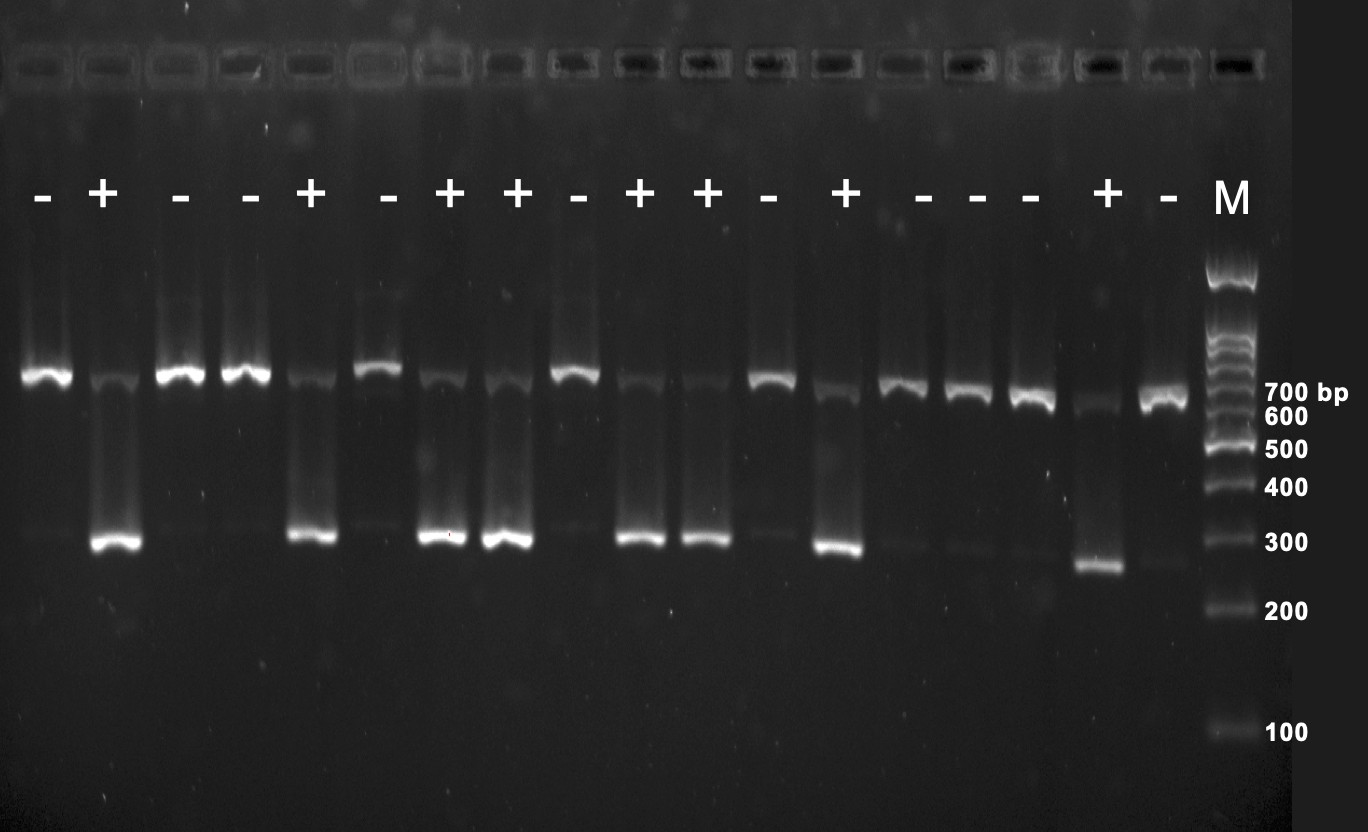
Genotyping of transgenic Myoc Y437H mice by polymerase chain reaction (PCR).
Tg-Myoc Y437H mice (+) displayed with PCR products of 249 bp (MyocY437H) and weak band at 610 bp (mouse DNA). The mice with only 610 bp band were transgenic negative mice (-). M: DNA markers.
Figure 1—figure supplement 2
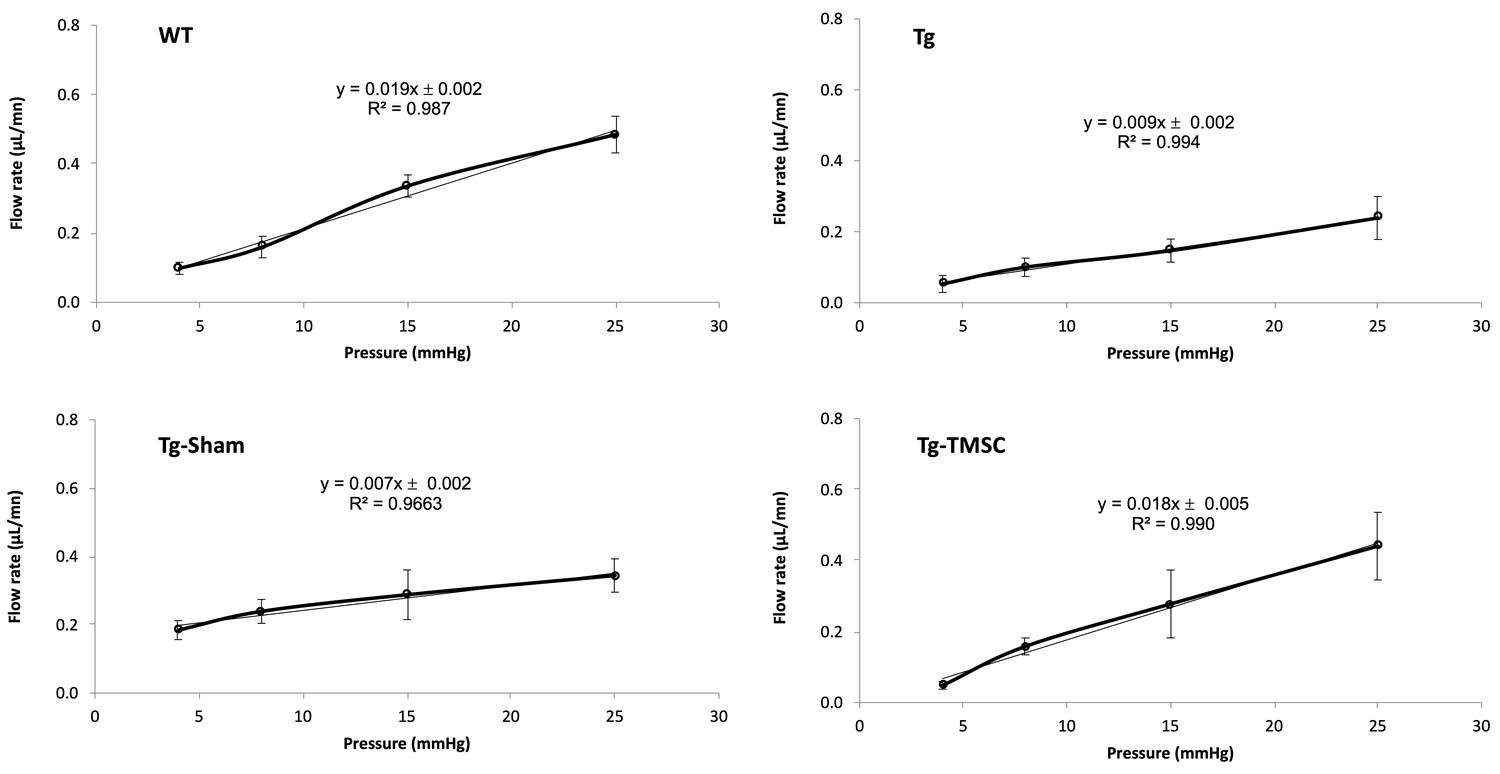
Representative perfusion outflow data from each mouse group.
X-axis: perfusion pressure (mmHg), Y-axis: flow rate (μL/min), y is the slope indicating outflow facility (μL/min/mmHg).
Figure 2 with 1 supplement
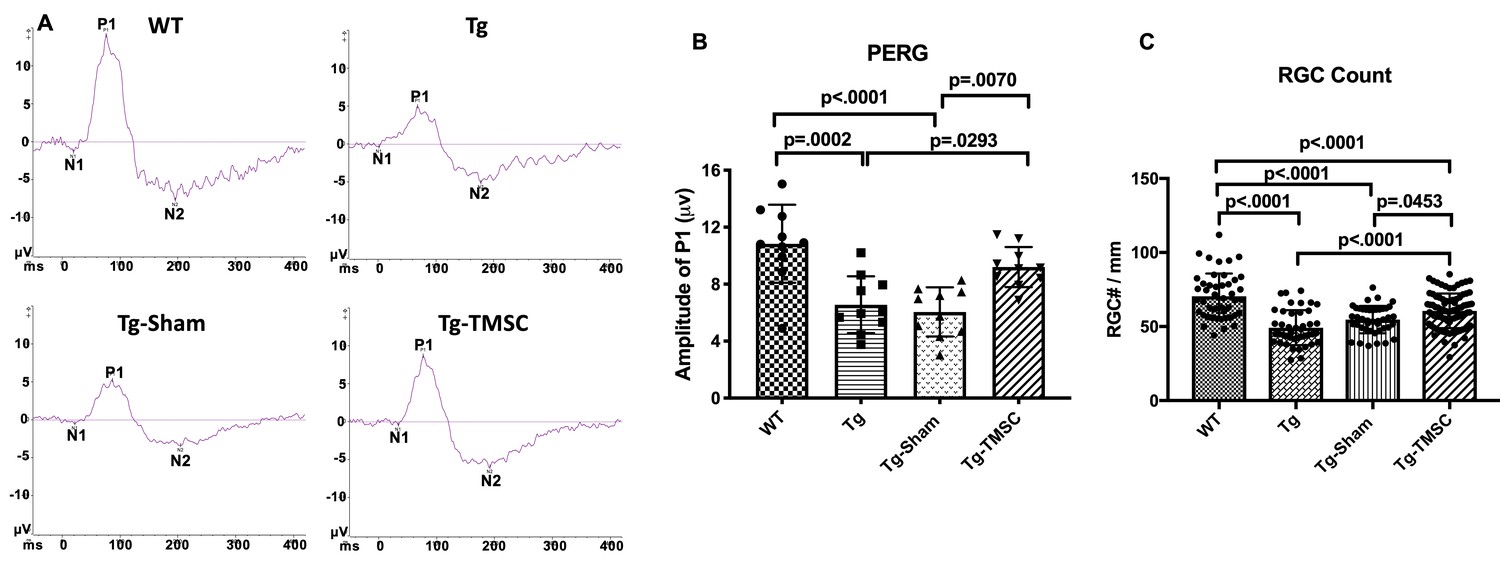
TMSCs preserve the RGC function and prevent RGC loss in Tg-MyocY437H mice.
The function of RGCs in the mice was evaluated by pattern electroretinogram (PERG). (A) Representative examples of PERG from different groups at 2 months after transplantation. (B) Bar graphs of averaged P1 amplitude in PERG (n = 10 eyes/group). (C) RGC numbers counted on the retinal sections in each group (n = 12–16 sections/eyes, and 4–6 eyes/group). Data are presented as mean ± SD. One-way ANOVA followed by Tukey’s multiple comparisons test. WT: wild-type mice, Tg: Tg-MyocY437H mice, Tg-Sham: Tg mice with medium injection, Tg-TMSC: Tg mice with TMSC injection.
-
Figure 2—source data 1
Individual P1 amplitude in pattern electroretinogram for Figure 2B; Individual retinal ganglion cell count of each section for Figure 2C.
- https://cdn.elifesciences.org/articles/63677/elife-63677-fig2-data1-v2.xlsx
Figure 2—figure supplement 1
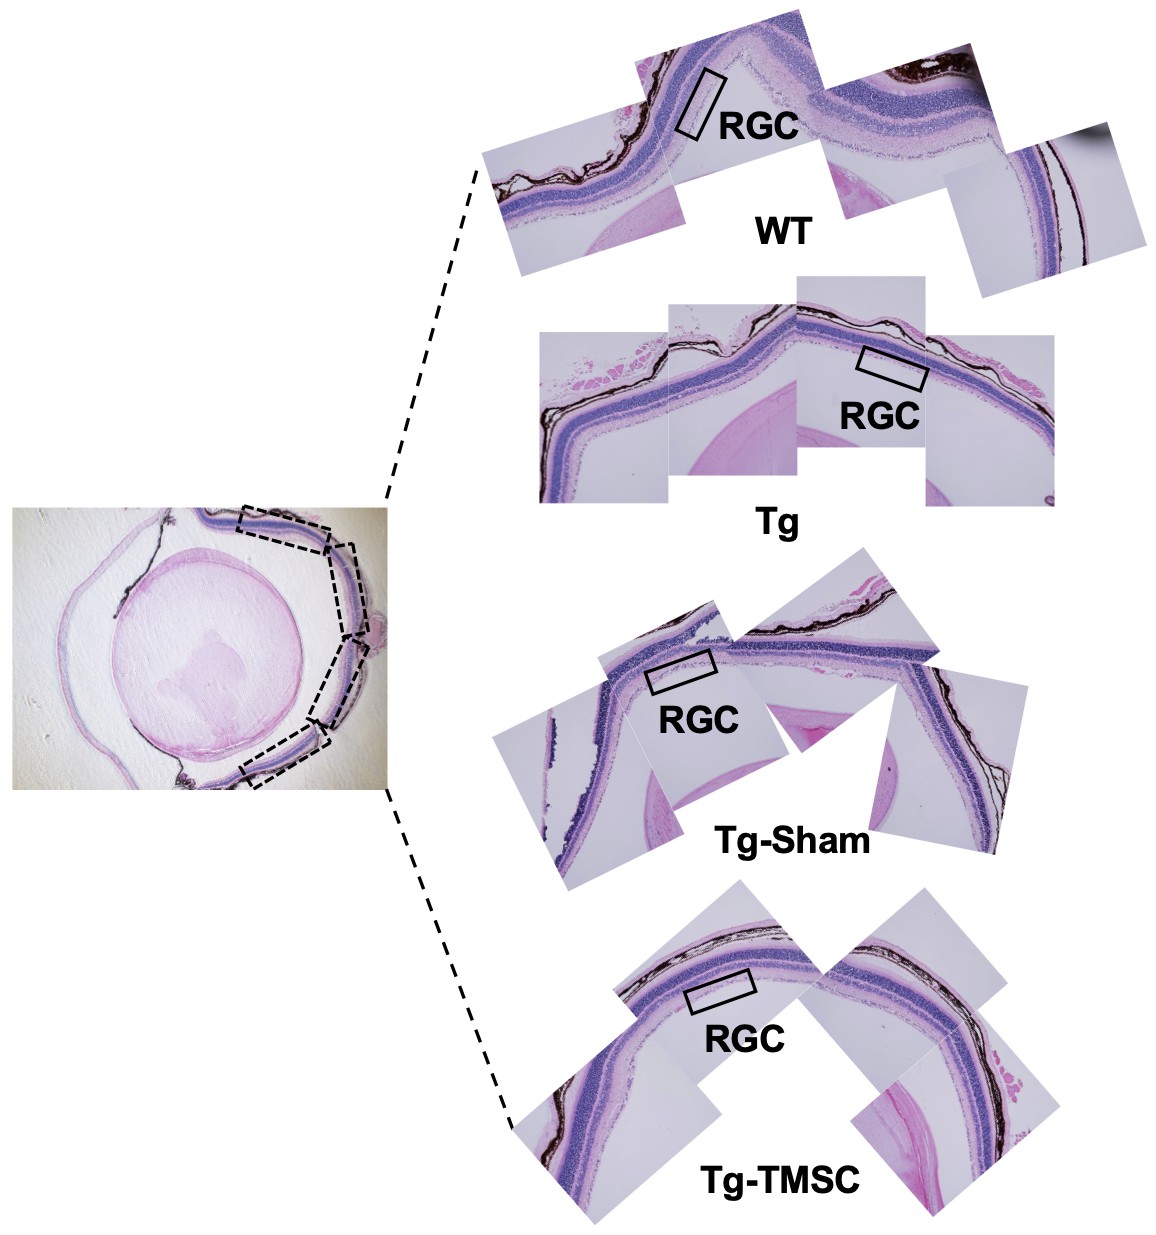
Transplanted TMSCs rescue RGCs and prevent neurodegeneration in Tg-MyocY437H mice.
Eye sections stained hematoxylin and eosin show the RGC layer in the eyes. The black INSET boxes in the left picture show the areas from which RGCs were captured so that the RGCs in the whole retina were counted in the central sections that containing optic nerve.
Figure 3
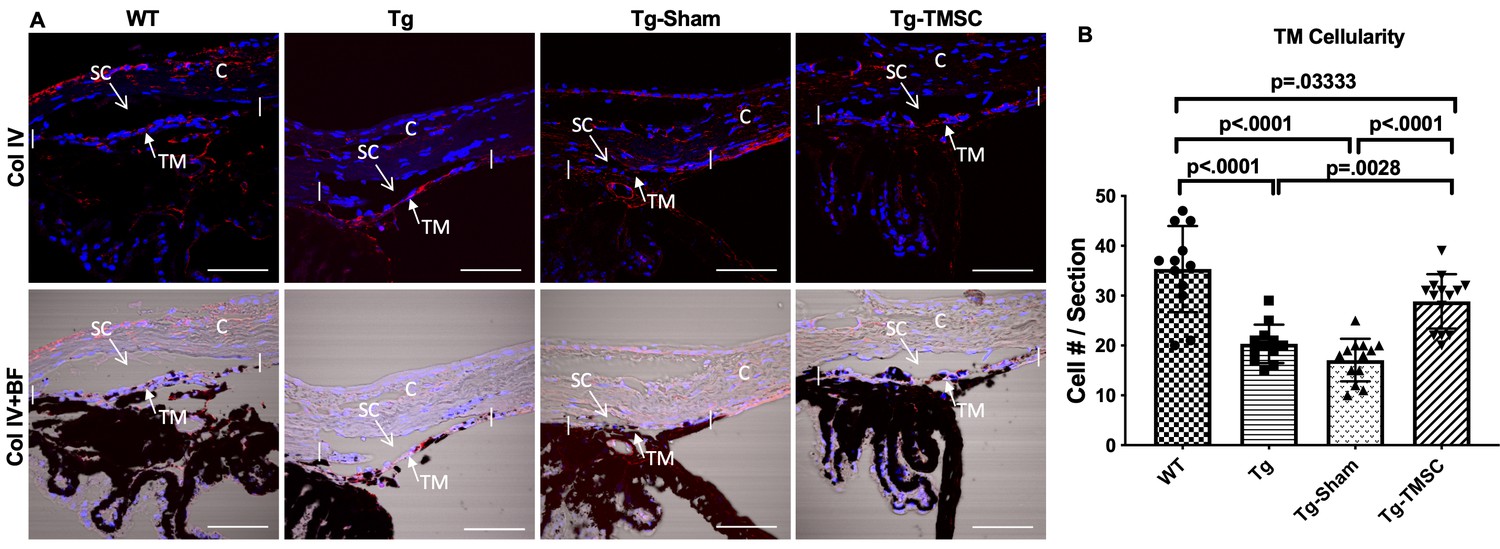
TMSCs increase the TM cellularity in the Tg-MyocY437H mice.
(A) Evaluation of the cellular density in the mouse TM region. Sections of the anterior segment were immunostained with collagen IV (red) and DAPI (blue). The TM region was determined by bright-field (BF) image together with collagen IV staining in the region between the two white vertical lines. Scale Bars, 50 µm. (B) The TM cellularity was averaged (n=12-14/group) and displayed as the number of cells in the TM region per section. Data are presented as mean ± SD. One-way ANOVA followed by Tukey’s multiple comparisons test. C: cornea, SC: Schlemm’s canal, TM: trabecular meshwork.
-
Figure 3—source data 1
Individual TM cell count of each section for Figure 3B.
- https://cdn.elifesciences.org/articles/63677/elife-63677-fig3-data1-v2.xlsx
Figure 4
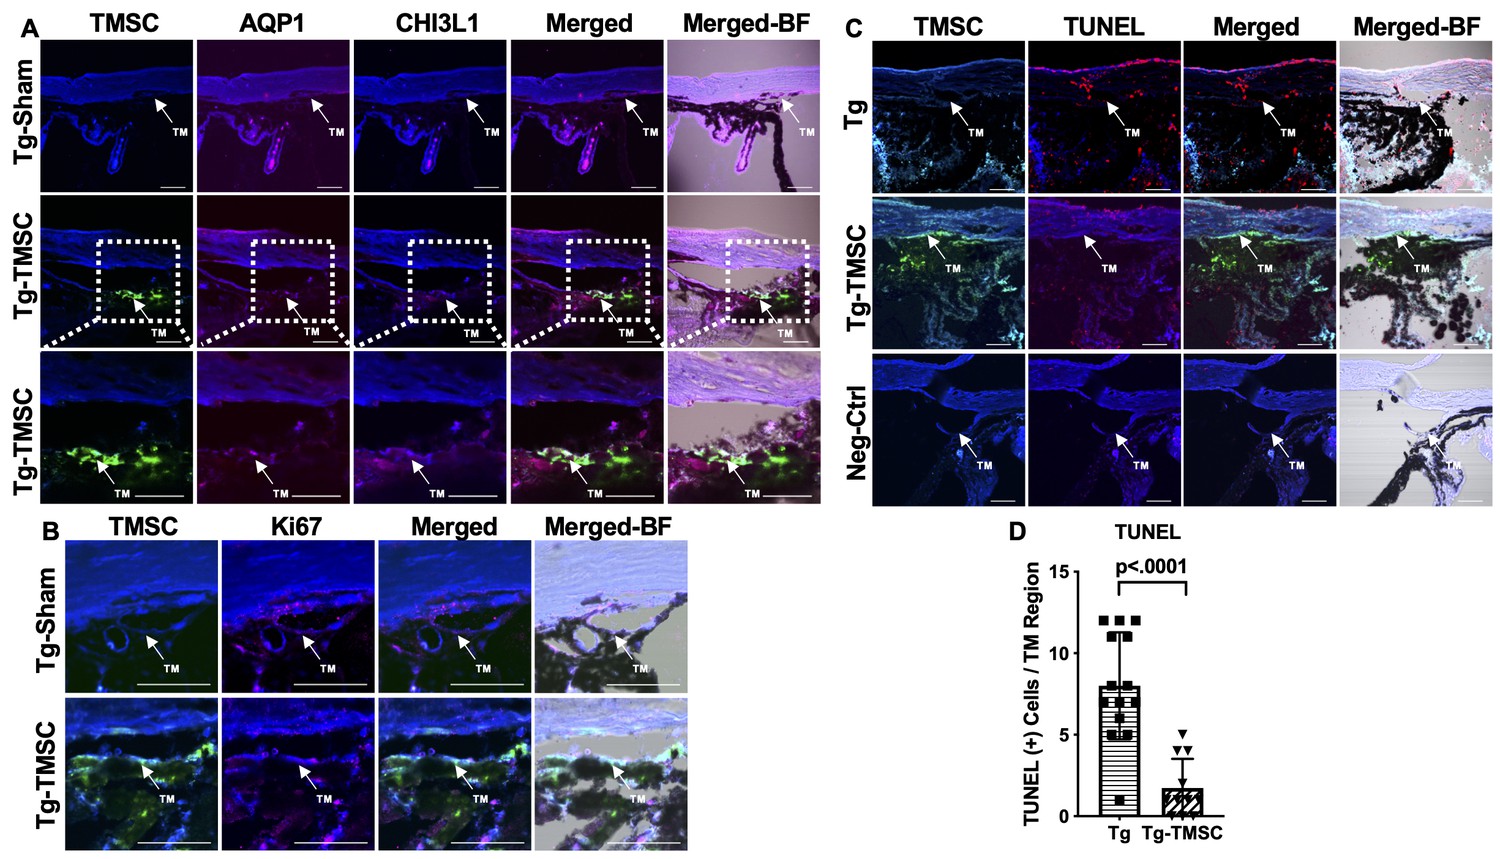
Transplanted TMSCs differentiate into TM cells and viable up to 2 months post-transplantation.
(A) AQP1/CHI3L1 immunofluorescent staining shows integration of transplanted TMSCs (DiO+, green) into the TM and differentiation of TMSCs into TM cells with expression of AQP1 (red) and CHI3L1 (magenta). (B) Ki67 staining shows part of the transplanted TMSCs (green) positive to Ki67 (red) in the TM while few of the TM cells in the Tg-Sham were Ki67+ too. (C) TUNEL staining shows some of the corneal cells and TM cells in the Tg mice were positive to TUNEL (apoptosis) while the transplanted TMSCs (green) in the Tg-TMSC were viable as the TMSC population was TUNEL negative. Scale bars, 50 μm. (D) Quantification of TUNEL + cells in the TM region of both Tg-MYocY437H mice without treatment (Tg) and with TMSC transplantation (Tg-TMSC). Data are presented as mean ± SD. Student t-test. TM: trabecular meshwork.
-
Figure 4—source data 1
Individual TUNEL-positive cells per TM region per section for Figure 4D.
- https://cdn.elifesciences.org/articles/63677/elife-63677-fig4-data1-v2.xlsx
Figure 5
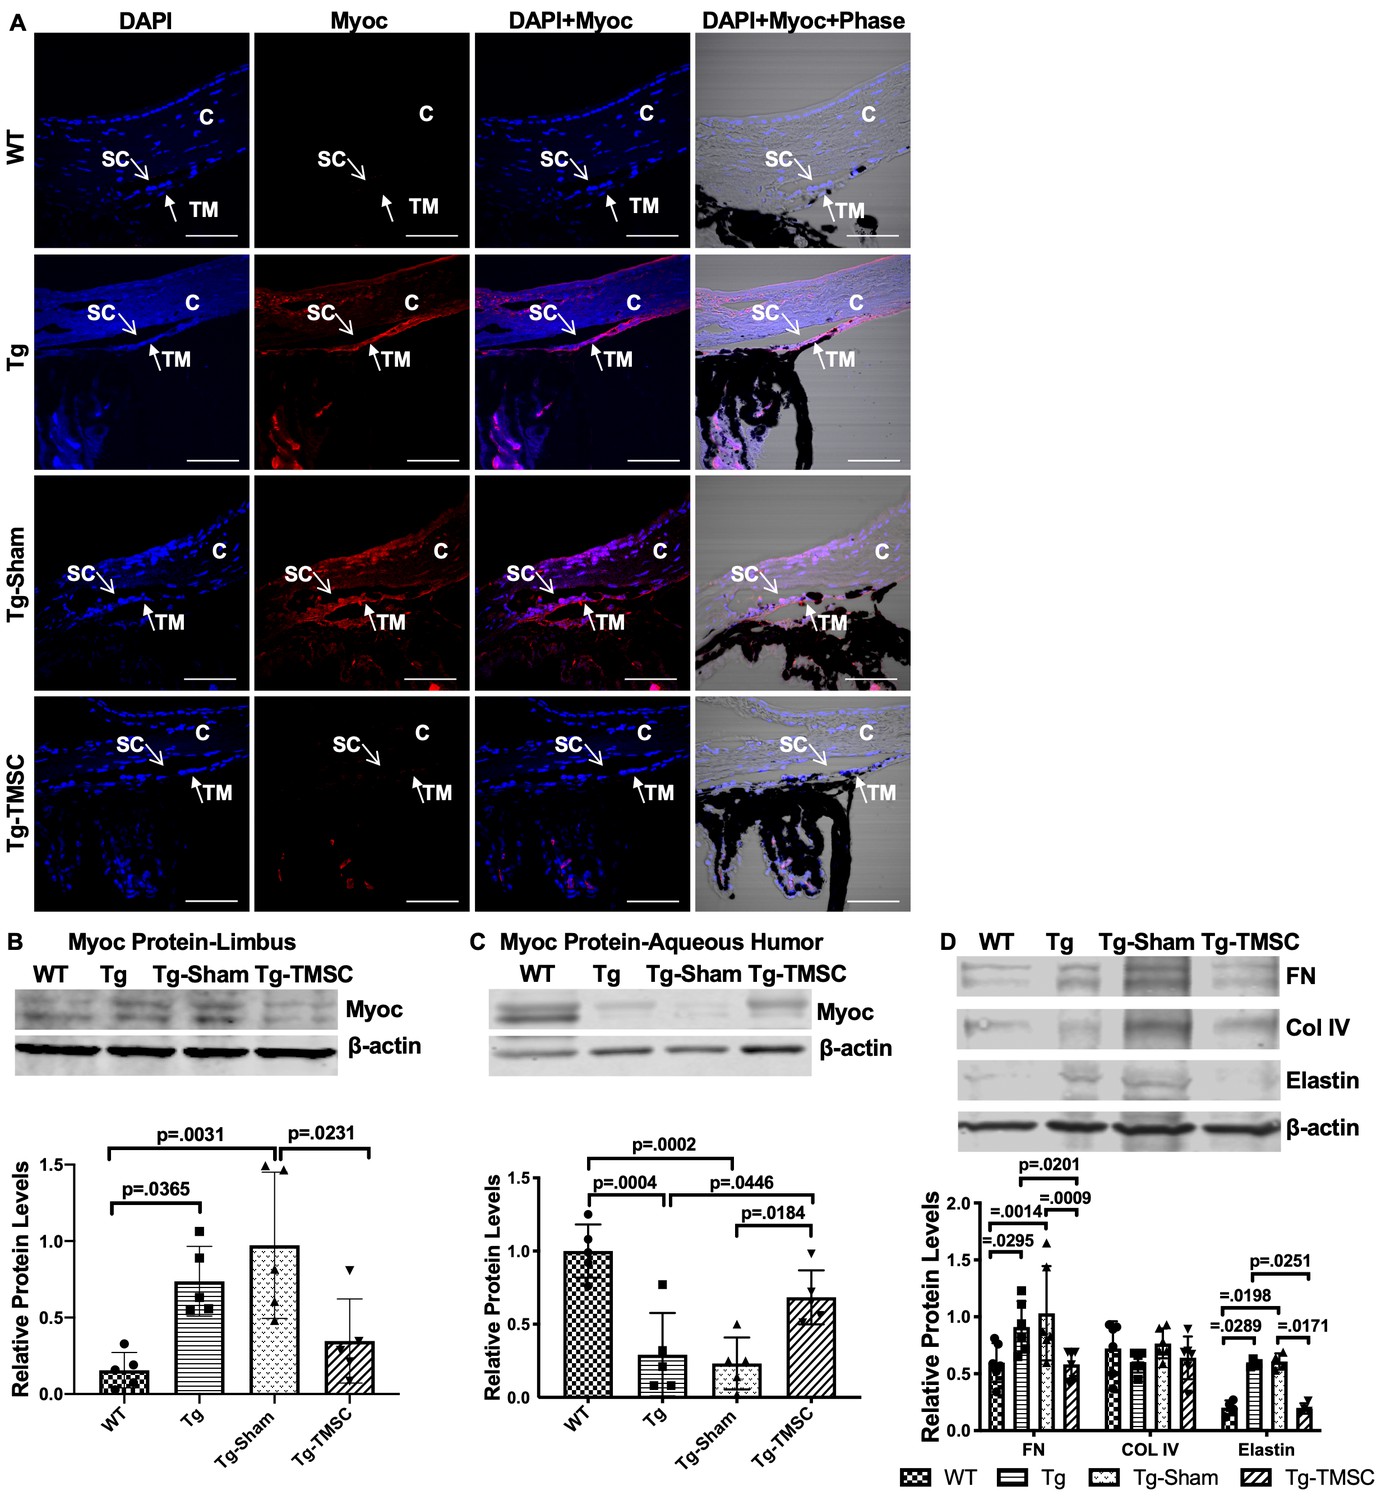
TMSCs reduce the Myoc retention in the TM tissue, promote the Myoc secretion into the aqueous humor, and reverse the ECM expression in the Tg-MyocY437H mice.
(A) Immunofluorescent staining shows accumulated Myoc in the TM, iris, and ciliary body of the Tg and Tg-sham mice. TMSC transplantation alleviated the aggregation of Myoc in the TM, similar to the WT mice. Scale bars, 50 mm. Western blotting results show: (B) The representative bands of Myoc expression in the mouse limbal tissue and the relative Myoc protein levels with b-actin as internal control (n=5). (C) The representative bands of Myoc expression in the mouse aqueous humor and the relative Myoc protein levels with b-actin as internal control (n=5). (D) The representative bands of the expression of ECM components fibronectin (FN), collagen IV, and elastin in the limbal tissue and the relative ECM protein levels with b-actin as internal control (n=4-6). Data are presented as mean ± SD. One-way ANOVA (B,C) or two-way ANOVA (D) followed by Tukey’s multiple comparisons test. C: cornea, SC: Schlemm’s canal, TM: trabecular meshwork.
-
Figure 5—source data 1
Relative myocilin protein levels in the corneal limbus for Figure 5B.
- https://cdn.elifesciences.org/articles/63677/elife-63677-fig5-data1-v2.xlsx
Figure 6
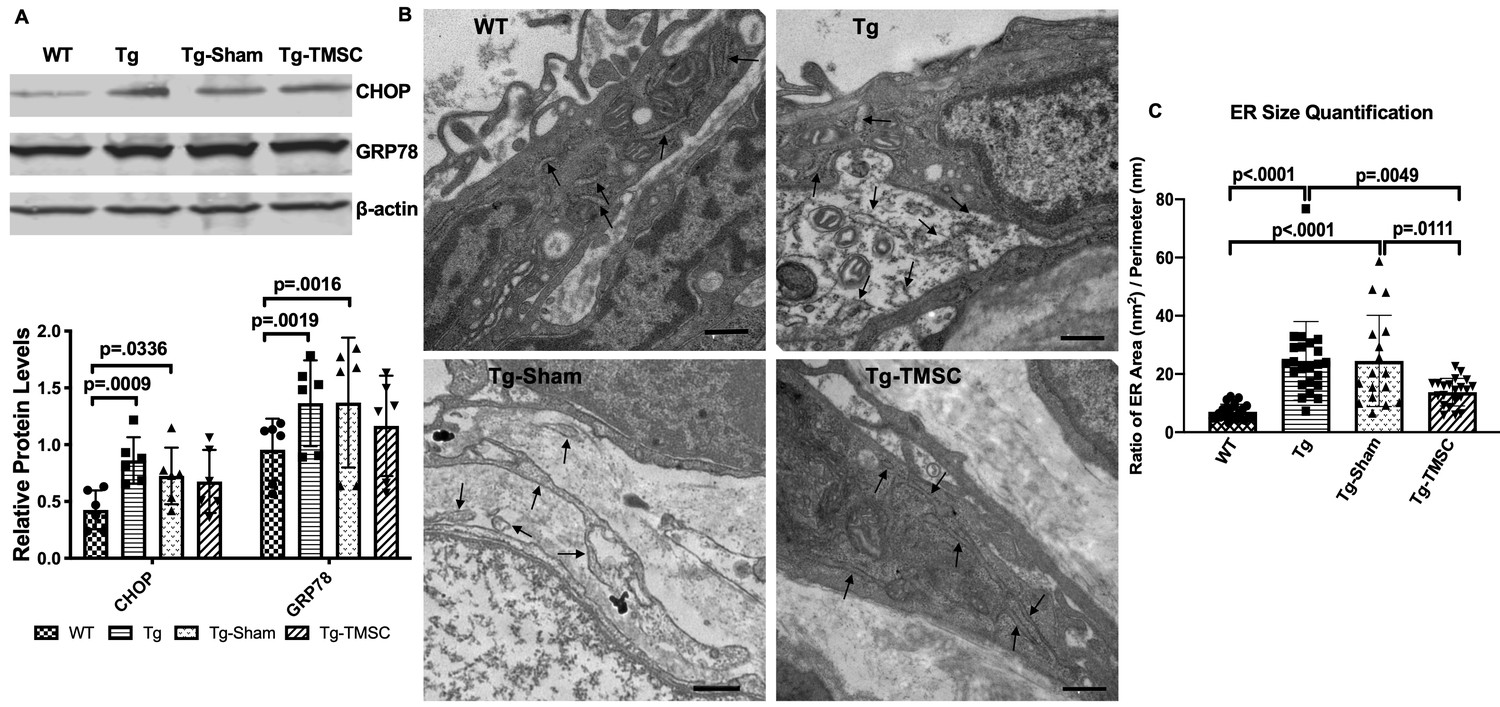
The effect of TMSCs on ER stress and ultrastructure of the TM in the Tg-Myoc Y437H mice.
(A): Western blotting results show the representative bands of CHOP and GRP78 expression in the mouse limbal tissue and the relative protein levels with β-actin as internal control (n = 6). (B) TEM results indicates the ultrastructure of mouse TM tissue (40,000x) with black arrows pointing to the ER. Scale Bar = 500 nm. (C) ER size quantification calculated as area (nm2)/perimeter (nm) (n = 18–23). Data are presented as mean ± SD. Two-way ANOVA (A) or one-way ANOVA (C) followed by Tukey’s multiple comparisons test.
-
Figure 6—source data 1
Relative ER stress protein levels in the corneal limbus for Figure 6A; Relative ER sizes of the TM cells for Figure 6C.
- https://cdn.elifesciences.org/articles/63677/elife-63677-fig6-data1-v2.xlsx
Figure 7 with 1 supplement
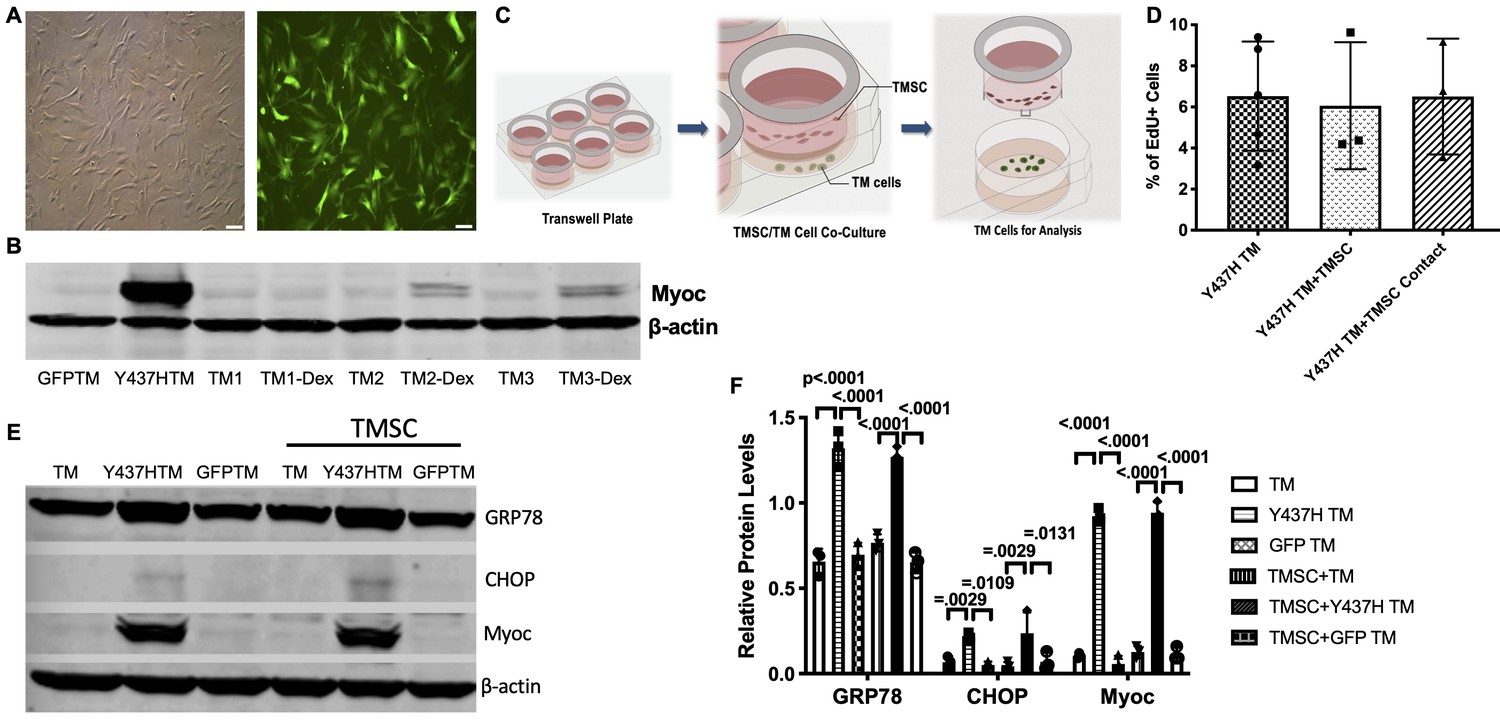
TMSCs could not reverse ER stress and stimulate proliferation of Myoc mutant TM cells in vitro.
(A) The TM cells were transduced with recombinant lentivirus encoding GFP and Myoc Y437H mutation. The transduced GFP+ cells were sorted by Flow cytometry and the cultured sorted TM cells were almost 100% with GFP (green) in the cytoplasm. Scale Bars, 100 µm. (B) Transduced TM cells with Myoc Y437H mutation expressed high Myoc by western blotting and TM cells had increased Myoc expression after 5-day Dex treatment (TM2, TM3). TM1 did not have increased Myoc expression after Dex treatment so TM1 cells were discarded. (C) Schematic illustration shows co-culturing of TMSCs with TM cells for detection of TM cell changes. (D) Flow cytometry analysis of EdU incorporation shows neither co-culture nor direct contact with TMSCs for 4 days would affect TM cell proliferation (n=3-5). (E) Representative western blotting bands show the levels of ER stress markers and Myoc in the TM cells with or without TMSC co-culturing. (F) Relative protein levels with b-actin as internal control (n=3). Data are presented as mean ± SD. One-way ANOVA (D) or two-way ANOVA (F) followed by Tukey’s multiple comparisons test.
-
Figure 7—source data 1
Percentage of BrdU positive TM cells in different culture conditions for Figure 7D.
Relative protein levels by WB in the TM cells with different culture conditions for Figure 7F.
- https://cdn.elifesciences.org/articles/63677/elife-63677-fig7-data1-v2.xlsx
Figure 7—figure supplement 1
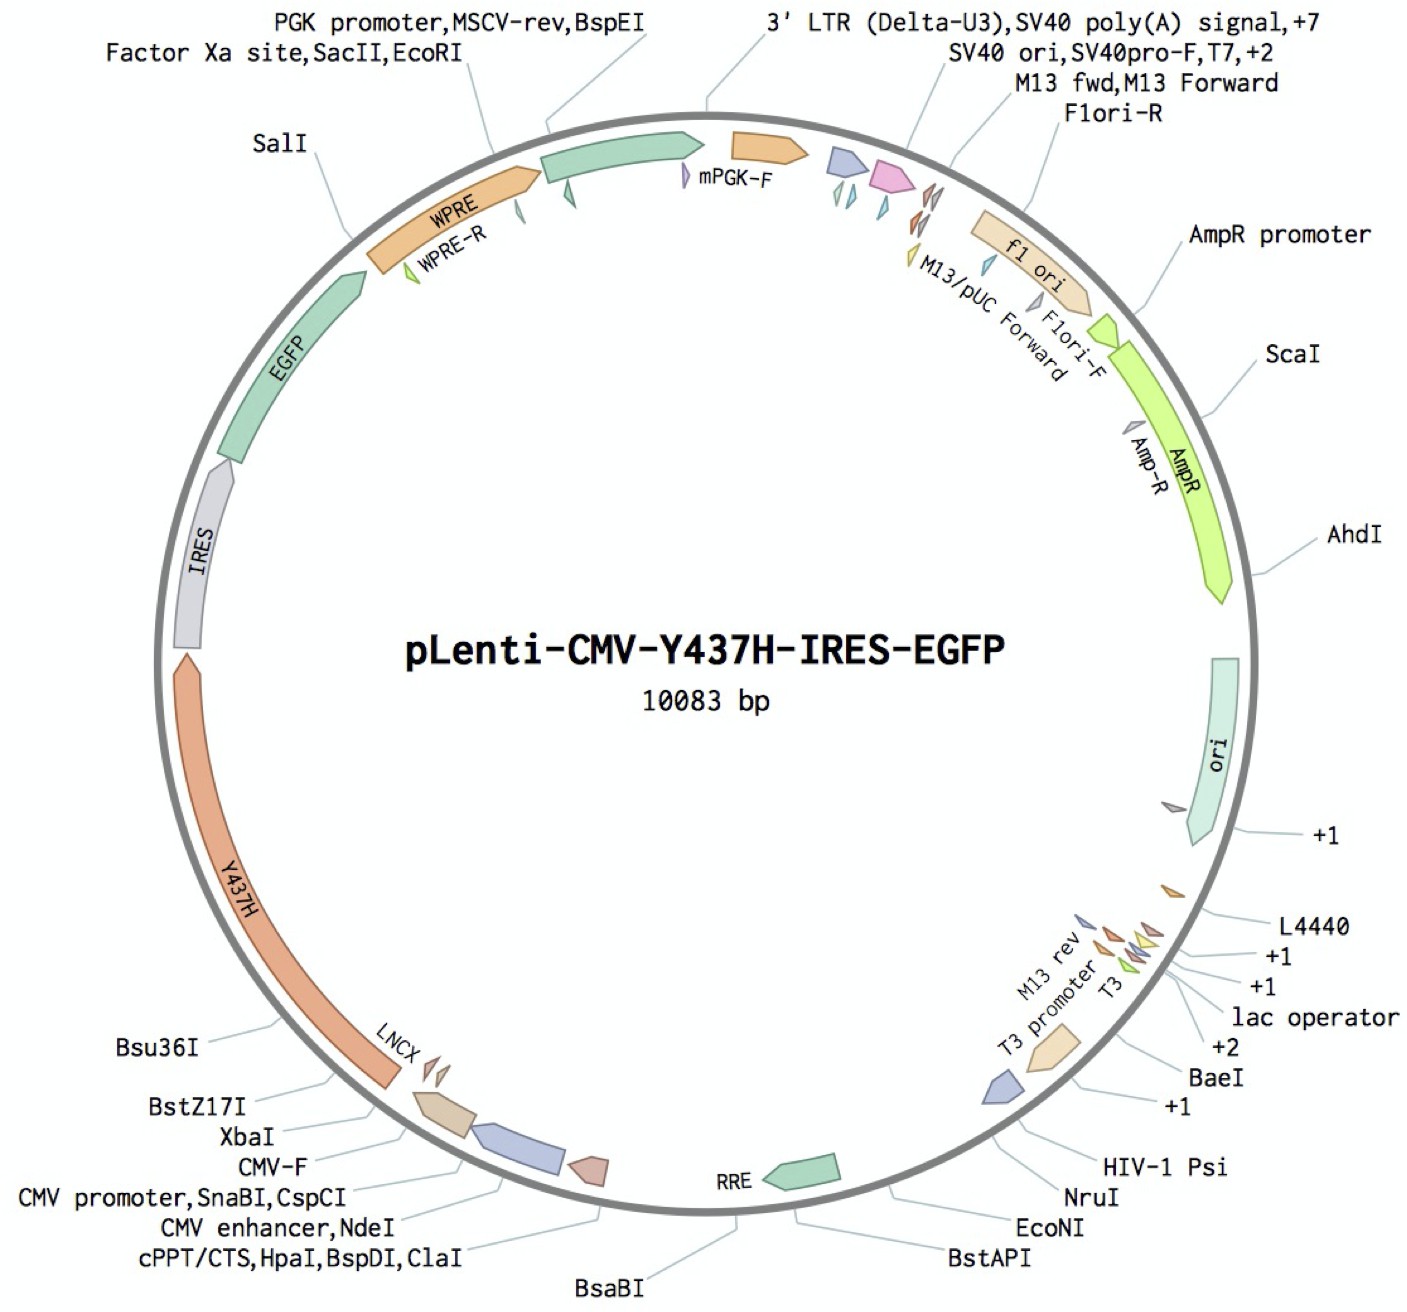
Structure of lentiviral packaging plasmid: pLentiCMV-Y437H-IRES-GFP.
Figure 8
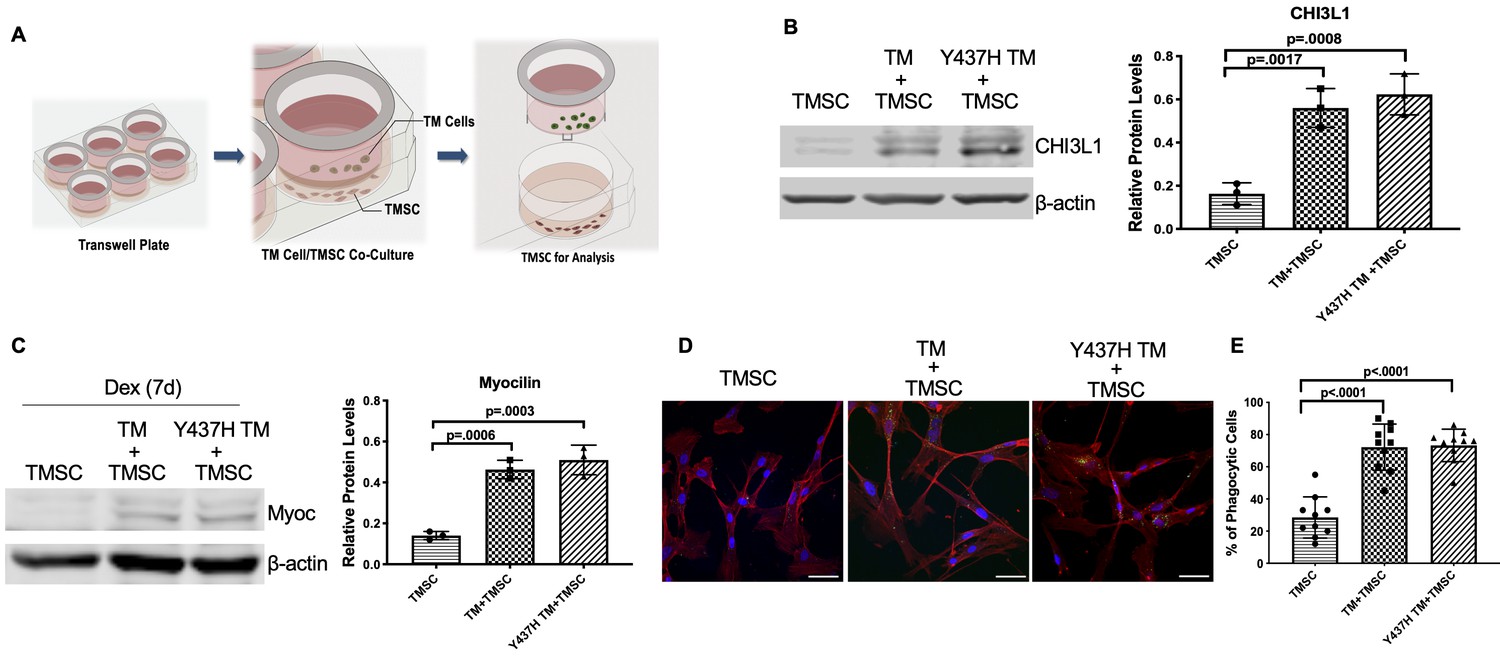
TMSCs differentiate into TM cells in vitro under ER stress environment.
(A) Schematic illustration shows co-culturing of TMSCs with TM cells for detection of TMSC changes. (B) The expression of TM cell marker CHI3L1 was upregulated in the TMSCs after 10 days of co-culturing with normal TM cells or MyocY437H mutant TM cells (n = 3). (C) After co-culturing for 10 days, the co-cultured TM cells in the Transwell insert were removed, and TMSCs were further treated with Dex for another 7 days. The levels of Myoc were detected by western blotting and quantified (n = 3). (D) After co-culturing of TMSCs with the TM cells or Myoc Y437H mutant TM cells in the Transwell insert for 10 days, the phagocytic ability of the TMSCs was evaluated by ingestion of bioparticles shown green in the cytoplasm. Scale Bars, 50 µm. (E) Percentage of phagocytic cells averaged from 10 different views. Data are presented as mean ± SD. One-way ANOVA followed by Tukey’s multiple comparisons test.
-
Figure 8—source data 1
Relative CHI3L1 protein levels by WB in TMSC with different culture conditions for Figure 8B.
- https://cdn.elifesciences.org/articles/63677/elife-63677-fig8-data1-v2.xlsx
Figure 9
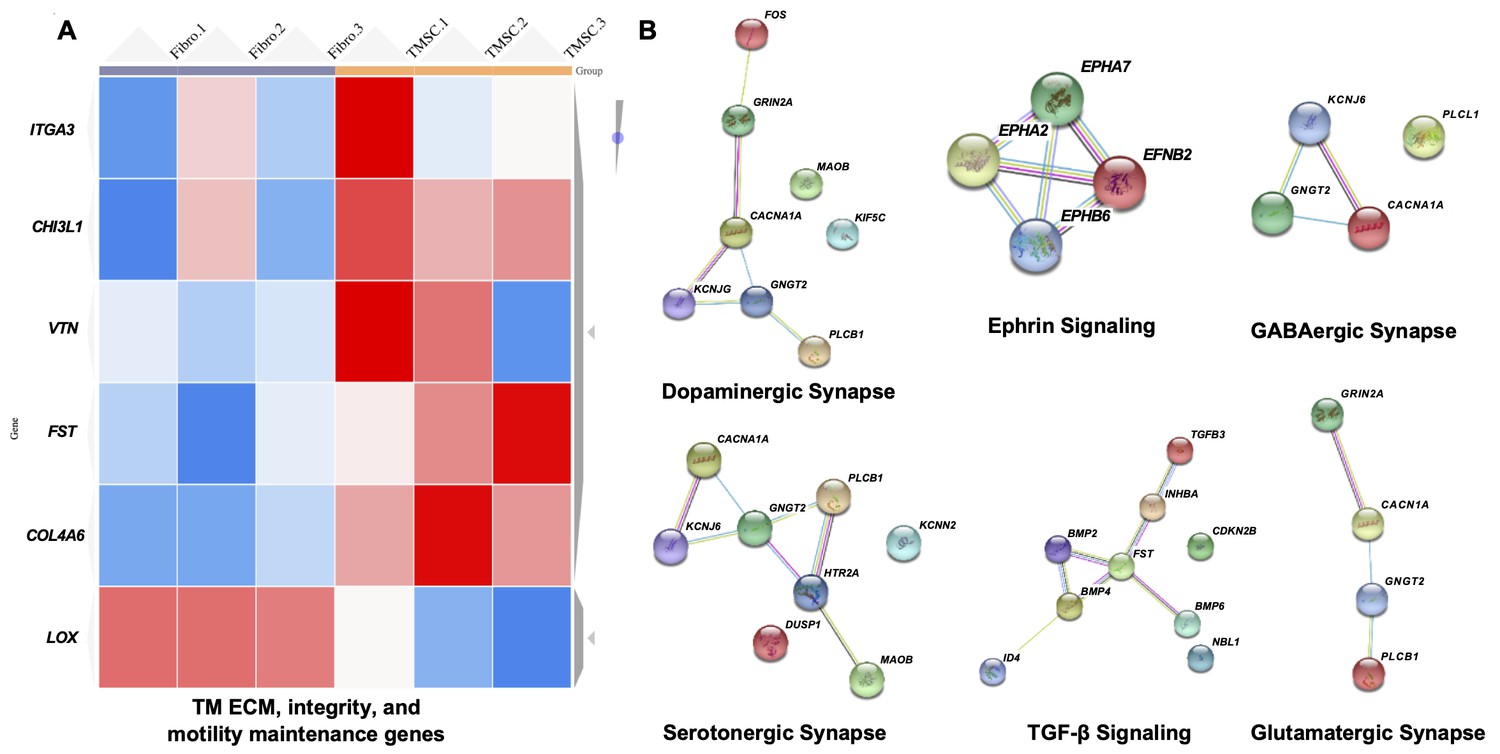
Transcriptome analysis of TM regeneration and neuroprotection genes among TMSC and fibroblasts.
(A) Heatmap shows gene expression profile of TMSCs as compared to fibroblasts for genes involved in maintenance of TM extracellular matrix (ECM), TM integrity and motility, (false discover rate (FDR) < 1%, p<0.01). Scale, bright red squares: highest gene expression levels, bright blue squares: lowest gene expression levels. (B) Interactome analysis shows activation of different neuroprotection pathways in TMSCs as obtained by RNA sequencing analysis. Interactome networks were generated using STRING v11.
-
Figure 9—source data 1
Related gene expression increase (p<0.05) in three individual TMSCs as compared to fibroblasts for Figure 9A.
Related neuroprotection related gene expression increase (p<0.05) in three individual TMSCs as compared to fibroblasts for Figure 9B.
- https://cdn.elifesciences.org/articles/63677/elife-63677-fig9-data1-v2.xlsx
Figure 10
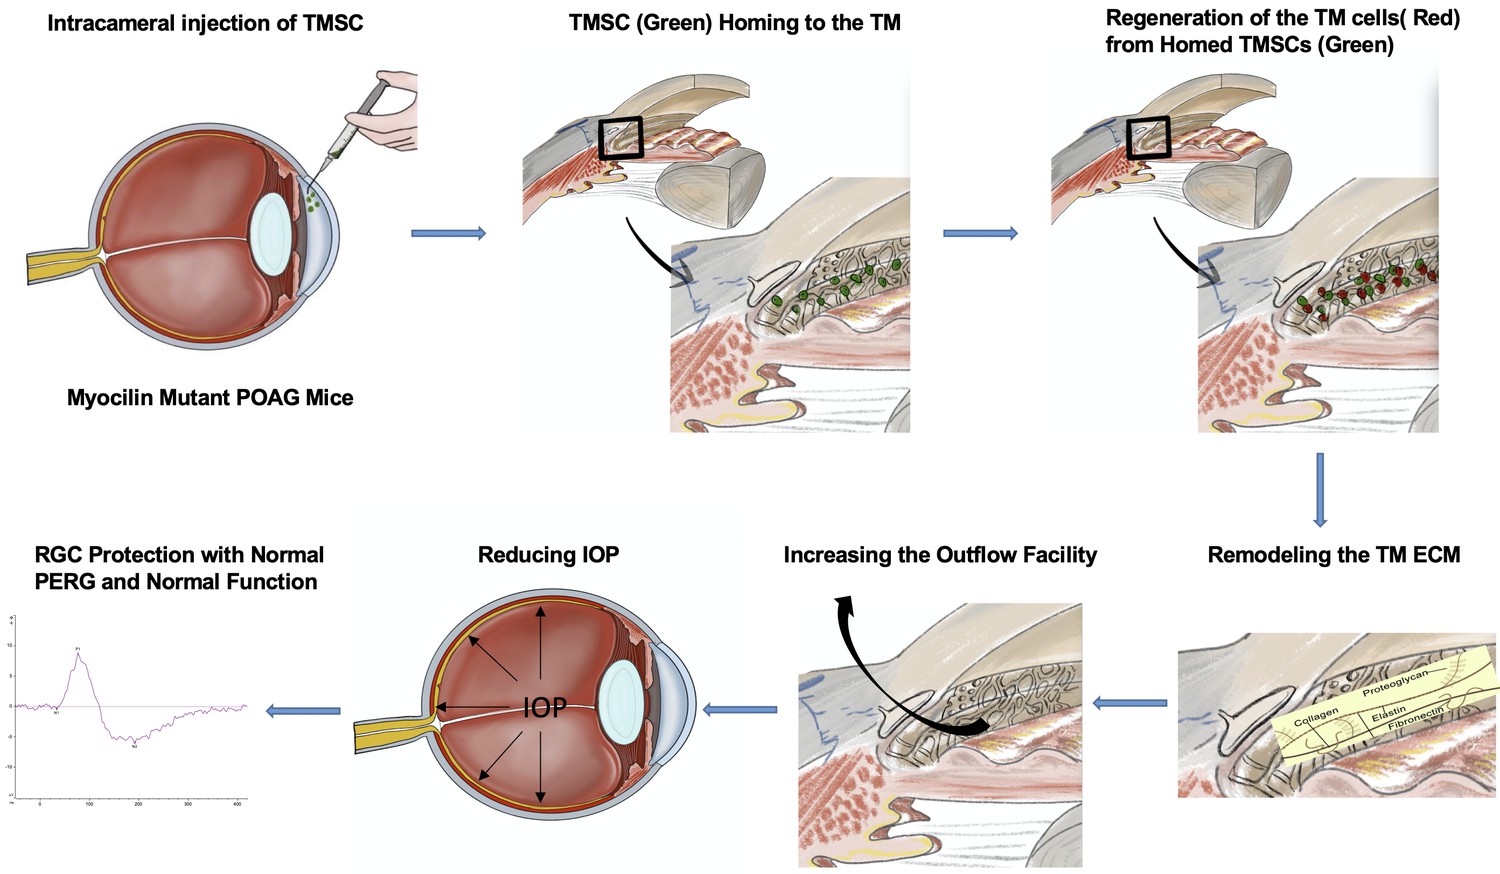
Graphical abstract.
Tables
Key resources table
| Reagent type (species) or resource | Designation | Source or reference | Identifiers | Additional information |
|---|---|---|---|---|
| Genetic reagent (Mus musculus) | Transgenic Myoc Y437H mice | Courtesy of Dr. Gulab Zode Zode et al., 2011 | North Texas Eye Research Institute | |
| Cell line (Homo sapiens) | Trabecular Meshwork Stem Cells (TMSCs) | This paper | Cells isolated from both male and female donors, characterized, and maintained in Du lab | |
| Cell line (Homo sapiens) | Trabecular Meshwork Cells (TM cells) | This paper | ||
| Cell line (Homo sapiens) | Corneal fibroblasts | This paper | ||
| Commercial assay or kit | Mycoplasma contamination detection kit | InvivoGen | Cat# rep-pt1 | |
| Antibody | Anti-Collagen IV (Rabbit polyclonal) | Sigma-Aldrich | Cat# SAB4500369 RRID:AB_10743858 | IF(1:100) WB(1:1000) |
| Antibody | Anti-AQP1 (Mouse monoclonal) | Santa Cruz Biotechnology | Cat# sc25287 RRID:AB_626694 | IF (1:100) |
| Antibody | Anti-human CHI3L1 (Goat polyclonal) | R and D Systems | Cat# AF2599, RRID:AB_2291883 | IF(1:50), WB (1:250) |
| Antibody | Anti-Ki67 (Rabbit polyclonal) | Abcam | Cat# ab15580 RRID:AB_443209 | IF(1:500) |
| Antibody | Anti-myocilin (Rabbit polyclonal) | Santa Cruz Biotechnology | Cat# Sc137233 RRID:AB_2148737 | IF(1:100) |
| Antibody | Anti-myocilin (Mouse monoclonal) | R and D Systems | Cat# MAB3446 RRID:AB_2148649 | WB(1:500) |
| Antibody | Anti-fibronectin (Rabbit polyclonal) | Abcam | Cat# b23750 RRID:AB_447655 | WB(1:1000) |
| Antibody | anti-elastin (Mouse monoclonal) | Millipore | Cat#: MAB2503 RRID:AB_2099602 | WB(1:500) |
| Antibody | CHOP (Mouse monoclonal) | Cell Signaling Technology | Cat#: 2895 RRID:AB_2089254 | WB(1:500) |
| Antibody | GRP78 (Mouse monoclonal) | Santa Cruz Biotechnology | Cat# sc-376768 RRID:AB_2819145 | WB(1:1000) |
| Antibody | β-actin (Mouse monoclonal) | Thermo Fisher | Cat# MA5-15739 RRID:AB_10979409 | WB(1:5000) |
| Recombinant DNA reagent | pLentiCMV-GFP (plasmid) | AddGene | Cat# 17448 | Lentiviral construct |
| Recombinant DNA reagent | pCAGIG2 (plasmid) | AddGene | Cat# 111159 | IRES-EGFP cassette |
| Recombinant DNA reagent | pcDNA3 Myoc Y437H | Courtesy of Dr. John Hulleman Zadoo et al., 2016 | UT Southwestern | |
| Sequence-based reagent | Mouse DNA_F | Thermo Fisher | PCR primers | GACTAAGGCAAGAAAATGAGAATC |
| Sequence-based reagent | Mouse DNA _R | Thermo Fisher | PCR primers | CCTCTCCACTCCTGAGATAGC |
| Sequence-based reagent | Mutant Myoc_F | Thermo Fisher | PCR primers | ACAAAGGCAGGGTCGAGAAGACAGG |
| Sequence-based reagent | Mutant Myoc_R | Thermo Fisher | PCR primers | TTCCCACCTCTCTCTCCCCATGAGA |
| Commercial assay or kit | In Situ Cell Death Detection Kit | Sigma-Aldrich | Cat# 12156792910 | |
| Commercial assay or kit | RNeasy Mini Kit | Qiagen | Cat# 74106 | |
| Commercial assay or kit | cDNA Reverse Transcription Kit | Life Technologies | Cat# 4368813 | |
| Commercial assay or kit | Power SYBR Green PCR Master Mix | Life Technologies | Cat# 4368708 | |
| Chemical compound | opsonized Alexa 546-conjugated S. aureus bioparticles | Thermo Fisher | Cat# A10010 | |
| Software, algorithm | String V11 | https://string-db.org/ | RRID:SCR_005223 | |
| Software, algorithm | FlowJo version 10 | https://www.flowjo.com/ | RRID:SCR_008520 | |
| Software, algorithm | ImageJ | https://fiji.sc/ | RRID:SCR_002285 | |
| Software, algorithm | Graphpad Prism 8 | https://www.graphpad.com/scientific-software/prism/ | RRID:SCR_002798 | |
| Software, algorithm | Espion version 6 | http://diagnosysllc.com | ||
| Other | DAPI | Sigma-Aldrich | Cat# D9542 | Stain: 1 µg/ml |
Additional files
-
Supplementary file 1
Related gene expression increase (p<0.05) in genes related to TM ECM interaction.
Related to Figure 9.
- https://cdn.elifesciences.org/articles/63677/elife-63677-supp1-v2.docx
-
Transparent reporting form
- https://cdn.elifesciences.org/articles/63677/elife-63677-transrepform-v2.docx
Download links
A two-part list of links to download the article, or parts of the article, in various formats.
Downloads (link to download the article as PDF)
Open citations (links to open the citations from this article in various online reference manager services)
Cite this article (links to download the citations from this article in formats compatible with various reference manager tools)
Stem cell transplantation rescued a primary open-angle glaucoma mouse model
eLife 10:e63677.
https://doi.org/10.7554/eLife.63677


