EGFR transactivates RON to drive oncogenic crosstalk
- Department of Pathology, University of New Mexico, United States
- Department of Physics & Astronomy, University of New Mexico, United States
- Department of Surgery, University of New Mexico, United States
- Comprehensive Cancer Center, University of New Mexico, United States
Figures
Figure 1 with 4 supplements
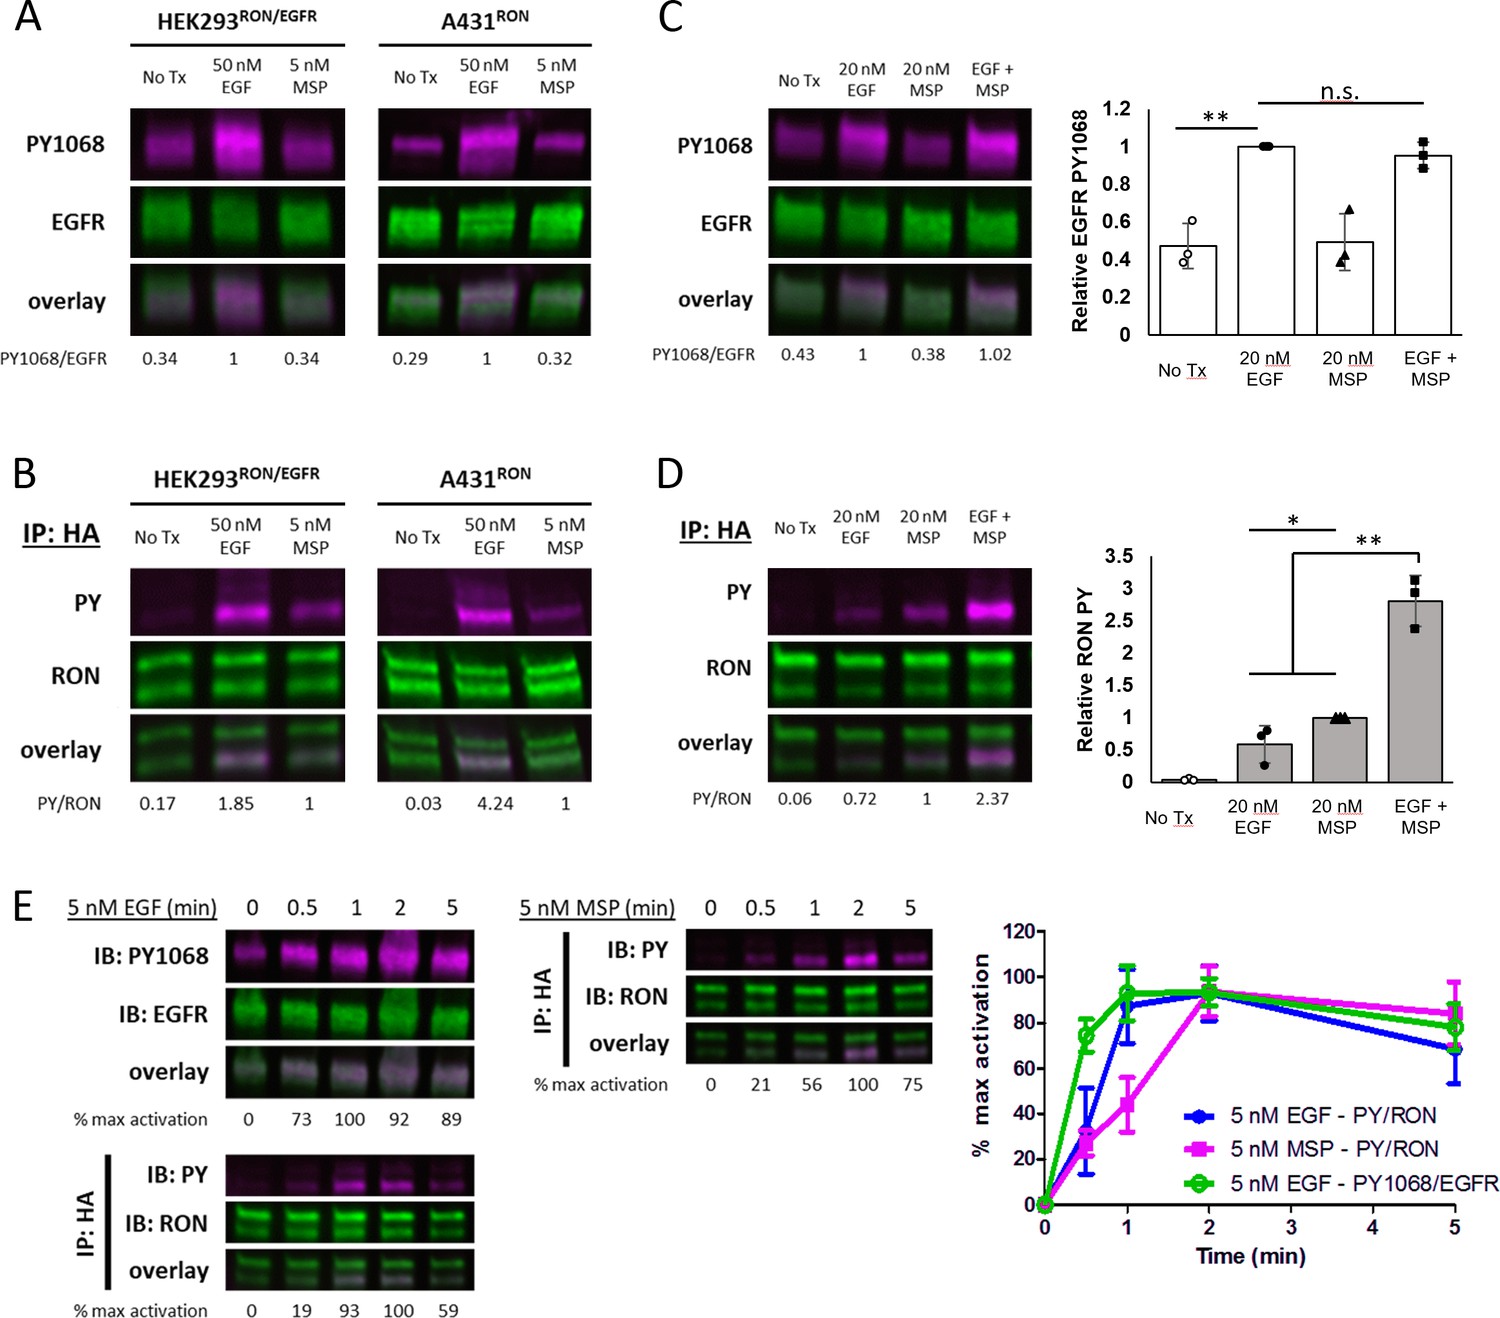
Crosstalk between EGFR and RON is EGF-driven.
(A and B) HEKRON/EGFR or A431RON cells were treated with ± 5 nM MSP or 50 nM EGF for 5 min at 37 °C. Representative immunoblots showing PY1068 and EGFR on cell lysates (A) or pan-phosphotyrosine (PY) and RON on samples immunoprecipitated (IP) with anti-HA antibody (B). (C and D) A431RON cells were stimulated with ± 20 nM EGF, 20 nM MSP or both for 5 min at 37 °C and immunoblotted as in (A and B). Triplicate biological experiments are quantified in the bar graphs to the right, shown as mean ± SD. (E) Representative immunoblots of a phosphorylation time course for A431RON cells treated with 5 nM EGF or 5 nM MSP and immunoblotted as in (A and B). Graphed values (right) are from triplicate biological experiments, normalized to maximal activation, and presented as mean ± SD. * p < 0.05; ** p < 0.01.
-
Figure 1—source data 1
Full raw western blots and blots with relevant bands labeled, corresponding to Figure 1A, B, C, D and E.
- https://cdn.elifesciences.org/articles/63678/elife-63678-fig1-data1-v2.zip
-
Figure 1—source data 2
Source data for quantification of blots in Figure 1C, D, and E.
- https://cdn.elifesciences.org/articles/63678/elife-63678-fig1-data2-v2.xlsx
Figure 1—figure supplement 1
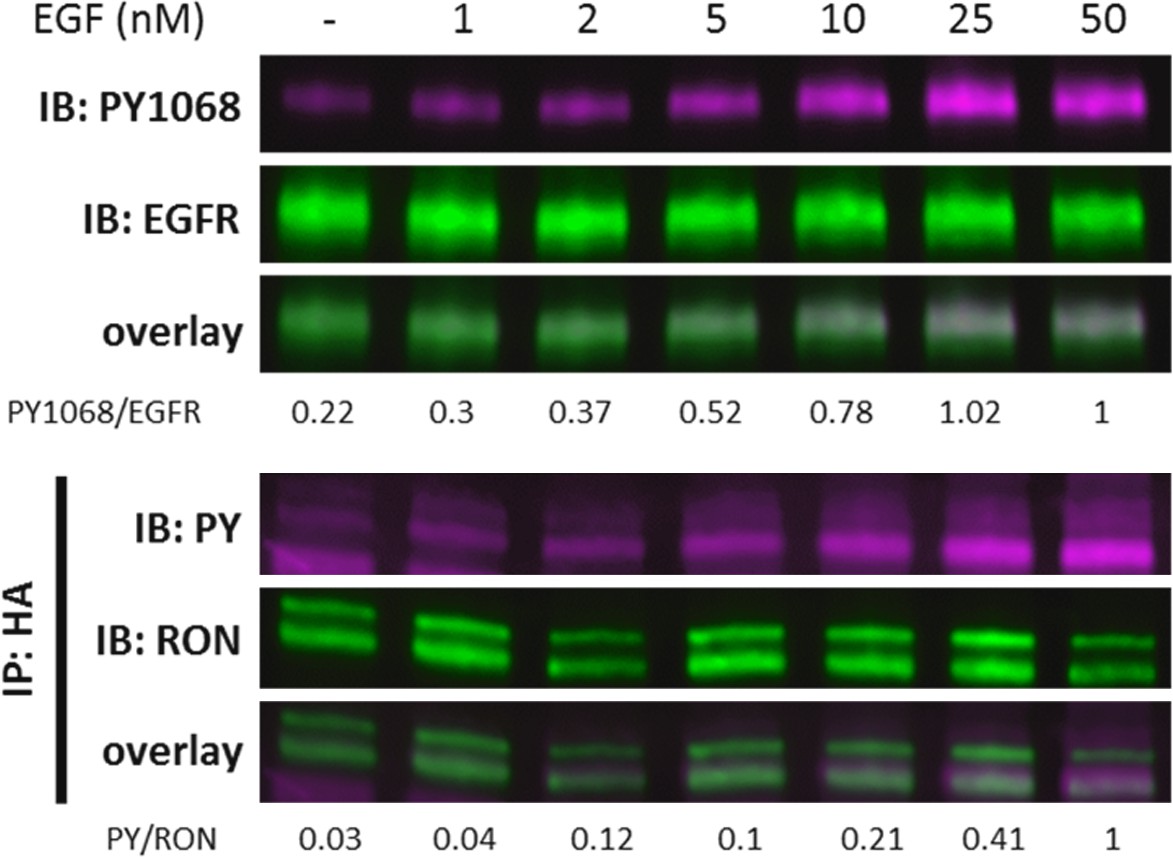
A431RON cells were treated with increasing levels of EGF for 5 min.
Immunoblots demonstrating detection of PY1068 and EGFR on cell lysates or detection of PY and RON on samples IP with anti-HA (RON) (n = 1).
-
Figure 1—figure supplement 1—source data 1
Full raw western blots and blots with relevant bands labelled, corresponding to Figure 1—figure supplement 1.
- https://cdn.elifesciences.org/articles/63678/elife-63678-fig1-figsupp1-data1-v2.zip
Figure 1—figure supplement 2
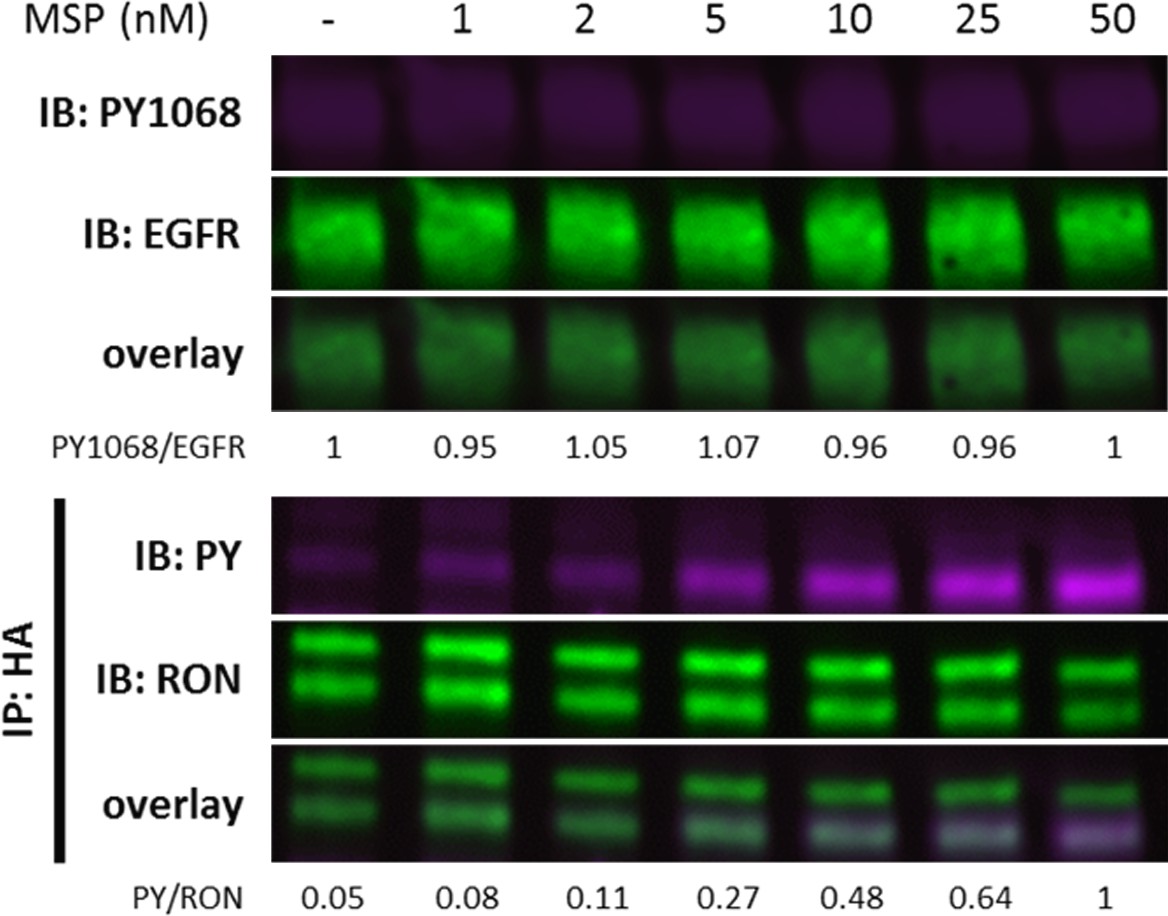
A431RON cells were treated with increasing levels of MSP for 5 min.
Immunoblots demonstrating detection of PY1068 and EGFR on cell lysates or detection of PY and RON on samples IP with anti-HA (RON) (n = 1).
-
Figure 1—figure supplement 2—source data 1
Full raw western blots and blots with relevant bands labeled, corresponding to Figure 1—figure supplement 2.
- https://cdn.elifesciences.org/articles/63678/elife-63678-fig1-figsupp2-data1-v2.zip
Figure 1—figure supplement 3
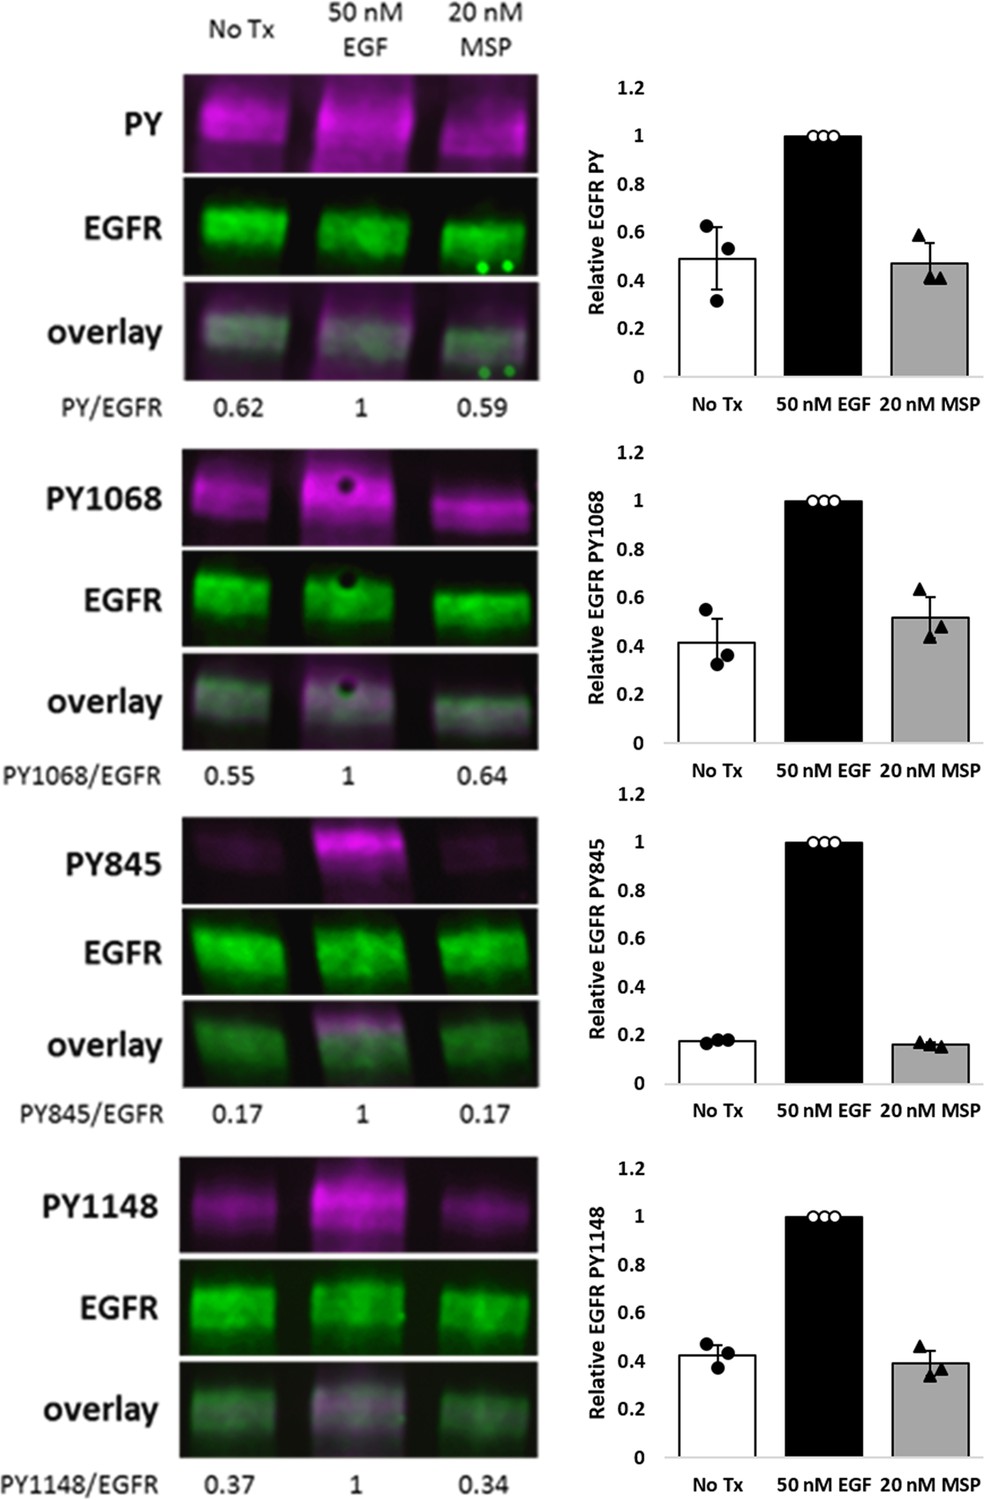
HEKRON/EGFR cells were treated± EGF or MSP for 5 min.
Representative immunoblots demonstrating detection of total PY (PY20/PY99 cocktail), PY1068, PY845, PY1148, and EGFR on cell lysates. Triplicate biological experiments are quantified and graphed as mean ± SD.
-
Figure 1—figure supplement 3—source data 1
Full raw western blots and blots with relevant bands labeled, corresponding to Figure 1—figure supplement 3.
- https://cdn.elifesciences.org/articles/63678/elife-63678-fig1-figsupp3-data1-v2.zip
-
Figure 1—figure supplement 3—source data 2
Source data for quantification of blots in Figure 1—figure supplement 3.
- https://cdn.elifesciences.org/articles/63678/elife-63678-fig1-figsupp3-data2-v2.xlsx
Figure 1—figure supplement 4
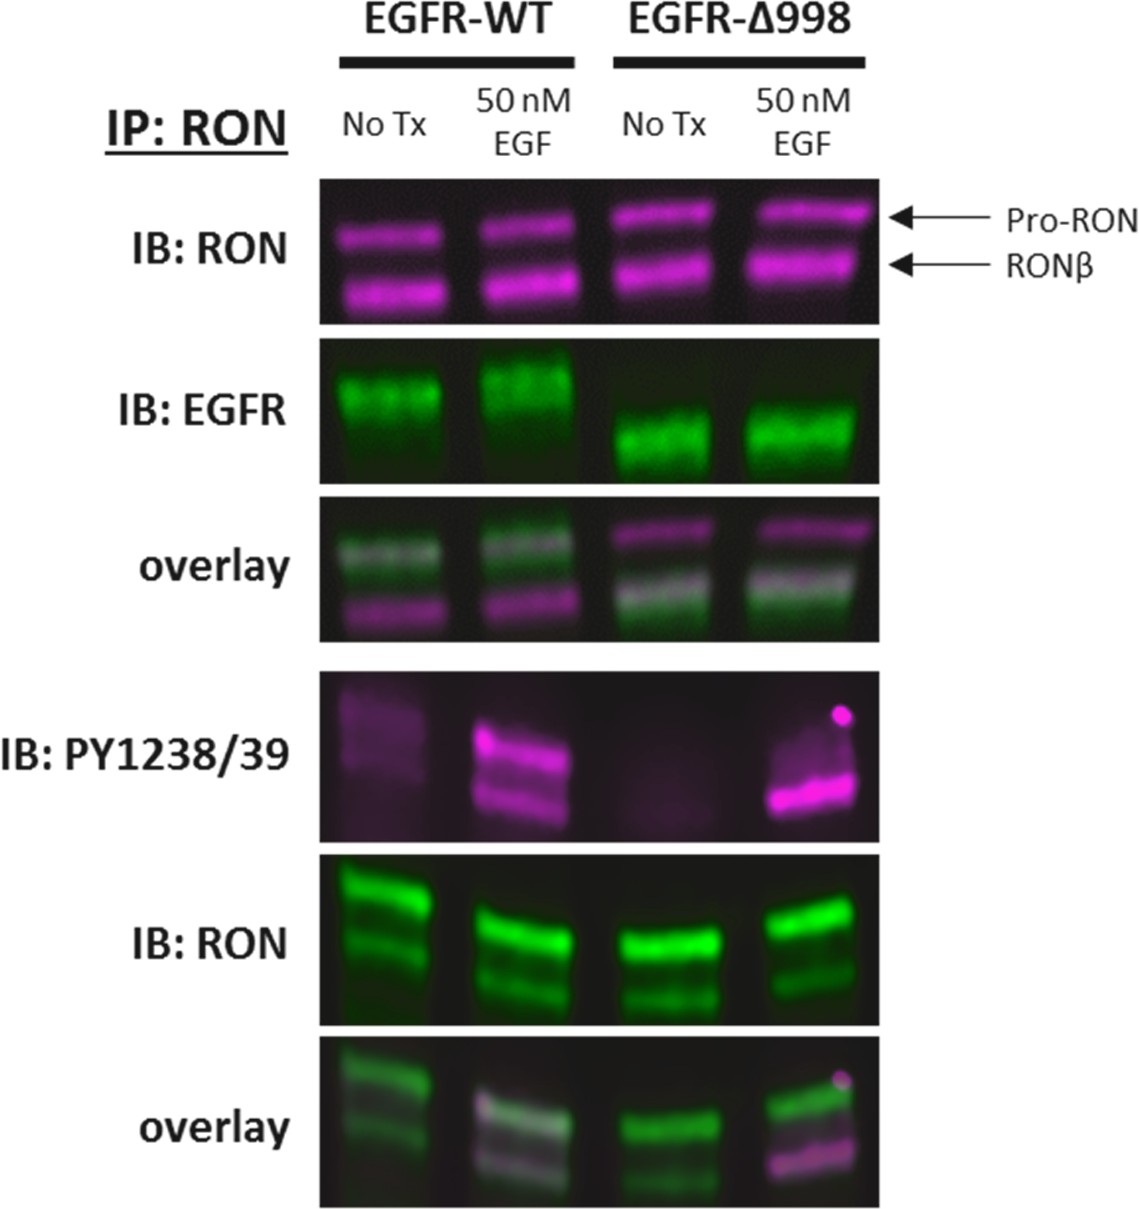
HEKRON cells transiently transfected with EGFR-WT or EGFR-Δ998± EGF treatment for 5 min.
Cell lysates were immunoprecipitated (IP) with anti-RON and probed for EGFR, RON, or RON PY1238/39. Arrows highlight the location of the 180 kDa unprocessed RON (pro-RON), and the 145 kDa RONβ band (mature RON). Truncated EGFR-Δ998 appears as a lower molecular weight band in the anti-EGFR immunoblot, as expected. However, EGFR-WT co-migrates with unprocessed RON (180 kDa). Therefore, all experiments in this study quantify the bottom RON band (RONβ). Additionally, the top band in the PY1238/39 immunoblot for EGF-treated EGFR-WT cells is absent in the EGFR-Δ998 samples, confirming this antibody cross-reacts with phosphorylated EGFR. Experiments to quantify RON phosphorylation were therefore first IP for HA (RON), and then probed with PY antibodies.
-
Figure 1—figure supplement 4—source data 1
Full raw western blots and blots with relevant bands labeled, corresponding to Figure 1—figure supplement 4.
- https://cdn.elifesciences.org/articles/63678/elife-63678-fig1-figsupp4-data1-v2.zip
Figure 2 with 2 supplements
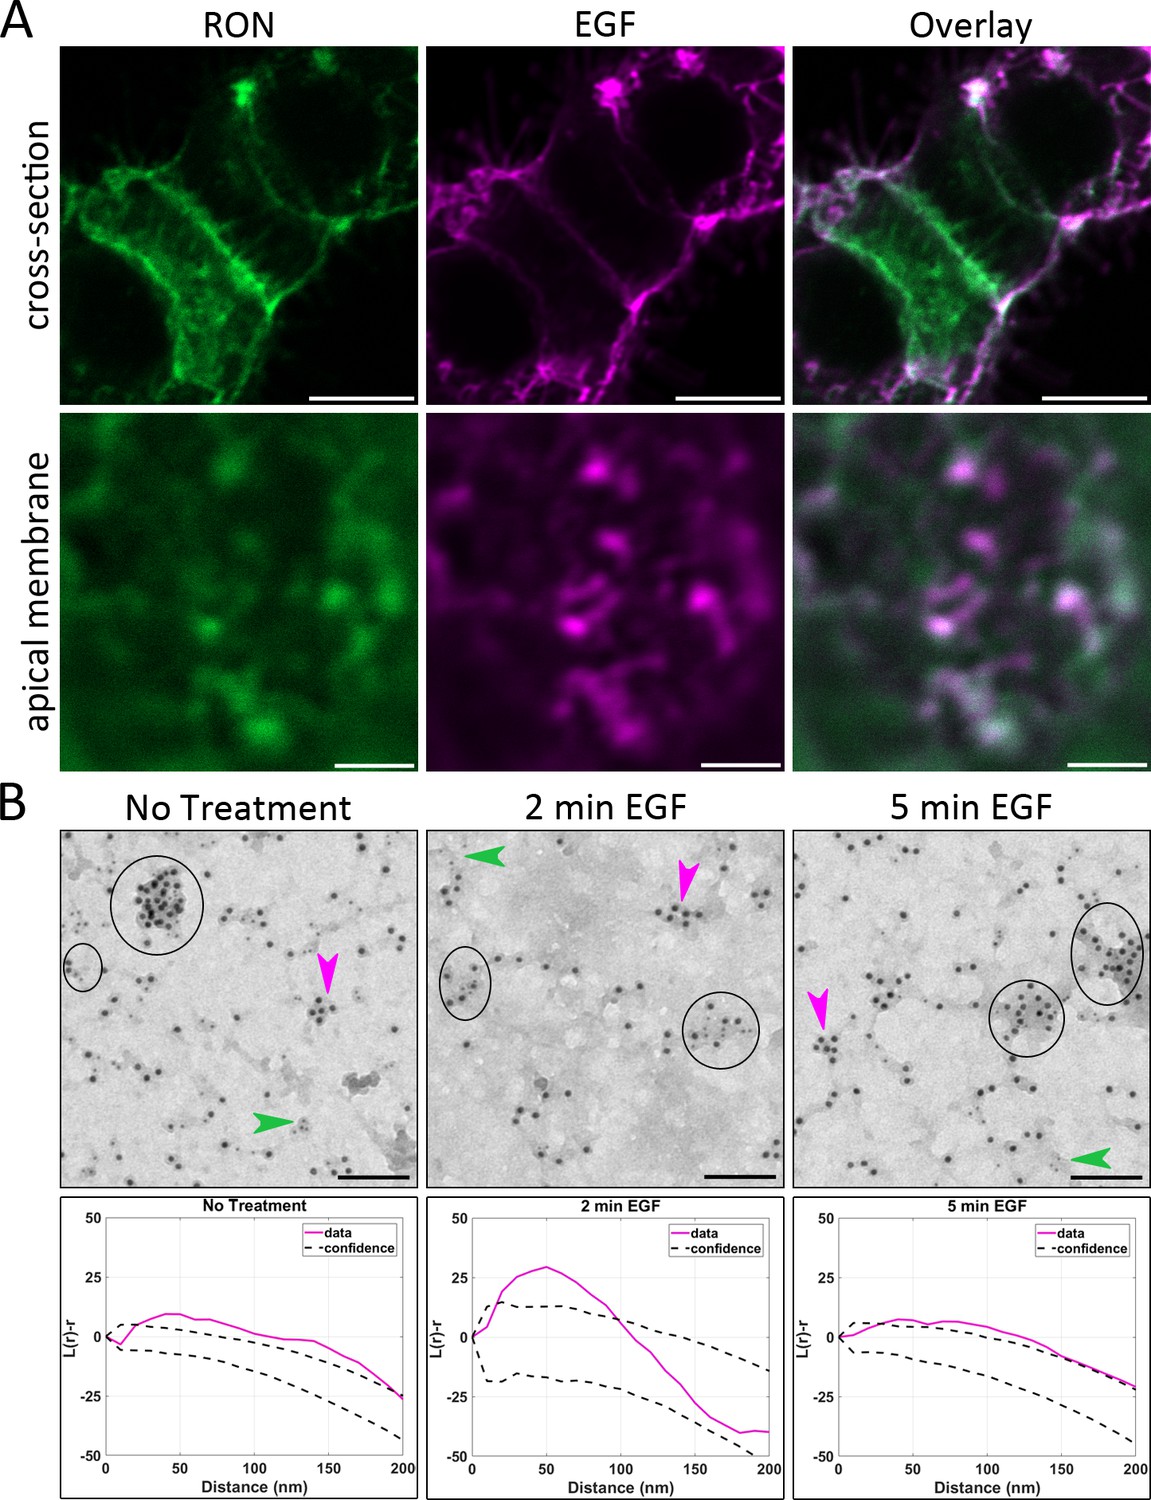
RON and EGFR co-cluster in plasma membrane nanodomains.
(A) HEKRON/EGFR cells were first labeled for RON using ⍺-HA-FITC Fab fragment (green), treated with 10 nM EGF-AF647 (magenta) for 5 min on ice and then fixed. Representative images from three biological replicates show colocalization of RON and EGFR at the plasma membrane. Scale bars, 10 μm (cross-section) and 2 μm (apical membrane). (B) Top row: Membrane sheets were prepared from A431RON cells ± 50 nM EGF for 2 and 5 min. Sheets were labeled on the cytoplasmic face using antibodies to RON (6 nm gold) and EGFR (12 nm gold). Circles indicate co-clusters of RON and EGFR in representative images from three biological replicates; arrowheads indicate clusters containing RON (green) or EGFR (magenta) only. Scale bar, 100 nm. Bottom row: Ripley’s K bivariant function was used to evaluate co-clustering. The experimental values for L(r)-r (corresponding to EM image directly above) are shown in magenta and the 99% confidence window for complete spatial randomness is plotted as dashed lines. In each case, experimental values are seen to fall above the confidence window, indicating co-clustering.
Figure 2—figure supplement 1
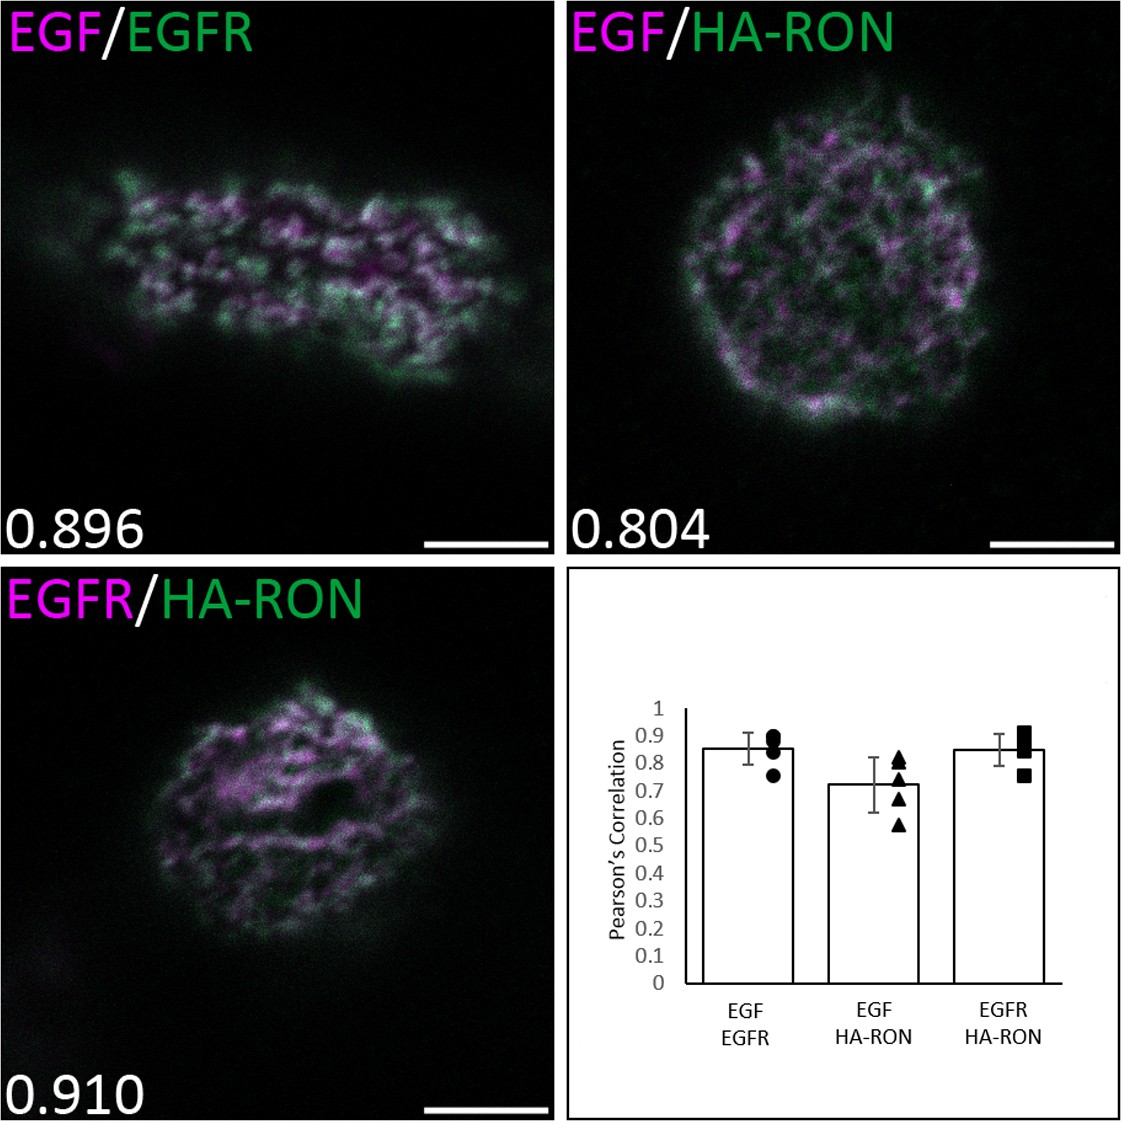
Comparison of RON and EGFR colocalization using fluorescent EGF or anti-EGFR (R1, Santa Cruz) antibody in A431RON cells.
Control sample of EGF-AF647 and anti-EGFR-AF488 shows the expected high colocalization (top left). Labeling of EGFR by either EGF-AF647 (ligand-bound, top right) or anti-EGFR-AF647 (no ligand, bottom left) both show high colocalization with HA-RON (anti-HA-AF488). Pearson’s Coefficient for the cell shown is indicated in the bottom left corner of the respective image. Five cells were analyzed per condition and averages ± SD are shown in the bar graph. Scale bars, 5 µm.
-
Figure 2—figure supplement 1—source data 1
Source data for colocalization analysis in Figure 2—figure supplement 1.
- https://cdn.elifesciences.org/articles/63678/elife-63678-fig2-figsupp1-data1-v2.xlsx
Figure 2—figure supplement 2
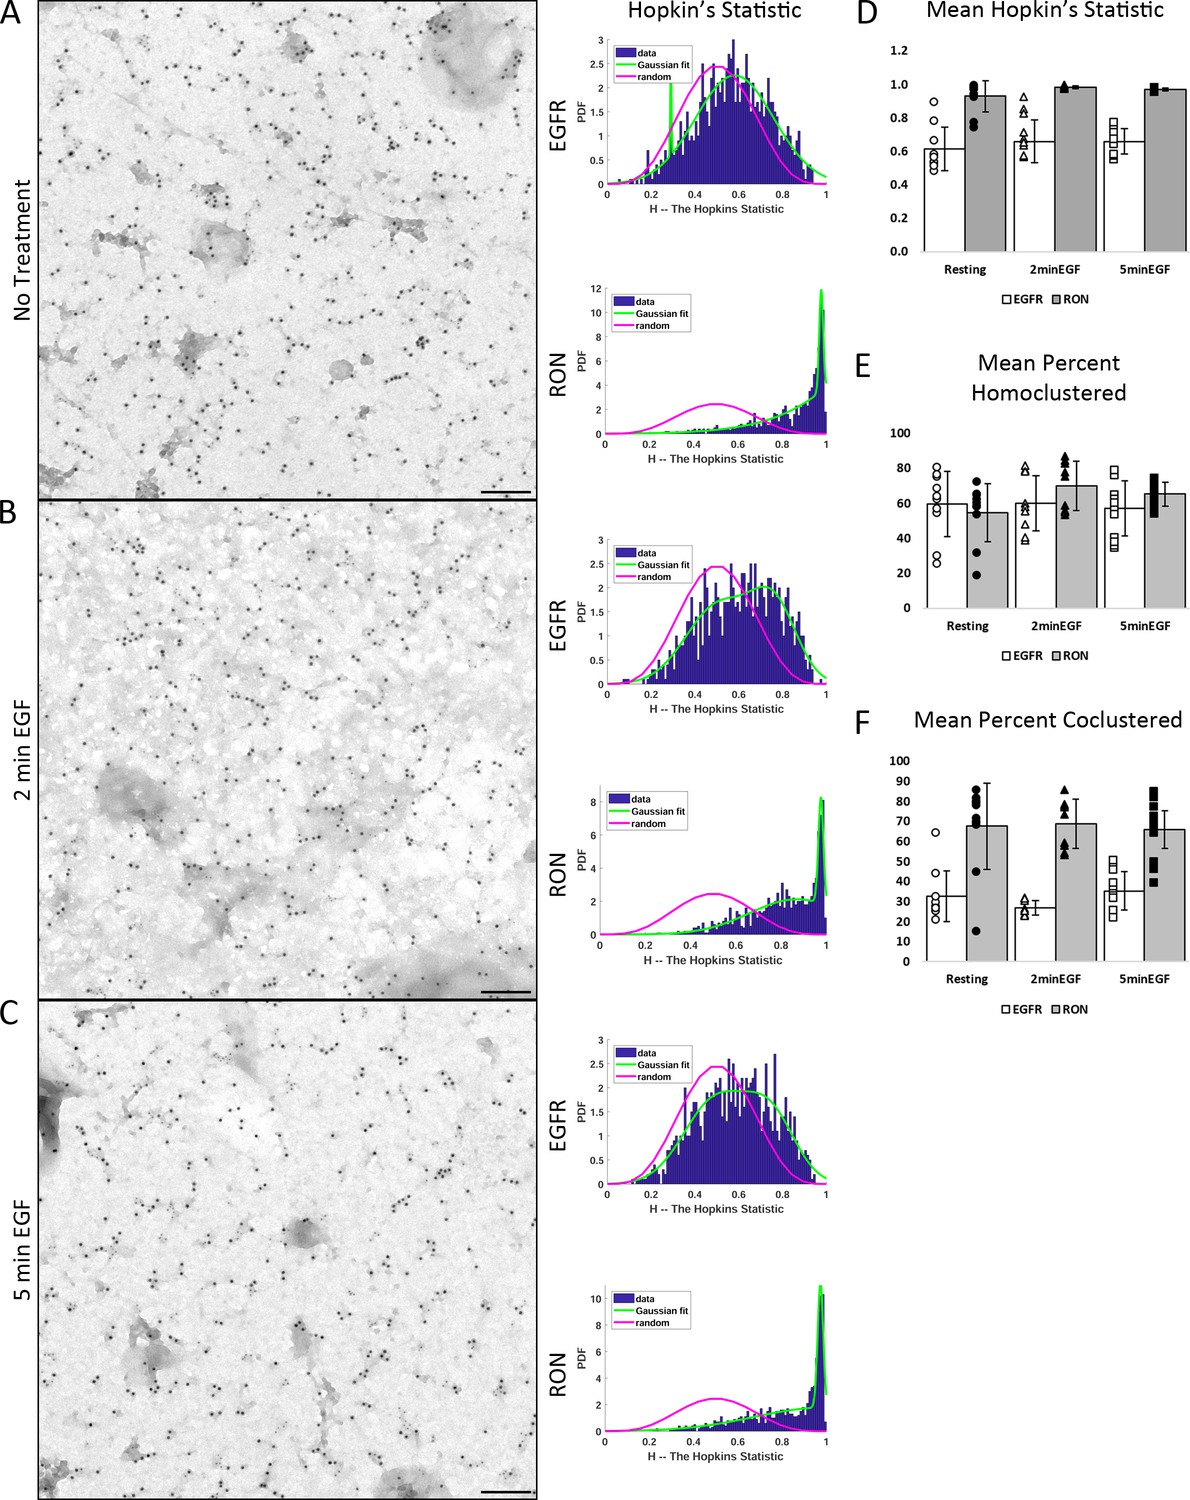
Additional EM Analysis.
(A–C) Examples of membrane sheets prepared from A431RON ± 50 nM EGF for 2 and 5 min. Sheets were labeled on the cytoplasmic face using antibodies to RON (6 nm gold) and EGFR (12 nm gold). Hopkin’s analysis (right) was performed to determine extent of homoclustering. In all cases, the data (blue bars) is shifted to the right of random distribution (pink line), indicating receptors are homoclustered on the membrane. Green line is the fit of the data to a Gaussian to extract peak Hopkin’s value for averaging as seen in (D). Scale bar, 100 nm. (D) Mean Hopkin’s Statistic across conditions, where values are taken from fitting the data to a Gaussian distribution as shown in (A–C) (green line). Values > 0.5 indicate non-random, homoclustered distribution. (E) Calculation of the percent of each receptor found within a cluster. RON and EGFR both have high propensity to homocluster, with >50% of each receptor found within homoclusters. (F) Calculation of the percent of receptors found within a heterocluster. ~30% of all EGFR molecules are identified as coclustered with RON, while ~70% of all RON molecules are coclustered with EGFR. Analysis for D, E performed as described in Espinoza et al., 2012.
-
Figure 2—figure supplement 2—source data 1
Source data for EM quantification in Figure 2—figure supplement 2.
- https://cdn.elifesciences.org/articles/63678/elife-63678-fig2-figsupp2-data1-v2.xlsx
Figure 3 with 2 supplements
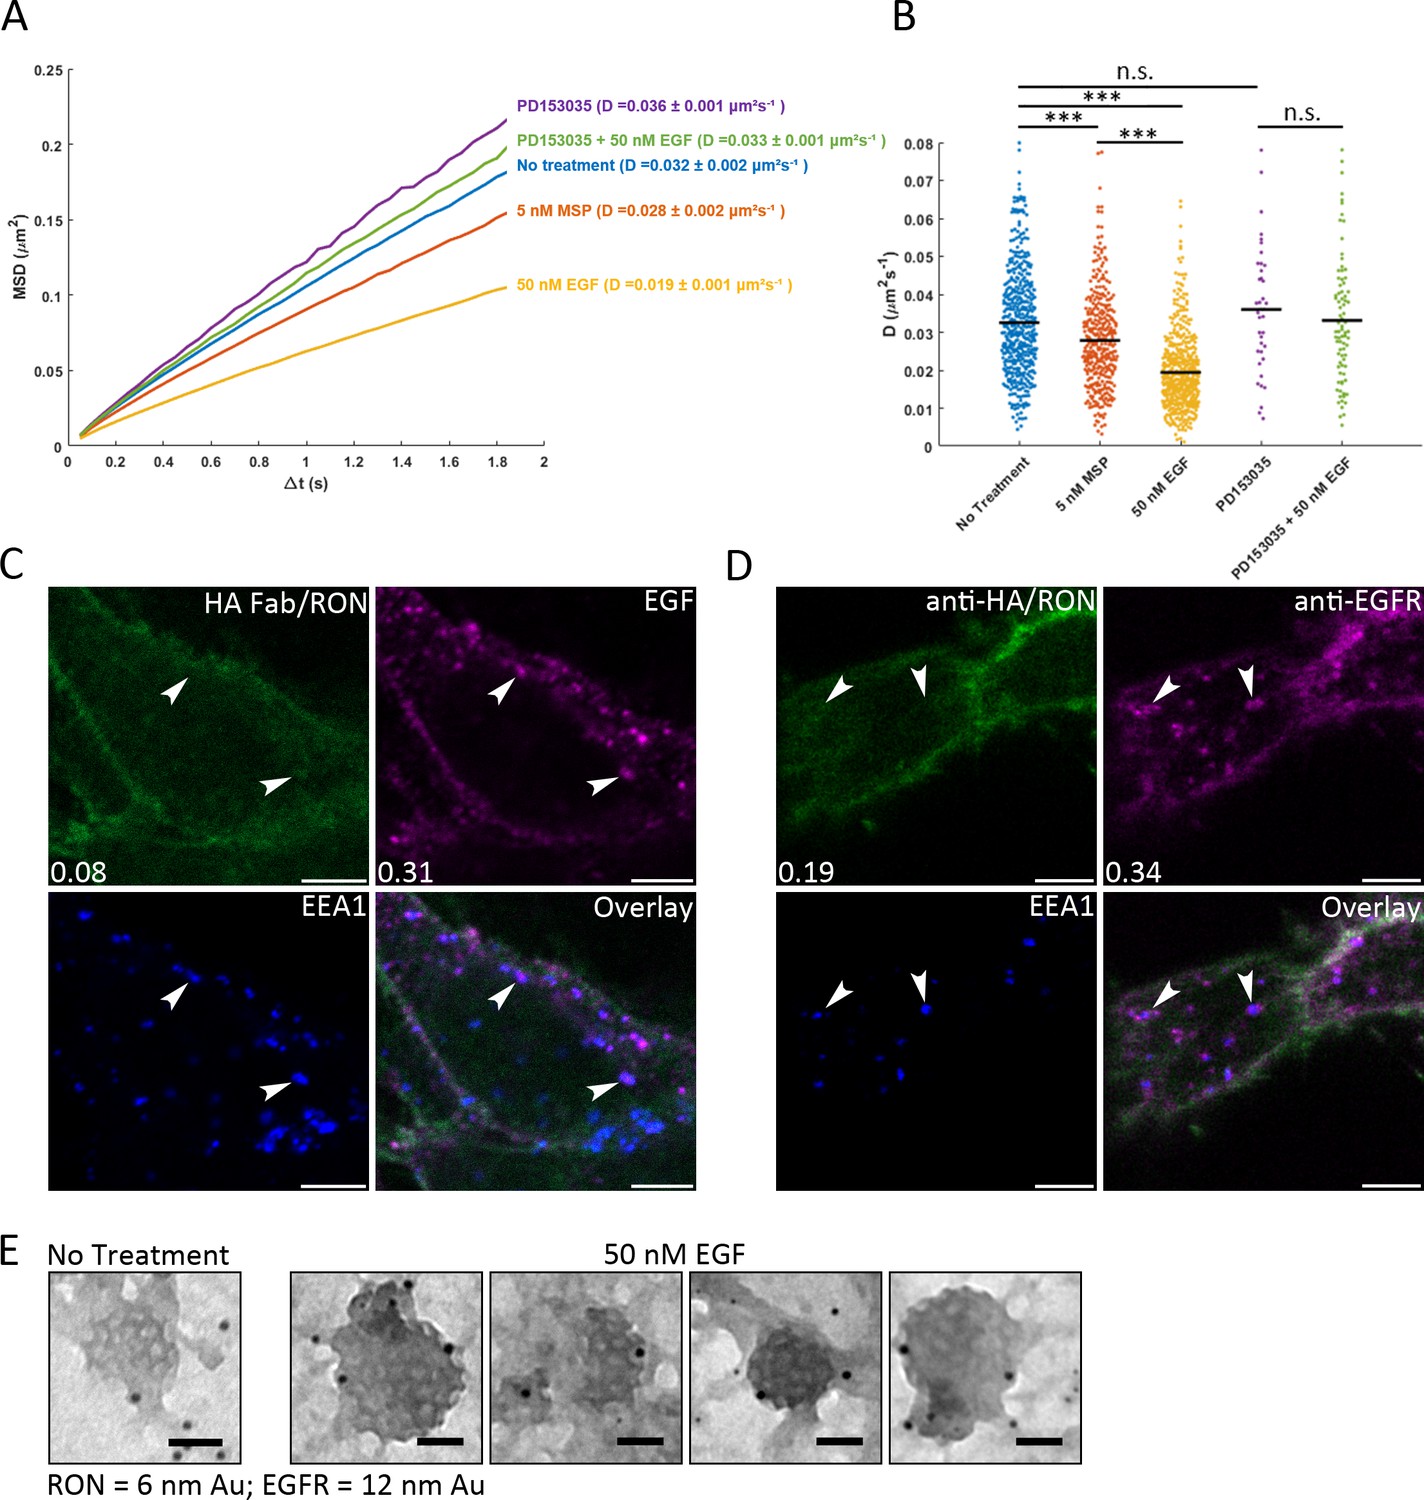
Crosstalk occurs at the plasma membrane.
(A) Single particle tracking of QD605-HA-RON was used to quantify RON mobility on A431RON cells ± ligand. Ensemble mean squared displacement (MSD) shows reduction in slope of the MSD with ligand stimulation, indicating a reduced mobility. Treatment with EGFR kinase inhibitor prevents RON slow down with EGF. The number of jumps fit for each condition range from 42,183 to 898,300. (B) Corresponding distribution of diffusion coefficients, D, for individual cells is plotted for arange of 39 to 517 cells per condition; *** p < 0.001. (C) HEKRON/EGFR cells were labeled for RON with anti-HA-FITC Fab fragment (green), treated with 10 nM EGF-AF647 (magenta) for 5 min on ice followed by 10 min at 37°C, then fixed and labeled with an antibody to EEA1 (early endosomes, blue). Representative images from three biological replicates show that EGF-positive endosomes (arrows) primarily do not contain RON. Pearson’s coefficient for the image shown and colocalization with EEA1 is shown in the bottom left corner. (D) Alternative labeling method for monitoring endosome content where HEKRON/EGFR cells were treated with 50 nM EGF for 10 min at 37°C, fixed and then antibodies were used to label RON (anti-HA, green) or EGFR (magenta). Further quantification for C, D is in Figure 3—figure supplement 2. (E) Membrane sheets prepared from A431RON cells ± 50 nM EGF for 5 min were labeled for RON (6 nm gold) or EGFR (12 nm gold). TEM images show clathrin-coated pit lattices on the cell membranes containing EGFR, but not RON. Scale bars, 50 nm.
-
Figure 3—source data 1
Source data for diffusion coefficient distributions in Figure 3B.
- https://cdn.elifesciences.org/articles/63678/elife-63678-fig3-data1-v2.xlsx
Figure 3—figure supplement 1
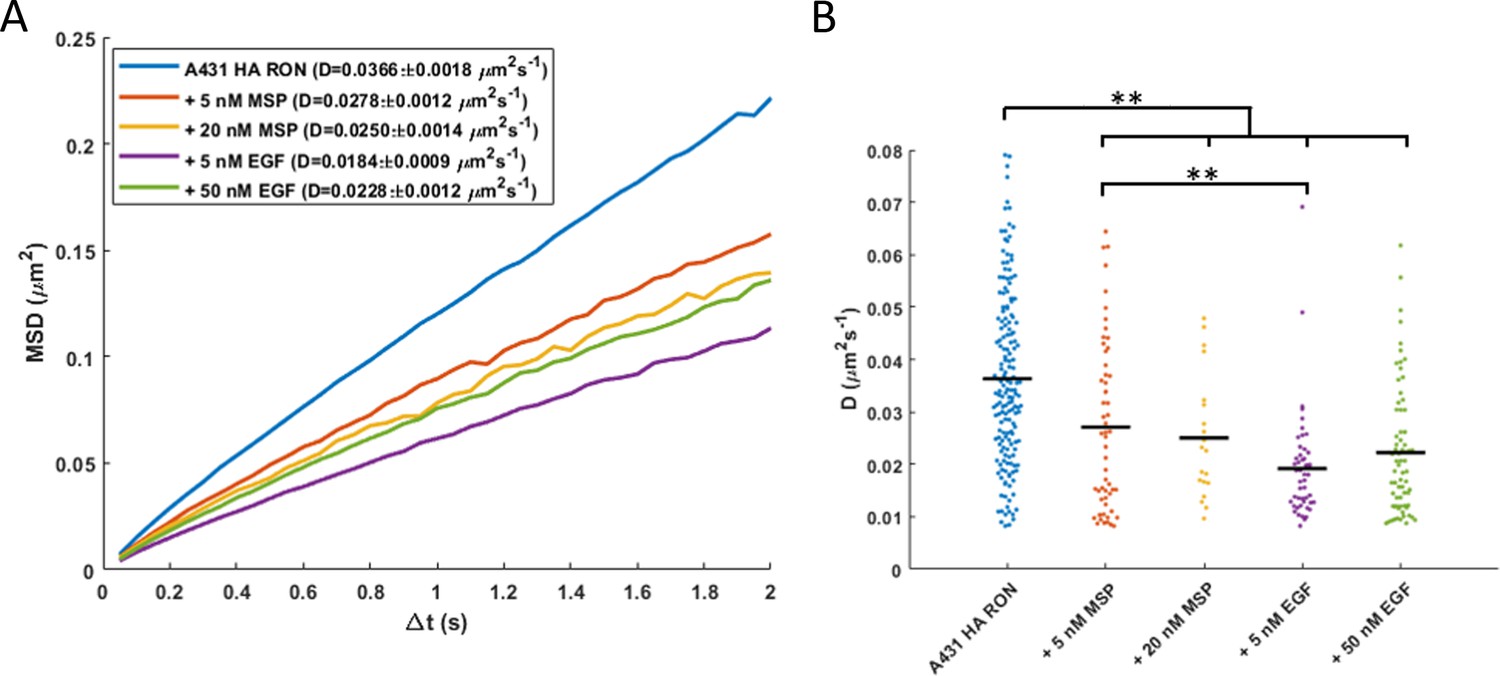
RON mobility is reduced in response to bothlow/physiological and high/saturating doses of ligand.
HA-RON was tracked asdescribed in Figure 3A, B. (A) Ensemble mean square displacement (MSD) isplotted for range of 16,966 to 153,259 jumps fit per condition, and (B) diffusioncoefficient distribution across cells is plotted for a range of 20 to 171 cells percondition. ** p<0.01.
-
Figure 3—figure supplement 1—source data 1
Source data for diffusion coefficient distributions in Figure 3—figure supplement 1, panel B.
- https://cdn.elifesciences.org/articles/63678/elife-63678-fig3-figsupp1-data1-v2.xlsx
Figure 3—figure supplement 2
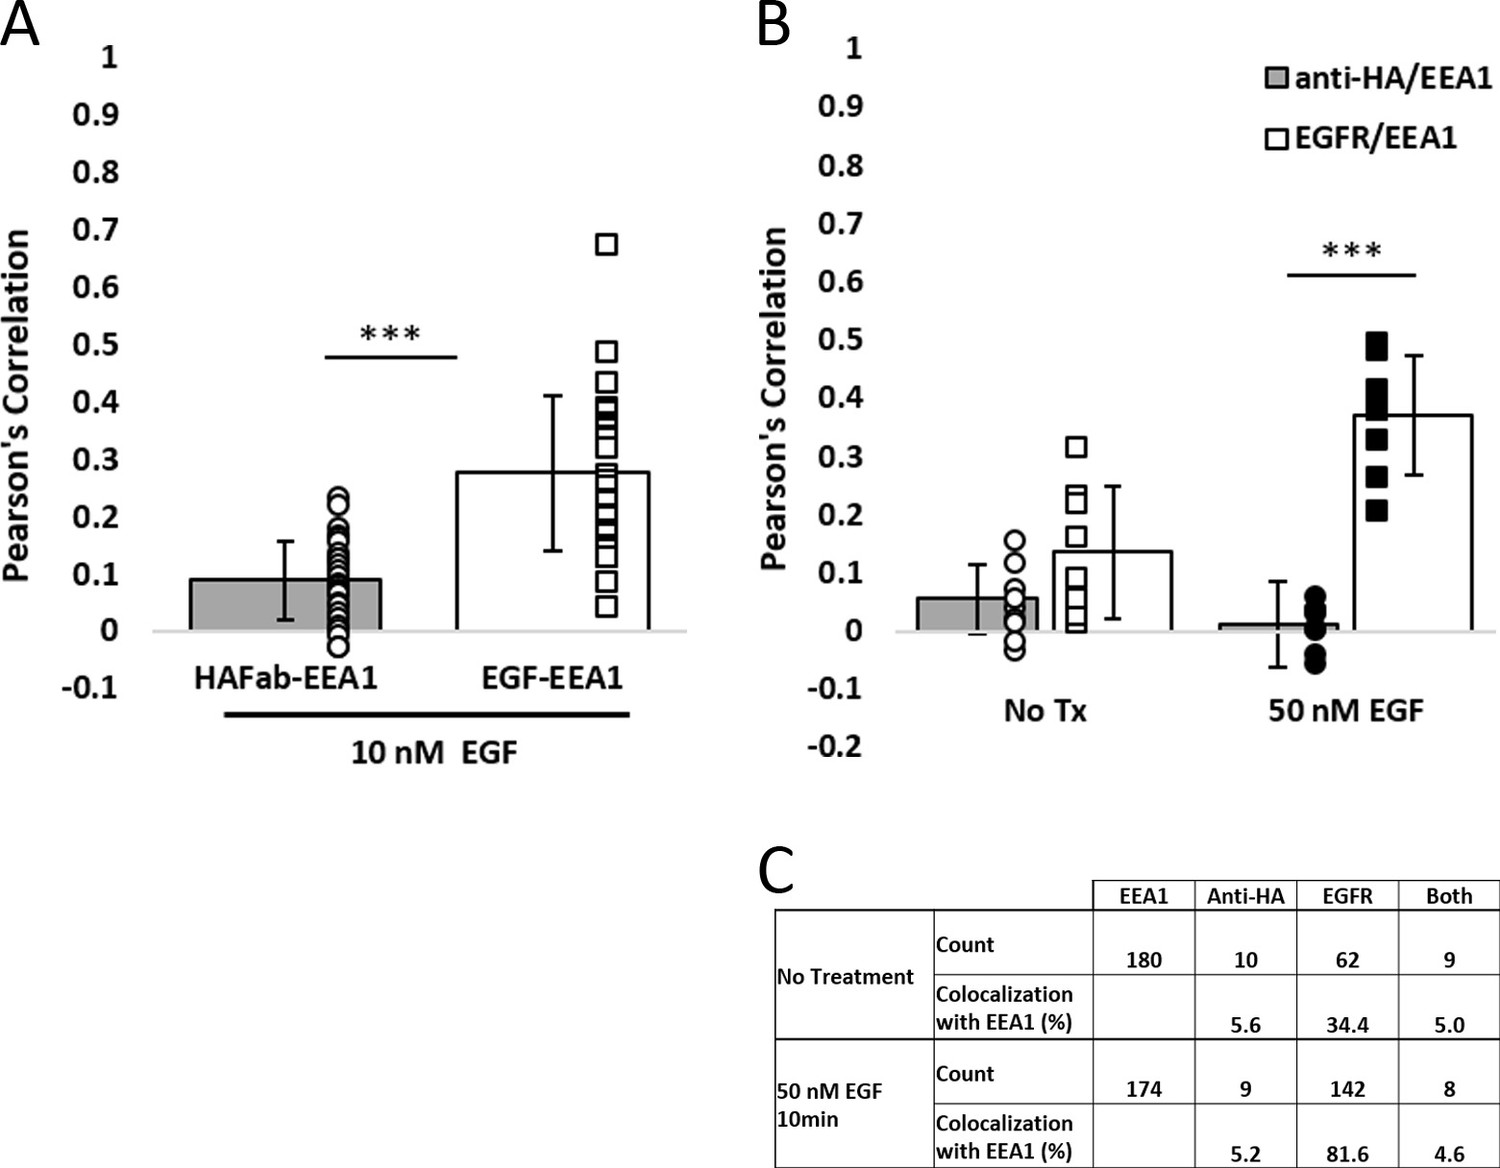
EGFR is more readily found in EEA1-positive early endosomes than RON after EGF stimulation.
(A) Colocalization analysis for cells corresponding to treatment in Figure 3C, where RON is labeled live with anti-HA-Fab-FITC before addition of EGF-AF647. After 10 min of EGF-AF647 treatment, EGF is more colocalized with endosomes (EGF/EEA1) than RON (HAFab/EEA1). (B) Colocalization analysis for cells corresponding to Figure 3D. Here, cells are treated with ±50 nM EGF, then fixed and labeled with fluorescently-labeled primary antibodies to RON (anti-HA) or EGFR. Colocalization with EEA1 is low for both receptors in the resting state (No Tx). After EGF treatment, a significant increase in Pearson’s Correlation coefficient is seen for EGFR/EEA1 colocalization, but not for RON/EEA1. (C) Calculation of the fraction of endosomes containing either EGFR or RON or both, corresponding to (B). The fraction of RON-positive endosomes does not increase with EGF stimulation. 180 (No treatment) and 174 (50 nM EGF) endosomes were analyzed across 14 cells for each condition.
-
Figure 3—figure supplement 2—source data 1
Source data for colocalization analysis in Figure 3—figure supplement 2.
- https://cdn.elifesciences.org/articles/63678/elife-63678-fig3-figsupp2-data1-v2.xlsx
Figure 4 with 10 supplements
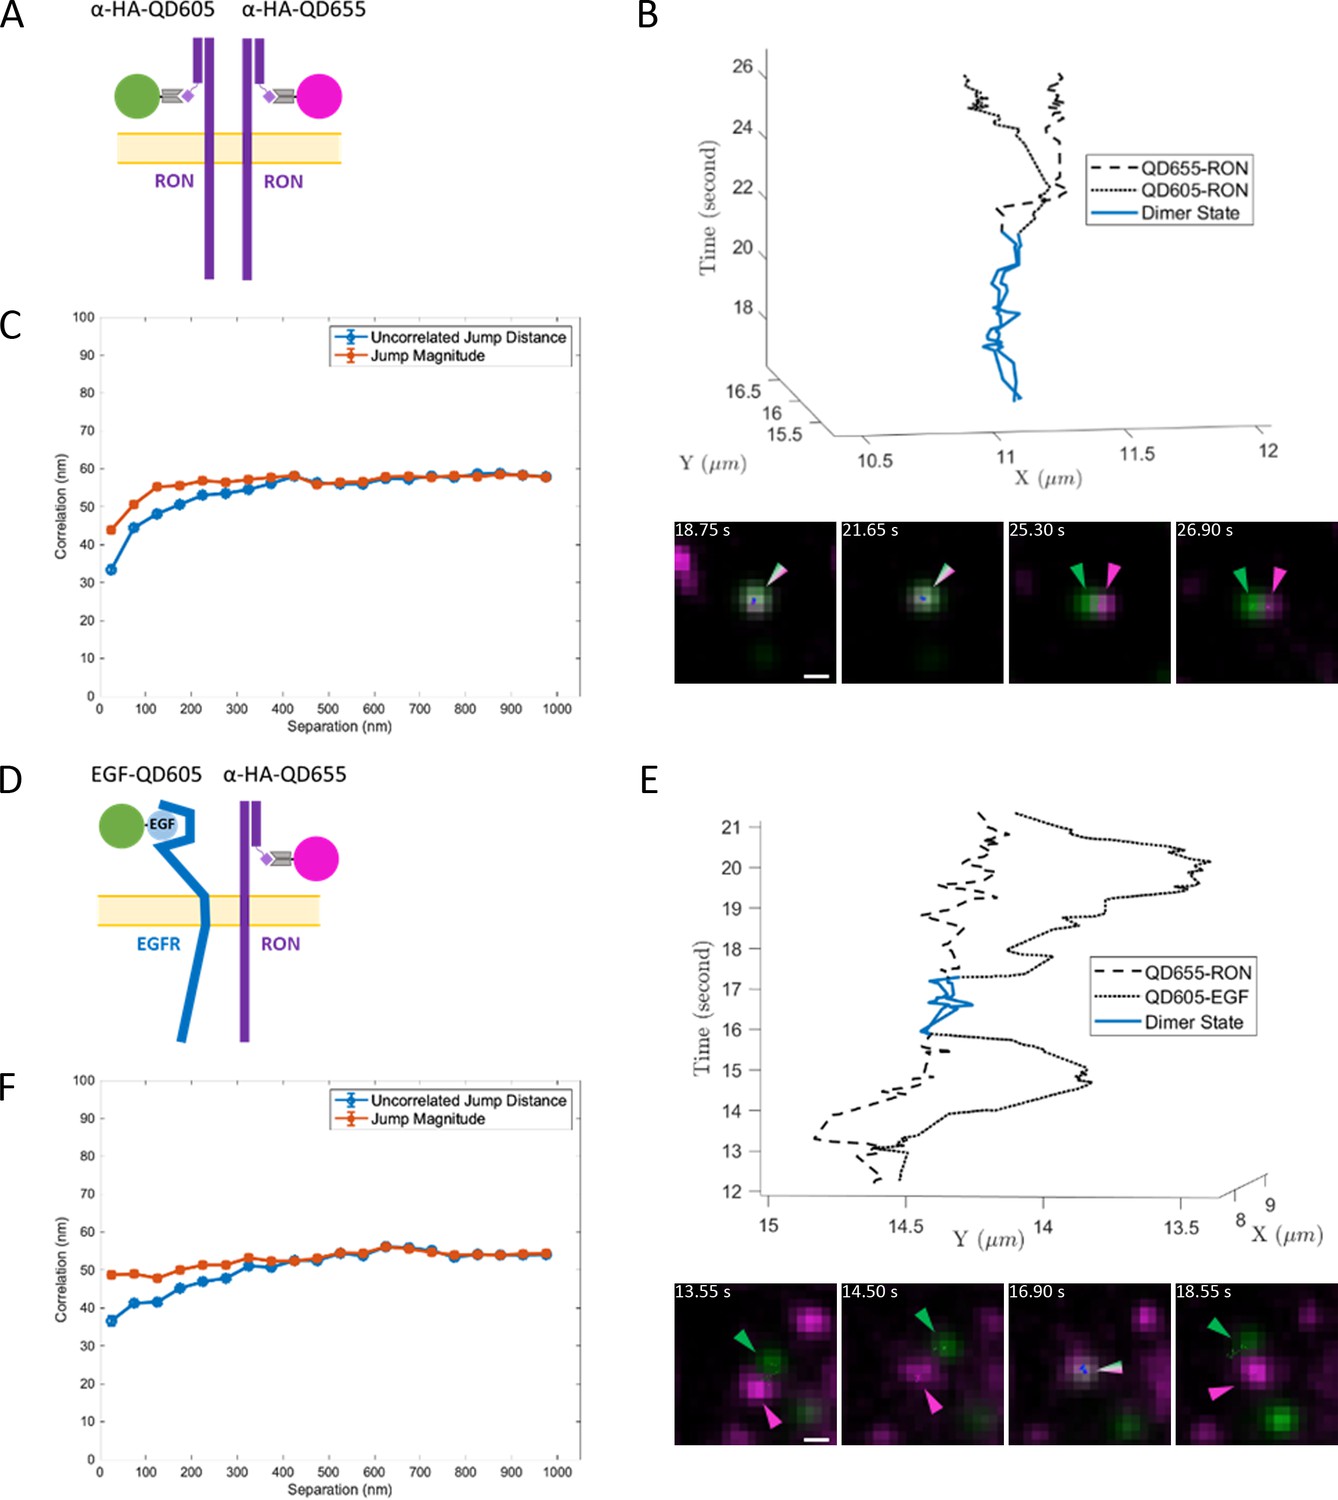
Two-color single QD tracking captures interactions between RON and EGFR.
Two color SPT results for resting RON receptor interactions (A–C) and ligand-bound EGFR interactions with RON (D–F). (A) Schematic representation of two-color (anti-HA-QD605 and anti-HA-QD655) RON SPT. (B) Representative 3D trajectory (top) and time series (bottom) for a RON homo-interaction lasting ~5 s (blue) with accompanying Figure 4—video 1. Scale bar, 500 nm. (C) Ensemble correlated motion plot for all two-color RON tracking. The number of jumps for each data point range from 2,068–15,649. (D) Schematic representation of two-color SPT of EGF-bound EGFR (QD655-EGF) and RON (anti-HA-QD605). (E) Sample 3D trajectory (top) and time series (bottom) showing EGF-EGFR and RON interacting for ~1.5 s (blue) with accompanying Figure 4—video 2. Scale bar, 500 nm. (F) Ensemble correlated motion plot for all EGF-EGFR and RON tracking. The number of jumps for each data point range from 1,500–16,794.
Figure 4—figure supplement 1
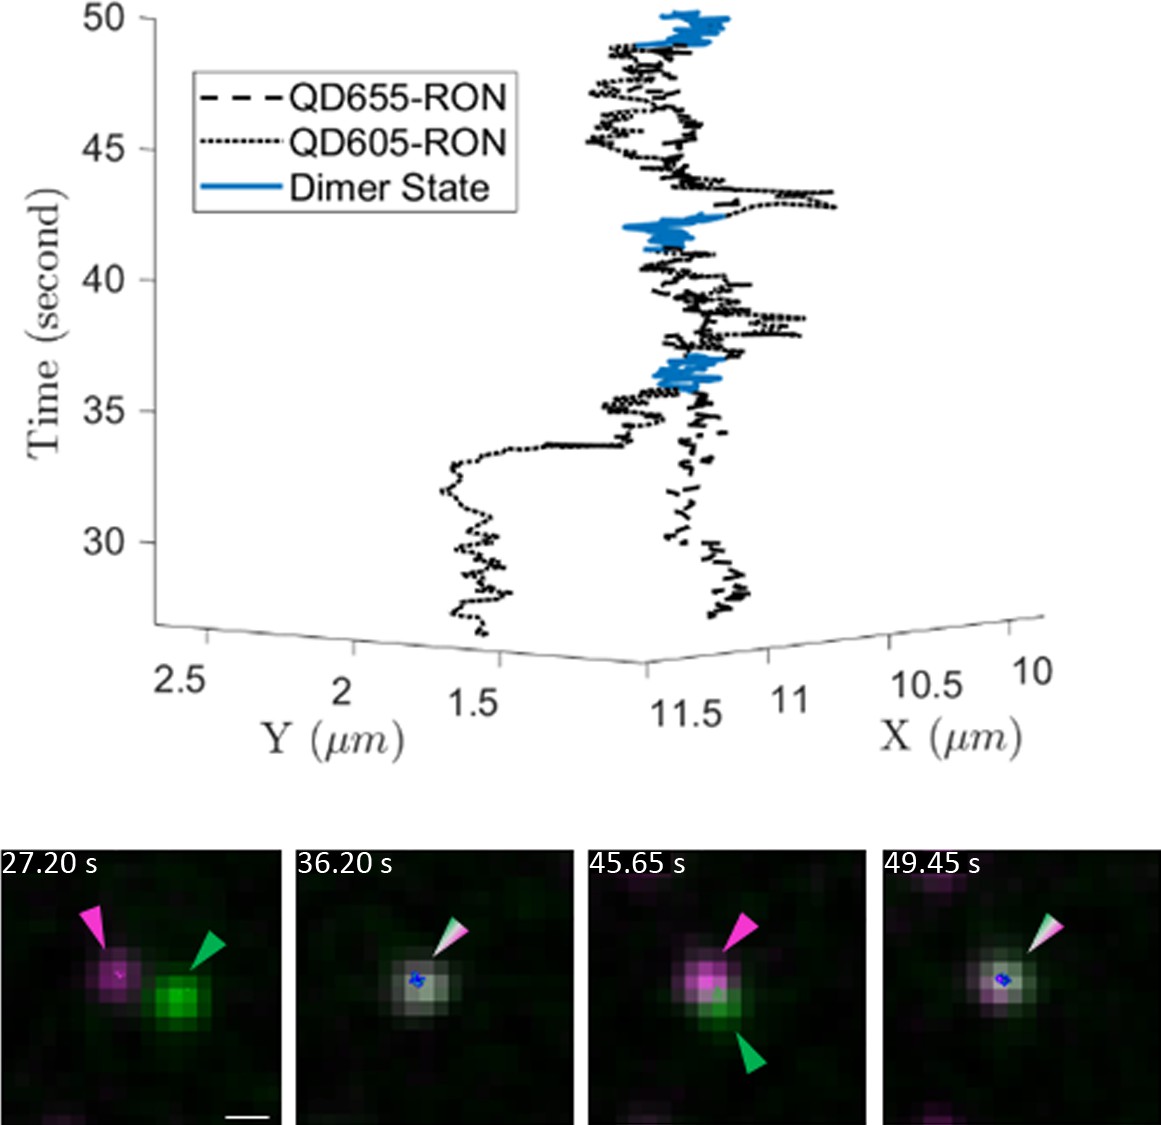
Example 3D trajectory (top) of two QD-RON receptors that engaged in repeated transient interactions (blue segments).
Still images are shown below the 3D trajectory. Scale bar, 500 nm.
Figure 4—figure supplement 2
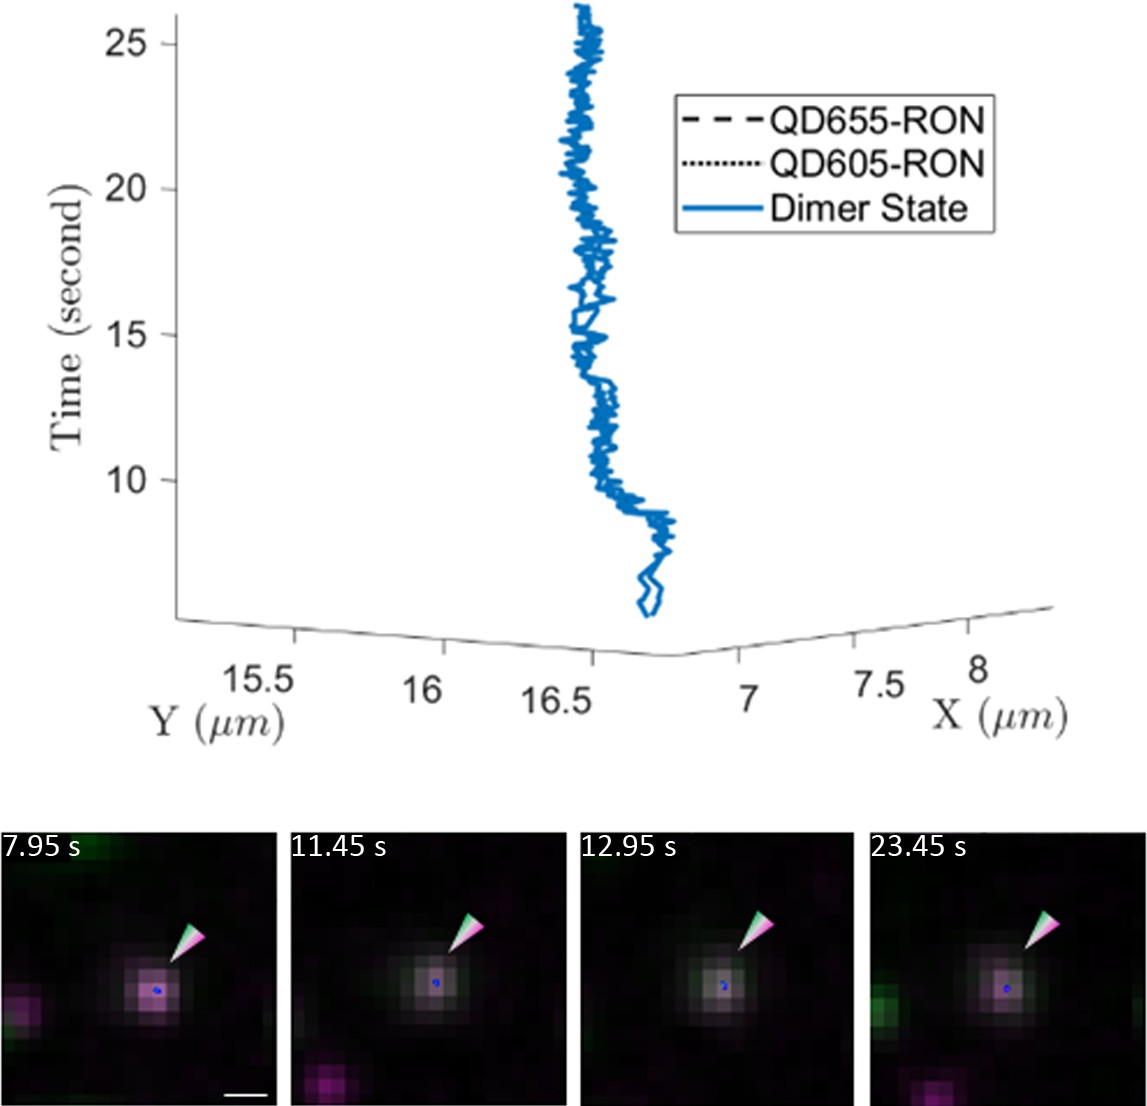
Example 3D trajectory (top) of a long-lived (~22 s) interaction between two QD-RON receptors.
Still images are shown below the 3D trajectory. Scale bar, 500 nm.
Figure 4—figure supplement 3
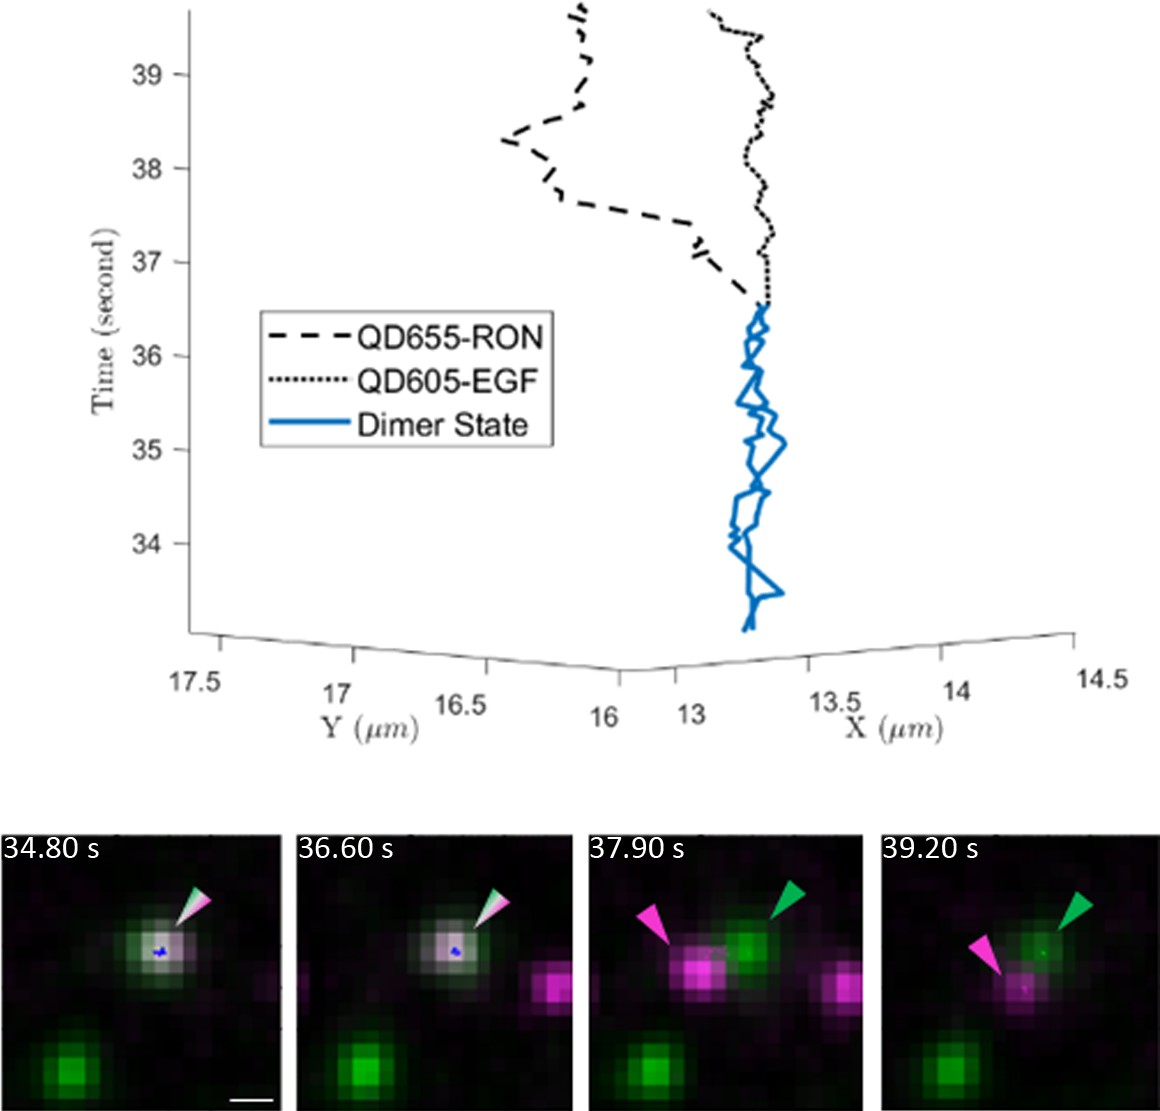
Example 3D trajectory (top) of EGF-bound EGFR and RON receptors that are initially found in a dimer complex (blue) that then dissociates at 36.5 s.
Still images are shown below the 3D trajectory. Scale bar, 500 nm.
Figure 4—figure supplement 4
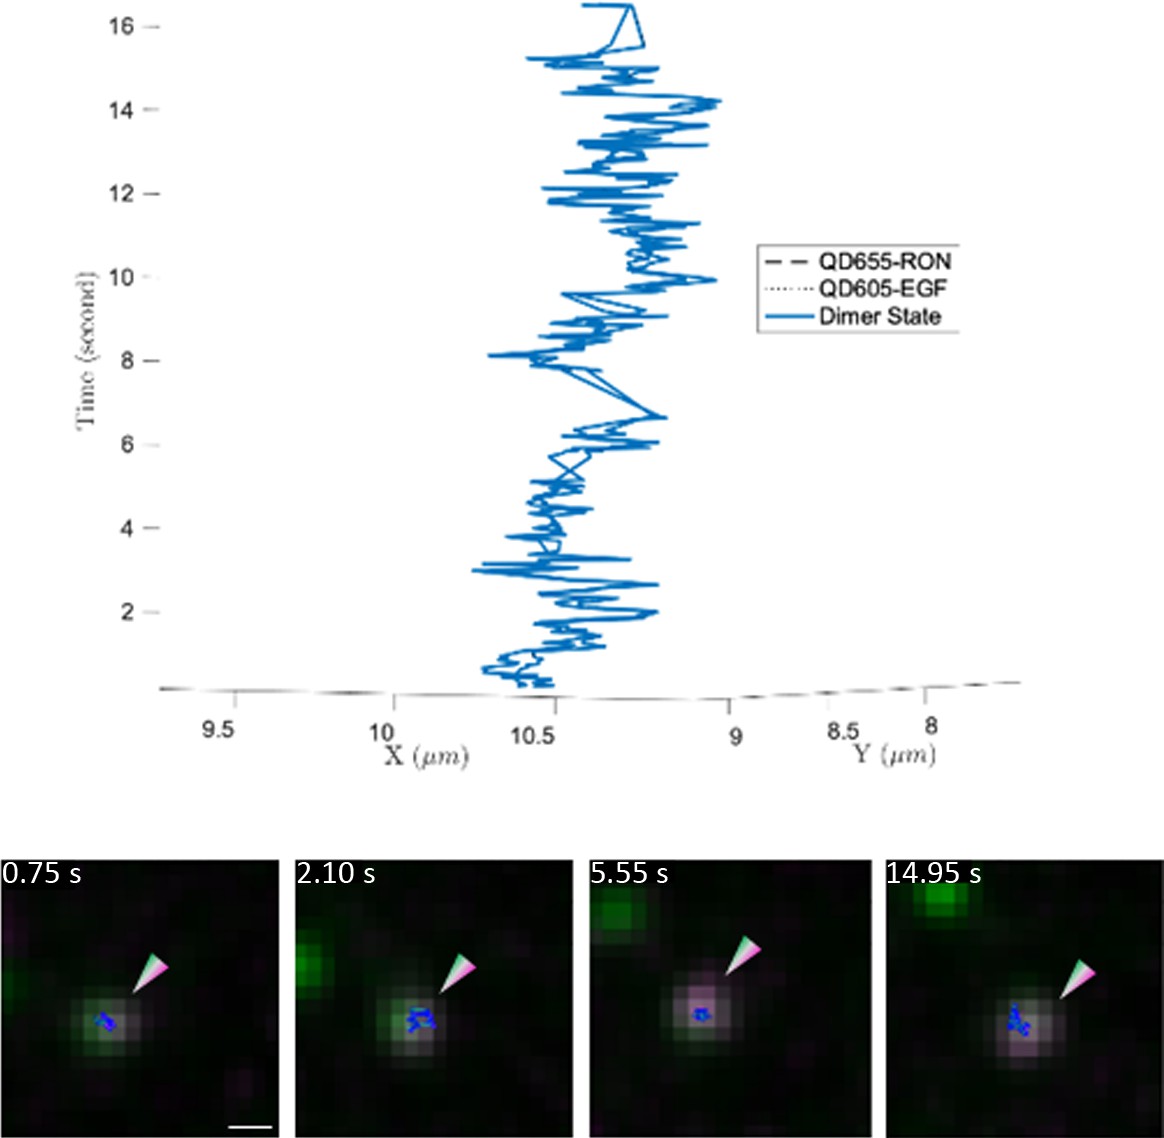
Example 3D trajectory (top) of a long-lived (~16 s) interaction between EGF-bound EGFR and RON receptors.
Still images are shown below the 3D trajectory. Scale bar, 500 nm.
Figure 4—video 1
Two RON receptors are engaged in an interaction from the start of the video, which lasts for ~5 s before the receptors dissociate.
This movie accompanies the interaction shown in Figure 4B. QD605 is displayed in green and QD655 in magenta. A colored tail for each QD shows a track of the previous 10 localizations. Playback speed is 20 frames/sec. Images have been brightness and contrasts enhanced for visualization.
Figure 4—video 2
A short-lived interaction between QD605-EGF-EGFR (green) and QD655-RON (magenta).
This movie accompanies the interaction shown in Figure 4E. A colored tail for each QD shows a track of the previous 10 localizations. Playback speed is 20 frames/s. Images have been brightness and contrasts enhanced for visualization.
Figure 4—video 3
Two RON receptors undergoing repeated interactions that each last 1–2 s.
This movie accompanies the interaction shown in Supplement 1. Color scheme, comet tail, and playback speed are as previously mentioned for Figure 4—video 1.
Figure 4—video 4
A long-lived RON/RON interaction.
This movie accompanies the interaction shown in Supplement 3. Color scheme, comet tail, and playback speed are as previously mentioned for Figure 4—video 1.
Figure 4—video 5
A complex of EGF-EGFR and RON is seen to break apart after a ~ 3.5 s dimer event.
This movie accompanies the interaction shown in Supplement 5. Color scheme, comet tail, and playback speed are as previously mentioned for Figure 4—video 2.
Figure 4—video 6
A long-lived interaction between EGF-EGFR and RON.
This movie accompanies the interaction shown in Supplement 7. Color scheme, comet tail, and playback speed are as previously mentioned for Figure 4—video 2.
Figure 5 with 2 supplements
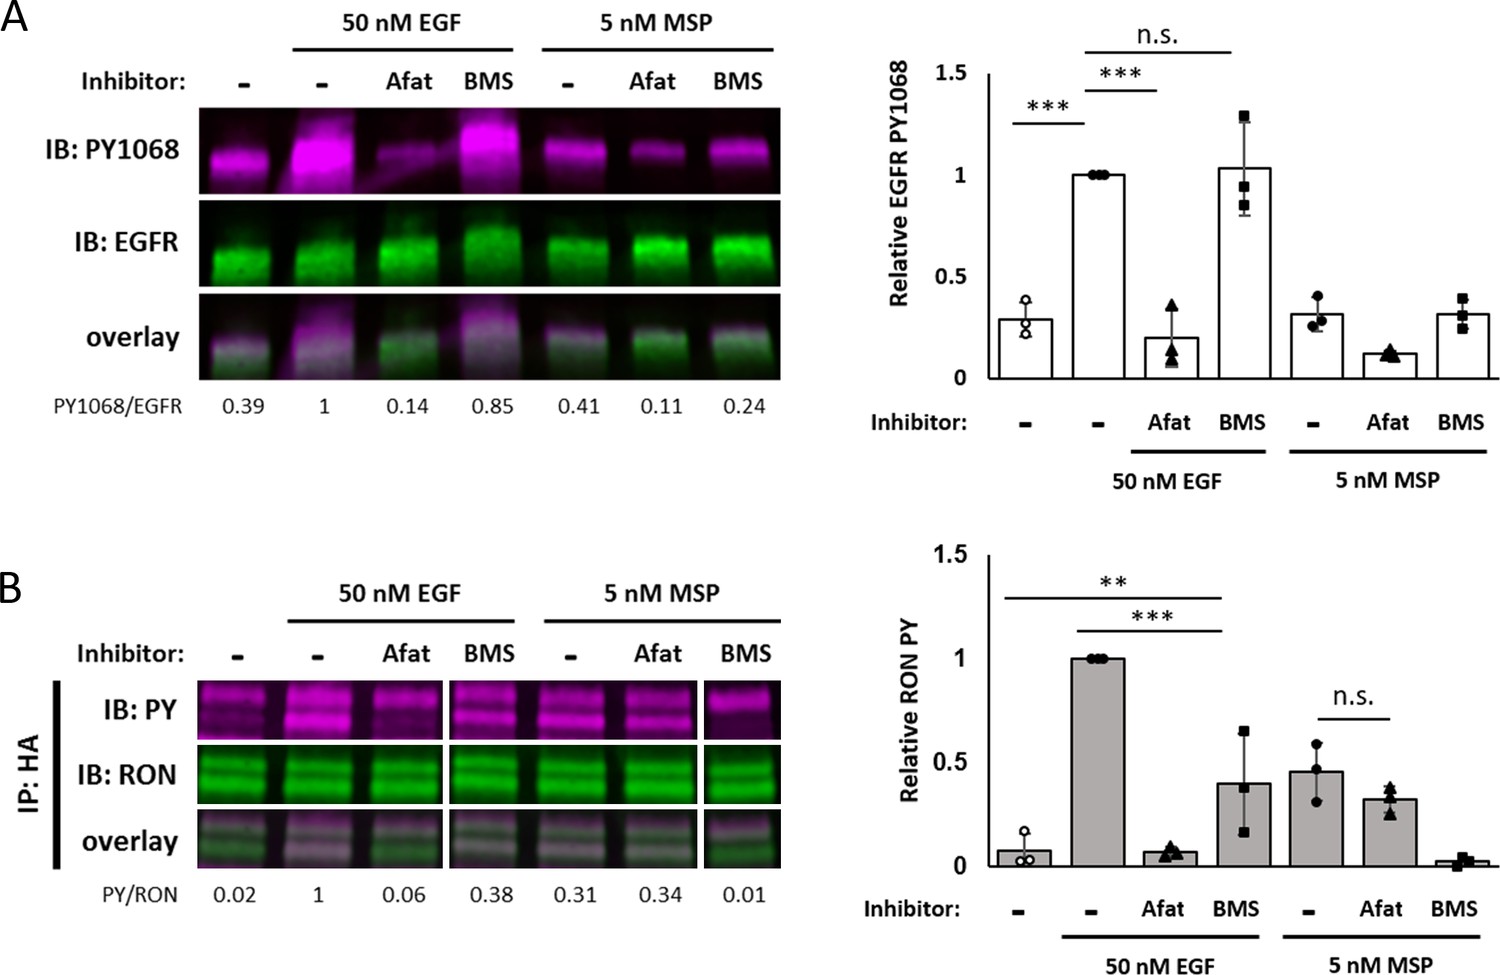
Maximal EGF-induced RON phosphorylation requires kinase activity of both receptors.
(A and B) A431RON cells were pre-treated with 10 μM afatinib (Afat, pan-ErbB inhibitor) or 1 μM BMS777607 (BMS, Met family kinase inhibitor) for 20 or 15 min, respectively. Cells were then treated ± EGF or MSP for 5 min. (A) Cell lysates were used for PY1068 and EGFR immunoblots. (B) Lysates were immunoprecipitated (IP) with an anti-HA antibody and then immunoblotted for PY and RON. All samples are from the same blot, but an extraneous lane was removed for clarity. Bar graphs are corresponding mean ± SD from triplicate biological experiments. * p < 0.05; ** p < 0.01; *** p < 0.001.
-
Figure 5—source data 1
Full raw western blots and blots with relevant bands labelled, corresponding to Figure 5A,B.
- https://cdn.elifesciences.org/articles/63678/elife-63678-fig5-data1-v2.zip
-
Figure 5—source data 2
Source data for quantification of blots in Figure 5A,B.
- https://cdn.elifesciences.org/articles/63678/elife-63678-fig5-data2-v2.xlsx
Figure 5—figure supplement 1
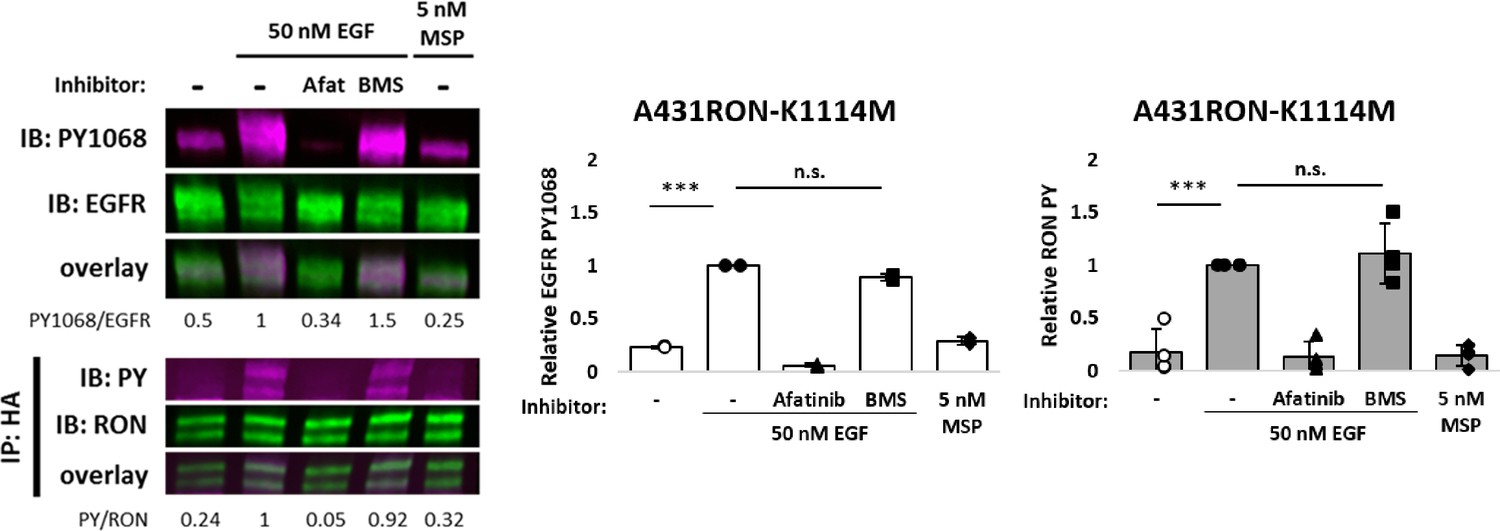
A431RON-K1114M (RON kinase-dead) cells were pre-treated, where indicated, with afatinib (Afat; pan-ErbB inhibitor) or BMS777607 (BMS; Met family kinase inhibitor) for 20 or 15 min, respectively.
Cells were subsequently treated with EGF or MSP for 5 min and lysed for immunoblot analysis. For RON and phospho-RON immunoblotting, lysates were IP with an anti-HA antibody (RON) and whole cell lysates used for EGFR and EGFR-PY1068, and their respective overlays. Triplicate experiments for EGFR (white bars) and RON (grey bars) phosphorylation are plotted as mean ± SD. *** p < 0.001.
-
Figure 5—figure supplement 1—source data 1
Full raw western blots and blots with relevant bands labelled, corresponding to Figure 5—figure supplement 1.
- https://cdn.elifesciences.org/articles/63678/elife-63678-fig5-figsupp1-data1-v2.zip
-
Figure 5—figure supplement 1—source data 2
Source data for quantification of blots in Figure 5—figure supplement 1.
- https://cdn.elifesciences.org/articles/63678/elife-63678-fig5-figsupp1-data2-v2.xlsx
Figure 5—figure supplement 2
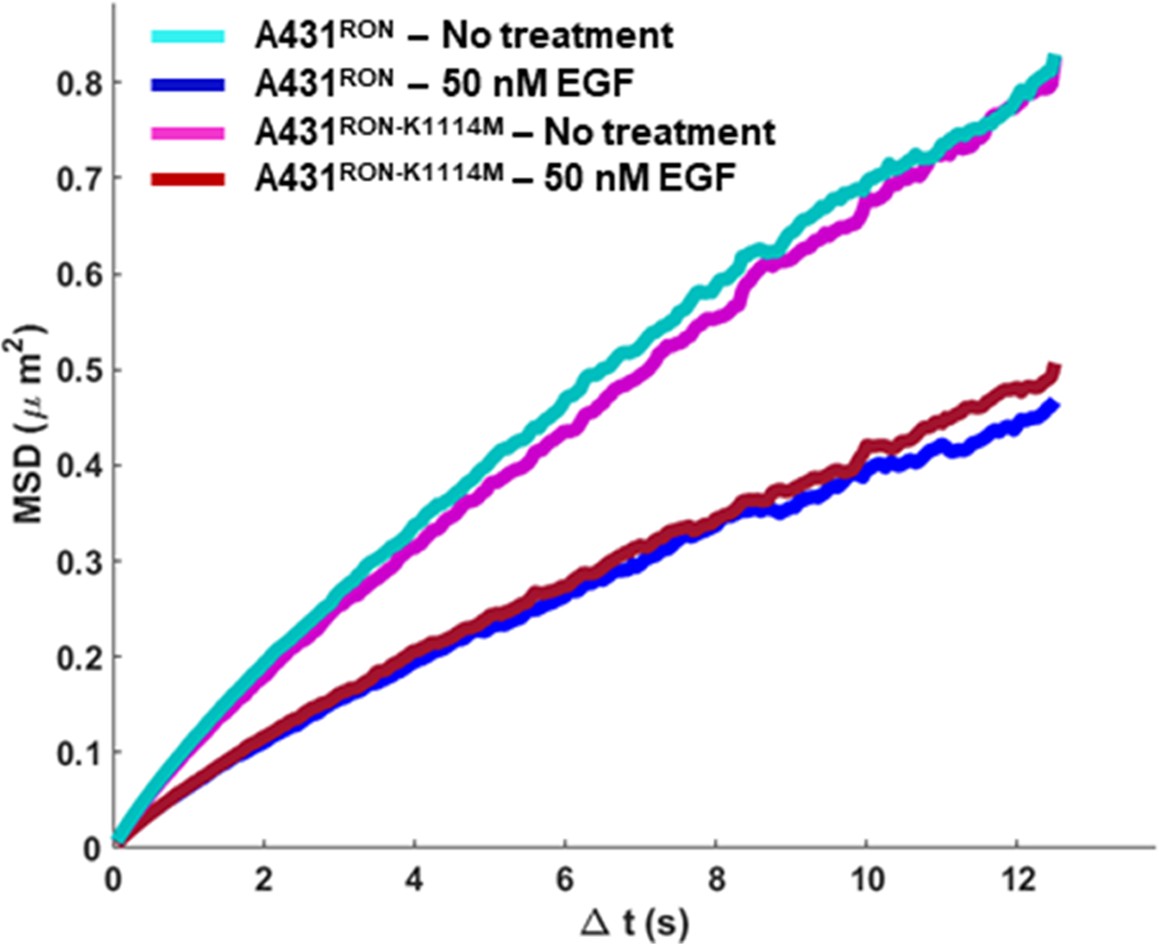
A431RON or A431RON-K1114M cells were treated ± EGF for 5 min before imaging.
RON diffusion was tracked using QD605-HA-RON and measured over time, displayed as an ensemble mean squared displacement (MSD) plot. A reduction in slope of the MSD indicates a reduced mobility.
Figure 6 with 2 supplements
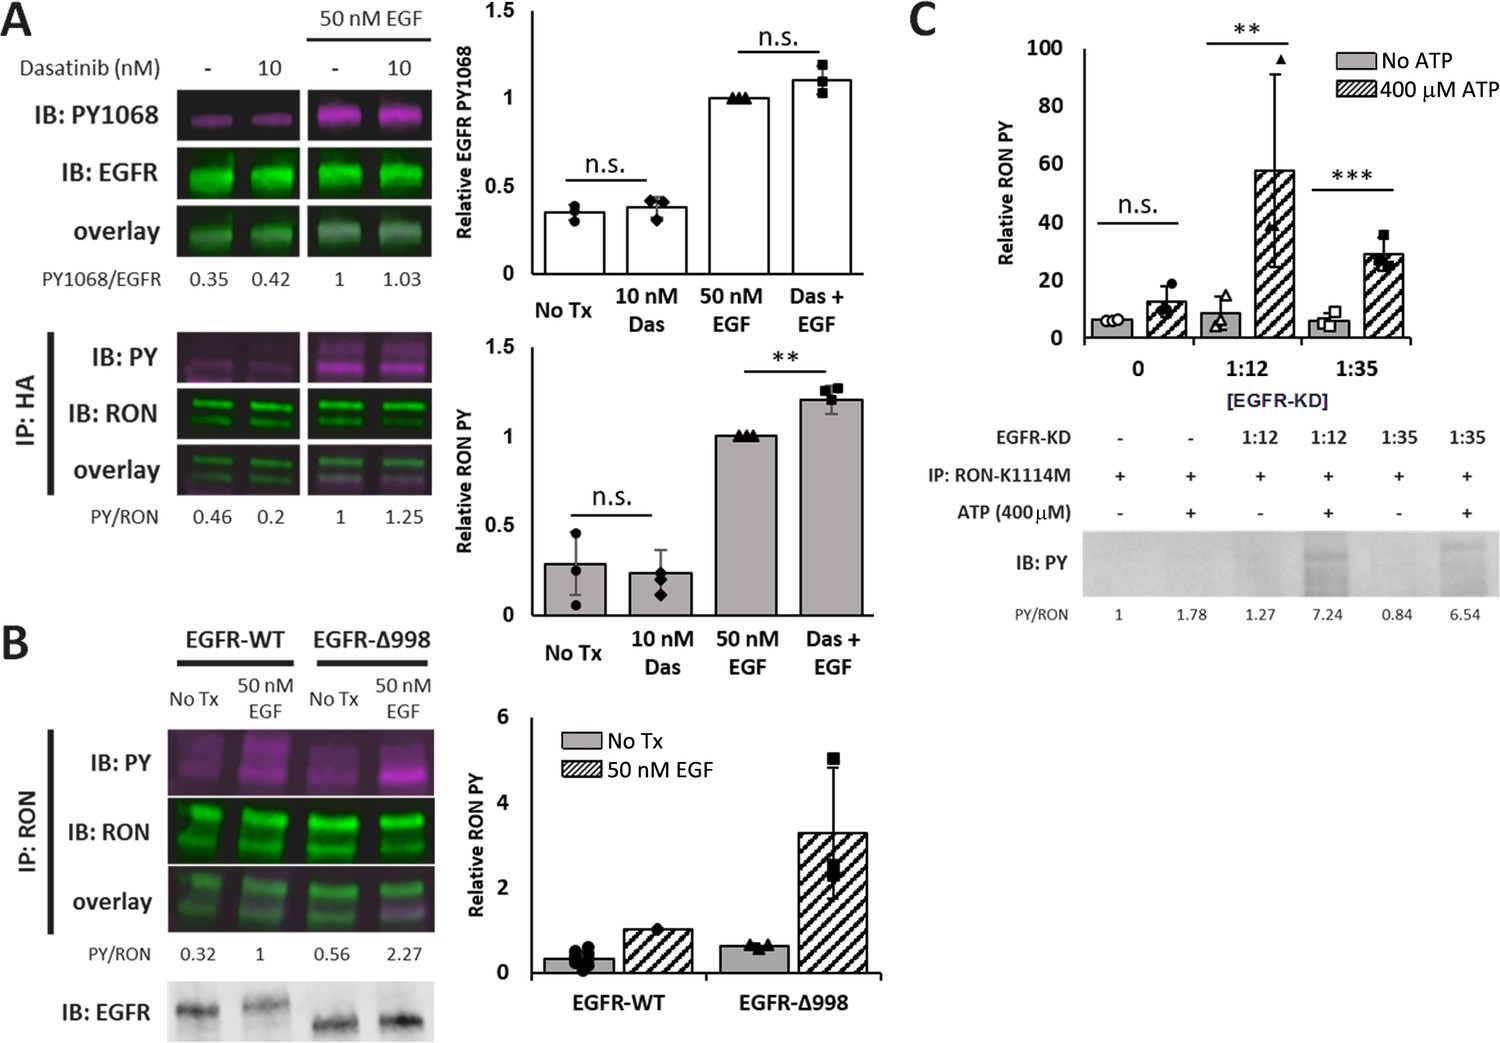
Crosstalk occurs through direct phosphorylation of RON by EGFR.
(A) A431RON cells were pre-treated with dasatinib (Das, Src inhibitor) for 30 min prior to stimulation with EGF for 5 min at 37 °C. Representative immunoblots of cell lysates detecting PY1068 and total EGFR (top), or PY and RON after IP with anti-HA (RON) (bottom). (B) HEKRON cells transiently transfected with EGFR-WT or EGFR-Δ998 ± EGF for 5 min. Representative immunoblots detecting PY and RON after IP with anti-RON or detection of total EGFR on cell lysates (bottom inset). (C) Kinase assay using the purified EGFR kinase domain (EGFR-KD) co-incubated with RON-K1114M IP samples ± ATP. Representative immunoblot detecting total phosphorylation (PY) of RON. All bar graphs represent mean ± SD from triplicate biological experiments. ** p < 0.01; *** p < 0.001.
-
Figure 6—source data 1
Full raw western blots and blots with relevant bands labelled, corresponding to Figure 6A, B, and C.
- https://cdn.elifesciences.org/articles/63678/elife-63678-fig6-data1-v2.zip
-
Figure 6—source data 2
Source data for quantification of blots in Figure 1C, D and E.
- https://cdn.elifesciences.org/articles/63678/elife-63678-fig6-data2-v2.xlsx
Figure 6—figure supplement 1
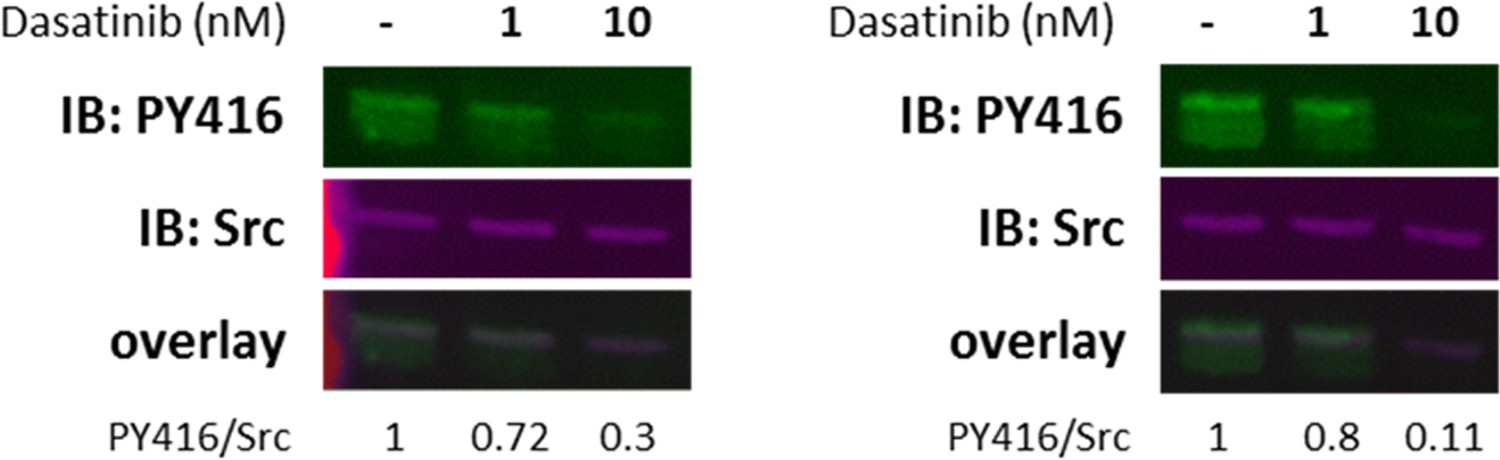
A431RON cells were pre-treated with dasatinib (Src inhibitor) at different concentrations for 30 min prior to cell lysis.
Cell lysates were probed by immunoblot for Src-PY416 and total Src, with corresponding overlays. Immunoblots show results from two biological replicates.
-
Figure 6—figure supplement 1—source data 1
Full raw western blots and blots with relevant bands labelled, corresponding to Figure 6—figure supplement 1.
- https://cdn.elifesciences.org/articles/63678/elife-63678-fig6-figsupp1-data1-v2.zip
Figure 6—figure supplement 2
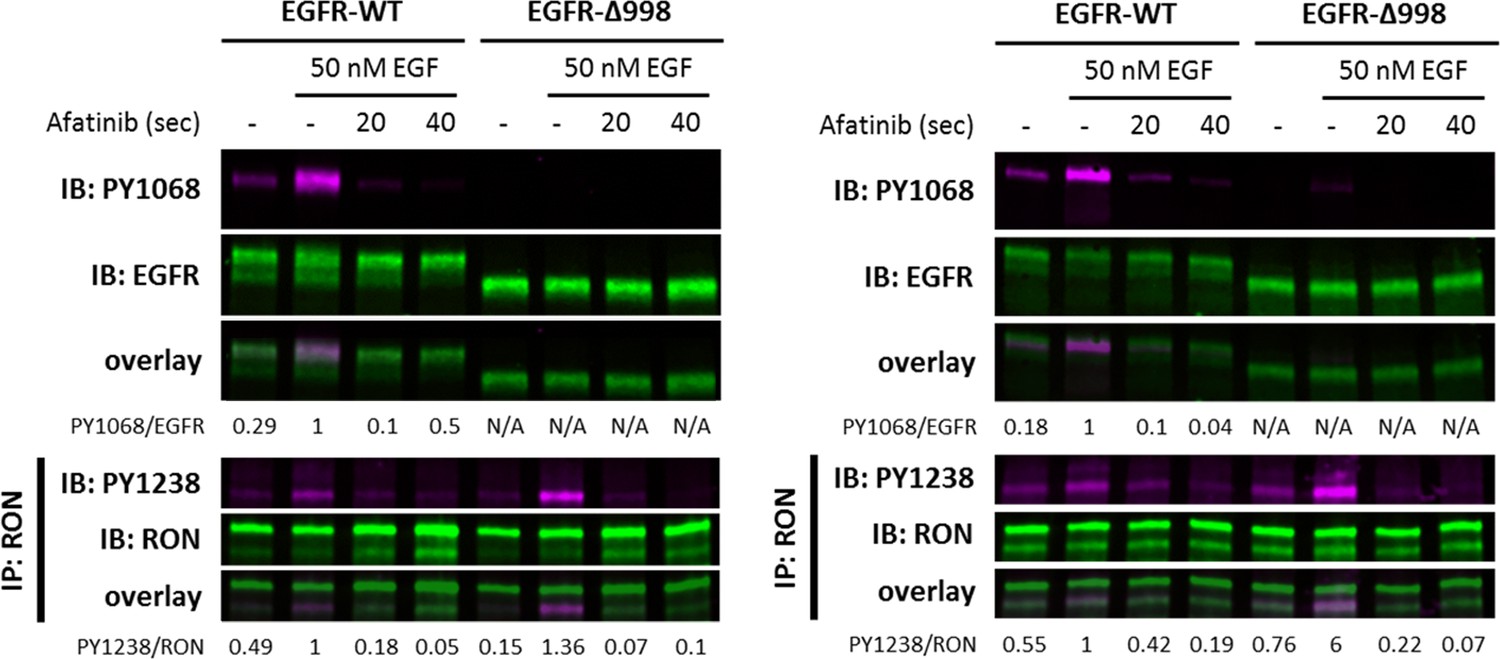
Dephosphorylation assay was conducted using HEKRON cells transiently transfected with EGFR-WT or EGFR-Δ998.
Cells were activated± EGF for 2 min, and immediately treated with 10 μM afatinib (pan-ErbB inhibitor) for 20 or 40 s. Two replicate biological experiments show detection of EGFR-PY1068 and EGFR on cell lysates or PY1238/39 and RON on samples IP with anti-RON, and their respective overlays.
-
Figure 6—figure supplement 2—source data 1
Full raw western blots and blots with relevant bands labelled, corresponding to Figure 6—figure supplement 2.
- https://cdn.elifesciences.org/articles/63678/elife-63678-fig6-figsupp2-data1-v2.zip
Figure 7

Functional EGFR dimers are necessary for EGFR/RON crosstalk.
(A and B) HEKRON cells transiently expressing EGFR-WT, EGFR-I682Q (receiver-impaired), EGFR-V924R (activator-impaired) or both mutants (EGFR-I682Q + V924 R) were treated ± EGF for 5 min at 37 °C. (A) Representative immunoblot detecting PY1068 and EGFR in cell lysates. (B) Representative immunoblot showing PY and RON after IP with anti-RON. Triplicate biological experiments from (A and B) are quantified and graphed as mean ± SD. *** p < 0.001.
-
Figure 7—source data 1
Full raw western blots and blots with relevant bands labelled, corresponding to Figure 7A, B.
- https://cdn.elifesciences.org/articles/63678/elife-63678-fig7-data1-v2.zip
-
Figure 7—source data 2
Source data for quantification of blots in Figure 7.
- https://cdn.elifesciences.org/articles/63678/elife-63678-fig7-data2-v2.xlsx
Author response image 1
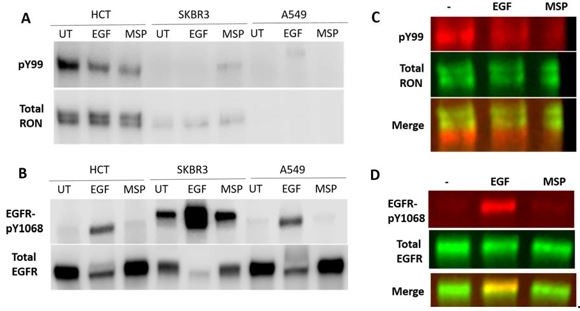
Detection of RON and EGFR in human cancer cell lines with low, endogenous expression of both receptors.
HCT116 colorectal carcinoma cells, SKBR3 breast cancer cells and A549 lung carcinoma cells were cultured overnight and then stimulated with 50 nM EGF or 5 nM MSP for 5 min. (A) RON receptor was IP’d with an anti-RON antibody and phosphorylated proteins in the IP were detected using a pY99 antibody. Here, detection was with HRP-antibodies. (B) Total cell lysates were run on a western blot and phosphoEGFR (pY1068) and total EGFR were detected. (C) Two-color detection using fluorescently-labeled antibodies for western using HCT116 cells. The phosphorylated protein does not overlap with full-length RON in the IP samples. The phosphorylated protein could be a truncated RON isoform or a different protein that co-Ips with RON in these cells. (D) The phospho-EGFR band does overlap with the full-length EGFR band.
Tables
Appendix 1—key resources table
| Reagent type (species) or resource | Designation | Source or reference | Identifiers | Additional information |
|---|---|---|---|---|
| cell line (Homo sapiens) | A431 (female) | ATCC | ATCC Cat# CRL-1555, RRID:CVCL_0037 | |
| cell line (Homo sapiens) | HEK-293 | ATCC | ATCC Cat# CRL-1573, RRID:CVCL_0045 | |
| cell line (Homo sapiens) | A431RON | This paper | A431 cells stably transfected with pcDNA3.1 HA-RON plasmid | |
| cell line (Homo sapiens) | A431RON-K1114M | This paper | A431 cells stably transfected with pcDNA3.1 HA-RON-K1114M plasmid | |
| cell line (Homo sapiens) | HEKRON | This paper | HEK-293 cells stably transfected with pcDNA3.1 HA-RON plasmid | |
| cell line (Homo sapiens) | HEKRON/EGFR | This paper | HEKRON cells stably transfected with ACP-EGFR plasmid | |
| transfected construct (human) | pcDNA3.1 HA-RON | This paper | Generated using pcDNA3.1 | |
| transfected construct (human) | ACP-EGFR | Ziomkiewicz et al., Cytometry A, 2013 | ||
| transfected construct (human) | pcDNA3.1 HA-RON-K1114M | This paper | ||
| antibody | Anti-EEA1 (Rabbit monoclonal) | Cell Signaling Technology | Cat# 3288 RRID:AB_2096811 | Clone C5B10 IF (1:200) |
| antibody | Anti-EGFR (Rabbit monoclonal) | Cell Signaling Technology | Cat# 4267 RRID:AB_2246311 | Clone D38B1 WB (1:2000) |
| antibody | Anti-EGFR (Goat polyclonal) | R&D Systems | Cat# AF231 RRID:AB_355220 | WB (1:1000) Used when blotting for EGFR-Δ998 |
| antibody | Anti-EGFR (Rabbit monoclonal) | Cell Signaling Technology | Cat# 4405 RRID:AB_331380 | Clone 15 F8 WB (1:2000) |
| antibody | Anti-EGFR PY1068 (Mouse monoclonal) | Cell Signaling Technology | Cat# 2236 RRID:AB_331792 | Clone 1 H12 WB (1:2000) |
| antibody | Anti-EGFR PY845 (Rabbit polyclonal) | Santa Cruz Biotechnology | Cat# sc-23420 RRID:AB_653168 | WB (1:500) |
| antibody | Anti-EGFR PY1148 (Rabbit polyclonal) | Cell Signaling Technology | Cat# 4404 RRID:AB_331127 | WB (1:2000) |
| antibody | Anti-EGFR AF647 (Mouse monoclonal) | Santa Cruz Biotechnology | Cat# sc-101 AF647 | Clone R-1 FACS (5–40 ug/mL) |
| antibody | Anti-EGFR (Goat polyclonal) | Santa Cruz Biotechnology | Cat# sc-31156 RRID:AB_2096710 | Clone D-20 EM (1:20) |
| antibody | Anti-HA AF488 (Mouse Monoclonal) | Cell Signaling Technology | Cat# 2350 RRID:AB_491023 | Clone 6E2 FACS (5–40 ug/mL) |
| antibody | Anti-HA magnetic bead (Rabbit monoclonal) | Cell Signaling Technology | Cat# 11846 RRID:AB_2665471 | Clone C29F4 IP (1:100) |
| antibody | Anti-HA sepharose bead (Rabbit monoclonal) | Cell Signaling Technology | Cat# 3956 RRID:AB_10695091 | Clone C29F4 IP (1:100) |
| antibody | Anti-HA FITC (Fab; Rat monoclonal) | Roche | Cat# 11988506001 RRID:AB_390916 | Clone 3 F10 IF (1:20) |
| antibody | Anti-HA Biotin (Fab; Rat monoclonal) | Roche | Cat# 12158167001 RRID:AB_390915 | Clone 3 F10 SPT (200 pM) |
| antibody | Anti-PY20 (Mouse monoclonal) | Santa Cruz Biotechnology | Cat# sc-508 RRID:AB_628122 | WB (1:500) |
| antibody | Anti-PY20 HRP (Mouse monoclonal) | Santa Cruz Biotechnology | Cat# sc-508 HRP | Kinase assay (1:500) |
| antibody | Anti-PY99 (Mouse monoclonal) | Santa Cruz Biotechnology | Cat# sc-7020 RRID:AB_628123 | WB (1:500) |
| antibody | Anti-PY99 HRP (Mouse monoclonal) | Santa Cruz Biotechnology | Cat# sc-7020 HRP | Kinase assay (1:500) |
| antibody | Anti-RON (Goat polyclonal) | R&D Systems | Cat# AF691 RRID:AB_355527 | IP (1:100) |
| antibody | Anti-RONβ (Rabbit polyclonal) | Santa Cruz Biotechnology | Cat# sc-322 RRID:AB_677390 | Clone C-20 WB (1:500) EM (1:20) Discontinued antibody; remainder of experiments done with Cell Signaling Technology Cat# 2,654 |
| antibody | Anti- RONβ (Rabbit monoclonal) | Cell Signaling Technology | Cat# 2654 RRID:AB_2298153 | Clone C81H9 WB (1:2000) |
| antibody | Anti- RONβ (Mouse monoclonal) | Santa Cruz Biotechnology | Cat# sc-74588 RRID:AB_2235711 | Clone E-3 WB (1:500) Used with the PY1238/39 RON antibody (R&D Systems Cat# AF1947) |
| antibody | Anti-RON PY1238/39 (Rabbit polyclonal) | R&D Systems | Cat# AF1947 RRID:AB_1152159 | WB (1:2000) |
| antibody | Anti-Src (Mouse monoclonal) | Cell Signaling Technology | Cat# 2110 RRID:AB_10691385 | Clone L4A1 WB (1:2000) |
| antibody | Anti-Src PY416 (Rabbit polyclonal) | Cell Signaling Technology | Cat# 2101 RRID:AB_331697 | WB (1:2000) |
| antibody | Anti-Goat IgG IRDye 800CW (Donkey polyclonal) | Li-Cor | Cat# 926–32214 RRID:AB_621846 | WB (1:20000) |
| antibody | Anti-Goat IgG 12 nm colloidal gold (Donkey polyclonal) | Jackson Immuno Research | Cat# 705-205-147 RRID:AB_2340418 | EM (1:20) |
| antibody | Anti-Mouse IgG IRDye 680RD (Goat polyclonal) | Li-Cor | Cat# 926–68070 RRID:AB_10956588 | WB (1:20000) |
| antibody | Anti-Mouse IgG IRDye 680RD (Donkey polyclonal) | Li-Cor | Cat# 926–68072 RRID:AB_10953628 | WB (1:20000) |
| antibody | Anti-Rabbit IgG IRDye 800CW (Goat polyclonal) | Li-Cor | Cat# 926–32211 RRID:AB_621843 | WB (1:20000) |
| antibody | Anti-Rabbit IgG IRDye 680RD (Donkey polyclonal) | Li-Cor | Cat# 926–68073 RRID:AB_10954442 | WB (1:20000) |
| antibody | Anti-Rabbit IgG AF555 (Fab; Goat polyclonal) | Thermo Fisher Scientific | Cat# A-21430 RRID:AB_2535851 | IF (1:500) |
| antibody | Anti-Rabbit IgG 6 nm colloidal gold (Donkey polyclonal) | Jackson Immuno Research | Cat# 711-195-152 RRID:AB_2340609 | EM (1:20) |
| recombinant DNA reagent | pDONR223-MST1R | Addgene | RRID:Addgene_23942 Johannessen et al., 2010 | RON sequence used to make the HA-tagged RON plasmid |
| recombinant DNA reagent | pcDNA3.1/V5-His-TOPO | Invitrogen | Used as a backbone for HA-tagged RON plasmid (HA-RON and HA-RON-K1114M) | |
| recombinant DNA reagent | pcTAP | Agilent | ||
| recombinant DNA reagent | pcDNA3.1 HA-EGFR WT | Valley et al., 2015 | Plasmid used for generating EGFR-I682Q, EGFR-V924R, and EGFR-Δ998 with primers below | |
| sequence-based reagent | Ultramer to generate HA-tagged RON plasmid | This paper | CACCATGGAGCTCCTC CCGCCTCAGTCCTTCC TGTTGCTGCTGCTGTT GCCTGACAAGCCCGCG GCGGGCTATCCTTACG ACGTGCCTGACTACGCC GCAGCAGCAGAGGACT GGCAGTGCCCGCACA Has CACC ligation sequence, start codon, RON signal peptide, HA-tag, and alanine linker 5’ of the mature RON coding region | |
| sequence-based reagent | Primers to generate RON-K1114M mutagenesis | This paper | Danilkovitch-Miagkova et al., 2000 | Forward: GTGATGCGAC TTAGTGACATGATGGC ACATTGGATTC Reverse: GAATCCAATG TGCCATCATGTCACTAA GTCGCATCAC |
| sequence-based reagent | Primers to generate EGFR-KD | This paper | Forward: CGCCGGATCC CCAACGAATGGGCCTA AG Reverse: CGAGGTCGAC GGTATCGATAAGCTTTG CTCCAATAAATTCACTGC | |
| sequence-based reagent | Primers to generate EGFR-I682Q mutagenesis | This paper | Forward: CAACCAAGCT CTCTTGAGGCAGTTG AAGGAAACTGAATTC Reverse: GAATTCAGT TTCCTTCAACTGCCTC AAGAGAGCTTGGTTGG | |
| sequence-based reagent | Primers to generate EGFR-V924R mutagenesis | This paper | Forward: GATGTCTACA TGATCATGCGCAAGT GCTGGATGATA Reverse: TATCATCCAG CACTTGCGCATGATC ATGTAGACATC | |
| sequence-based reagent | Primers to generate truncated EGFR-Δ998 | This paper | Forward: GTTAAGCTTG GTACCGAGCTCGGAT CCAGTACCCTTCACC ATGCGACCCTCCGGG AC Reverse: CCCTCTAGA CTCGAGCGGCCGCCT AGAAGTTGGAGTCTGTAGGACTTGGC | |
| peptide, recombinant protein | Human recombinant EGF | Invitrogen | Cat# PHG0311 | |
| peptide, recombinant protein | Human recombinant EGF | PeproTech | Cat# AF-100–15 | |
| peptide, recombinant protein | Human recombinant EGF-biotin | Thermo Fisher Scientific | Cat# E3477 | |
| peptide, recombinant protein | Human recombinant EGF-AF647 | Thermo Fisher Scientific | Cat# E35351 | |
| peptide, recombinant protein | Human recombinant MSP | R&D Systems | Cat# 4306 MS-010 | |
| commercial assay or kit | BCA protein assay kit | Pierce | Cat# 23,225 | |
| commercial assay or kit | ECL blotting substrate | Pierce | Cat# 32,106 | |
| commercial assay or kit | Expi293 Expression System Kit | Thermo Fisher Scientific | Cat# A14635 | Used for producing EGFR-KD and RON-K1114M proteins for use in kinase assay |
| chemical compound, drug | Afatinib | Selleck Chemicals | Cat# S1011 | |
| chemical compound, drug | BMS777607 | Selleck Chemicals | Cat# S1561 | |
| chemical compound, drug | Dasatinib | Santa Cruz Biotechnology | Cat# sc-358114 | |
| chemical compound, drug | PD153035 | EMD Millipore | Cat# 234,491 | |
| software, algorithm | MATLAB | Mathworks | RRID:SCR_001622 | |
| software, algorithm | DIPImage | Delf University of Technology | ||
| other | QD605 streptavidin | Thermo Fisher Scientific | Cat# Q10101MP | For use in SPT |
| other | QD655 streptavidin | Thermo Fisher Scientific | Cat# Q10121MP | For use in SPT |
| other | protein A/G magnetic beads | Pierce | Cat# 88,802 | For use in IP |
| other | Quantum AlexaFluor 647 | Bangs Laboratories | Cat# 647 A | For use in receptor quantification on FACS |
| other | Quantum AlexaFluor 488 | Bangs Laboratories | Cat# 488 A | For use in receptor quantification on FACS |
Additional files
-
Transparent reporting form
- https://cdn.elifesciences.org/articles/63678/elife-63678-transrepform1-v2.docx
-
Supplementary file 1
List of top proteins co-IP in A431RON cells with anti-HA antibody for RON pulldown, as analyzed by Mass Spectrometry.
- https://cdn.elifesciences.org/articles/63678/elife-63678-supp1-v2.docx
Download links
A two-part list of links to download the article, or parts of the article, in various formats.
Downloads (link to download the article as PDF)
Open citations (links to open the citations from this article in various online reference manager services)
Cite this article (links to download the citations from this article in formats compatible with various reference manager tools)
EGFR transactivates RON to drive oncogenic crosstalk
eLife 10:e63678.
https://doi.org/10.7554/eLife.63678


