Myosin with hypertrophic cardiac mutation R712L has a decreased working stroke which is rescued by omecamtiv mecarbil
- Pennsylvania Muscle Institute, Perelman School of Medicine, University of Pennsylvania, United States
- Department of Pathology and Laboratory Medicine, Robert Wood Johnson Medical School, Rutgers University, United States
- Department of Physiological Sciences, Eastern Virginia Medical School, United States
Figures
Figure 1 with 8 supplements
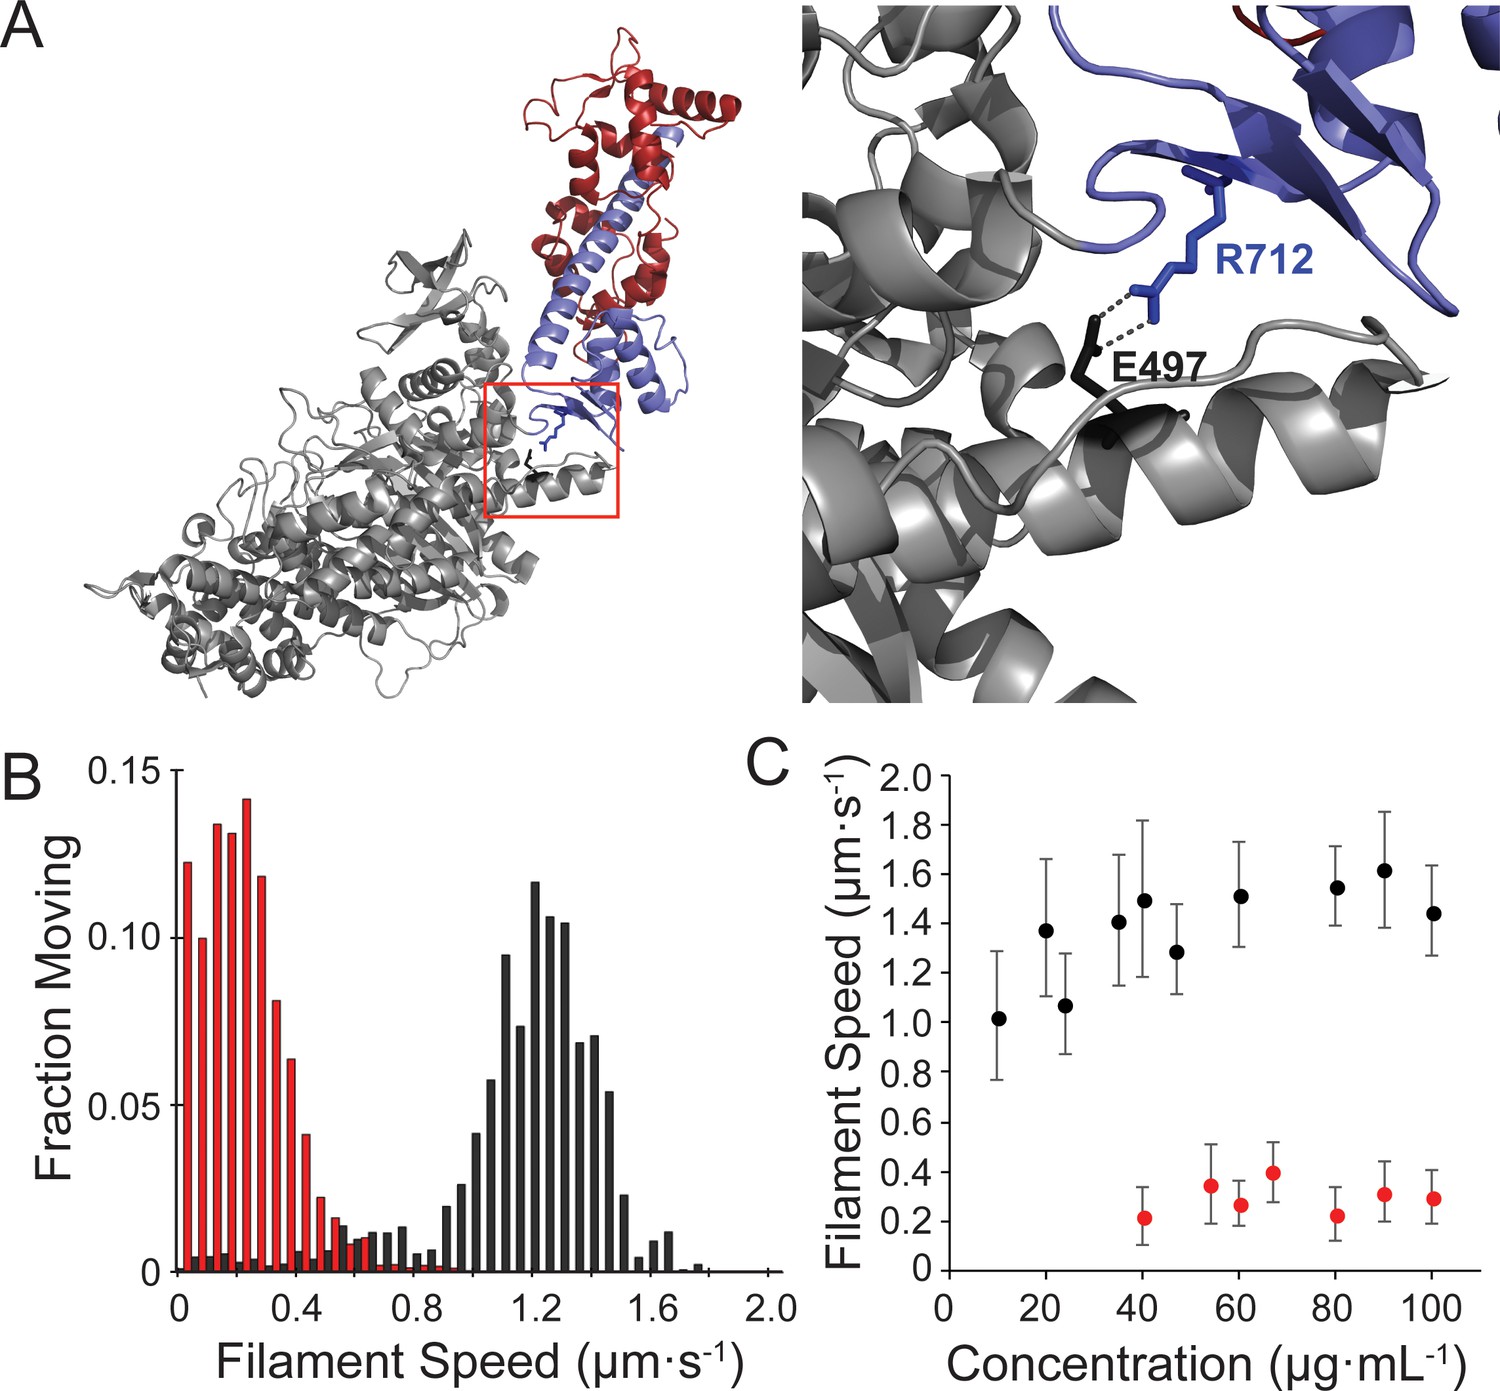
Motility of the hypertrophic cardiomyopathy mutant, R712L-myosin, is impaired.
(A) Cartoon rendering of the β-cardiac myosin crystal structure (PDB: 5N69). The motor domain (grey, 1–707), converter/lever arm domain (blue, 708–806), and the essential light chain (red) are shown. The box indicates the region expanded to the right showing the E497-R712 salt bridge located at the fulcrum of the lever arm. (B) Distribution of individual filament gliding speeds from motility assays at a concentration of 100 μg⋅ml−1. Wild-type-myosin (black) has a higher average motility rate compared to R712L-myosin (red). (C) Increasing loading concentrations of myosin were added and the average filament speed of fluorescently labelled actin filaments was assessed. Higher concentrations of R712L-myosin were required to achieve motility, and actin filaments were not observed on the surface at concentrations <40 μg⋅ml−1.
-
Figure 1—source data 1
Excel files with data from Figure 1.
- https://cdn.elifesciences.org/articles/63691/elife-63691-fig1-data1-v1.zip
Figure 1—figure supplement 1
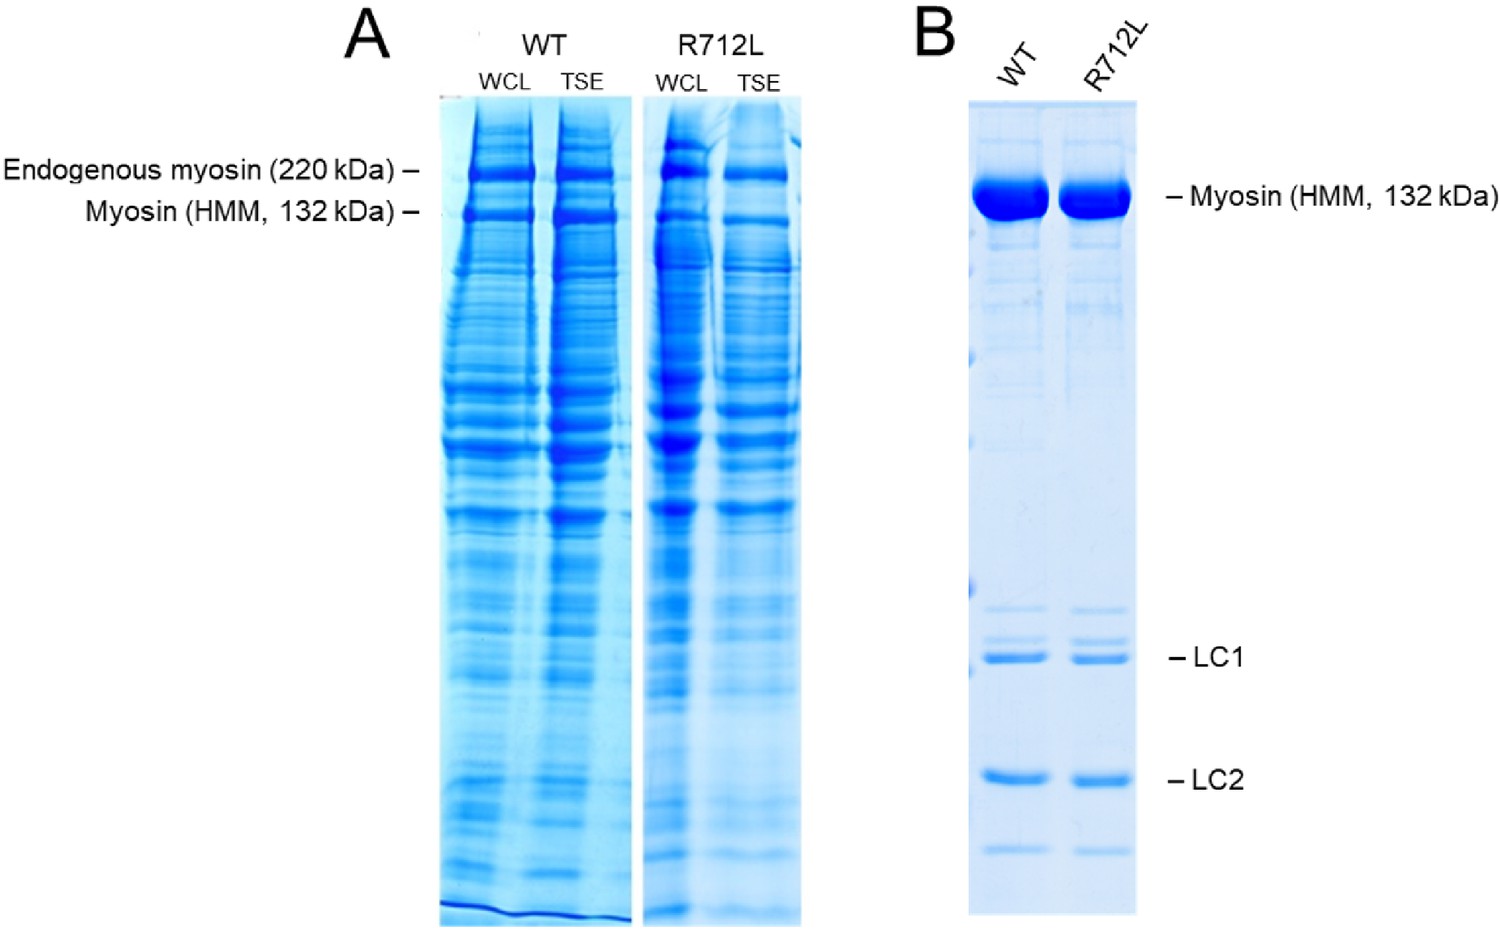
SDS-PAGE of WT- and R712L-myosin purification.
(A) Representative SDS-PAGE of five independent preparations of recombinantly expressed wild-type- and R712L-myosin (HMM fragments). The yield of purified myosin per unit culture dish was measured for a fixed expression period, using a common infection protocol, comparable multiplicity of infection, and identical purification methods. Expression levels for WT- and R712L-myosin are comparable in the whole cell lysate (WCL) and the triton soluble extract (TSE), the starting point for protein purification of myosin. The level of myosin expression approaches that of the endogenous C2C12 myosin in the cell extract. (B) Purified WT-myosin and the R712L-myosin (HMM fragments) are routinely analyzed by SDS-PAGE. Lane 1, WT-myosin; lane 2, R712L-myosin. Average recovery of WT-myosin was 174 µg per p150 dish (range 100–262) and 157 µg/p150 (range 126–210) for R712L-myosin. SDS-PAGE analysis of each step from each purification from cell lysis through the final purified protein was performed to detect losses from individual steps. Comparable yields of the WT and R712L proteins suggest no difference in the stability in this culture system.
Figure 1—figure supplement 2
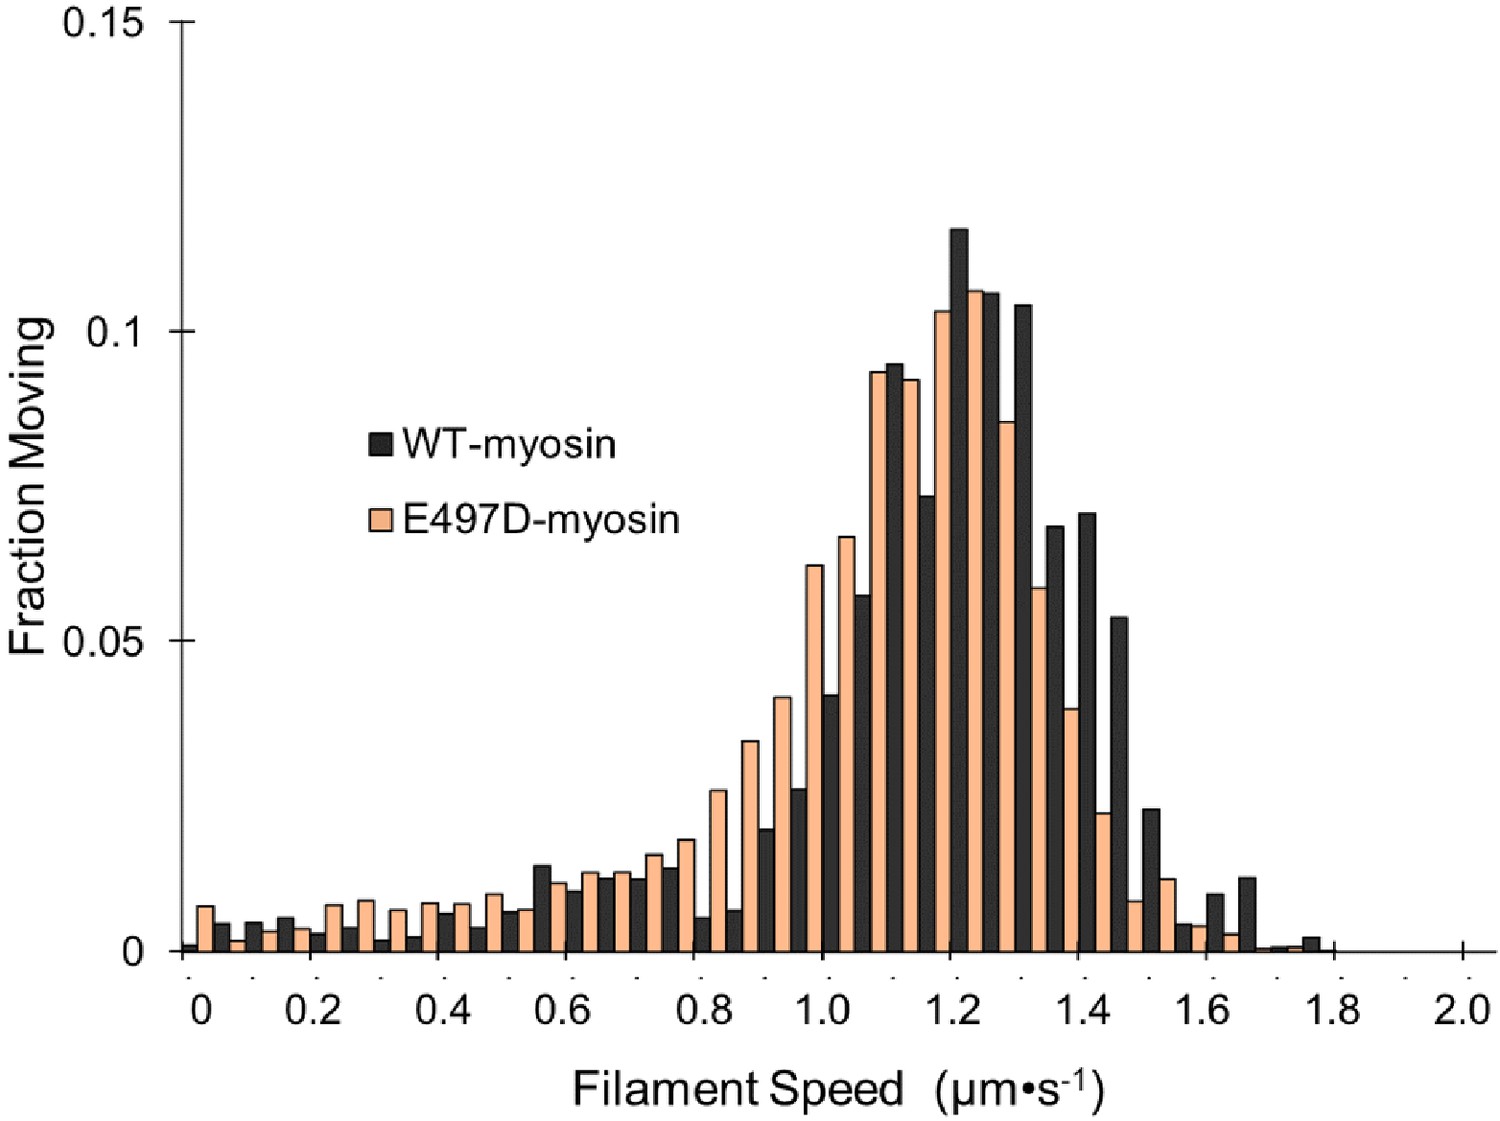
E497D-myosin gliding filament assays.
The speeds of individual fluorescently labeled actin filaments were quantified in gliding filament motility assays for E497D-myosin at a loading concentration of 100 μg⋅ml−1 (n = 1408 individual filaments). Wild-type (WT)-myosin is replotted from Figure 1B for comparison.
Figure 1—figure supplement 3
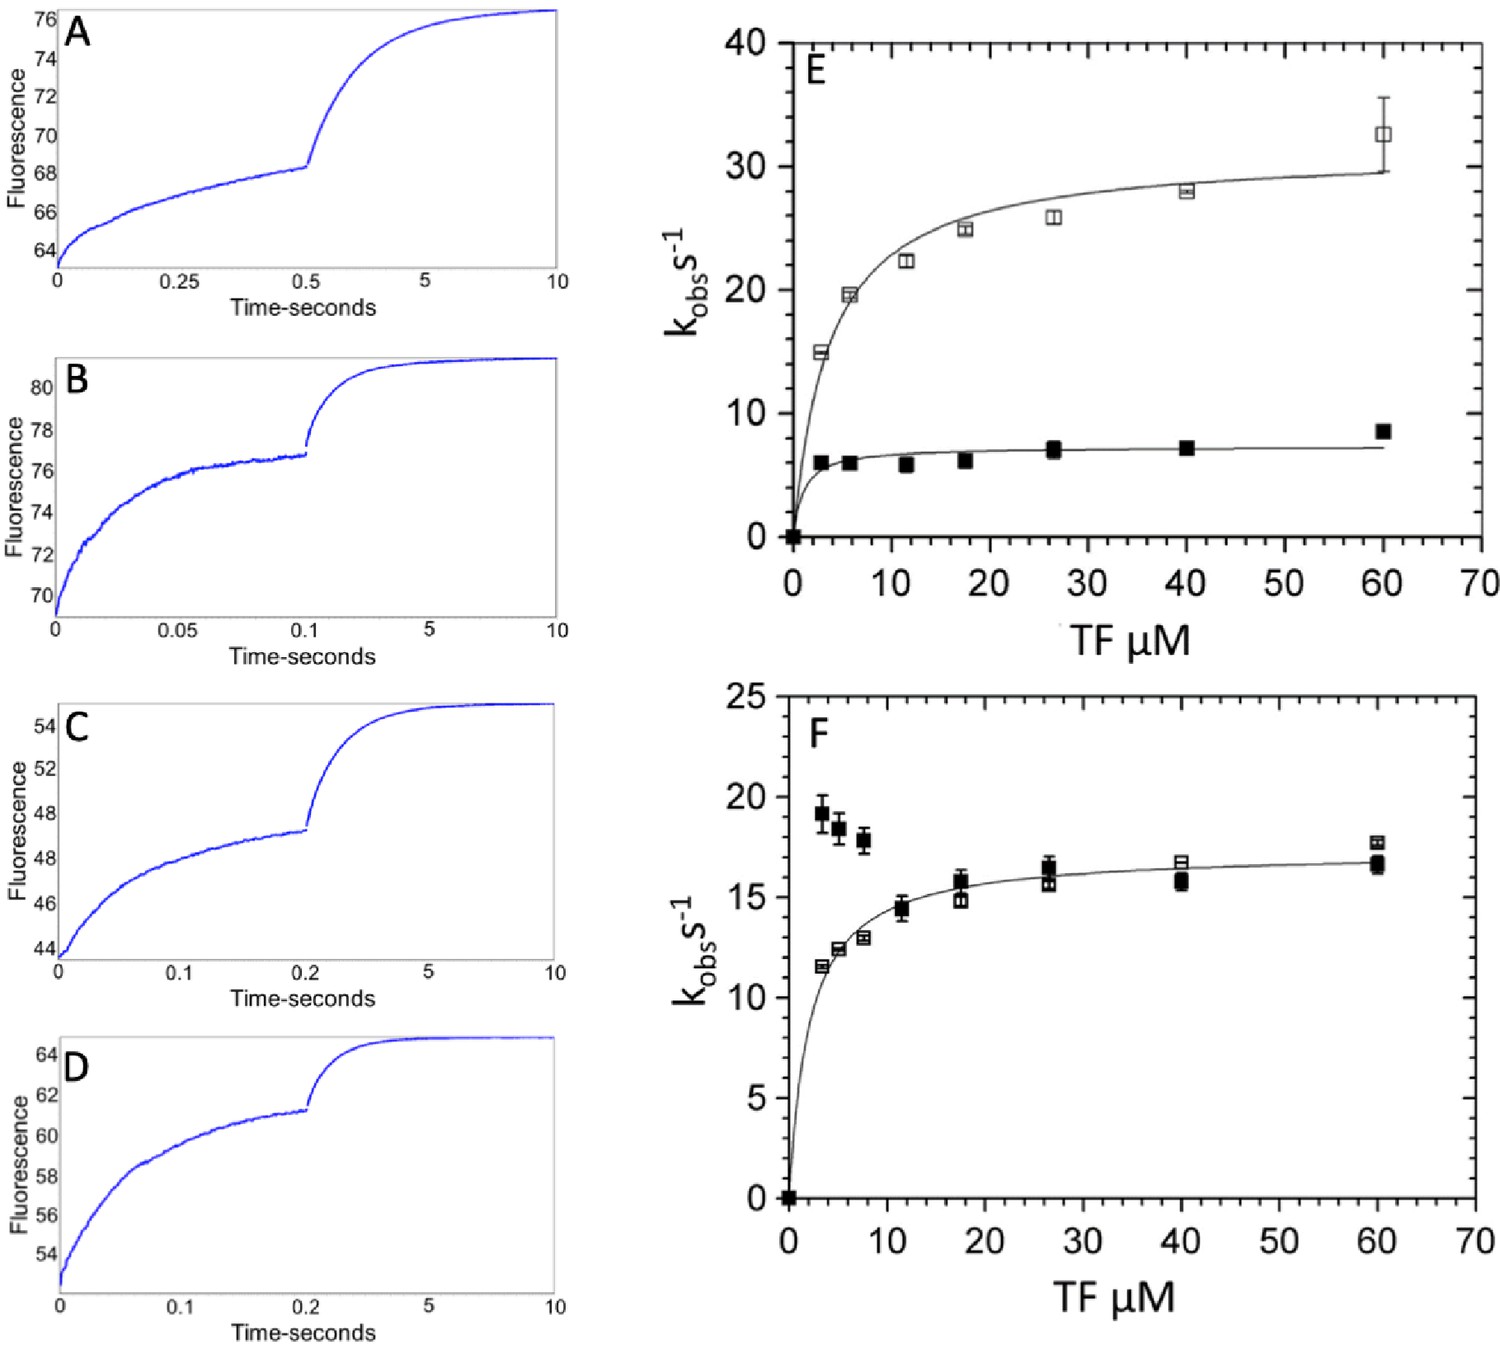
Kinetics of phosphate dissociation from thin filament (TF)-activated β-cardiac myosin.
TF activation of phosphate dissociation was measured via the change in N-[2-(1-maleimidyl)ethyl]−7-(diethylamino)coumarin-3-carboxamide-labeled phosphate binding protein (MDCC-PBP) fluorescence (see Materials and methods). Briefly, 3 µM β-cardiac myosin was first mixed with 2 µM ATP, held in a delay line for 2 s, and then mixed with TFs to accelerate Pi release. Final concentrations in the flow cell were 0.75 µM myosin, 0.5 µM ATP, 0–60 µM actin in native TFs, 5 mM MOPS (pH 7.2), 2 mM MgCl2, 10 mM KCl, 0.05 mM CaCl2, 0.25% DMSO, 0 or 50 µM omecamtiv mecarbil (OM), 5 µM MDCC-PBP, 0.1 mM 7-methylguanosine, and 0.01 unit/mL purine nucleoside phosphorylase at 20°C. (A–D) Representative traces showing the change in MDCC-PBP fluorescence with 60 µM actin in TFs in the presence and absence of OM for WT- and R712L-myosin. The data were fit to the sum of two-exponentials for: (A) Wild-type (WT)-myosin (7.8 s−1, 0.52 s−1), (B) WT-myosin with OM (42 s−1, 1.0 s−1), (C) R712L-myosin (17 s−1, 0.78 s−1), and (D) R712L-myosin with OM (17 s−1, 1.0 s−1). (E–F) Kinetics of phosphate release for WT (E) and for R712L-myosin (F) as a function of actin subunit concentration in porcine native TFs. (■) without OM; (□) with OM. Solid lines are hyperbolic fits with constants reported in Table 1.
Figure 1—figure supplement 4
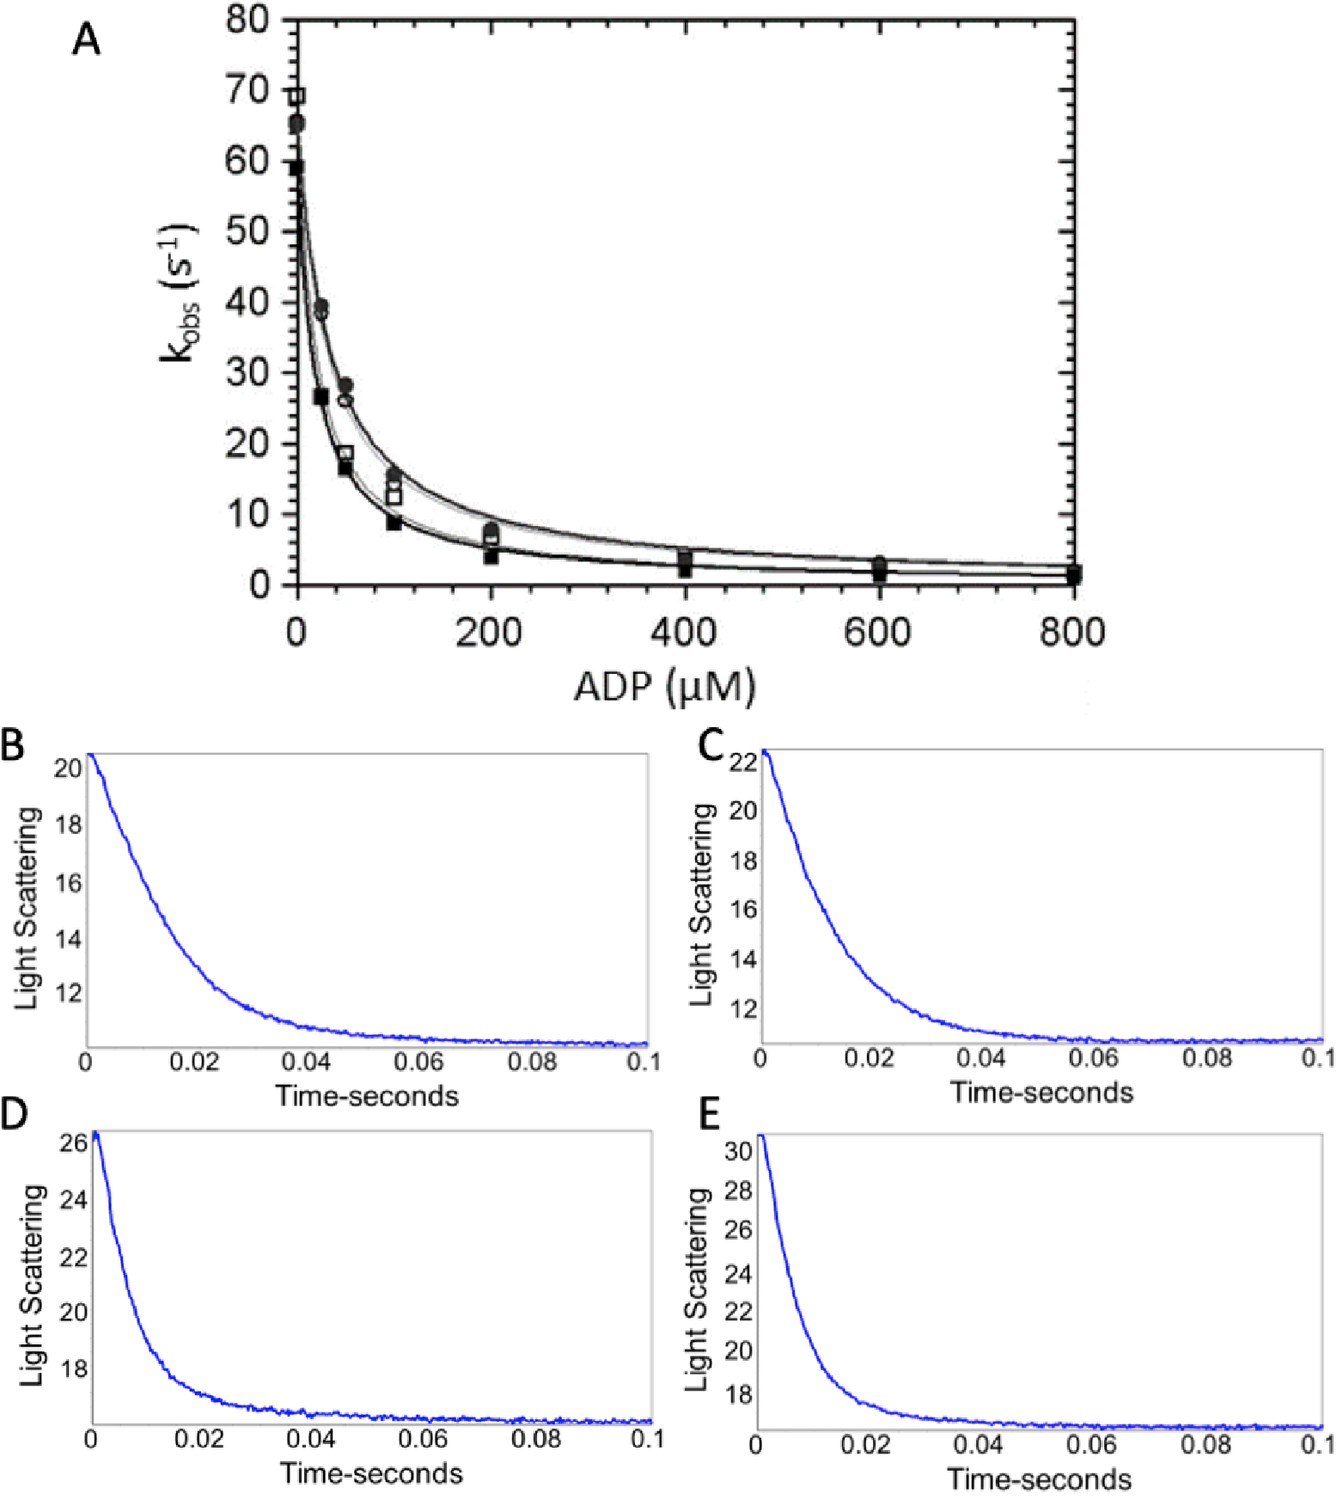
ADP dissociation from actomyosin.
(A) ADP dissociation from actomyosin was measured via light scattering (see Materials and methods). Briefly, stopped flow was used to quickly mix actomyosin and ADP with ATP (30 µM final concentration), and a decrease in light scattering due to dissociation of actomyosin is known to be limited by ADP dissociation in wild-type (WT) myosin. Final concentrations were 1.25 μM myosin, 3 µM actin, 0–800 µM ADP, 30 µM ATP, 2 mM MgCl2, 25 mM KCl, 0.25% DMSO, and either 0 or 50 µM OM in 5 mM MOPS (pH 7.2). (■) WT-myosin, (□) WT-myosin + 50 µM OM, (●) R712L-myosin, (○) R712L-myosin + 50 µM OM. (B–E) Maximum rates of ADP release were obtained with final concentrations in the cell of 1.25 μM myosin, 3 µM actin, 140 µM ADP, 2 mM ATP, 5 mM MOPS (pH 7.2), 2 mM MgCl2, 25 mM KCl, 0.25% DMSO, and either 0 or 50 µM OM. Representative traces from (B) WT-myosin (kobs = 74 s−1), (C) WT-myosin + 50 µM OM (kobs = 85 s−1), (D) R712L-myosin (kobs = 141 s−1), and (E) R712L-myosin + 50 µM OM (kobs = 147 s−1). Average values of k-AD from multiple experiments are reported in Table 1.
Figure 1—figure supplement 5
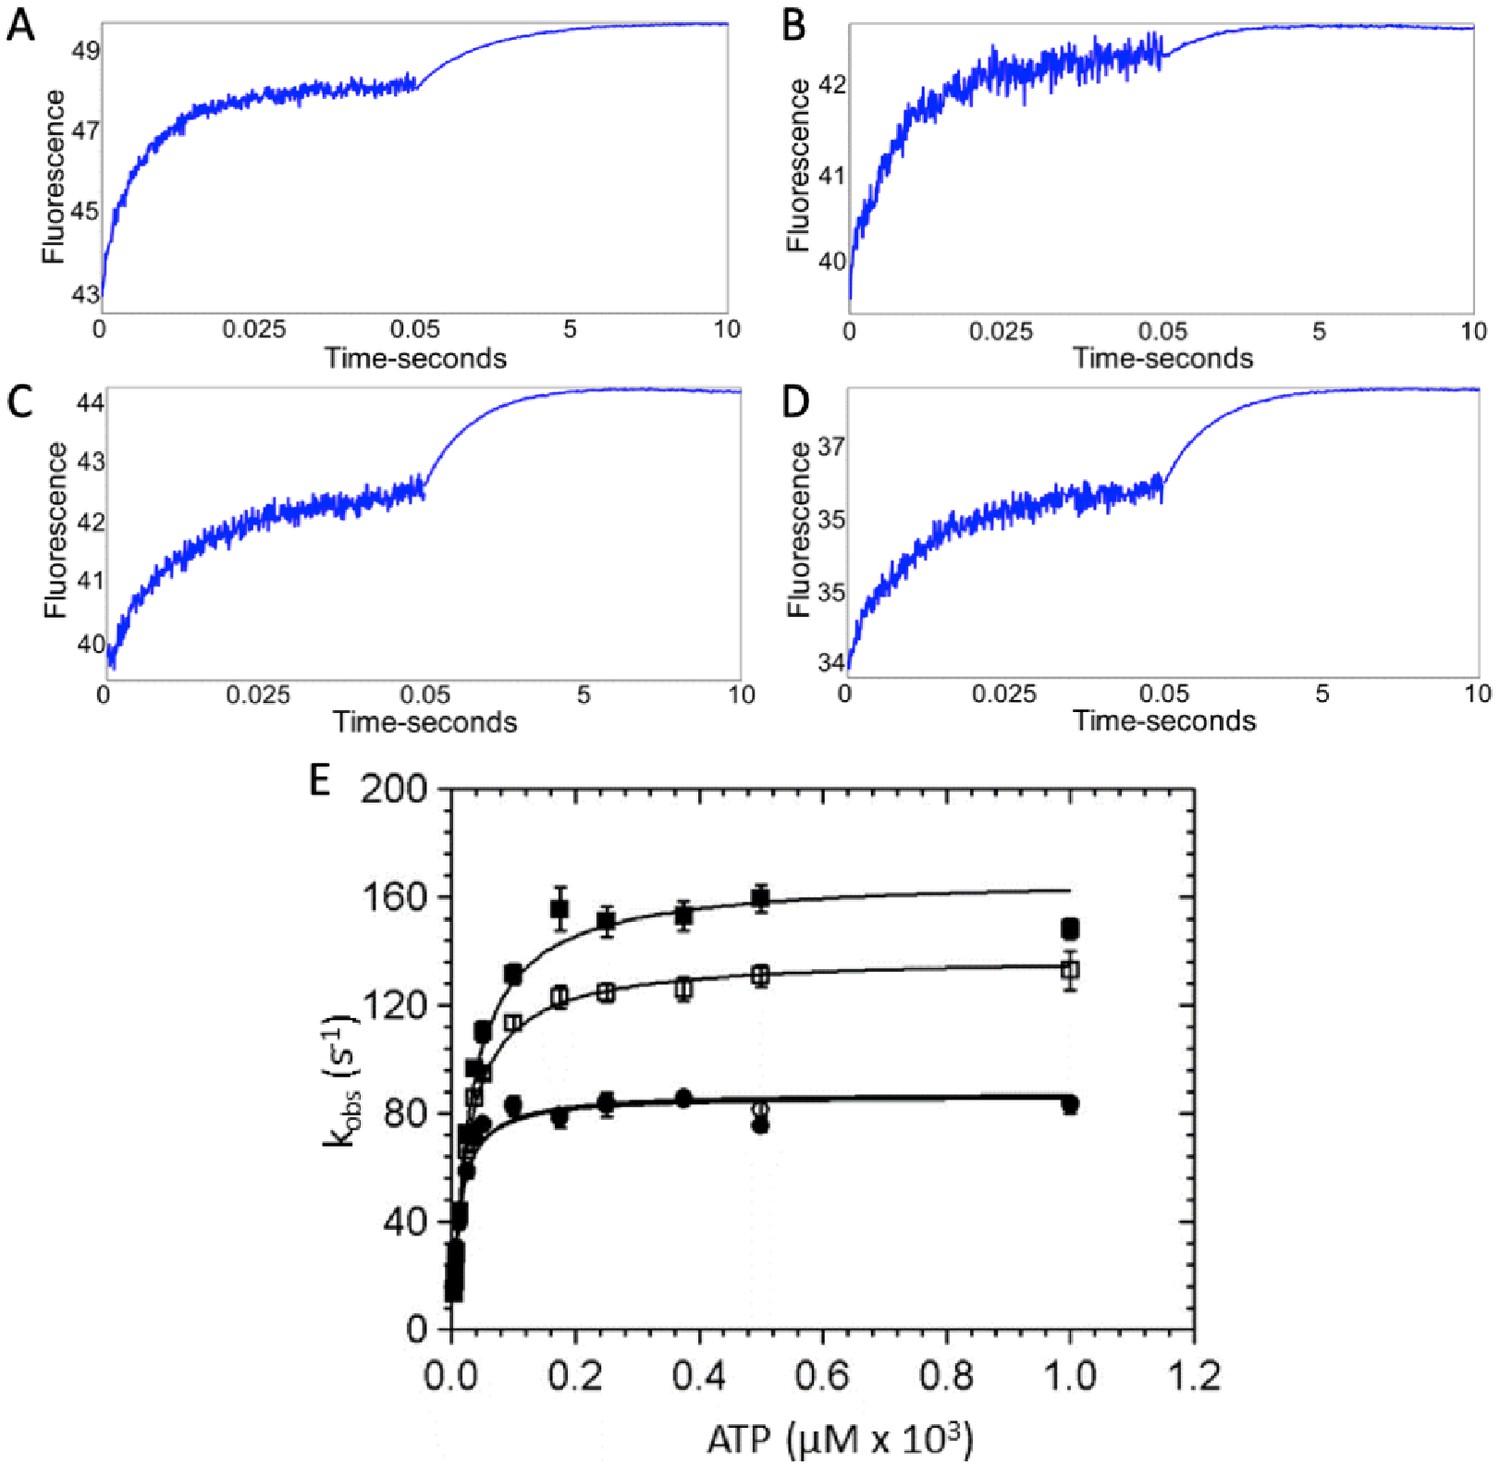
ATP binding to β-cardiac myosin measured by intrinsic tryptophan fluorescence.
Myosin was mixed with increasing concentrations of ATP via stopped flow and intrinsic tryptophan fluorescence was monitored. Upon ATP binding, intrinsic tryptophan fluorescence of the myosin increases. (A–D) Representative traces showing the change in fluorescence with 175 µM ATP in the presence and absence of omecamtiv mecarbil (OM) for wild-type (WT)- and R712L-myosin are shown and are best fit by the sum of two exponentials: (A) WT-myosin (139 s−1, 0.48 s−1), (B) WT-myosin with OM (115 s−1, 0.82 s−1), (C) R712L-myosin (80 s−1, 0.77 s−1), (D) R712L-myosin with OM (84 s−1, 0.70 s−1). (E) Rate of ATP binding to myosin as a function of ATP concentration. (■) WT-myosin, (□) WT-myosin + 50 µM OM, (●) R712L-myosin, (○) R712L-myosin + 50 µM OM. Final concentrations in the cell were 1.25 μM myosin, 3.75 µM to 1 mM ATP, 5 mM MOPS (pH 7.2), 2 mM MgCl2, 25 mM KCl, 0.25% DMSO, and 0 or 50 µM OM. Reactions were carried out at 20°C. Solid lines are hyperbolic fits, with constants reported in Table 1.
Figure 1—figure supplement 6
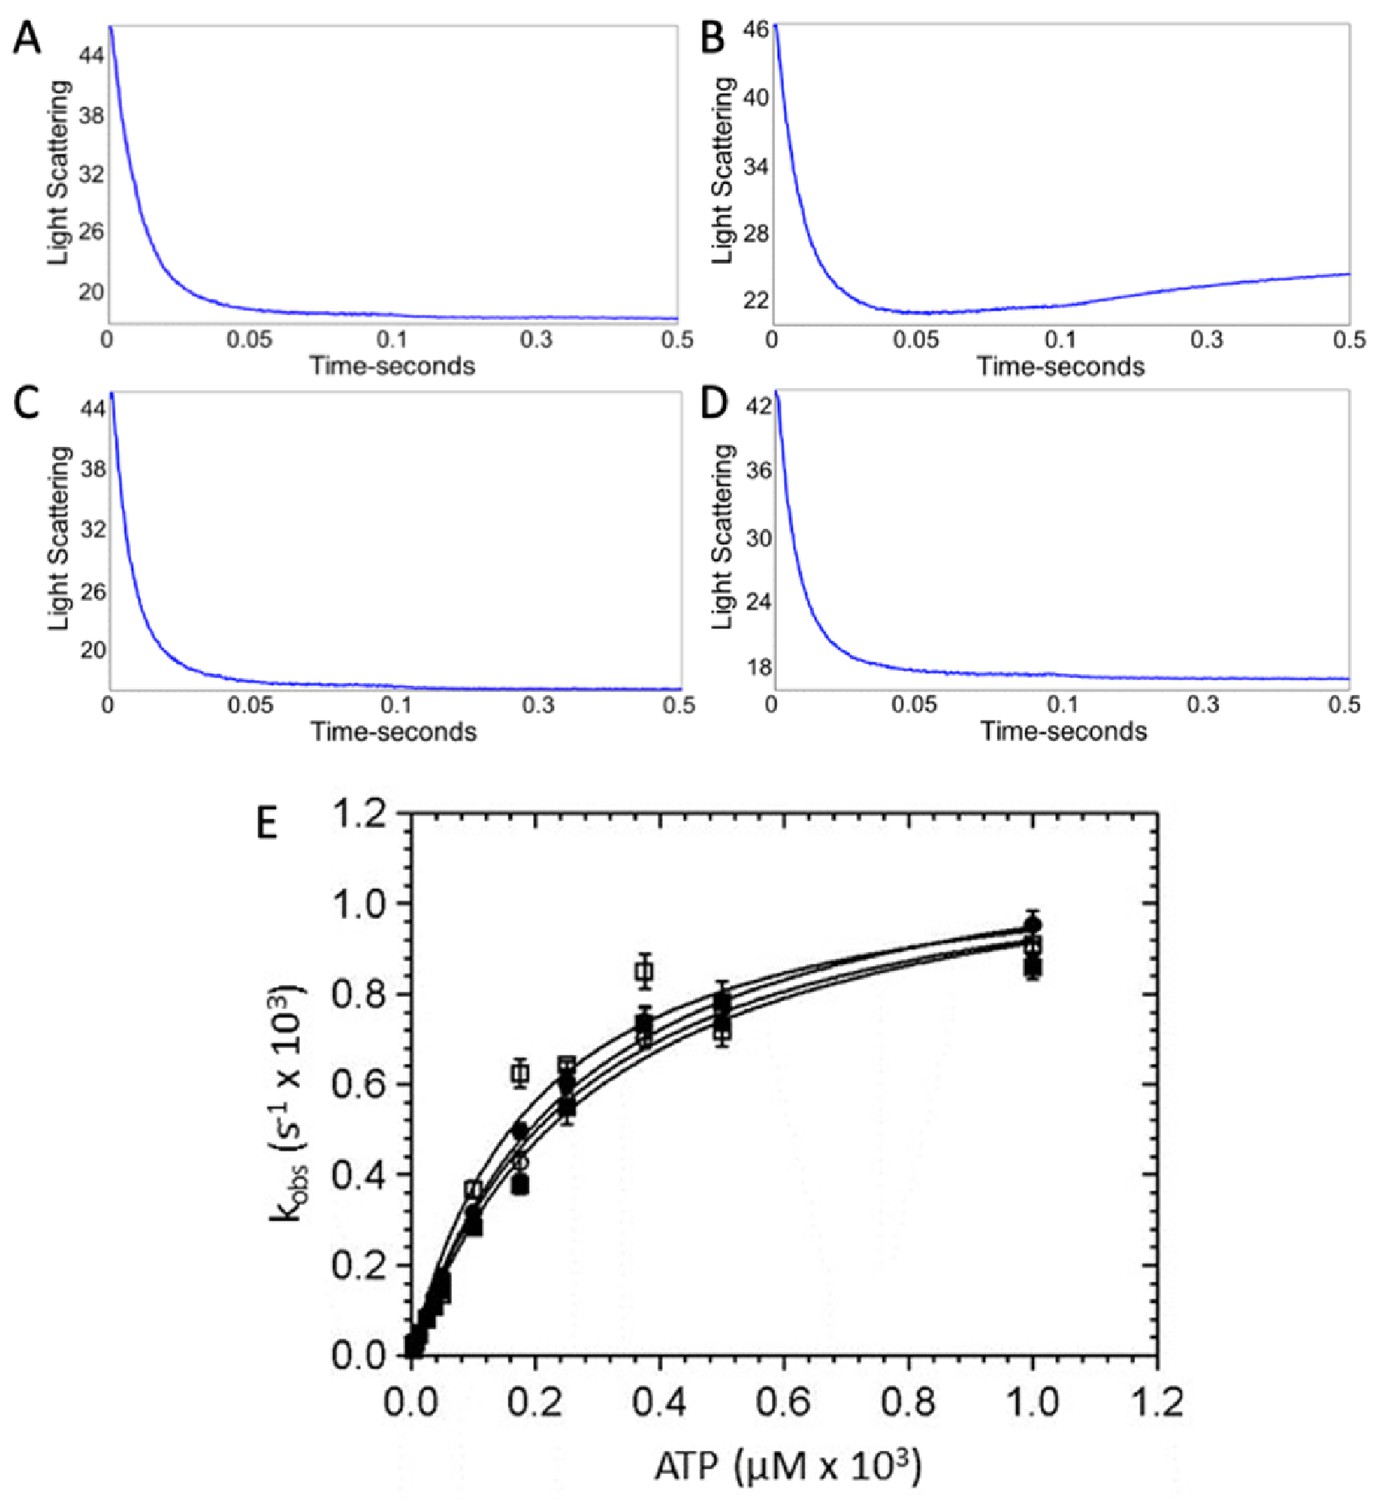
ATP-induced dissociation of β-cardiac myosin from actin.
A decrease in light scattering due to actomyosin dissociation was observed upon mixing 2.5 µM myosin and 6 µM actin with increasing concentrations of ATP in a stopped flow device. Representative traces showing the change in light scattering in arbitrary units at 50 µM ATP in the presence and absence of omecamtiv mecarbil (OM) for wild-type (WT)- and R712L-myosins. Representative traces for (A) WT-myosin (105 s−1, 19 s−1), (B) WT-myosin + OM (108 s−1, 2.4 s−1), (C) R712L-myosin (155 s−1, 32 s−1), and (D) R712L-myosin + OM (147 s−1, 29 s−1). (E) Rate of actomyosin dissociation as a function of ATP concentration. (■) WT-myosin, (□) WT-myosin + 50 µM OM, (●) R712L-myosin, (○) R712L-myosin + 50 µM OM. Solid lines are fitted hyperbolae with constants given in Table 1. Experimental conditions in the cuvette: 1.25 μM myosin, 3 µM actin, 3.75 µM-1 mM ATP, 5 mM MOPS (pH 7.2), 2 mM MgCl2, 25 mM KCl, 0.25% DMSO and either 0 or 50 µM OM, 20°C. This figure is related to the data displayed on Table 1.
Figure 1—figure supplement 7
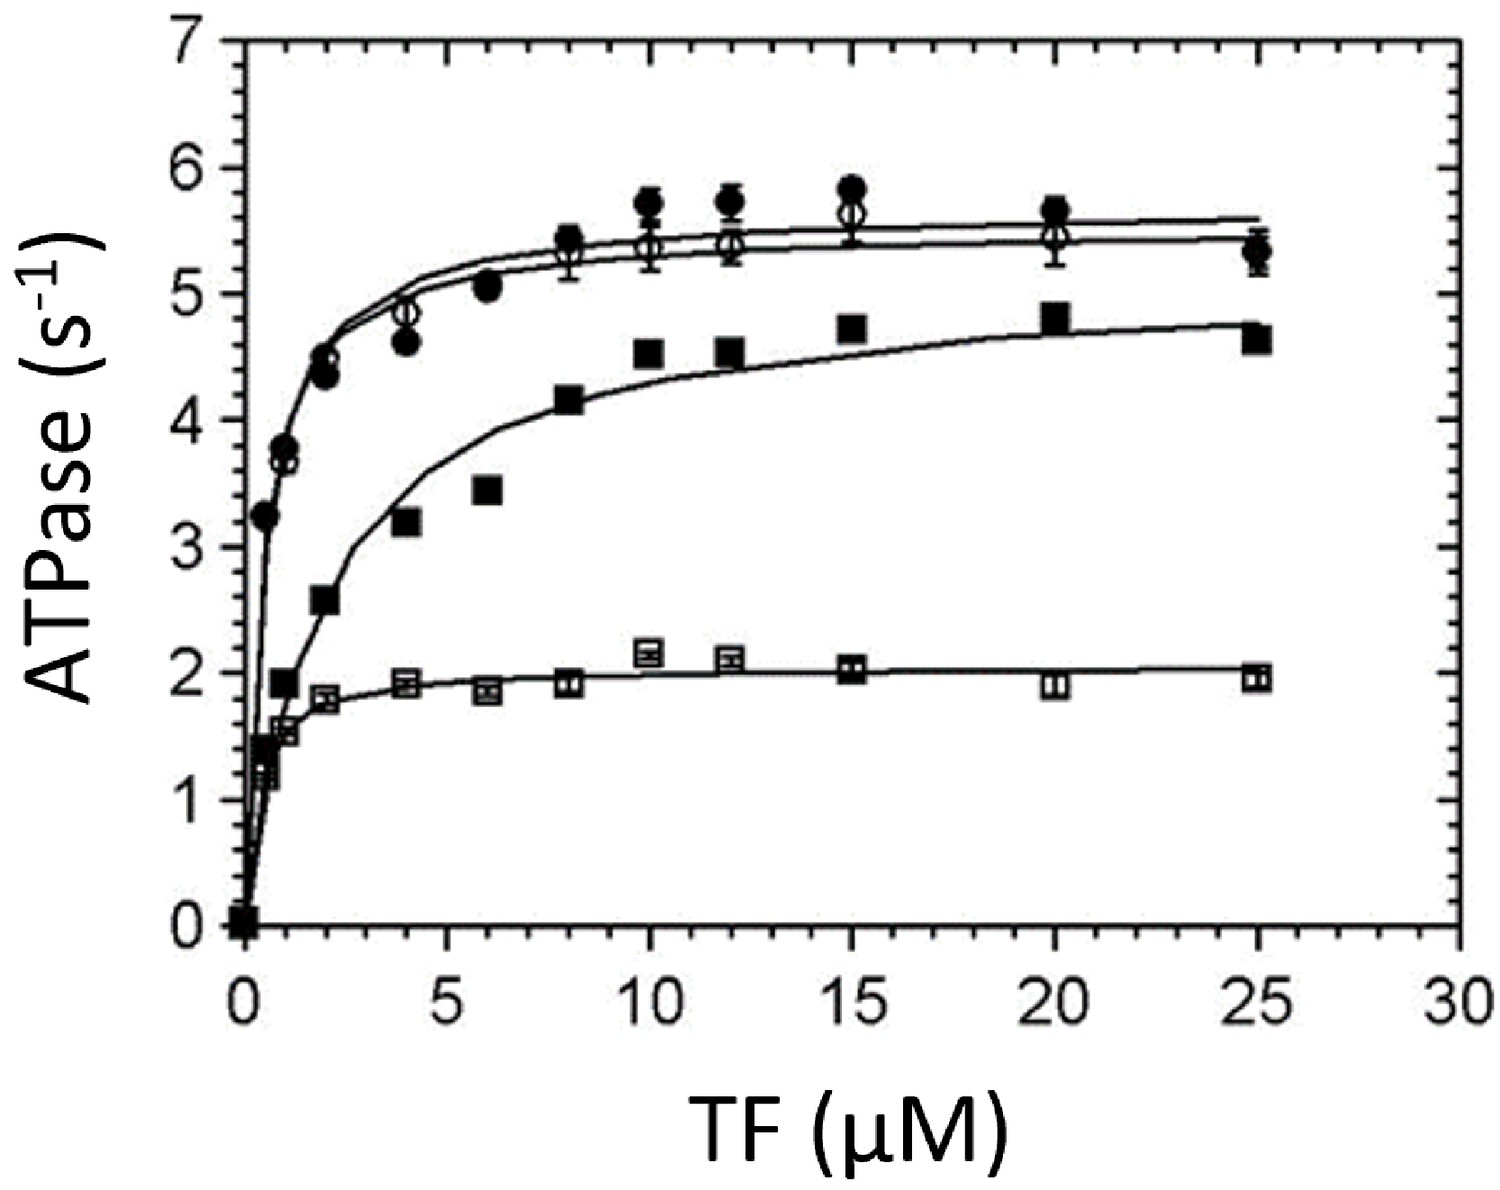
Thin-filament (TF) activation of steady-state ATPase activity.
Steady-state ATPase rates were measured using an NADH-coupled assay at 25°C (5 mM MOPS pH 7.2, 2 mM MgCl2, 1 mM DTT, 2 mM ATP, 0.01 mM EGTA, 0.1 mM CaCl2, 0.5% DMSO, and either 0 or 50 µM omecamtiv mecarbil [OM]). 0.02–0.025 µM myosin and 0–25 µM actin concentration in TFs were used. (■) Wild-type (WT)-myosin, (□) WT-myosin + 50 µM OM, (●) R712L, (○) R712L + 50 µM OM. Solid lines are fits of the data by hyperbolic functions, with constants given in Table 1.
Figure 1—figure supplement 8
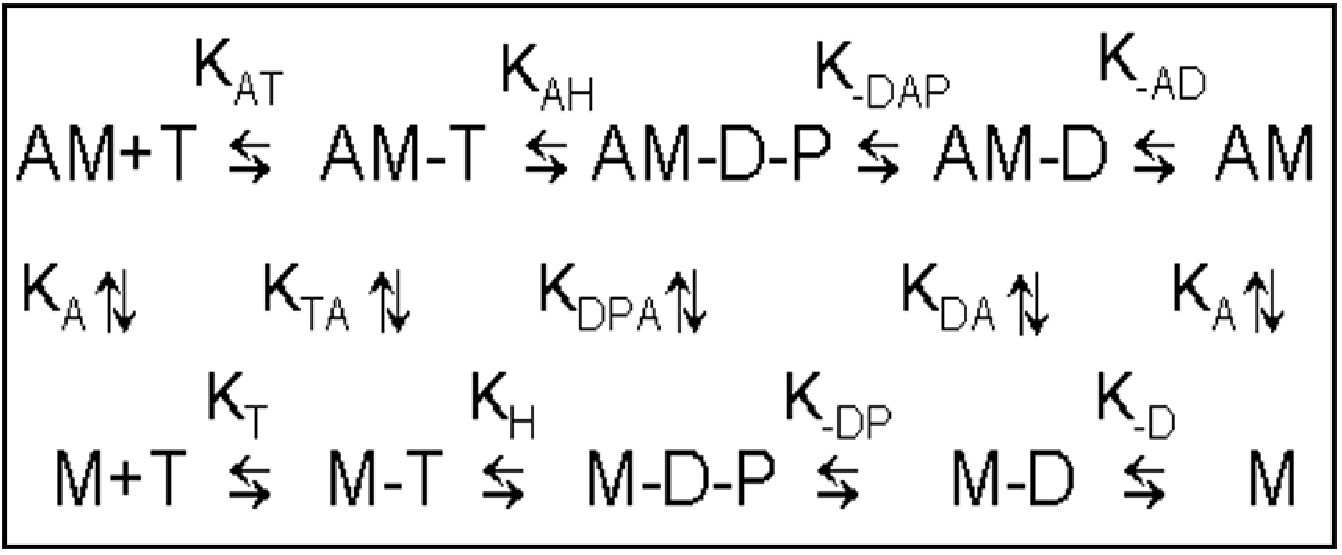
Minimal kinetic scheme of the ATPase cycle.
M = human β-cardiac myosin HMM fragment, T = ATP, D = ADP, P = phosphate. Positive subscripts denote the binding of the last ligand in the subscript, negative subscripts denote dissociation (e.g., k-AD is the dissociation of ADP from acto.c-HMM.ADP). This scheme is related to the data displayed on Table 1.
Figure 2
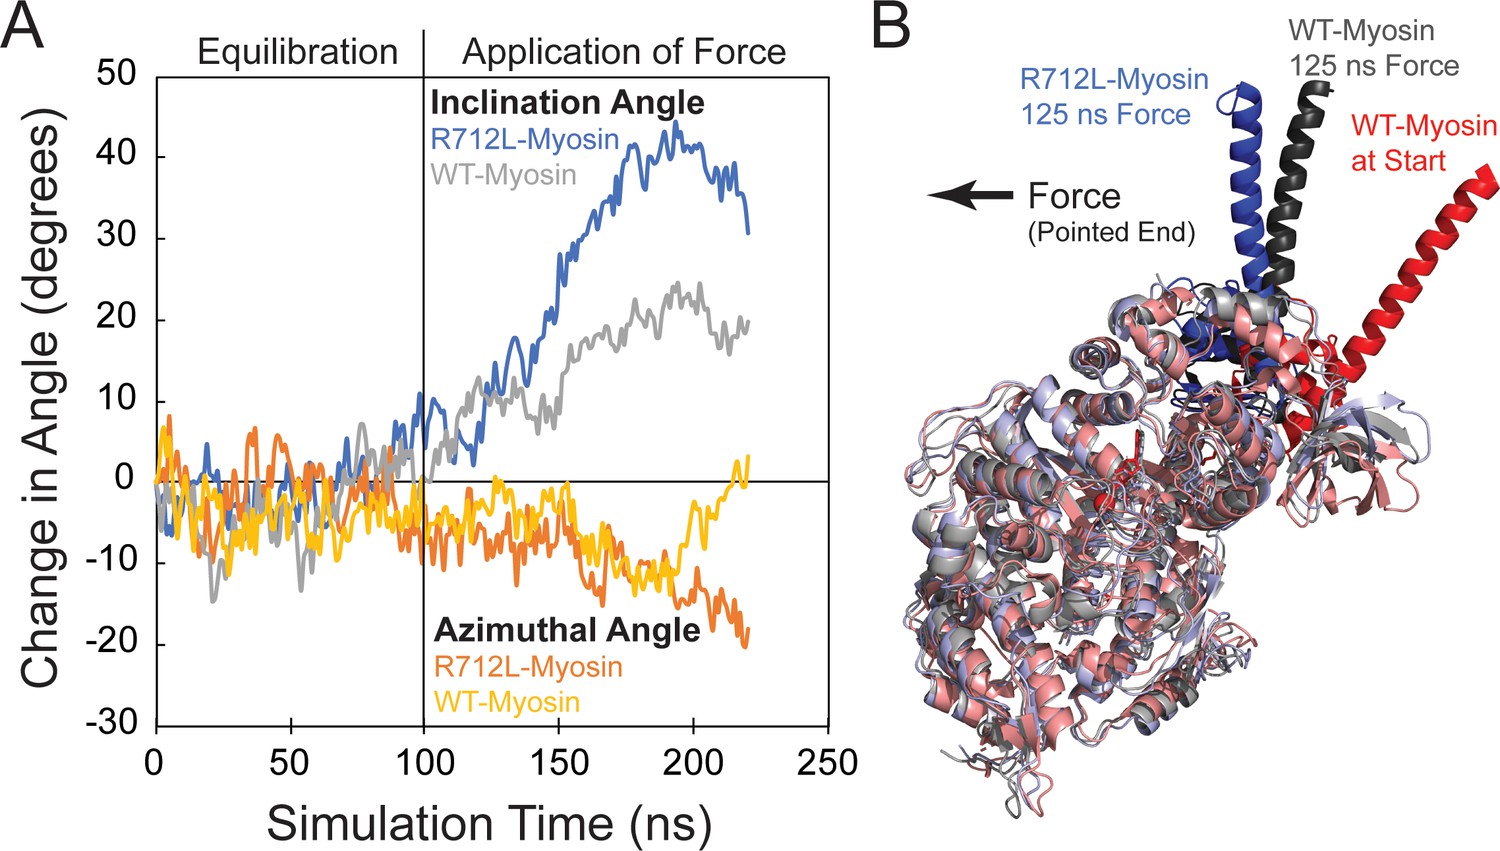
The R712L mutation affects the coupling of the motor domain to the lever arm helix.
(A) Inclination and azimuthal angle positions of wild-type (WT)- and R712L-myosins during MD equilibration and steered molecular dynamics (MD) pulling simulations. Force is applied to the lever arm helix at 100 ns (see Materials and methods). Each curve is the average of two independent simulations. The inclination angle is defined as the angle between the actin filament axis and a vector along the lever arm helix (LAH) between residues 768–788. The change in angle is the unloaded time-zero inclination angle (127°) minus the loaded inclination angle. The azimuth is the angle between the X axis and the projection of the LAH vector onto the X-Y plane. Positive azimuth angles are counter-clockwise when viewed from the pointed end toward the barbed end of the filament. (B) Simulated structures after pulling the LAH (bold colors) for 125 ns. To clearly show the LAH positions, light chains were removed and motor domain residues are shown in muted colors. The arrow shows the force vector, as pulling occurred toward the pointed end and parallel to the long-axis of a hypothetically bound actin filament.
-
Figure 2—source data 1
Excel files with data from Figure 2.
- https://cdn.elifesciences.org/articles/63691/elife-63691-fig2-data1-v1.zip
Figure 3
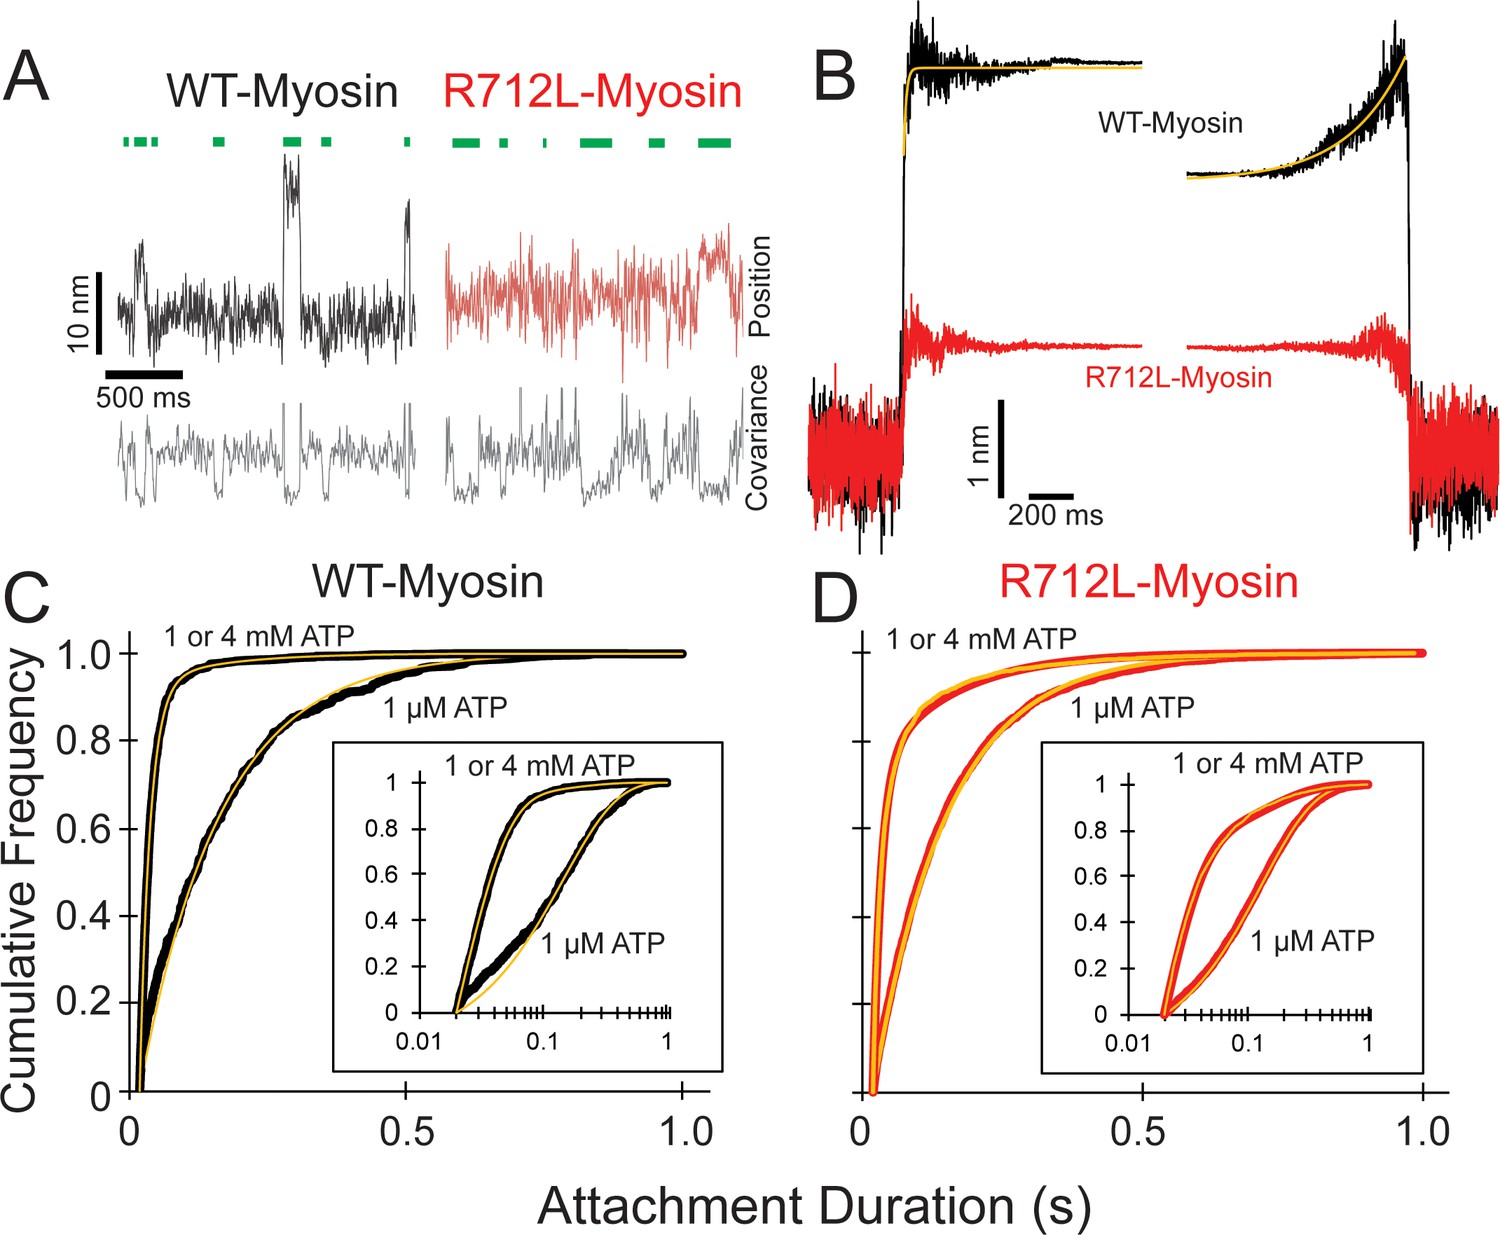
R712L-myosin has a reduced working stroke compared to WT-myosin but normal attachment durations.
(A) Optical trapping displacement and covariance traces showing the position of one bead during multiple interactions of wild-type (WT)-(black) and R712L-(red)-myosins with the actin dumbbell. Green bars indicate binding events identified by decreases in bead covariance (gray traces; see Materials and methods). An averaging window of 30 ms was used for covariance traces, and the position traces shown were smoothed to 5 ms to clarify the displacements. (B) Binding events were synchronized at their beginnings and ends and were averaged forward or backward in time, respectively. The average working stroke of R712L-myosin is substantially smaller than that of WT-myosin. WT-myosin has two clear steps in its working stroke, whereas substeps could not be resolved in R712L-myosin. Yellow lines are single exponential fits to the data. (C and D) Cumulative distributions of attachment durations for WT- (C) and R712L-myosin (D) at 1 µM and saturating MgATP. Inset shows the same data on a semi-log scale. For (C) and (D) yellow lines are fitted exponential distributions, where the 1 µM ATP data were well fit by single exponentials, and the saturating 1 and 4 mM ATP data were best described by the sum of two exponentials.
-
Figure 3—source data 1
Excel files with data from Figure 3.
- https://cdn.elifesciences.org/articles/63691/elife-63691-fig3-data1-v1.zip
Figure 4 with 1 supplement
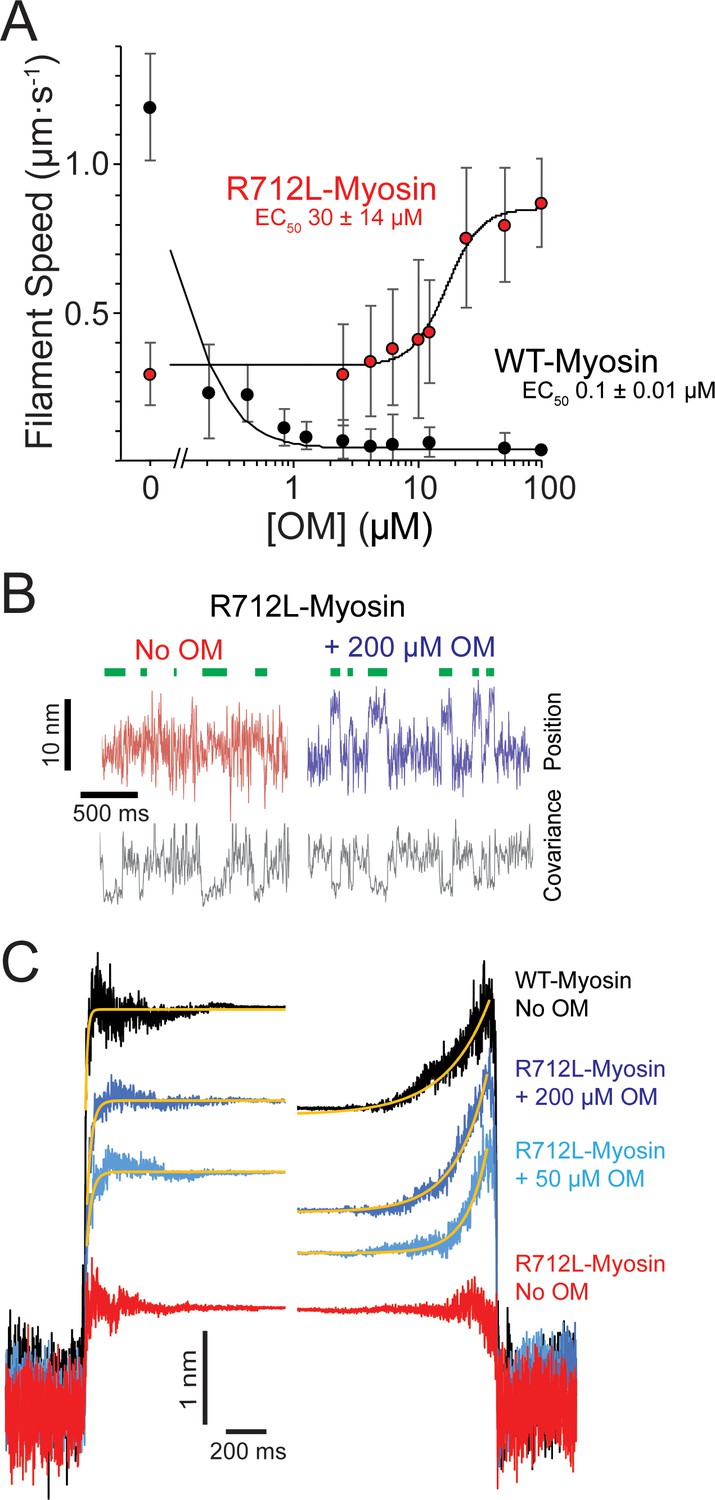
OM rescues the working stroke of R712L-myosin despite suppressing the working stroke of WT-myosin.
(A) The speeds of individual fluorescently labeled actin filaments were quantified in gliding filament motility assays for WT-(black) and R712L-(red)-myosins as a function of omecamtiv mecarbil (OM) concentration. Speeds sharply decreased for WT-myosin with increasing OM, while a partial rescue of motility was observed for R712L-myosin at a higher EC50. Errors for the EC50 are derived from the fits of the titration data. (B) Single molecule displacement and covariance traces showing R712L-myosin interactions with actin dumbbells in the absence (red) and presence (blue) of 200 µM OM. Green bars indicate attachment events as detected by covariance (grey) decreases. Displacements were substantially larger upon addition of 200 µM OM. (C) Ensemble averages of single-molecule interactions synchronized at event beginnings and averaged forward in time (left) or synchronized at event ends and averaged backward in time (right). The ensemble averages for WT-and R712L-myosins in the absence of OM are replotted from Figure 3 for comparison. Yellow lines are single-exponential fits to the data (Table 2).
-
Figure 4—source data 1
Excel files with data from Figure 4.
- https://cdn.elifesciences.org/articles/63691/elife-63691-fig4-data1-v1.zip
Figure 4—figure supplement 1
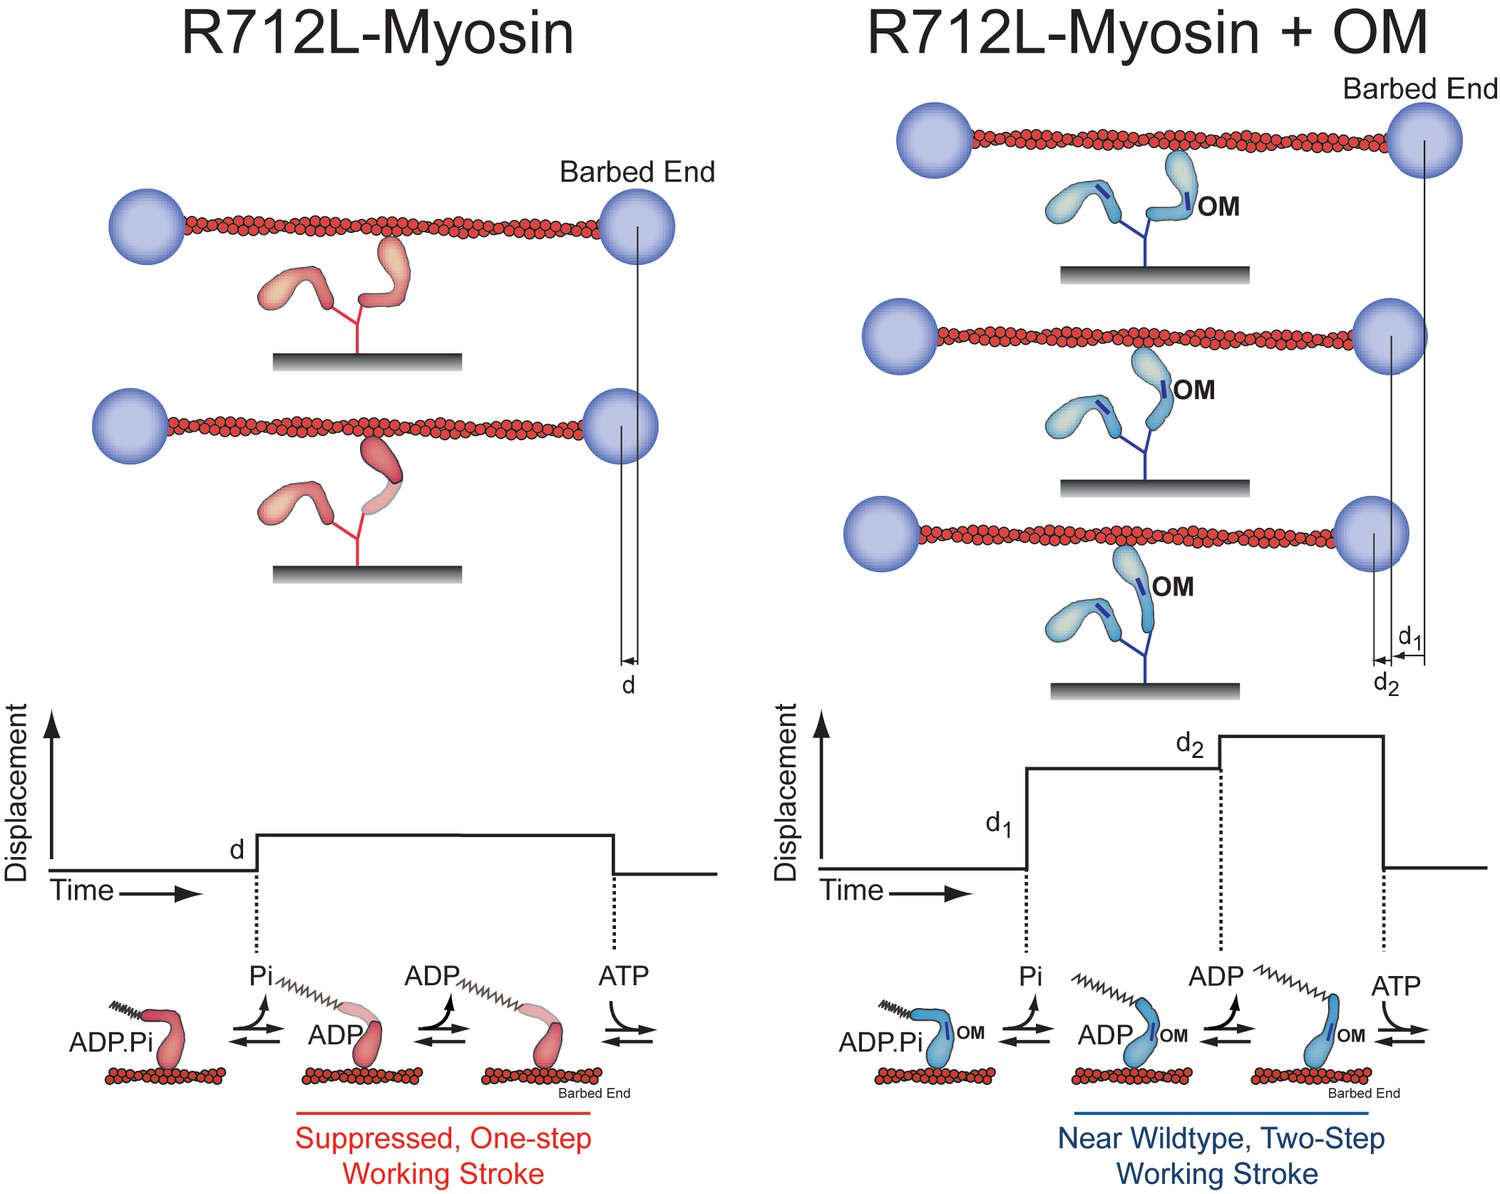
Model for inhibition of the R712L-myosin working stroke and rescue by OM.
Using the three-bead optical trapping assays we found that R712L-myosin performs its working stroke in one step (left), while addition of the drug omecamtiv mecarbil (OM, blue bars) restores the working stroke back to a two-step process (right) similar to that observed in WT-myosin. This working model is derived from the forward and reverse ensemble averages found in Figure 4C. The lever arm of R712L-myosin fragments (red) is shaded to indicate an altered conformation and/or possible variability in the lever arm position upon binding to the actin filament. (Bottom) Idealized traces and corresponding lever arm positions and nucleotide-bound state for R712L-myosin and R712L-myosin plus OM. Based on the detachment rates found in Table 3, the small, one-step displacement (d) observed in R712L-myosin is likely linked to phosphate release, while the two-step displacement (d1+d2) for R712L-myosin + OM is likely linked to phosphate release and ADP release, respectively, as is the case for WT-myosin.
Figure 5
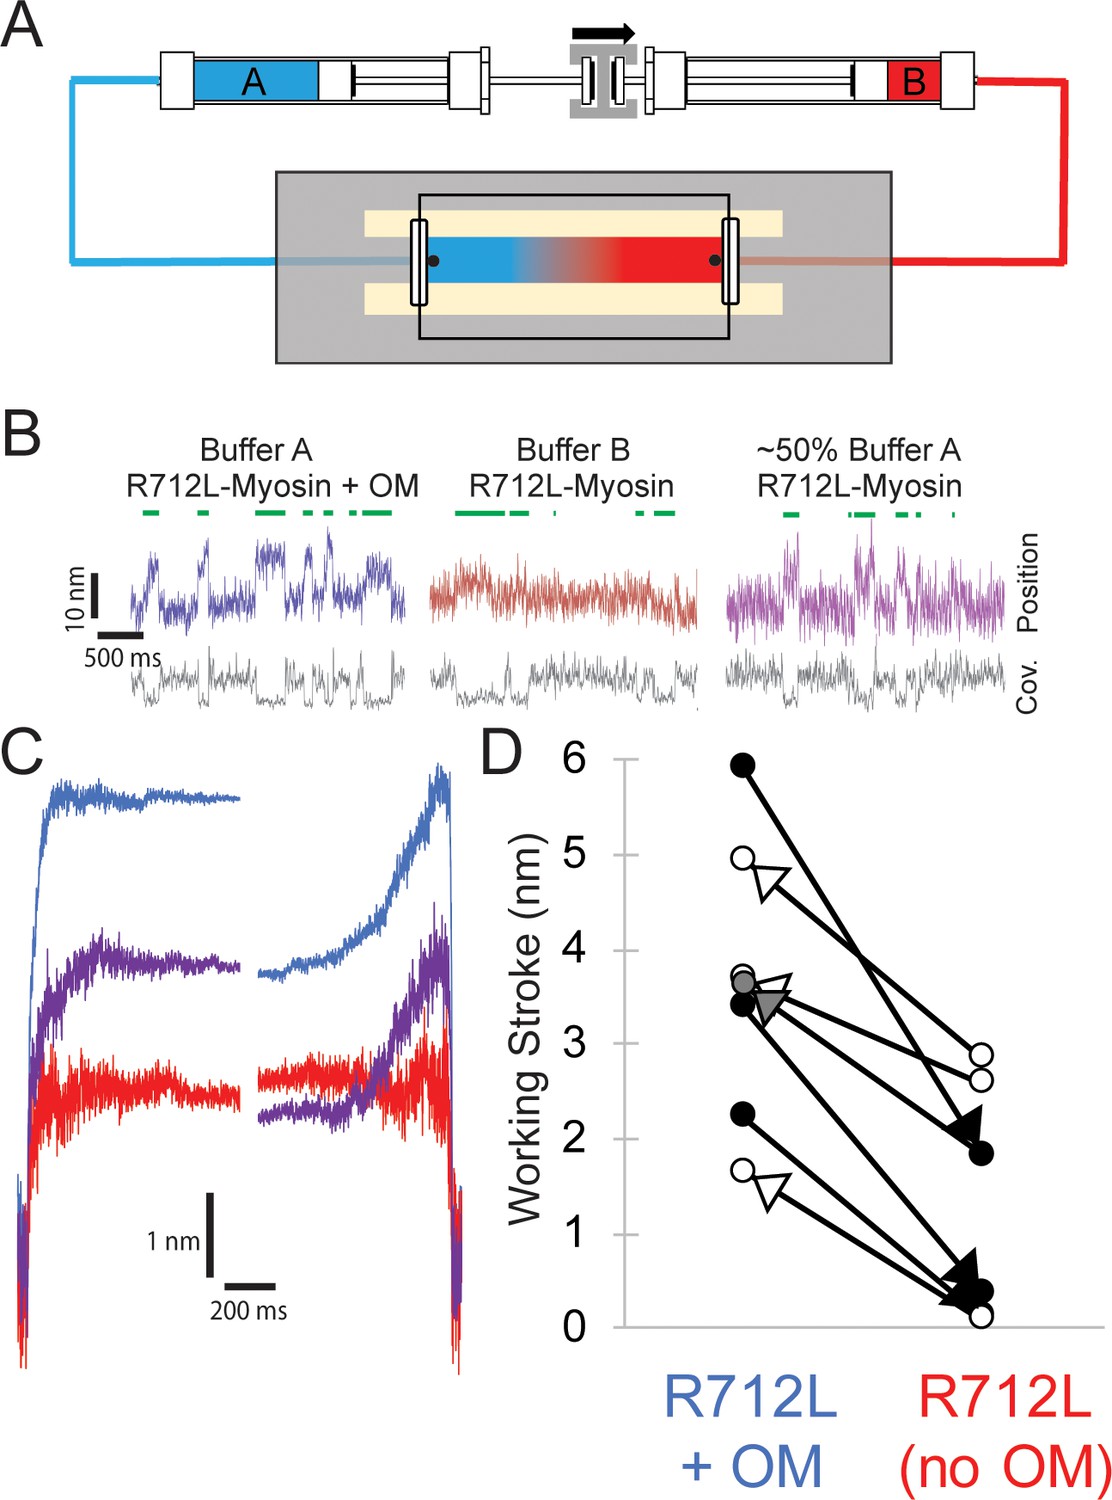
Reversible rescue of a single R712L-myosin molecule by OM as revealed by real-time buffer exchange.
(A) Diagram of flow cell and back-to-back syringes used for buffer exchange experiments during optical trapping assays (see Materials and methods). A single molecule is initially interrogated with ‘buffer A’ (blue) in the chamber, which is exchanged with ‘buffer B’ (red) at a rate of ~0.5 chamber volumes per minute via action of a push-pull syringe pump (an average linear flow rate of ~0.5 mm⋅s−1). Precise control of pushing and extracting the buffer, in addition to maintenance of the stage with positional feedback, allows analysis of the same molecule under different solution conditions. (B) Example traces of an individual myosin molecule under multiple buffer conditions. (Left, blue) The initial trace showing displacements in the presence of OM, followed by attachment events with smaller displacements in OM-free buffer (center, red), followed again by a partial rescue of working strokes as the OM-containing buffer reversed and re-entered the chamber (right, purple). (C) Ensemble averages of the molecule from (B), with a shortened working stroke upon washout of OM, and a partial rescue of the working stroke after partial re-addition of OM. (D) Working stroke amplitude in the presence and absence of OM from flow experiments. Each line represents the change in total observed working stroke via ensemble averaging of records from an individual molecule under multiple buffer conditions. Black arrowheads indicate experiments where buffer A contained OM and buffer B lacked OM, and in each case a reduced working stroke was observed. White arrowheads indicate experiments where buffer A lacked OM and buffer B contained OM. In each case addition of OM increased the working stroke. The gray arrowhead depicts the partial rescue experiment in which a mixture of Buffer A and buffer B was in the chamber after reversal of the flow.
-
Figure 5—source data 1
Excel files with data from Figure 5.
- https://cdn.elifesciences.org/articles/63691/elife-63691-fig5-data1-v1.zip
Videos
Video 1
The four panels of this video illustrate the contrasting effect of OM on WT- and R712L-myosins.
All panels are from the same experiment with the same surface density of cardiac HMM and correspond to 100 frames captured at 5 frames/s and played back in the short clip at 30 frames/s. The faster playback frame rate is necessary to show the slow movement of the wild-type (WT)-myosin at 12.5 µM omecamtiv mecarbil (OM). Actin filament velocities measured for each condition are: WT-no OM: 1.45 µm/s, R712L-no OM: 0.27 µm/s, WT+12.5 µM: OM 0.06 µm/s, and R712L+50 µM OM: 0.81 µm/s. The last image in each panel is a maximum projection of the image stacks revealing the tracks followed by the individual filaments. Each panel is 96 x 73 µm.
Video 2
Molecular dynamics simulations suggest that the R712L mutation weakens connections between the relay helix and converter domain.
Simulations of (left) wild-type (WT)-myosin (6FSA with bound light chain) and (right) R712L-myosin where R712 was replaced with an L. Videos are 200 ns in length with 1 ns per frame played back at 30 frames per second.
Video 3
The R712L mutation affects the coupling of the motor domain relay helix to the converter/lever arm.
Animated molecular dynamics trajectory showing 100 ns equilibration of β-cardiac myosin (PDB: 6FSA) with (blue) and without (grey) the R712L mutation. The initial structure is shown in red, and the cylinders show the positions of the lever arm helix axes. After 100 ns, the lever arm helix is pulled for 125 ns (see Materials and methods). The arrow shows the force vector, as pulling occurred toward the pointed end and parallel to the long-axis of a hypothetically bound actin filament.
Video 4
Morph created in PyMOL showing interpolated trajectory between the initial structure (PDB: 6FSA) and the last frame of the 100 ns equilibration (Figure 2, Video 3).
The position of OM (yellow) was determined from PDB: 4PA0. The converter domain and lever arm helix are shown in dark blue. A clash (red arrow) is shown that would occur between the OM and amino acid residues P710-I713 of the converter if OM remained in its wild-type (WT) binding site. Movement of the OM to accommodate the new converter position would disrupt the extensive packing interactions between OM and the SH1-helix region and the central beta-sheet of the motor domain important for OM binding (Winkelmann et al., 2015); therefore, such a movement of OM is unlikely.
Tables
Table 1
Transient and steady-state kinetic characterization of β-cardiac HMM variants with and without OM.
| Kinetic step | *Method | Rate/ equilibrium constant | WT-myosin | WT-myosin + OM | R712L-myosin | R712L-myosin + OM |
|---|---|---|---|---|---|---|
| ADP dissociation | SF-LC | k-AD (s−1) KAD (µM) | 73 ± 2.3 19 ± 1.2 | 82 ± 3.5$ 22 ± 1.1 | 142 ± 11* 34 ± 1.8 | 157 ± 6.0 36 ± 1.8 |
| Dissociation of AM by ATP | SF-LC | k-TA (s−1) | 1191 ± 109 | 1129 ± 80 | 1201 ± 42 | 1168 ± 43 |
| ATP binding to AM | SF-LC | kAT (μM−1s−1) | 4.2 ± 1.2 | 5.9 ± 1.5 | 4.5 ± 0.5 | 4.4 ± 0.5 |
| ATP hydrolysis | SF-Fluor | kH + k-H (s−1) | 167 ± 3.2 | 138 ± 3.0$ | 87 ± 2.0* | 88 ± 2.0 |
| ATP binding | SF-Fluor | kT (μM−1s−1) | 5.6 ± 0.6 | 5.5 ± 0.6 | 7.1 ± 1.0 | 6.9 ± 0.9 |
| Pi release (TF) | MDCC-PBP | k-DAP (s−1) KTF (µM) | 7.3 ± 0.8 <1 | 31 ± 1.1$ 3.7 ± 0.59 | 17 ± 0.6* <1 | 17 ± 0.4 2.1 ± 0.78 |
| Pi release | MDCC-PBP | k-DP (s−1) | 0.014 ± 0.002 | 0.009 ± 0.001$ | 0.019 ± 0.004 | 0.014 ± 0.002 |
| TF-activated steady-state ATPase pCa = 4 | NADH-coupled assay | Vmax (s−1) KATPase (µM) | 5.1 ± 0.1 1.9 ± 0.2 | 2.1 ± 0.1 0.35 ± 0.11 | 5.7 ± 0.1* 0.48 ± 0.06 | 5.5 ± 0.1 0.43 ± 0.06 |
| Unloaded shortening velocity | Motility | µm⋅s−1 | 1.46 ± 0.11 | 0.05 ± 0.01$ | 0.29 ± 0.02* | 1.1 ± 0.26# |
-
Key kinetic rate and equilibrium constants were determined by various methods: SF-LC: stopped flow light scattering; SF-Fluor: stopped flow tryptophan fluorescence; MDCC-PBP: N-[2-(1-maleimidyl)ethyl]−7-(diethylamino)coumarin-3-carboxamide-phosphate binding protein; motility: in vitro motility assay; TF: native porcine thin filaments; OM: omecamtiv mecarbil. All data are presented as mean ± S.D. (N = three independent preparations). *p<0.01 (R712L-myosin- vs WT-myosin), $p<0.02 (WT-myosin + OM vs WT-myosin), #p<0.01 (R712L-myosin + OM vs R712L-myosin).
Table 2
Rates and displacement sizes of time-forward and time-reversed ensemble averages.
Uncertainties are standard errors of the fit.
| Ensemble alignment | kobs (s−1) | Displacement (nm) | |||
|---|---|---|---|---|---|
| Total | 1st substep | 2nd substep | |||
| Wild type | Forward | 99.1 ± 4.17 | 4.41 | 3.32 | 1.09 |
| Reverse | 4.59 ± 0.04 | ||||
| R712L | Forward | N.D. | 1.29 | N.D. | N.D. |
| Reverse | N.D. | ||||
| R712L + OM (50 µM) | Forward | 39.8 ± 0.91 | 2.66 | 1.82 | 0.84 |
| Reverse | 9.61 ± 0.07 | ||||
| R712L + OM (200 µM) | Forward | 41.8 ± 0.06 | 3.42 | 2.28 | 1.14 |
| Reverse | 6.29 ± 0.03 | ||||
-
*Data are plotted in Figure 4C. OM: omecamtiv mecarbil.
Table 3
Exponential fits to attachment durations.
Uncertainties are 95% confidence interval limits from bootstrapping.
| ATP (μM) | k1 (s−1) | k2 (s−1) | A | |
|---|---|---|---|---|
| Wild type | 1 | 6.89 +0.7/- 0.6 | – | – |
| 1000 | 54.4 +5.7/-4.8 | 7.5 +3.8/-2.4 | 0.97 +0.02/-0.01 | |
| R712L | 1 | 7.56 +0.3/-2.4 | – | – |
| 1000 | 69.7 +9.0/-6.7 | 7.4 +1.2/-1.0 | 0.91 +0.01/-0.01 | |
| R712 + omecamtiv mecarbil (50 µM) | 1 | 7.9 +0.3/- 0.2 | – | – |
| 1000 | 63.8 +7.8/-6.5 | 6.0 +1.9/-1.4 | 0.94 +0.08/-0.07 |
-
*Data are plotted in Figure 3C-D.
Additional files
Download links
A two-part list of links to download the article, or parts of the article, in various formats.
Downloads (link to download the article as PDF)
Open citations (links to open the citations from this article in various online reference manager services)
Cite this article (links to download the citations from this article in formats compatible with various reference manager tools)
Myosin with hypertrophic cardiac mutation R712L has a decreased working stroke which is rescued by omecamtiv mecarbil
eLife 10:e63691.
https://doi.org/10.7554/eLife.63691


