A naturalistic environment to study visual cognition in unrestrained monkeys
- Centre for Neuroscience, Indian Institute of Science Bangalore, India
- Department of Electrical Communication Engineering Indian Institute of Science, India
Figures
Figure 1 with 1 supplement
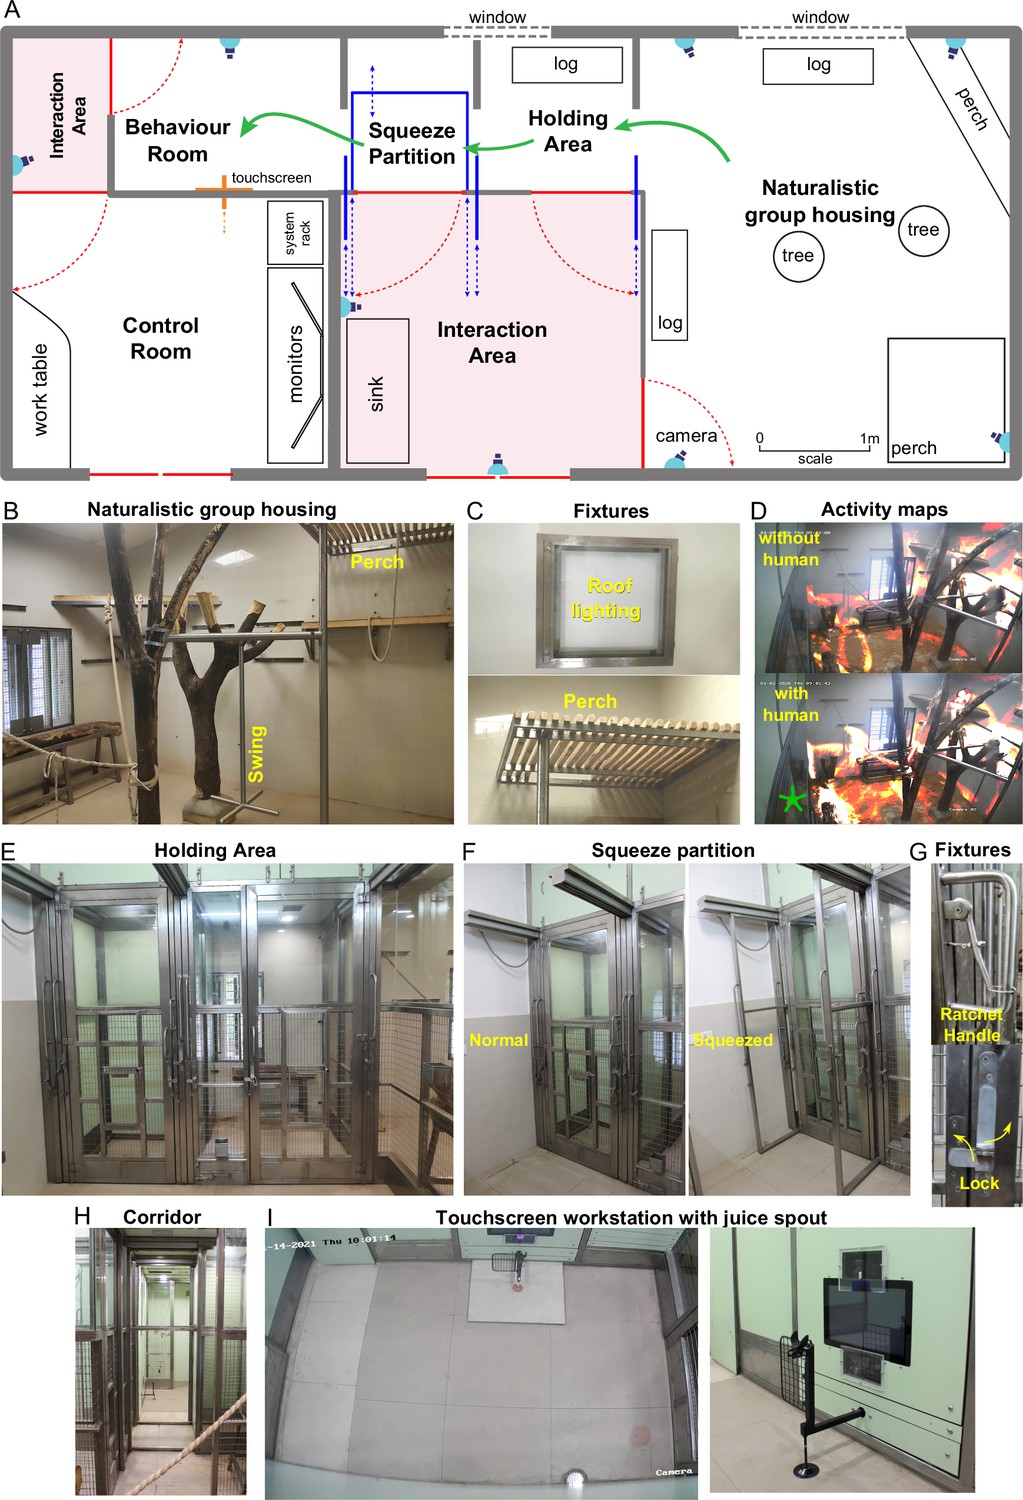
Overview of naturalistic environment.
(A) Illustrated layout of the environment designed to enable easy access for monkeys to behavioral tasks. Major features placed for enrichment are labelled. Blue lines indicate partitions for providing access to various portions of the play area. Typical movement of an animal is indicated using green arrows. Red lines indicate doors that are normally kept closed. (B) View into the play area from the interaction room showing the enriched environment. (C) Top: Roof lights that have been enclosed in stainless steel and toughened glass case to be tamper-proof. Bottom: Close up of the perch that provides monkeys with an elevated point of observation. (D) Top: Heatmap of residence duration of monkeys (red to yellow to white = less to more time spent in location) in the play area analyzed from a ~ 7 min video feed of one of the CCTV cameras. There was no human presence in the interaction room during this period. Bottom: The same residence analysis but with human presence in the interaction room during a ~ 7 min period on the same day. See Figure 1—video 1 (E) View from below the CCTV in the interaction area onto the squeeze and holding areas with trap-doors affixed to bring the monkey out into a chair when required. (F) The squeeze partition for temporarily restraining monkeys . Left: View of the partition in the normal open condition Right: View of the partition in the squeezed condition. (G) Top: Close-up view of the rachet mechanism to bring the squeeze partition forward. Bottom: Close-up view of the monkey-proof lock on each door. (H) View of the path taken by monkeys from play area through the holding and squeeze area into the behavior room. (I) Left: Top-down view from the CCTV in the behavior room showing the placement of the touchscreen on the modular panel wall and the juice reward arm in front of it. Right: Close-up view of the touchscreen and the juice reward arm.
Figure 1—video 1
Monkey movement in play area.
Figure 2 with 3 supplements
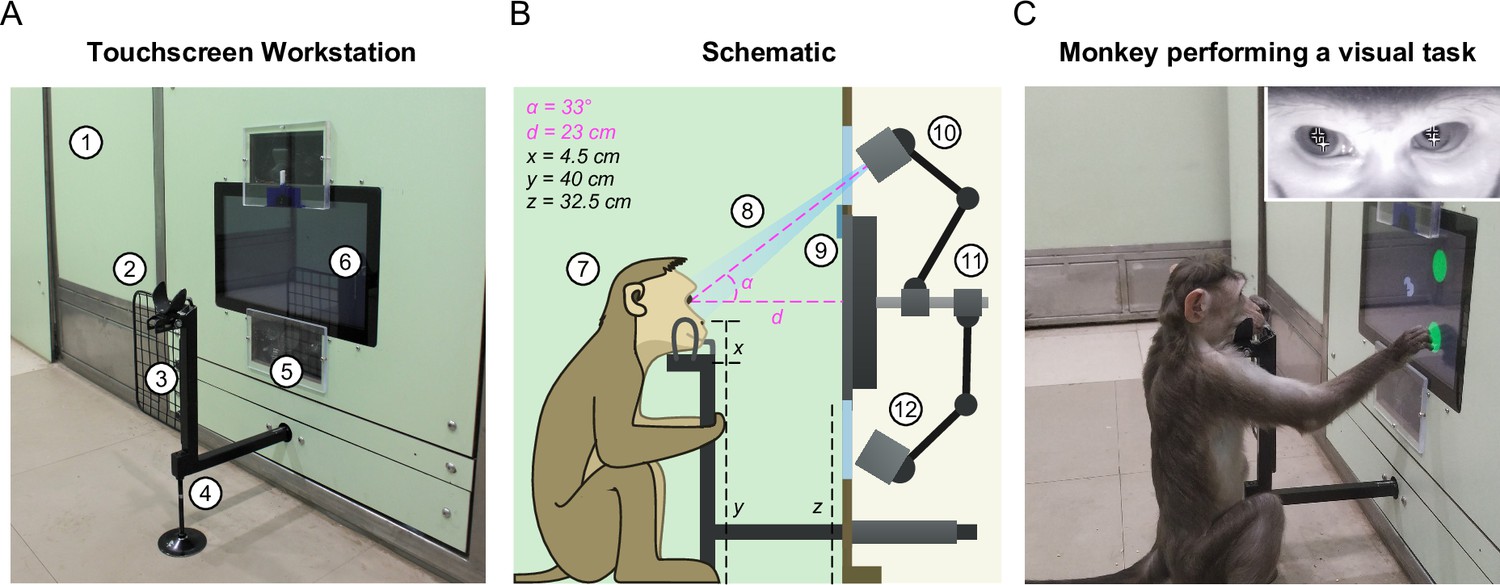
Touchscreen workstation with eye tracking for unrestrained monkeys.
(A) Labeled photograph of the touchscreen workstation from the monkey’s side. Labels: 1: Partition panel with electromagnetic shielding; 2: Chin rest; 3: Grill to block left-hand screen access; 4: Movable reward delivery arm with concealed juice pipe; 5: Transparent viewports 6: Touchscreen. (B) Labeled cross-section showing both monkey and experimenter sides. Labels: 7: Position of monkey at the workstation; 8: Field of view of the eye tracker; 9: Channel for mounting photodiode; 10: Eye tracker camera and additional synchronized optical video camera; 11: Adjustable arms mounted on the shaft behind touchscreen back panel; 12: Eye tracker IR illuminator. (C) Photograph of monkey M1 performing a task. . Inset: Screengrab from the ISCAN IR eye tracker camera feed while monkey was doing the task, showing the detected pupil (black crosshair with white border) and corneal reflection (white crosshair with black border).
Figure 2—figure supplement 1
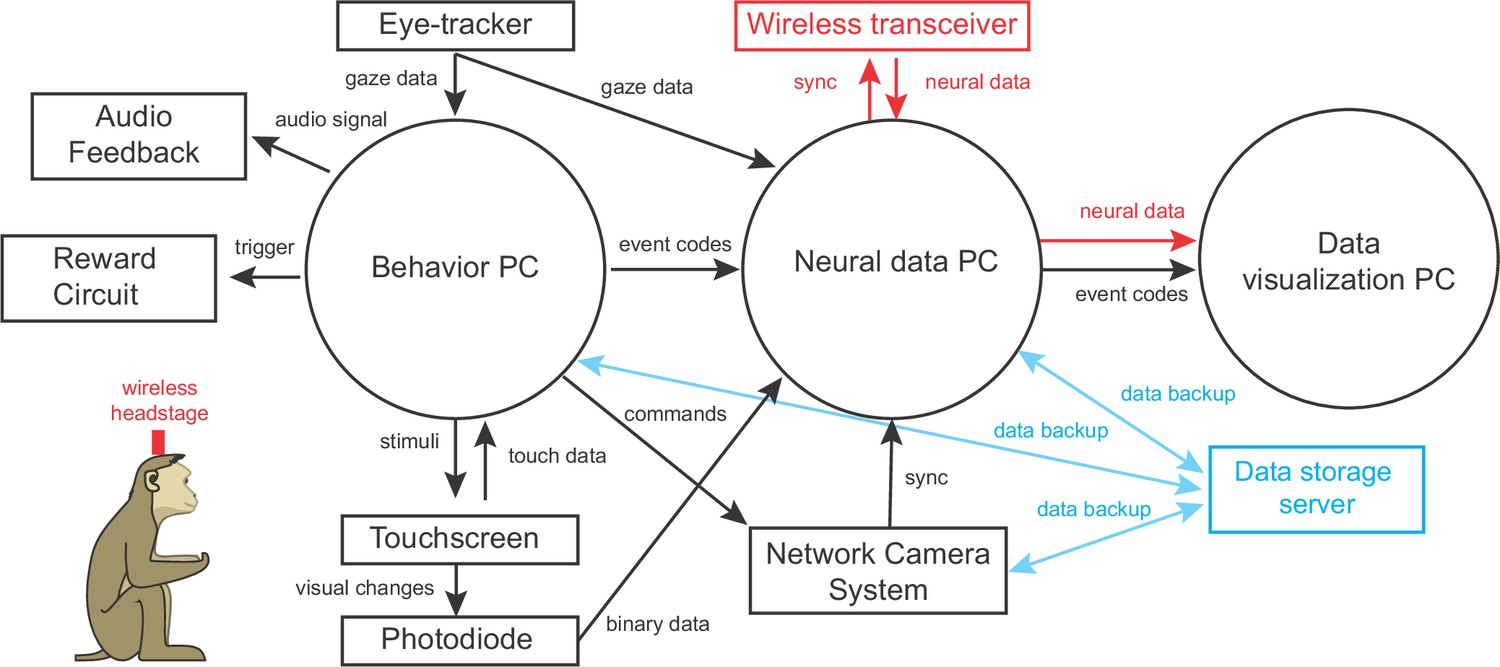
System components and technical specifications.
The above diagram shows all computers (circles), system components (rectangles) and input/output connections required to record behavioral data and wireless neural data in our naturalistic environment. The technical details of each component is listed as follows. Behavior PC - Eye tracker: ISCAN ETL 300-HD, 120 Hz system with camera lens customized to our angle of view and focal length requirements. The system outputs analog (x,y) eye signals that are connected to Behavior PC through the breakout box BNC-2110. Juice spout with chin/head frames: Shown in Figure 2—figure supplement 3A,B. Detailed design file available. Chin-rest & head-frames depicted in Figure 2—figure supplement 3. Network Camera System: e3Vision from White-Matter LLC with four cameras (placed above/below touchscreen, on behavior room roof, and on side wall of interaction area adjacent to behavior room). This system provides live video and video recordings synchronized to the neural data acquisition. Neural data PC: Intel Core i7; 16 GB RAM; 1 TB SSD; Windows 7. Receives task-related event markers from the Behavior PC and wired/wireless neural data from neural data acquisition system. Neural data acquisition system: eCube from White-Matter LLC with 640-channels, 64 bit digital IO, 32-ch analog inputs; Connected to neural data PC. Data visualization PC: Intel Core i9; 64 GB RAM; 1 TB SSD; Windows 10 OS; Receives streaming behavioral events and neural data and uses custom Python scripts to visualize the incoming data.
Figure 2—figure supplement 2
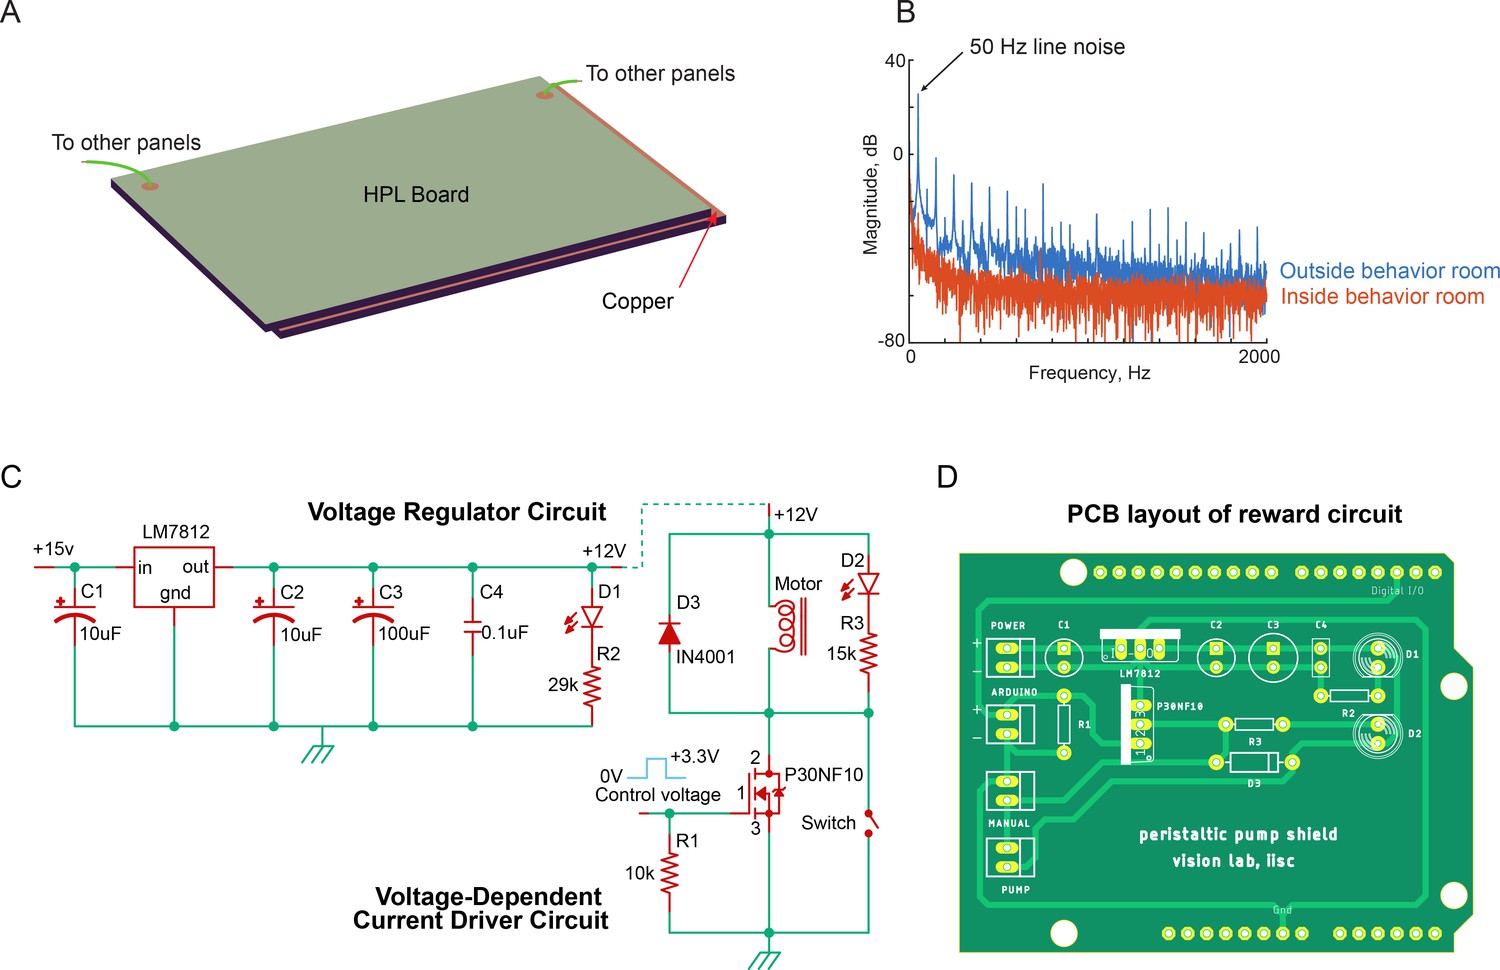
Electromagnetic shielding and reward system.
(A) Schematic of the copper sheet sandwiched between layers of high-pressure laminate panels. These panels are installed on the walls and roof of the behavior room and electrically connected to form a closed circuit to block external radio frequency noise. (B) Power spectrum (in dB) of noise recorded from the behavior room with shielding (red) and the control room without shielding (blue). The copper sandwiched panels in the behavior room and all stainless-steel supporting frames were connected electrically to the ground of the pre-amplifier. Signals were recorded at 40 kHz for 1 s using a 24-ch U-probe electrode floating in air connected to a 32-channel data acquisition system (Plexon Inc). (C) Circuit diagrams of the voltage regulator (left) and voltage-dependent current driver circuits (right) that are part of the reward system. (D) The layout of the printed circuit board (with the voltage regulator and voltage-dependent current driver circuits from panel C). This circuit board powers a peristaltic dosing pump to push juice into the juice pipe.
Figure 2—figure supplement 3
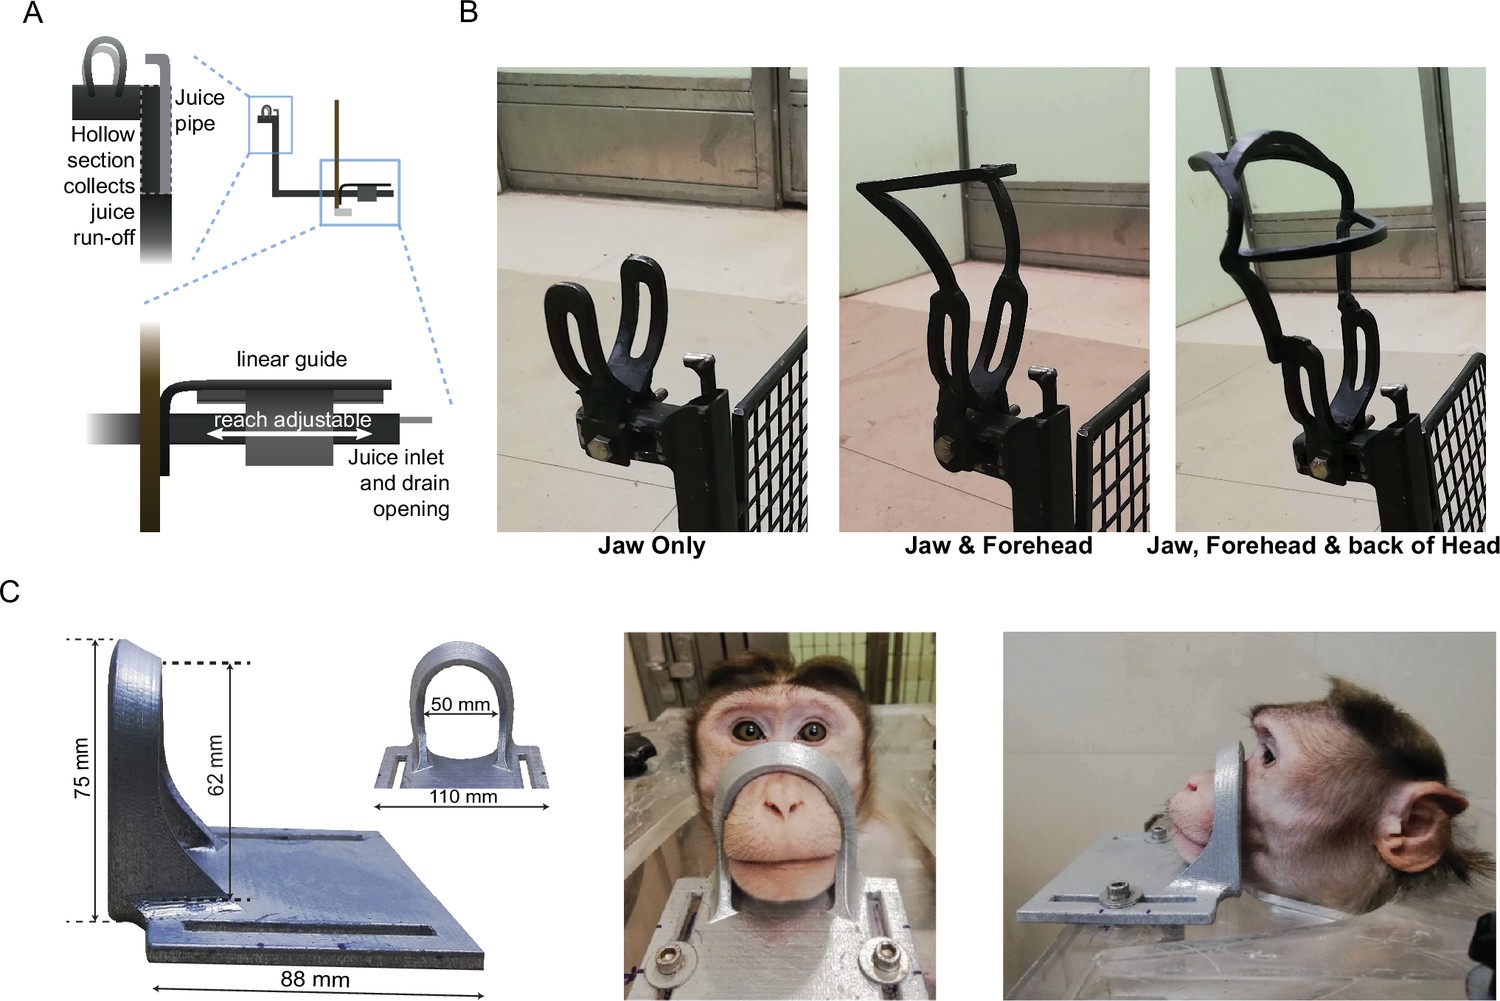
Custom juice spout and snout restraints.
(A) Schematic of juice reward arm. At top right, a close-up view of the spout portion of the juice reward arm showing how the juice pipe and drain-pipe are concealed within a tubular stainless-steel pipe. This prevents monkeys licking any run-off juice or from tampering with the thin steel juice pipe itself. Bottom close-up shows how the juice reward arm can be moved into and out of the behavior room to accommodate the monkey’s hand reach (using a lockable linear guide). (B) Photographs of three head frames with increasing levels of restraint (left to right). Each restraint is made from stainless steel rods bent to match the typical shape of the monkey head (obtained using 3D scanning). (C) Snout restraint used to temporarily restrain the monkey head (photo: monkey M2) for maintenance of brain implants or replacement of wireless logger batteries.
Figure 3 with 4 supplements
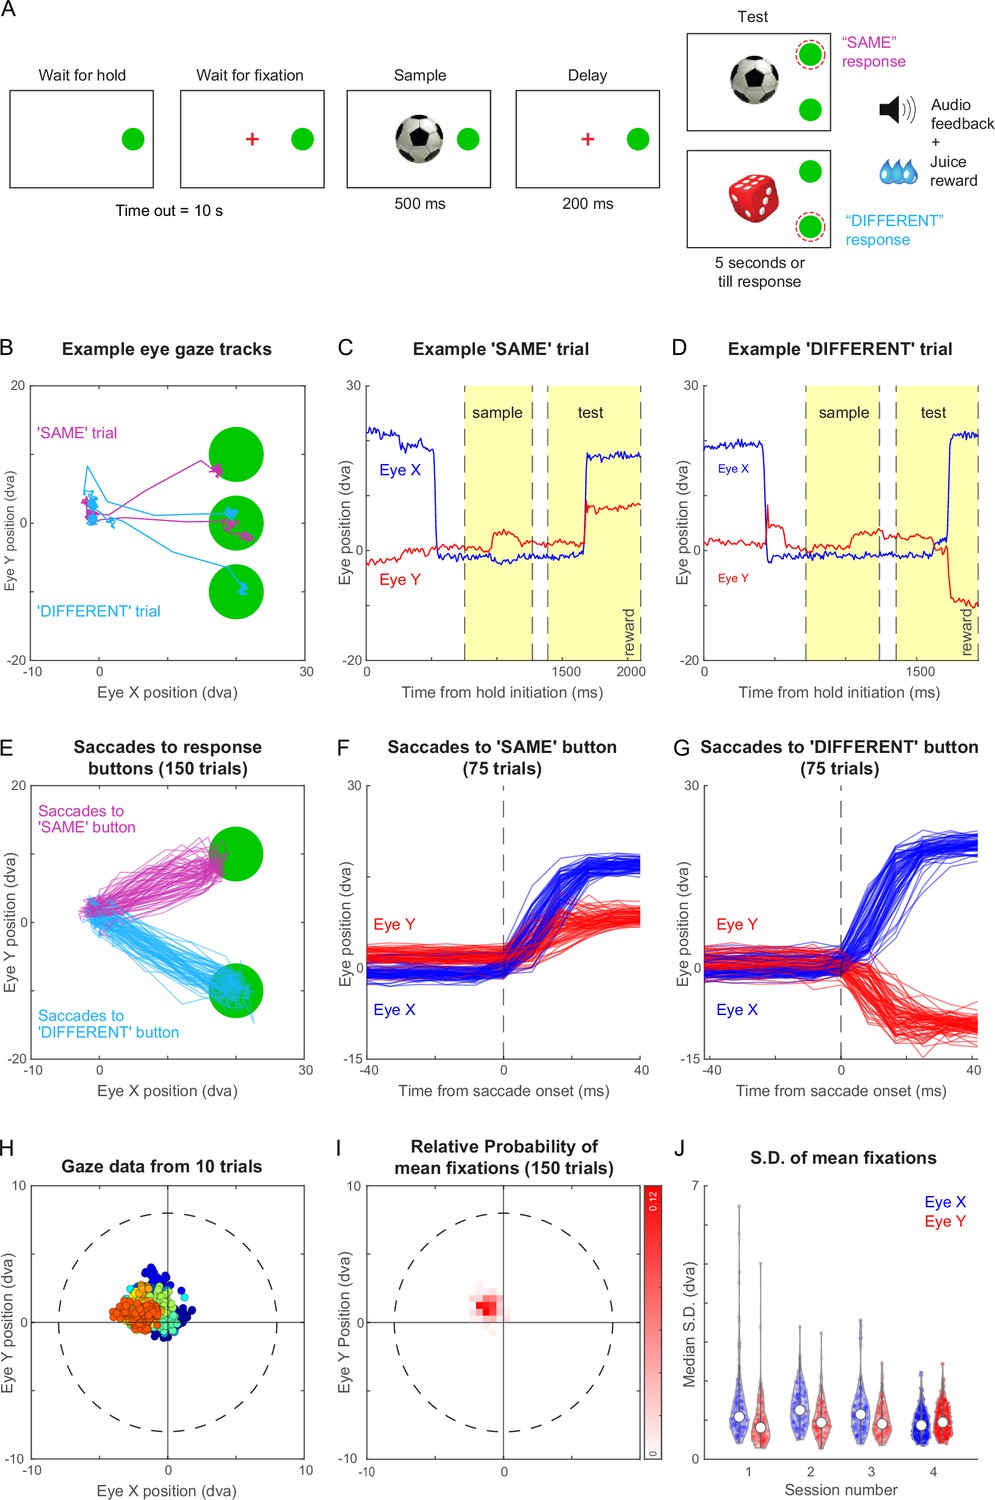
Same-different task with gaze-contingent tracking for monkey M1.
(A) Schematic sequence of events in the same-different task. The monkey had to touch the HOLD button and look at a fixation cross at the centre of the screen, after which a sample stimulus appeared for 500 ms followed by a blank screen for 200 ms. Following this a test stimulus appeared along with choice buttons for SAME and DIFFERENT responses. The monkey had to indicate by touching the appropriate button whether the sample and test were same or different. All trials were followed by different audio tones for correct and error trials, and the monkey received juice for correct trials. See Figure 3—video 1. (B) Eye traces overlaid on the stimulus screen, for one example SAME response trial (magenta) and one representative DIFFERENT trial (cyan) for monkey M1. (C) Horizontal (blue) and vertical (red) gaze position as a function of time during the SAME trial shown in (A). Dotted lines mark sample on, sample off, test on, and reward (from left to right respectively, along the x-axis). (D) Same as (C) but during a correct DIFFERENT choice trial in (A). (E) Horizontal and vertical gaze position during SAME response trials (magenta) and DIFFERENT response trials (cyan) over a total of 150 trials (75 SAME trials and 75 DIFFERENT trials). (F) Gaze position as a function of time (aligned to saccade onset) for the SAME response trials shown in (E). Saccade onset was defined based on the time at which saccade velocity attained 10% of the maximum eye velocity. (G) Same as (F) but for DIFFERENT response trials. (H) Gaze positions during 10 example trials during the fixation-contingent period in Session 4. The monkey had to maintain gaze during this period within a fixation window of 8 dva radius (dotted circle) centred at the middle of the screen (where sample and fixation spot were presented). Data from individual trials are shown in different colours. (I) 2D histogram of the mean gaze position in each trial across all 150 trials in (E) from Session 4. (J) Violin plot showing the standard deviation of gaze positions within each trial for both horizontal (Eye X) and vertical (Eye Y) directions across trials in four separate sessions (Sessions 1–4, where session four data is the same in panels B to I), overlaid with median (white dot) and inter-quartile range (vertical gray bar).
Figure 3—figure supplement 1
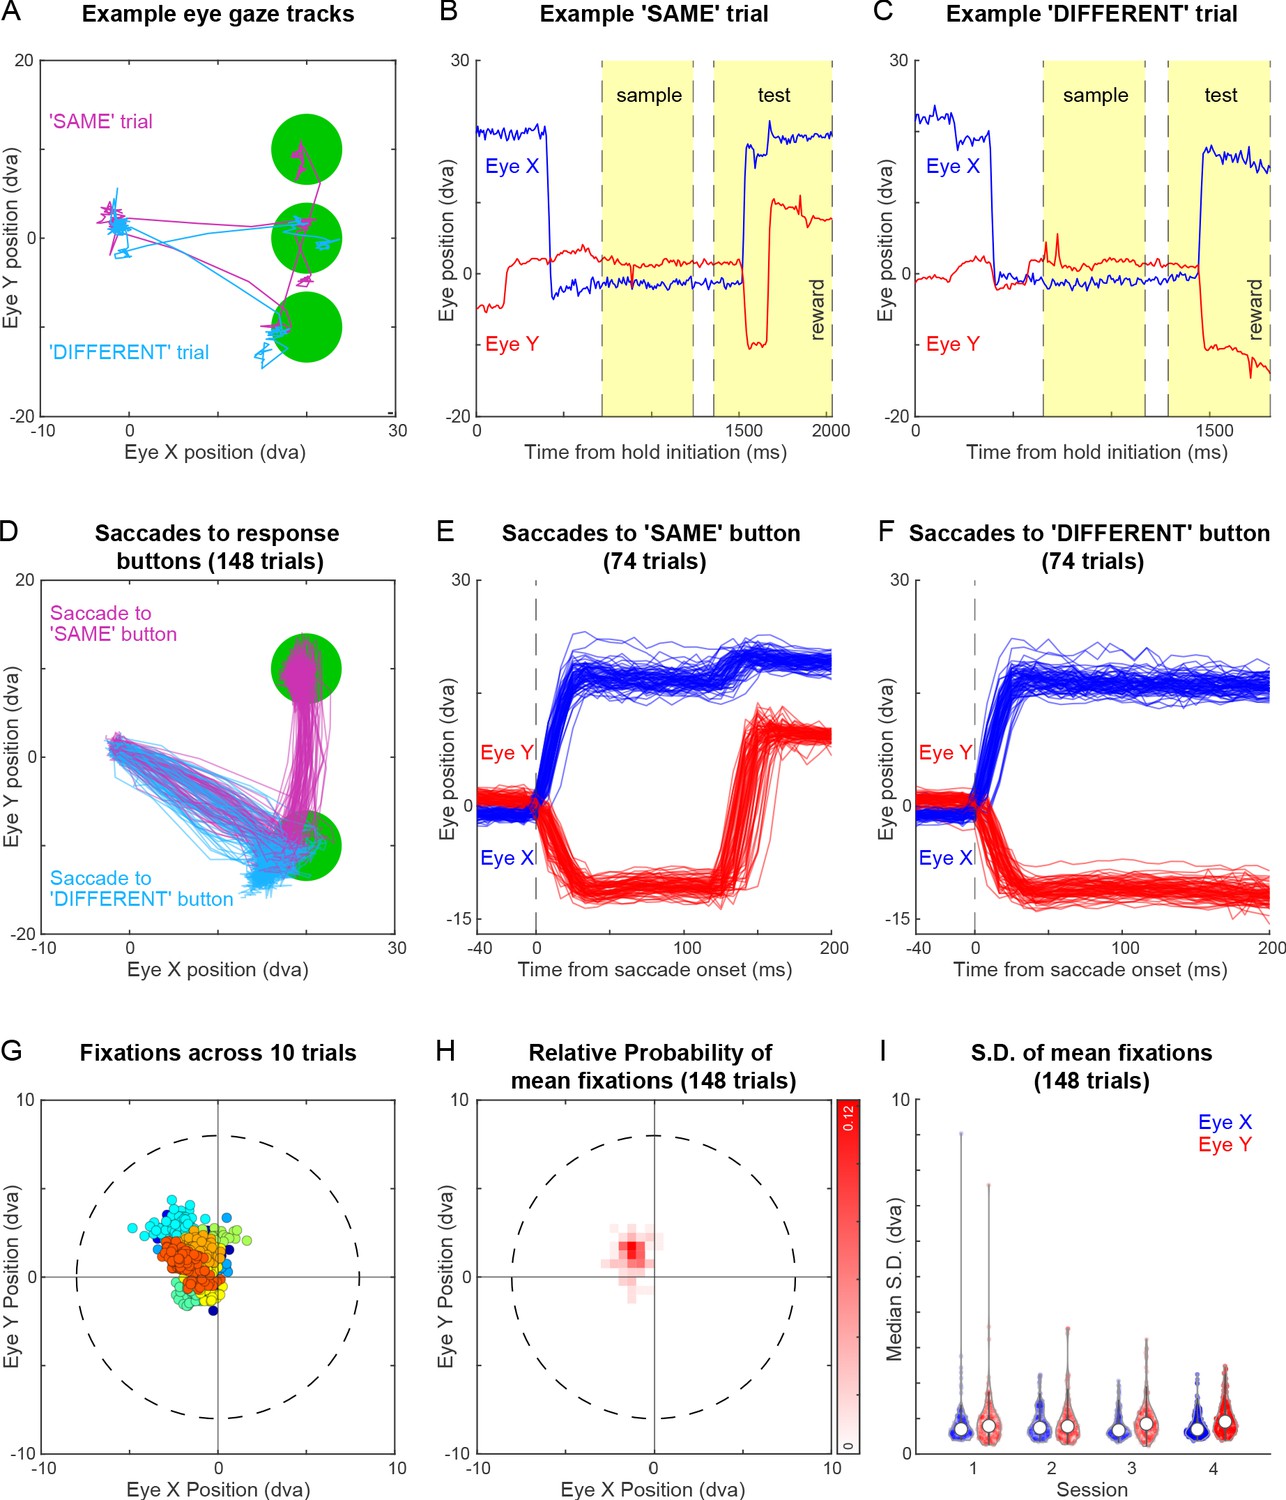
Eye tracking during same-different task for monkey M3.
(A) Eye traces overlaid on the stimulus screen, for one example SAME response trial (magenta) and one representative different trial (cyan) for monkey M3. (B) Horizontal (blue) and vertical (red) gaze position as a function of time during the SAME trial shown in (A). Dotted lines mark sample on, sample off, test on, and reward (from left to right respectively, along the x-axis). (C) Same as (B) but during a correct DIFFERENT choice trial in (A). (D) Horizontal and vertical gaze position during SAME response trials (magenta) and DIFFERENT response trials (cyan) over a total of 148 trials (74 SAME trials and 74 DIFFERENT trials). Unlike Monkey M1, Monkey M3 had the peculiar habit of looking first toward the DIFFERENT response button before looking at the SAME response button and then making the correct SAME response. (E) Gaze position as a function of time (aligned to saccade onset) for the SAME response trials shown in (D). Saccade onset was defined based on the time at which saccade velocity attained 10 % of the maximum eye velocity. (F) Same as (E) but for DIFFERENT response trials. (G) Gaze positions during 10 example trials during the fixation-contingent period. The monkey had to maintain gaze during this period within a 8° window (dotted circle) centred at the middle of the screen (where sample and fixation spot were presented). Data from each trial data is shown in a different colour. (H) 2D histogram of mean gaze position in each trial across all 148 trials in (D). (I) Violin plot showing the standard deviation of gaze positions within each trial for both horizontal (Eye X) and vertical (Eye Y) directions across trials in four separate sessions (Sessions 1–4, where session 4 data is the same in panels B to I), overlaid with median (white dot) and inter-quartile range (vertical gray bar).
Figure 3—figure supplement 2
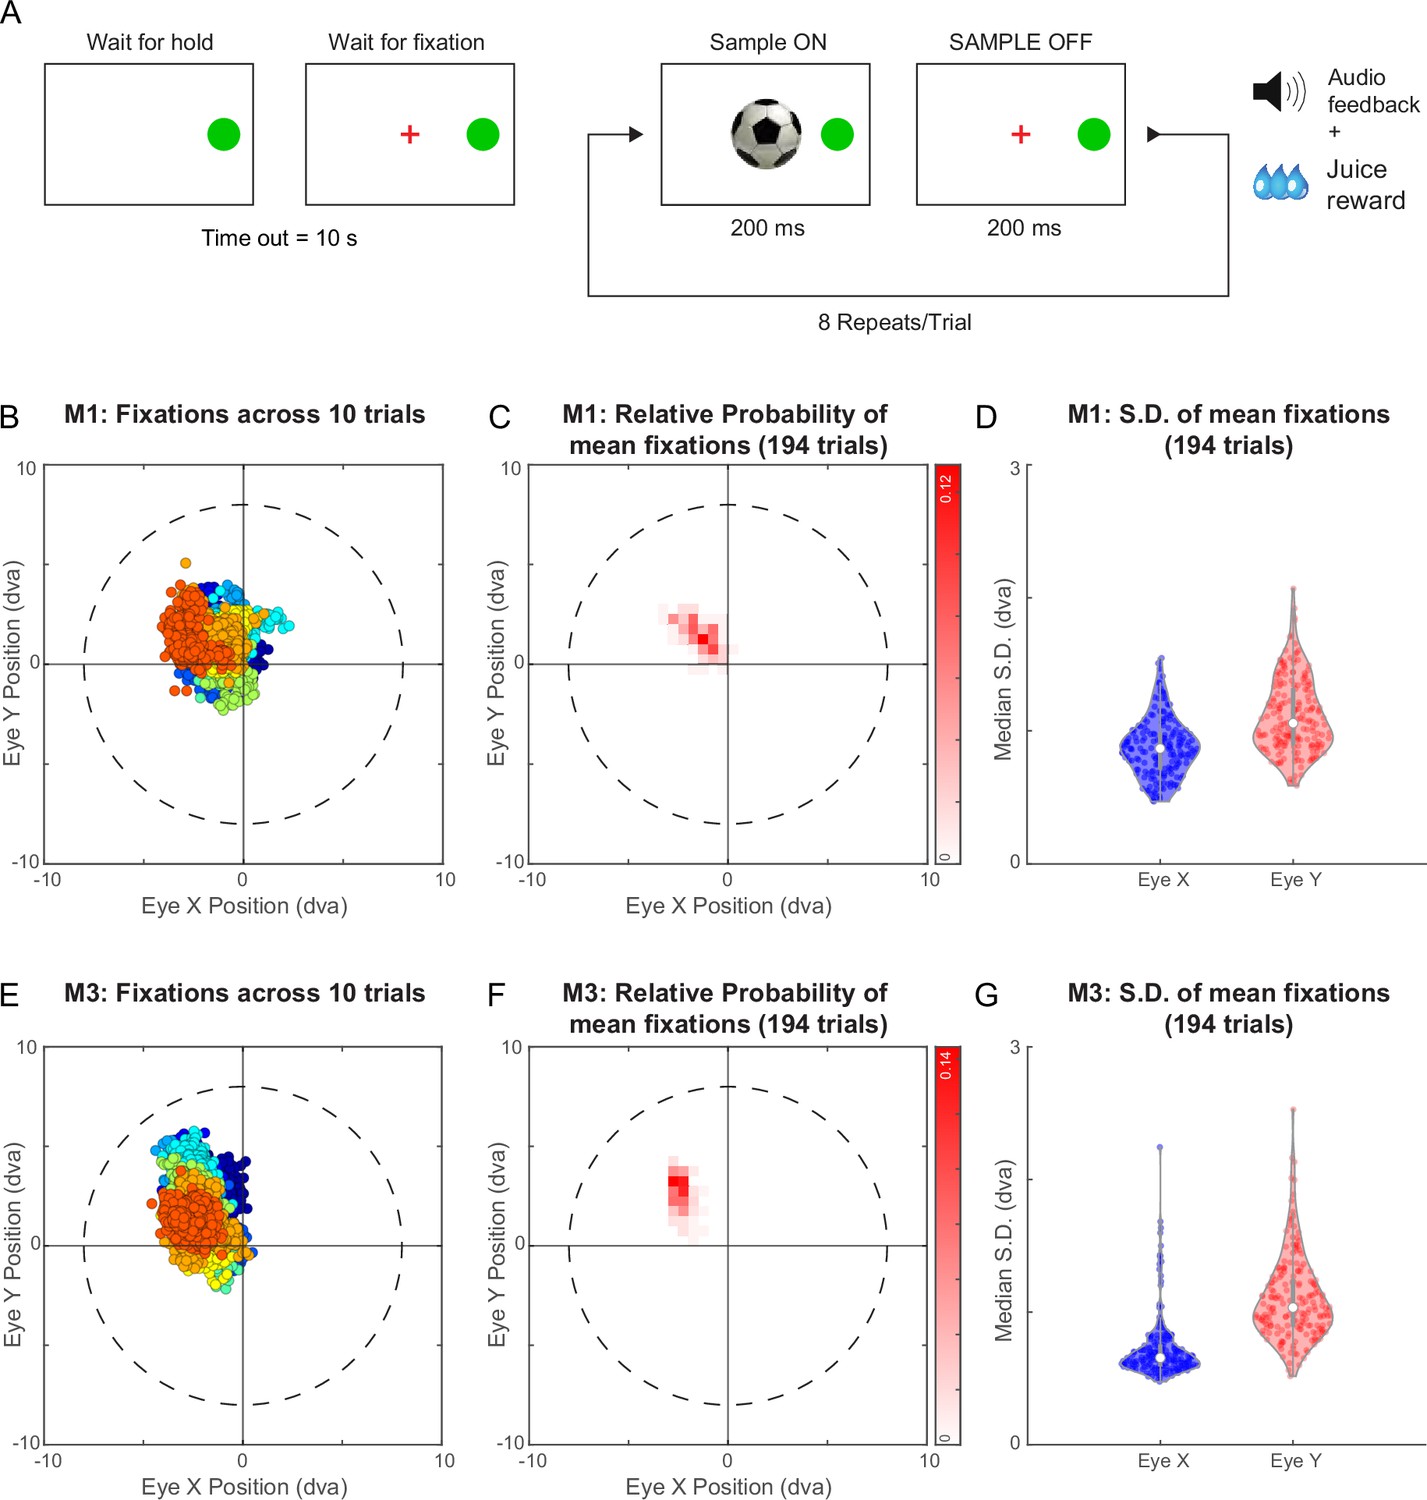
Eye tracking during a fixation task for Monkeys M1 & M3.
(A) Schematic of trials in the fixation task. The monkey had to press and hold the ‘HOLD’ button to initiate the trial. Following fixation acquisition, a series of 8 images were flashed for 200 ms each with an inter-stimulus interval of 200 ms. The monkey was rewarded for correctly maintaining his gaze within a window of 8° radius. (B) Gaze locations for 10 example trials from monkey M1 (from fixation acquisition to end of sample off period of the 8th image). Data from each is shown in a different colour. Despite the liberal criterion for fixation, the actual gaze were tightly centered in a given trial, with this mean position varying slightly across trials. (C) 2D histogram of the mean gaze position in each trial across all 194 trials. (D) Violin plot showing the distribution of the standard deviation of gaze position within each trial for both horizontal (Eye X) and vertical (Eye Y) directions across trials from (C). The white dot within the distribution represents the median and the thick vertical gray bar indicates the inter-quartile range. (E–G) Same as panels B-D for monkey M3 in the fixation task.
Figure 3—video 1
Eye tracking during a same-different task.
Figure 3—video 2
Same-different task variations.
Figure 4 with 2 supplements
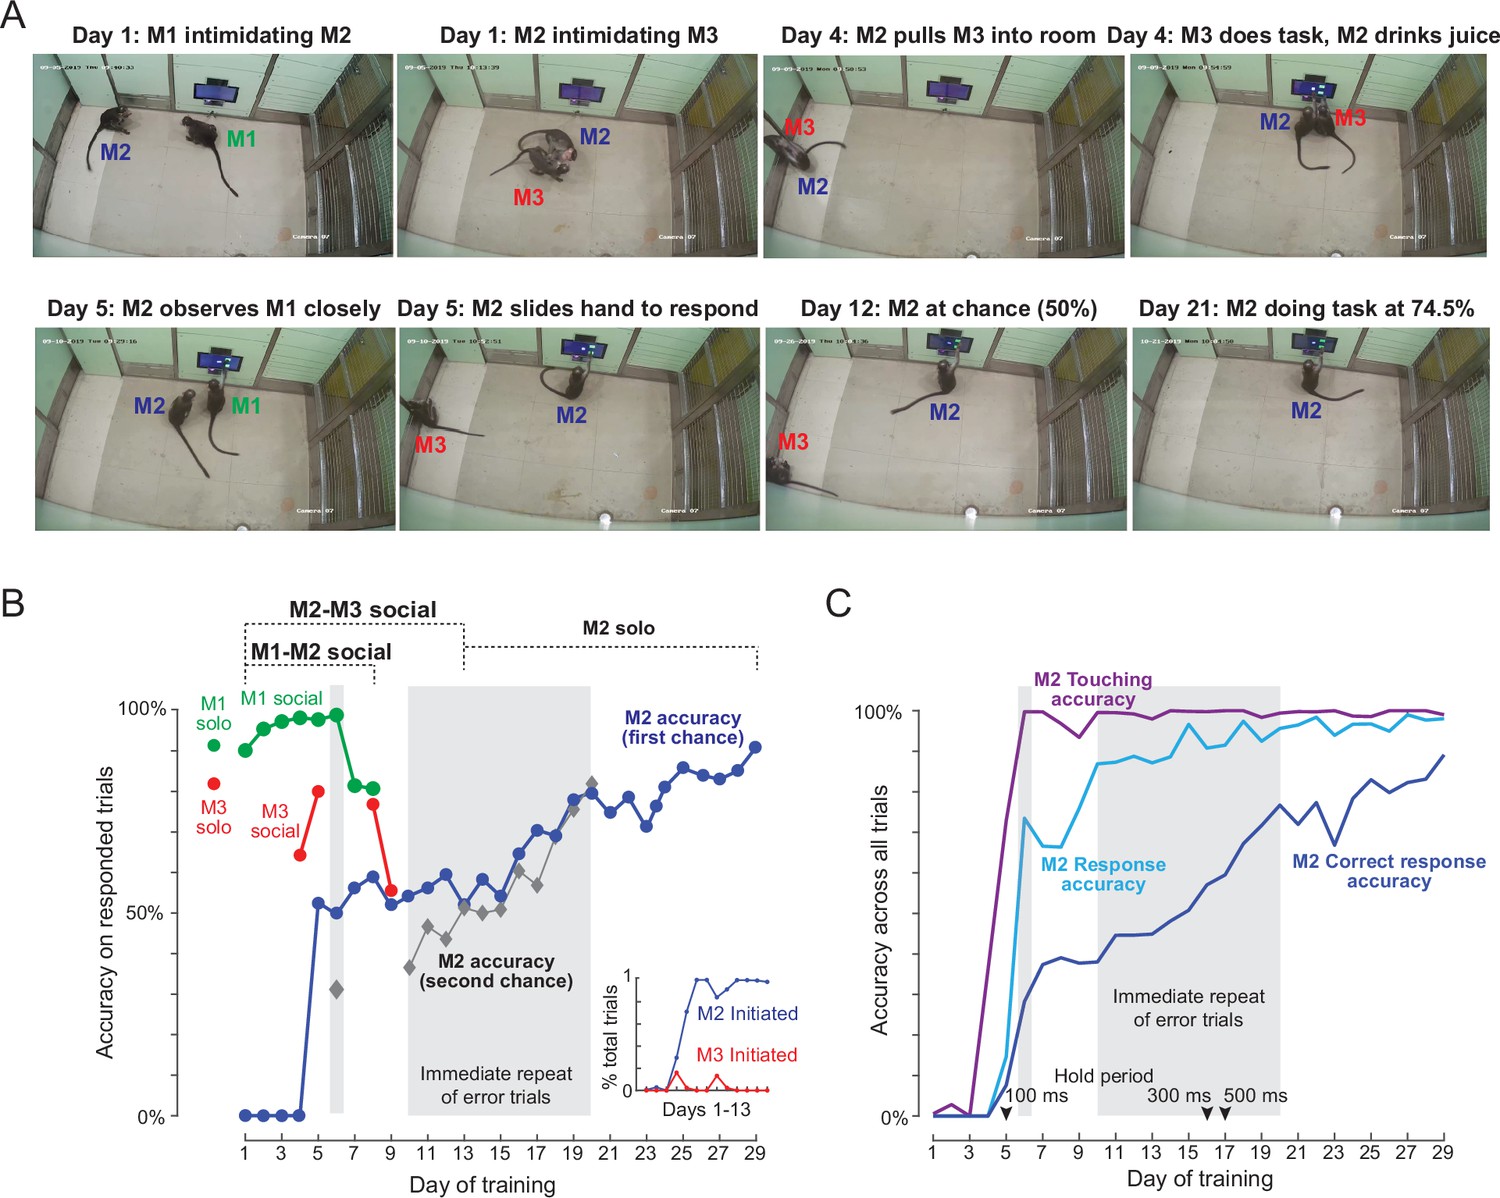
Social learning of naïve monkey M2.
(A) Photos representing important stages of social learning for M2 by observing trained monkeys M1 and M3. Social rank was M1> M2> M3. See Figure 4—video 1. (B) Accuracy in social training sessions (green-M1, blue-M2 and red-M3) across days. For each monkey, accuracy is calculated on trials on which it made a choice response. Shaded regions depict days on which error trials were repeated immediately, allowing monkeys to learn by switch their response upon making an error. M2 accuracy on such repeated trials is shown separately (gray). M1 and M3 accuracy prior to and during social sessions is shown by red and green dots (M1: 91%, M3: 82%). Inset: Percentage of all trials initiated by M2 (blue) and M3 (red) during M2-M3 sessions across 13 days of training. (C) Accuracy for monkey M2 for various types of response, calculated as percentage of all trials. Touching accuracy (purple): percentage of all trials initiated by touching the hold button. Response accuracy (cyan): percentage of trials where M2 touched any choice button out of all trials. Correct response accuracy (blue): Percentage of trials where M2 touched the correct choice button out of all trials. Shaded regions depict days on which error trials were repeated immediately without a delay. Arrow indicate days on which the hold time was changed.
Figure 4—figure supplement 1
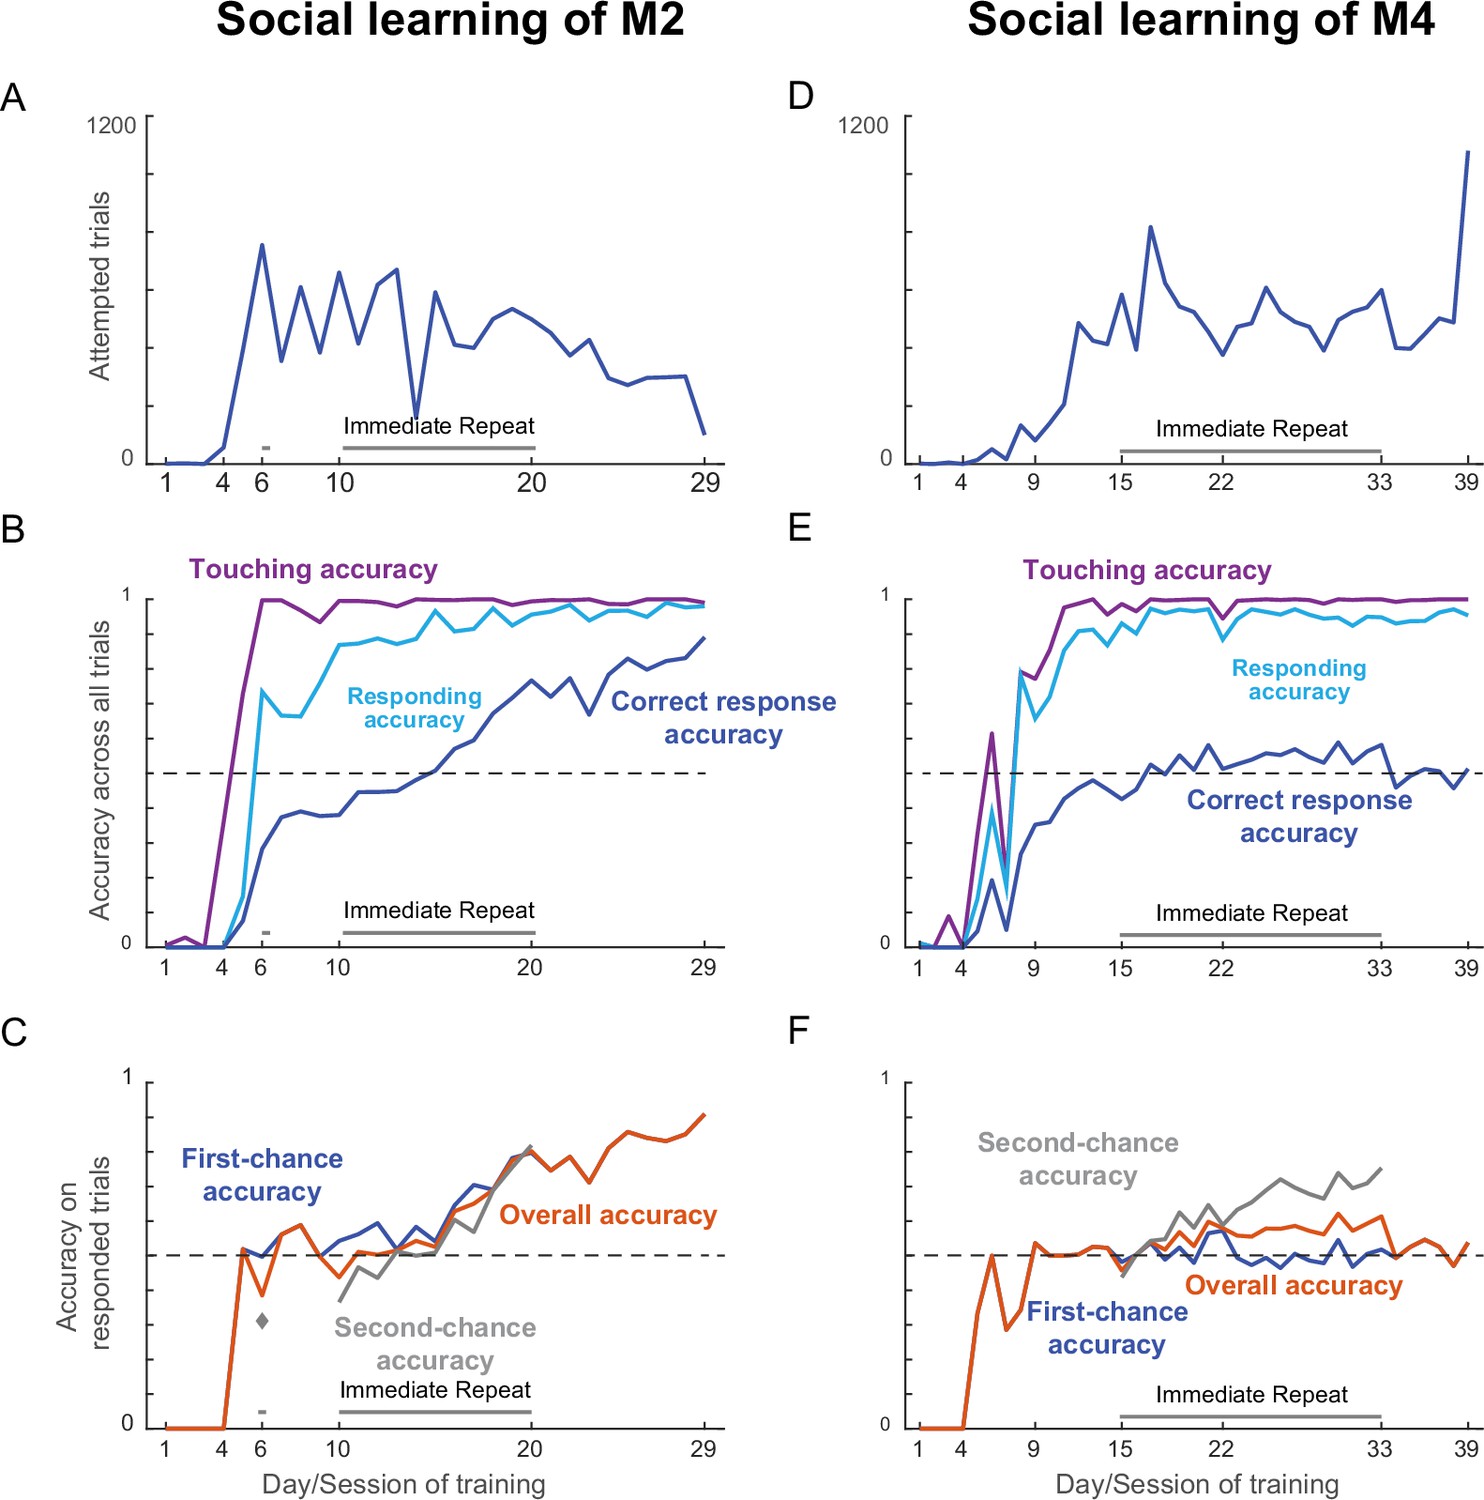
Social learning for naïve monkeys M2 & M4.
(A) Total number of trials attempted by M2 for each day/session of social training. Shaded regions depict days on which error trials were repeated immediately without delay. (B) Accuracy of making various types of response by M2, calculated as percentage of all trials. Touching accuracy (purple): percentage of all trials initiated by touching the hold button. Response accuracy (cyan): percentage of trials where M2 touched any choice button out of all trials. Correct accuracy (blue): Percentage of trials where M2 touched the correct choice button out of all trials. (C) Accuracy of correct trials across days/sessions for M2, for overall accuracy (orange), first-chance accuracy (blue) and second-chance accuracy (gray). (D–F) Same as panels A-C but for social learning of monkey M4.
Figure 4—video 1
Social learning of Monkey M2.
Appendix 1—figure 1
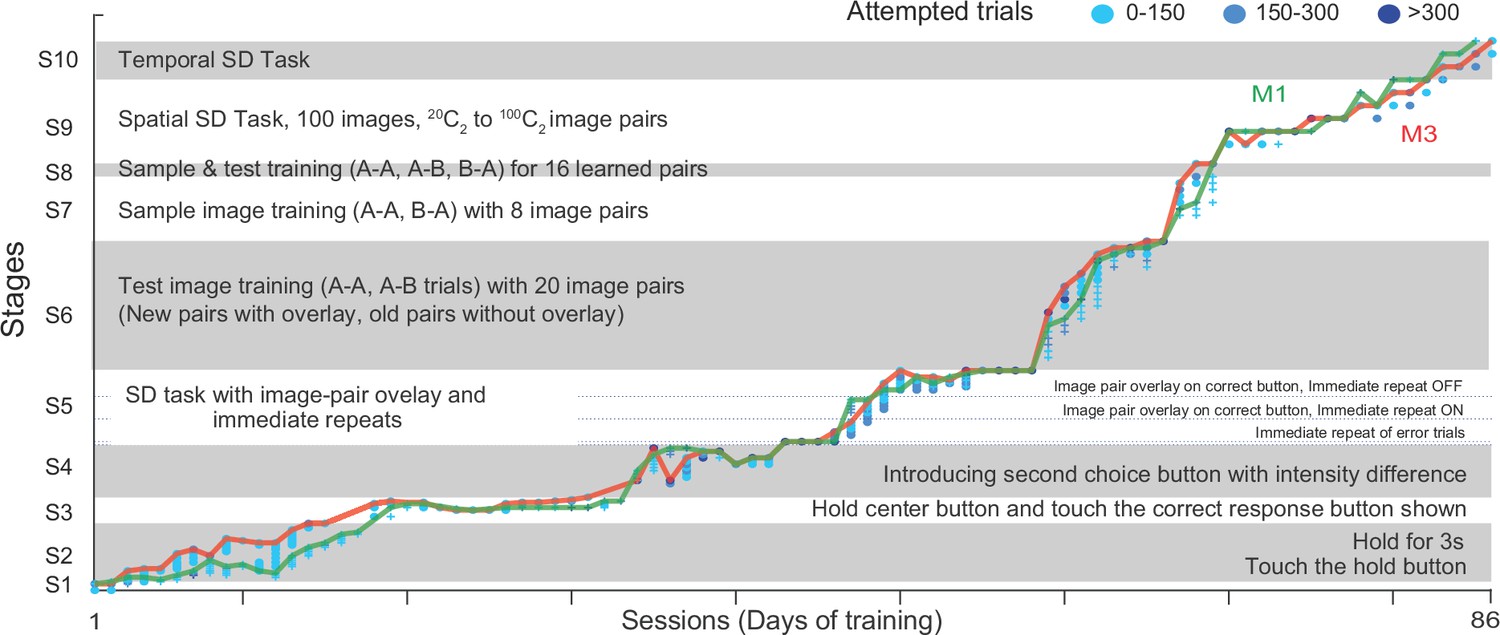
Tailored Automated training (TAT) on Same-Different task.
The plot shows the progression of animals M1 and M3 through the ten stages of TAT. Each stage is further divided into levels with symbols corresponding to each monkey (plus for M1, circles for M3) and color indicating the number of trials attempted (0–150 trials: light blue, 150–300 trials: cyan, > 300 trials: dark blue). The lines indicate the maximum level reached by each animal in a given sessions (M1: green, M3: red).
Appendix 2—figure 1
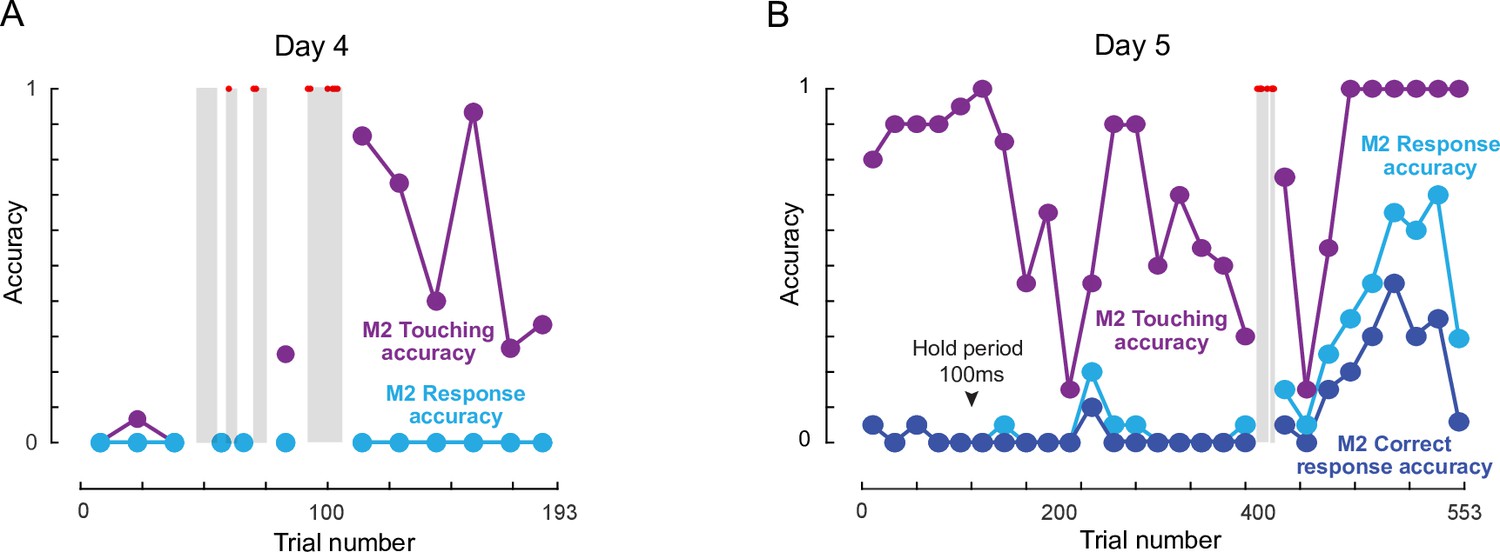
M2-M3 co-operation during social learning.
Here we describe interesting social interactions between M2 & M3 during social training. To summarize, on Days 4 and 5, M2 was positioning himself in front of the touch screen, occupying the juice spout as usual, since M2 was dominant over M3. However, for some stretches, he allowed M3 to sit alongside closely such that M3 also had access of the touch screen. During these stretches, M3 performed the task for few trials (grey box), which included both correct and incorrect trials. Since M2 was occupying the juice spout, he got rewarded for these correct trials performed by M3. These interactions are detailed below. (A) Day 4, M2-M3 session: Shaded regions are showing trials where M2 and M3 co-operated in the task (M3 performed the task and M2 got juice). Red dots in shaded region are showing correct trials. The whole session is divided into non-overlapping bins (bin size is 15 trials except in the shaded regions). Each dot represents accuracy calculated on the total trials in that bin. Touching accuracy: percentage of trials initiated by M2. Response accuracy: percentage of responded trial (correct or incorrect) out of total trials. On this day, M2 was not touching the hold button much before the interaction trials (before trial 106), but after that M2 started initiating trials (Figure 4—figure supplement 1A ). He did not make any more progress. (B) Day 5, M2-M3 session: Correct response accuracy: percentage of total trials in which M2 made a correct response. Here bin size is 20 trials. All other conventions are same as (A). The arrow indicates the trial from which the hold time was changed (Day 1: 500 ms). From the beginning M2 was initiating the trials by touching the hold button but his response accuracy was very low (i.e. did not reach the two choices stage). He was able to maintain hold till response button appeared and made a response by dragging his hand through “Different button” for 13 trials before the interaction, out of which only four trials were correct. After this, M2 allowed M3 to perform the task for 14 trials (till trial 381) in which M2 received juice at a much higher rate (8 trials out of 14 were correct). After this interaction, M2’s response accuracy increased (Figure 4—figure supplement 1B) and he started making correct response at chance level, although this was largely due to only making the (DIFFERENT response).
Additional files
Download links
A two-part list of links to download the article, or parts of the article, in various formats.
Downloads (link to download the article as PDF)
Open citations (links to open the citations from this article in various online reference manager services)
Cite this article (links to download the citations from this article in formats compatible with various reference manager tools)
A naturalistic environment to study visual cognition in unrestrained monkeys
eLife 10:e63816.
https://doi.org/10.7554/eLife.63816


