Incomplete removal of extracellular glutamate controls synaptic transmission and integration at a cerebellar synapse
- Vollum Institute and Oregon Hearing Research Center, Oregon Health & Science University, United States
- Neuroscience Graduate Program, Vollum Institute, Oregon Health & Science University, United States
Figures
Figure 1 with 3 supplements

EAATs prevent glutamate accumulation at rest.
(A) OFF UBC responding to 50 Hz 10 × 10 V electrical stimulation of white matter every 20 s. The upward deflections are mGluR2-mediated outward currents typical of OFF UBC responses to synaptic stimulation (arrow points to the first). DL-TBOA caused outward shift in tonic current, blocked by mGluR2 antagonist LY341495. (B) Effect of DL-TBOA on OFF UBCs. Paired t-tests, baseline vs DL-TBOA, p=0.008, n = 10; DL-TBOA vs DL-TBOA+LY34, p=0.006, n = 5. (C) Synaptic currents evoked by electrical stimulation. Same cell as in (A). The holding current shifted outward (upward arrow) when EAATs were blocked by DL-TBOA. (D) ON UBC example. DL-TBOA caused an increase in tonic inward current, blocked by AMPAR antagonist GYKI. (E) Effect of DL-TBOA on ON UBCs. Paired t-tests, baseline vs DL-TBOA, p=0.0003, n = 13; DL-TBOA vs DL-TBOA+GYKI, p=0.007, n = 9. (F) ON UBC synaptic currents evoked by 50 Hz 10× electrical stimulation. DL-TBOA caused the holding current to shift inward (downward arrow) and the slow rebound EPSC became slower to rise and decay. (Fi) Steady-state current during stimulation, with the tonic current subtracted to show that in DL-TBOA the steady-state current is outward relative to the tonic current. Scale as in (F). (Fii) Phasic EPSCs with tonic currents subtracted. The first EPSC became smaller due to increased tonic AMPAR desensitization. The holding potential was maintained at −70 mV, and thus increasing AMPAR currents are inward and increasing mGluR2 responses are outward.
Figure 1—figure supplement 1
EAAT1–2 contribute to glutamate uptake at MF-UBC synapse.
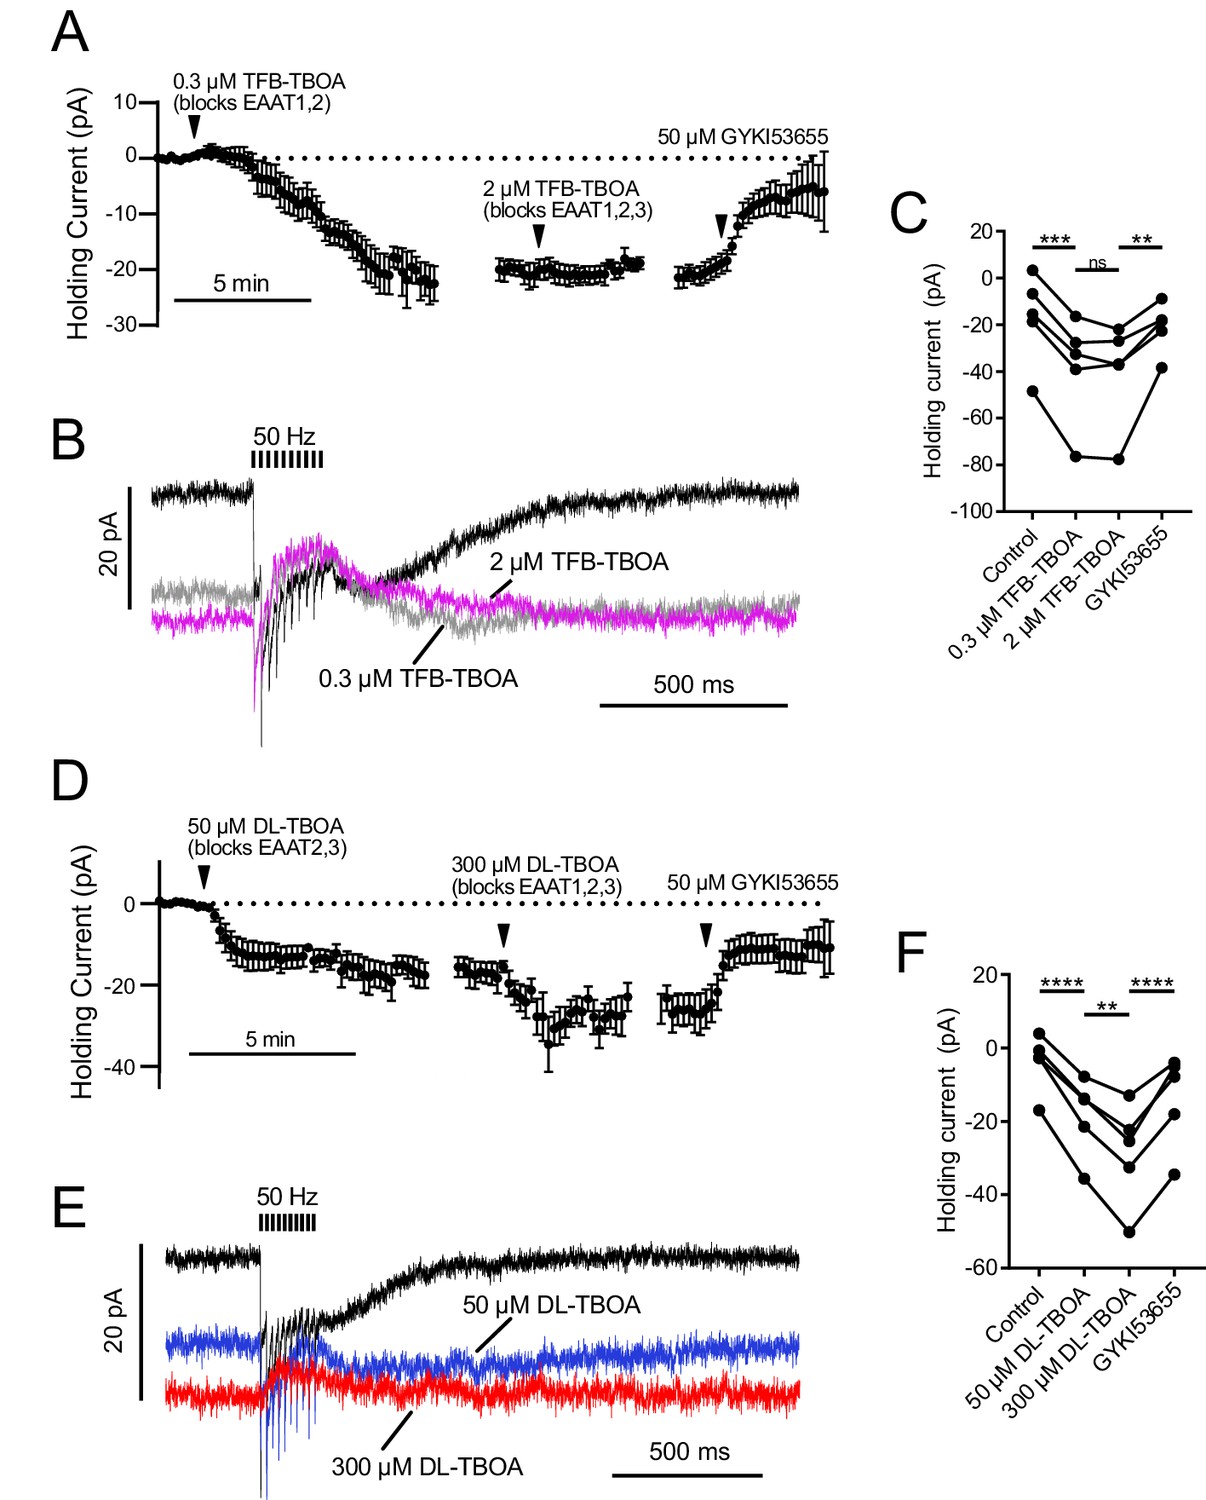
AMPAR-mediated currents were isolated by blocking mGluR2, mGluR1 and NMDA currents with LY341495, JNJ16259685 and MK-801. In both sets of experiments, the EC50 value for the EAAT subtype with a lower affinity for the drug was used as the first concentration, in order to fully block high-affinity EAATs while preserving partial activity of the lower affinity EAATs. Then by subsequently increasing the drug concentration the contributions of EAATs with differing affinities for the antagonists could be separated. For example, a low concentration of TFB-TBOA (0.3 µM) blocks EAAT1 and 2 completely, while a higher concentration will additionally block EAAT3 completely (Shimamoto et al., 2004). (A) Application of 0.3 µM TFB-TBOA, which likely blocks EAAT1 and EAAT2 completely, increased the tonic inward current. Raising the concentration to 2 µM to additionally block EAAT3 had no significant effect on the holding current. Application of GYKI blocked the tonic inward current induced by TFB-TBOA. n = 6. The data are relative to the application of the drug indicated by the arrowheads, with the break in data correcting for the variable time between drug applications. (B) Effect of TFB-TBOA on currents evoked by 50 Hz 10 X synaptic stimulation. There was no significant change in the synaptic currents between the two concentrations of TFB-TBOA. The synaptic currents evoked by 50 Hz stimulation were almost entirely outward in both concentrations of TFB-TBOA, relative to the tonic current. This reversal of the direction of the current is due to synaptically released glutamate desensitizing AMPARs that are open at rest due to their activation by ambient glutamate. (C) Summary of the effects of low and high concentrations of TFB-TBOA and DL-TBOA. The low concentration of TFB-TBOA that likely blocked EAAT1 and EAAT2 accounted for ~93% of the shift in holding current. Increasing the TFB-TBOA concentration to additionally block EAAT3 did not have a significant effect (p=0.970). (D) DL-TBOA will block EAAT2 and 3 completely at 50 µM, but only completely block EAAT1 at a higher concentration (Shimamoto et al., 1998). Both concentrations of DL-TBOA increased the inward holding current, which suggests that EAAT1 and EAAT2 both contribute to glutamate uptake at this synapse. Application of 50 µM DL-TBOA, which likely blocks EAAT2 and EAAT3 completely, had a large effect on the tonic current. Raising the concentration to 300 µM to additionally block EAAT1 also increased the tonic inward current. The inward current induced by DL-TBOA was carried by AMPARs, as it was blocked by GYKI n = 5. The plots are relative to the application of the drug indicated by the arrowheads. (E) Effect of DL-TBOA on currents evoked by 50 Hz 10X synaptic stimulation. (F) The low concentration of DL-TBOA which is presumed to block EAAT2 and EAAT3 only accounted for 59% of the total shift in holding current. Increasing the DL-TBOA concentration to additionally block EAAT1 caused a significant shift in holding current consistent with EAAT1 contributing to glutamate uptake at this synapse. Repeated measures ANOVA followed by Tukey's multiple comparisons tests. (p>0.05), (*) (p≤0.05), (**) (p≤0.01), (***) (p≤0.001), (****) (p≤0.0001).
Figure 1—figure supplement 2
AMPAR kinetic model predicts glutamate transients that produce slow EPSC.
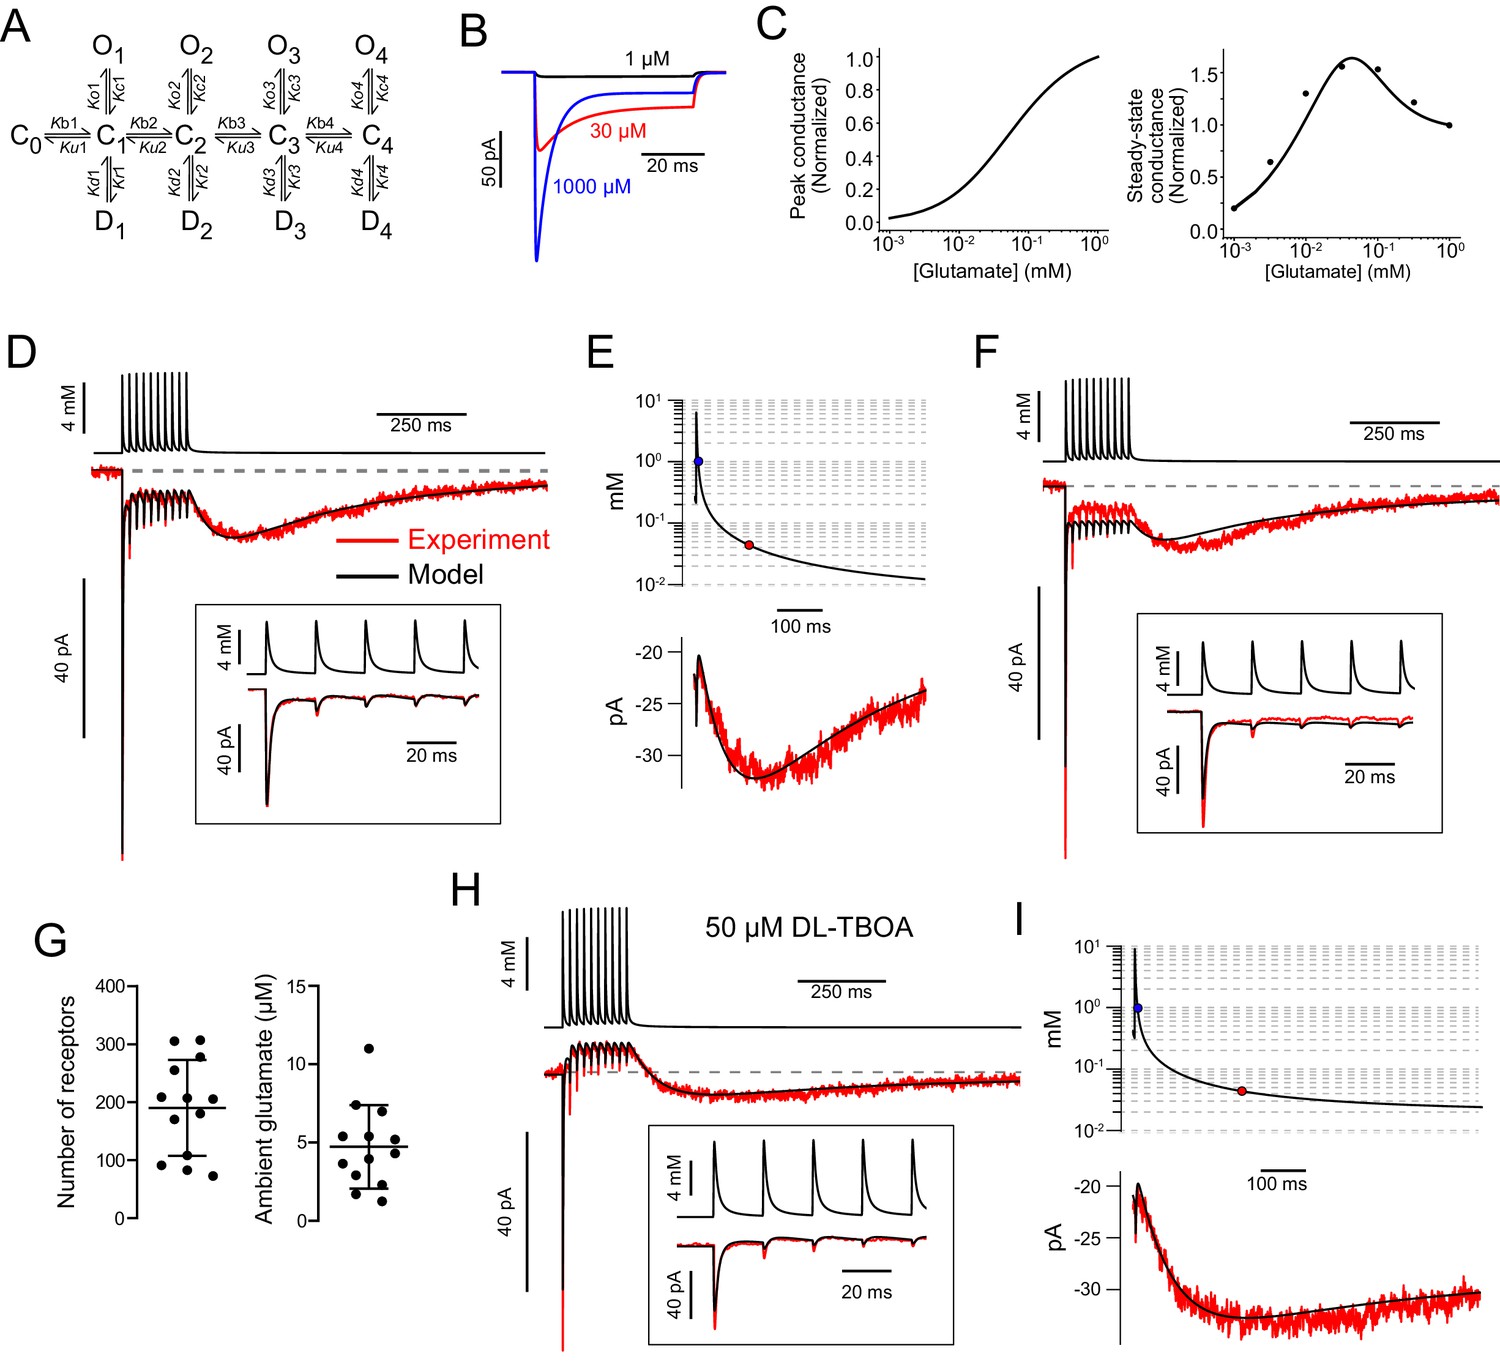
(A) The kinetic AMPAR model contained four binding sites. Each bound state (C) can either open (O) or desensitize (D). Conductance values increase with number of binding sites occupied: 5, 10, 15, and 20 pS. (B) Simulation of currents evoked by application of glutamate to AMPAR kinetic model. One millimolar glutamate gave a larger peak current, but a smaller steady-state current than 30 µM. (C) Simulated dose–response curves of peak and steady-state currents. The dots in the right panel are from experiments reported in Lu et al., 2017 to show that the simulated steady-state currents represented by the line reproduce the experimental data. (D) Glutamate concentration transients (top trace) were generated that evoked modeled AMPAR currents (lower black trace) that approximated the experimental data (red) using a 3D diffusion equation. Inset: Magnification of the glutamate transients and simulated currents during the first five release events. (E) The glutamate transient at the end of the train plotted on a semilog scale. The blue circle indicates where the transient decays to 1 mM and the red circle indicates where the transient decays to 32 µM, the concentration that evoked a peak steady-state conductance in the model. The slow EPSC (below) is generated as the glutamate concentration decreases along the bell-shaped dose–response curve. (F) Without ambient glutamate, predicted currents driven by modeled glutamate transients cannot reproduce experimental data; the steady-state currents were too large and the slow EPSCs were too small. (G) Summary of AMPAR number and ambient glutamate concentration that produced currents that fit data from 14 UBCs. The models predicted an ambient glutamate level of 4.7 ± 2.7 µM and 190.1 ± 82.6 AMPARs (mean ± SD) each having a maximal conductance of 20 pS with all four sites bound. (H) Same cell as (D–E) after block of EAATs with DL-TBOA, the evoked currents from 5/9 cells could be reproduced by the model by simply increasing the ambient glutamate concentration and the molecules of glutamate released in the 3D diffusion equation used to generate the glutamate transient waveform. (I) The glutamate transient in DL-TBOA is much longer, reaches the concentration that evoked the peak conductance (32 µM) later, and decays slower than under control conditions.
-
Figure 1—figure supplement 2—source data 1
The parameters of the AMPA receptor kinetic model were adjusted to give incomplete desensitization and to fit experimental data from Lu et al., 2017.
- https://cdn.elifesciences.org/articles/63819/elife-63819-fig1-figsupp2-data1-v2.docx
Figure 1—figure supplement 3
Some AMPAR currents recorded in DL-TBOA required increasing the maximal conductance to produce a good fit, suggesting that DL-TBOA allows spillover onto additional receptors not activated when glutamate transporters are functioning.
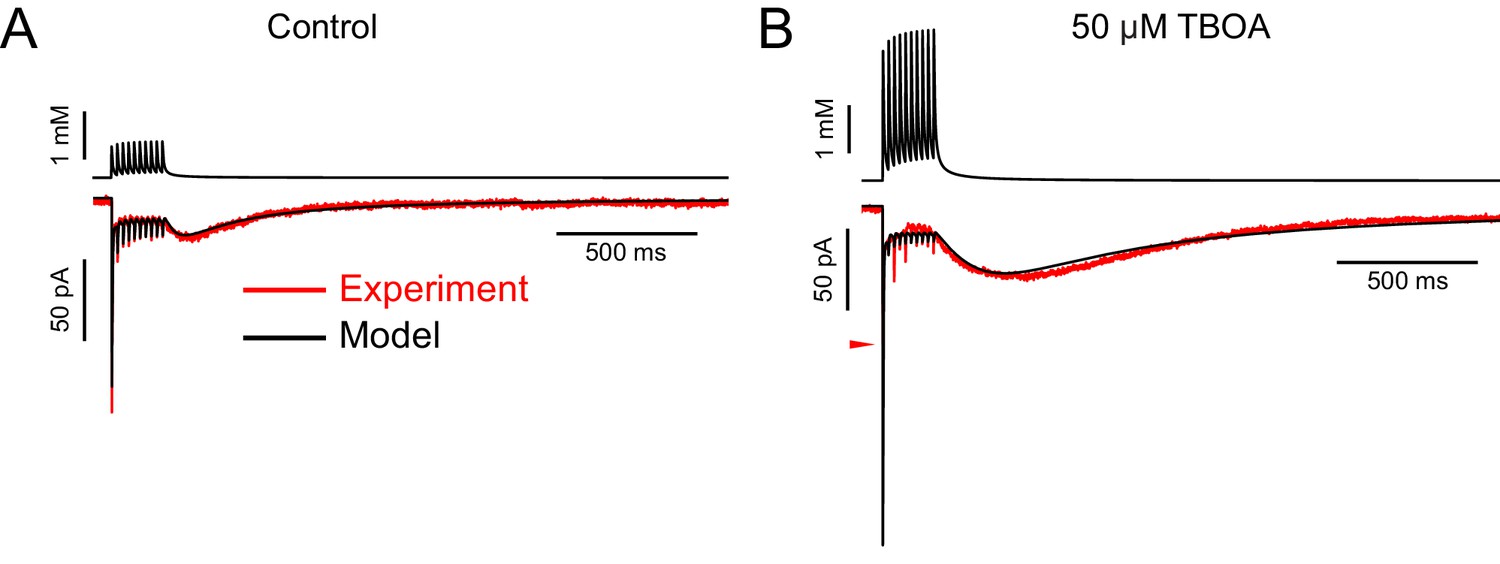
(A) In the control solution, the 3D diffusion equation was able to produce glutamate transients (top black trace) that evoked simulated EPSCs (bottom black trace) that fit the experimental data well (lower red trace). This example required 300 AMPA receptors (maximal conductance of synapse: 6141 pS) and an ambient glutamate concentration of 3.96 µM. (B) AMPAR currents recorded from the same cell as in A in 50 µM DL-TBOA were markedly different (lower red trace), with a much larger slow EPSC in amplitude and charge. In order to fit this current, the model required 500 receptors (maximal conductance of synapse: 10,033 pS), in addition to a 4.0-fold increase in the number of molecules released. Note that the first fast EPSC was much too large in the modeled current. The red arrowhead indicates the peak of the fast EPSC in the experimental data. A model incorporating changes in the amount of glutamate released across the train could improve the fit to the fast EPSCs.
Figure 2 with 3 supplements
mGluR2-mediated tonic outward current in OFF UBCs, but not ON UBCs.
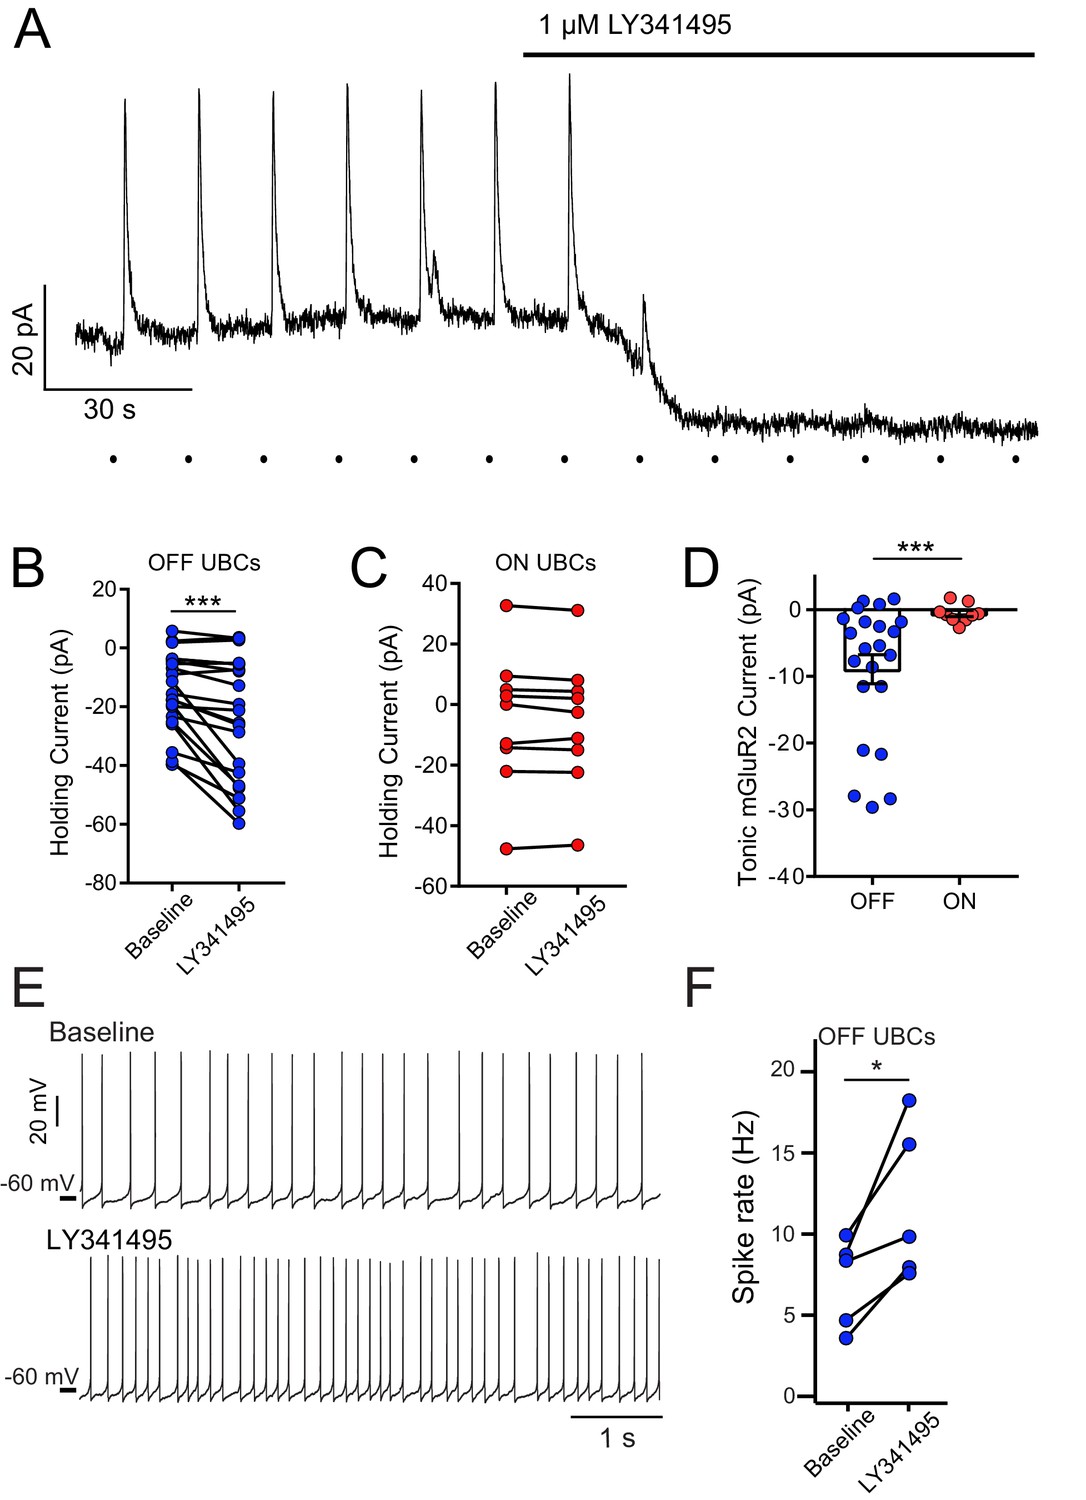
(A) Example bath application of mGluR2 antagonist LY341495 on OFF UBC (in the presence of 5 μM NBQX, 1 μM JNJ16259685). Synaptic stimulation (100 Hz, 20×, 10 V, 15 s intervals, indicated by dots below trace) evokes an outward current, blocked by LY341495. A ~20 pA standing outward current is also blocked. (B) UBCs identified as OFF UBCs based on synaptic stimulation or glutamate puff had an mGluR2 standing current, blocked by LY341495. Paired t-test, p<0.001, n = 22. (C) UBCs identified as ON UBCs based on synaptic stimulation or glutamate puff did not have an mGluR2 standing current. Paired t-test, p=0.243, n = 9. (D) Summary of mGluR2 standing currents. The tonic mGluR2 current was larger in OFF UBCs than ON UBCs. Student's t-test, p=0.021, n = 31. (E) Example OFF UBCs in current-clamp mode before and after LY341495, showing increase in spike rate after blocking tonic mGluR2-mediated current. (F) Summary showing significant increase in spike rate across OFF UBCs. Paired t-test, p=0.025, n = 5.
Figure 2—figure supplement 1
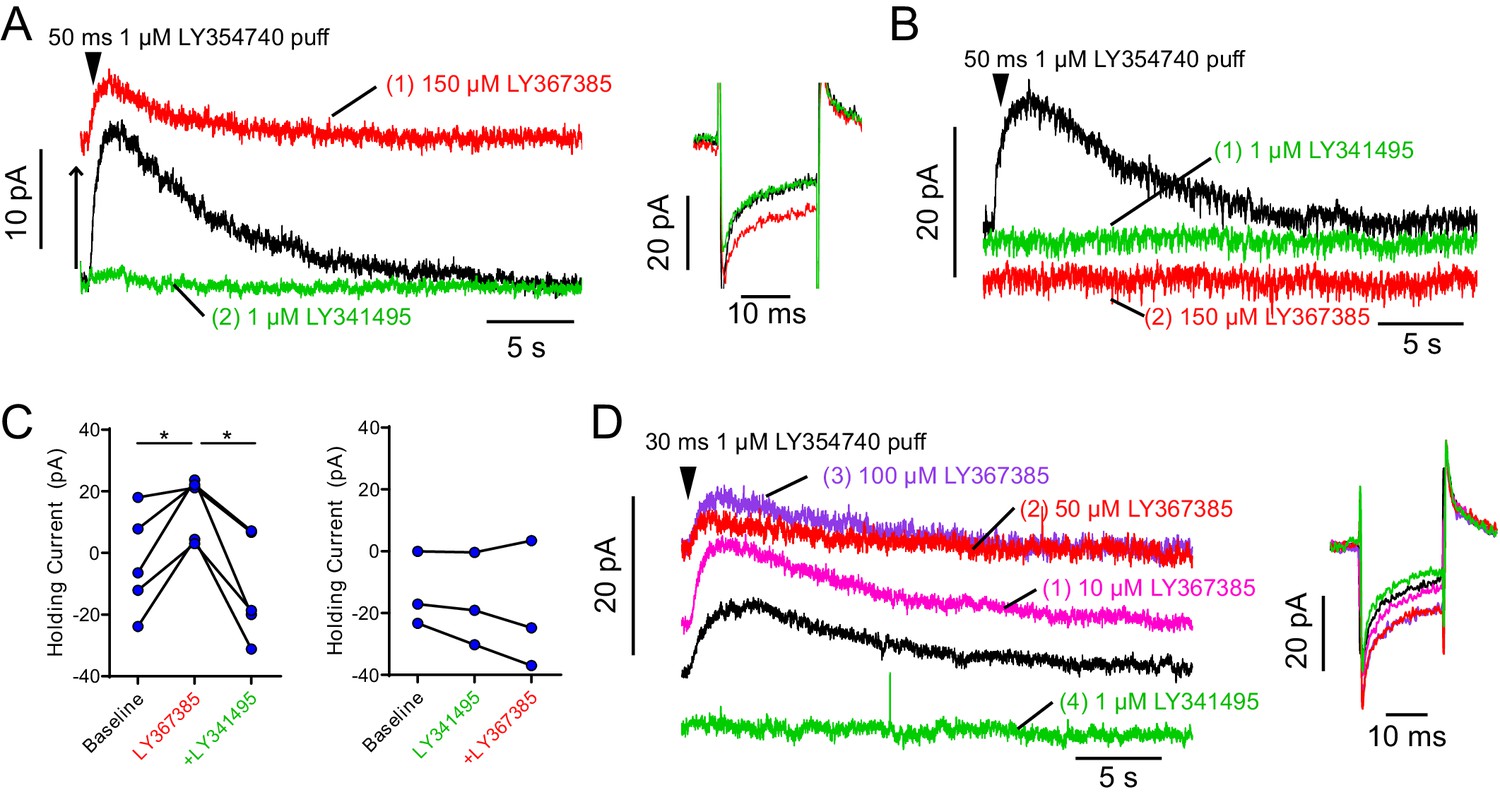
Widely utilized mGluR1 antagonist LY367385 also acts as mGluR2 agonist.
(A) Example OFF UBC responding to 50 ms puff of metabotropic glutamate receptor group II agonist LY354740 with a slow outward current (baseline – black). Administering mGluR1 antagonist LY367385 caused a large increase in outward holding current (to prevent hyperpolarization of the cell) and reduced the evoked outward current, presumably reaching a saturating level of activation (red). Subsequent addition of highly selective group II antagonist LY341495 revealed that the increase in holding outward current was due to activation of a group II receptor (mGluR2), as it reversed the LY354740 induced outward shift in the holding current. As expected, it also blocked the puff evoked outward mGluR2-mediated current (green). Right: −10 mV test pulse shows change in input resistance consistent with an increase in the number of open channels in LY367385 (red) that was reversed by LY341495 (green). (B) Example OFF UBC responding to 50 ms puff of metabotropic glutamate receptor group II agonist LY354740 with a slow outward current (black). This current was blocked by group II antagonist LY341495 (green). The effect of the mGluR1 antagonist LY367385 on the holding current was blocked by the presence of mGluR2 antagonist LY341495 (red). (C) In all UBCs tested, LY367385 increased the outward holding current and subsequent LY341495 reversed the effect. Paired t-tests, baseline vs LY367385, p=0.022, n = 5; LY367385 vs LY341495, p=0.011, n = 5. Right: When LY341495 was applied first, the effect of subsequent LY367385 was absent. (D) The outward current induced by LY367385 was dose dependent and apparent at micromolar concentrations. Right: Input resistance was reduced by LY367385 in a dose-dependent manner. LY367385 used in these studies were from different lots purchased from two different suppliers (Tocris and Abcam). Other drugs are known to act as agonists of group II and antagonists of group I metabotropic glutamate receptors including phenylglycine derivatives such as (S)−4-carboxyphenylglycine (Hayashi et al., 1994).
Figure 2—figure supplement 2
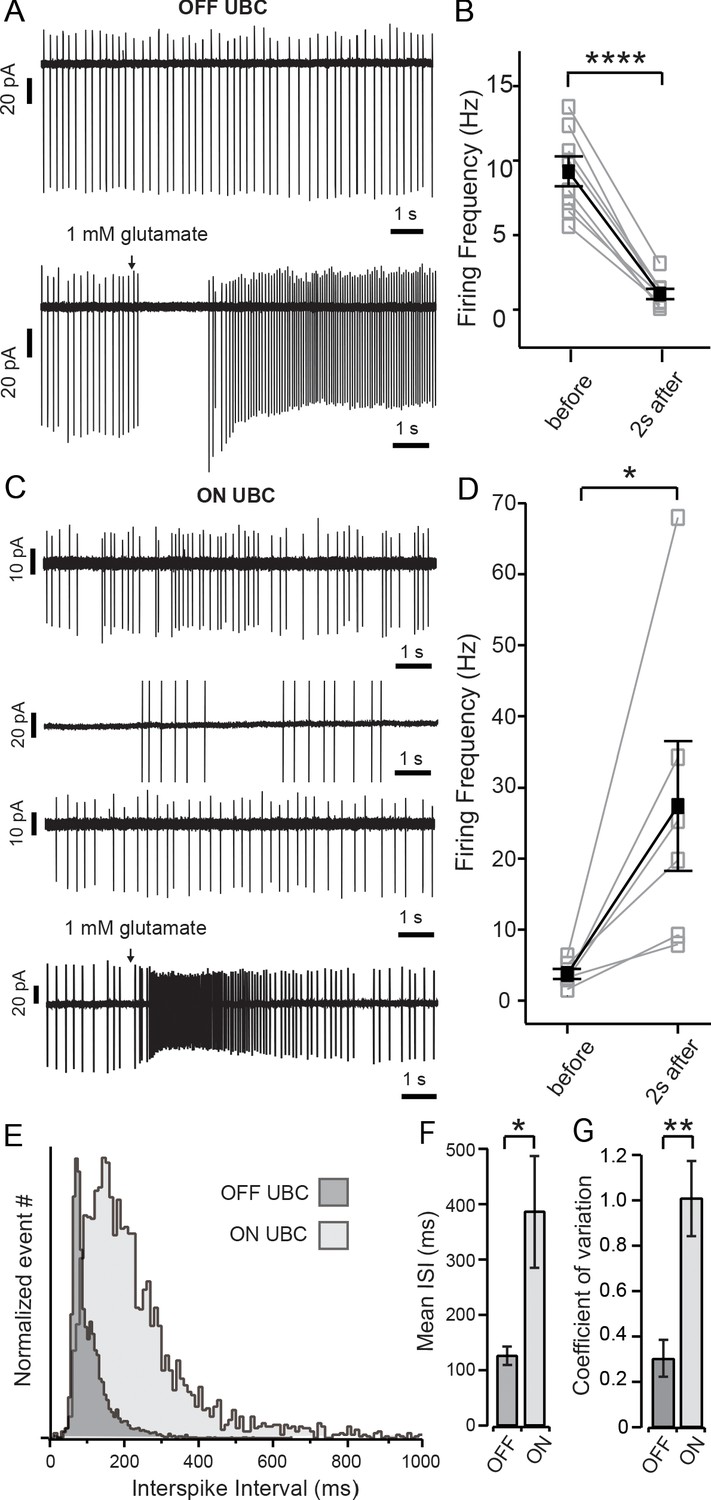
Spontaneous activity and ON and OFF responses in cell-attached recordings.
(A) Top panel shows cell-attached recordings of OFF UBC with regular spontaneous firing; bottom panel shows a prolonged pause in firing in response to brief (15–40 ms) puff application of glutamate. (B) Summary of the firing frequency of OFF UBCs before and during the 2 s period immediately following glutamate puff. (C) Top three panels show the irregularity of spontaneous firing of ON UBCs; bottom panel shows a prolonged increase in firing in response to brief application of glutamate. (D) Summary of firing frequency of ON UBCs and the increase in frequency during the 2 s period following glutamate application. (E) To show the difference in regularity of firing, inter-spike interval (ISI) data of all N’s for ON (light gray) and OFF (dark gray) cells were pooled and normalized to maximum number of events. OFF cells show a narrow peak, while ON cells display a broad distribution indicative of a larger variation in ISIs. (F) Summary of the mean ISI of each subtype (OFF cells n = 8; ON cells n = 6) and (G) Graphic representation of the coefficient of variation of both ON and OFF cells. Black arrows in (A) and (C) show puff of 1 mM glutamate. Error bars show ± SEM, and significance-level symbols are as follows: ns, non-significant or (p>0.05), (*) (p≤0.05), (**) (p≤0.01), (***) (p≤0.001), (****) (p≤0.0001).
Figure 2—figure supplement 3
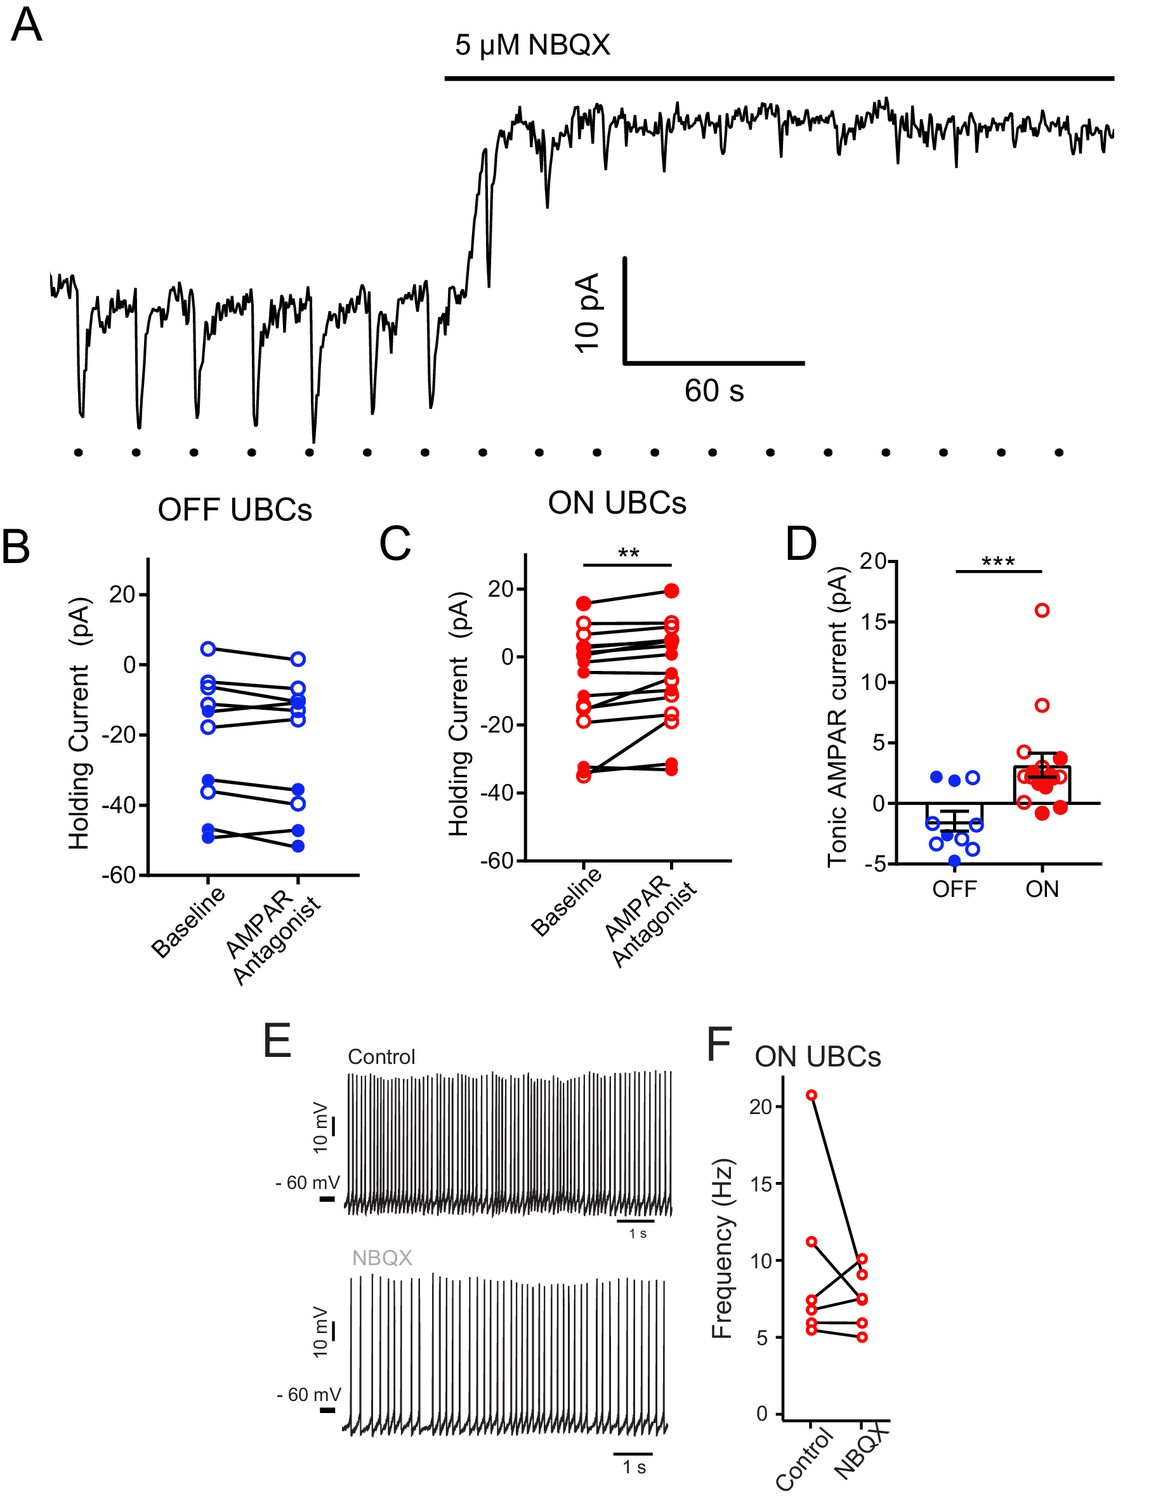
Tonic AMPAR current in ON UBCs, but not OFF UBCs.
(A) Glutamate puffs indicated by dots below trace cause inward currents typical of an ON UBC. Application of NBQX shifted the holding current outward and then blocked the glutamate response. In some cases, ON or OFF UBCs were identified with synaptic stimulation instead of glutamate puffs. (B) There was no apparent effect of 5 µM NBQX (open circles) or 50 µM GYKI53655 (filled circles) on OFF UBC holding current. Thus, OFF UBCs had no tonic AMPAR inward current. Paired t-test, p=0.109, n = 10. (C) Small but significant effect of 5 µM NBQX (open circles) or 50 µM GYKI53655 (filled circles) on ON UBC holding current. Wilcoxon signed rank test, p=0.003, n = 16. This small tonic inward current was significant for either NBQX or GYKI53655 experiments analyzed separately as well. (D) ON UBCs had significantly different response to AMPAR antagonists compared to OFF UBCs, Mann–Whitney test, p=0.0006, n = 26. (E) In some experiments, NBQX reduced the spontaneous firing rate of ON UBCs. (F) This effect was not significant across the population, which was not surprising given the small size of the current.
Figure 3
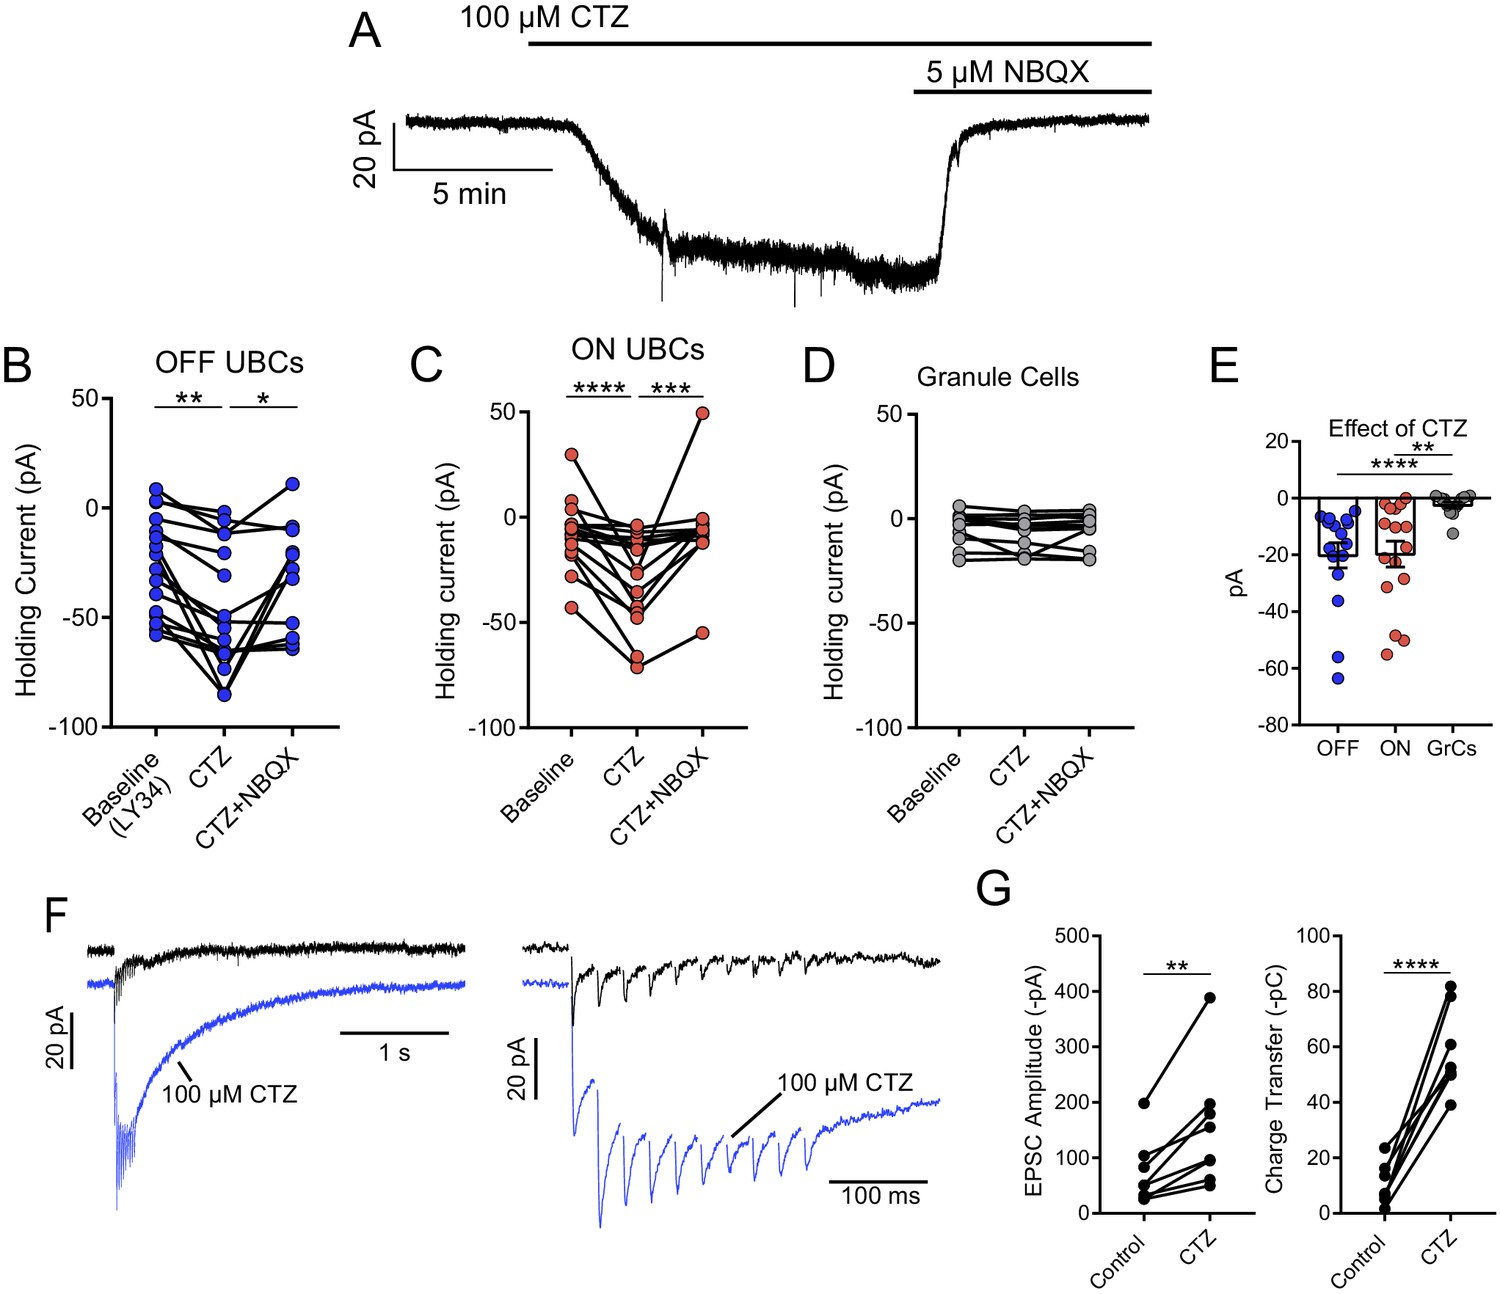
Tonic AMPAR desensitization in UBCs, but not granule cells.
(A) 100 µM cyclothiazide (CTZ) bath application increases standing inward current of this OFF UBC and is blocked by 5 µM NBQX. Note increase in noise in CTZ, presumably due to increased AMPAR activity. (B) CTZ increased inward current in OFF UBCs, indicating ambient level of AMPAR desensitization. Wilcoxon signed rank: control vs CTZ, p=0.014, n = 16; paired t-test: CTZ vs CTZ+NBQX, p=0.025, n = 11. (C) CTZ increased inward current in ON UBCs. Paired t-tests: control vs CTZ, p=0.0001, n = 16; CTZ vs CTZ+NBQX, p=0.001, n = 12. (D) There was no significant effect of CTZ on the holding current of granule cells: Friedman test: p=0.264, n = 12. (E) The effect of CTZ on OFF and ON UBCs was not different, but both were significantly different than on GrCs. Mann–Whitney test: OFF UBCs vs GrCs, p<0.0001, n = 29; unpaired t-tests: ON UBCs vs GrCs, p=0.001, n = 29. OFF UBCs vs ON UBCs, p=0.809, n = 32. (F) ON UBC synaptic responses to 50 Hz, 10× electrical stimulation and response after CTZ. Right: EPSCs evoked during 50 Hz stimulation, magnified. The first EPSC became much larger, indicating that ambient glutamate desensitizes AMPARs. (G) CTZ increased the EPSC amplitude 2.3 ± 0.8 fold (mean ± SD), paired t-test, p=0.006, n = 8. The charge during the 50 Hz, 10× stimulation, and the long inward tail increased 9.3 ± 7.0 fold (mean ± SD). Paired t-test, p<0.0001, n = 8.
Figure 4
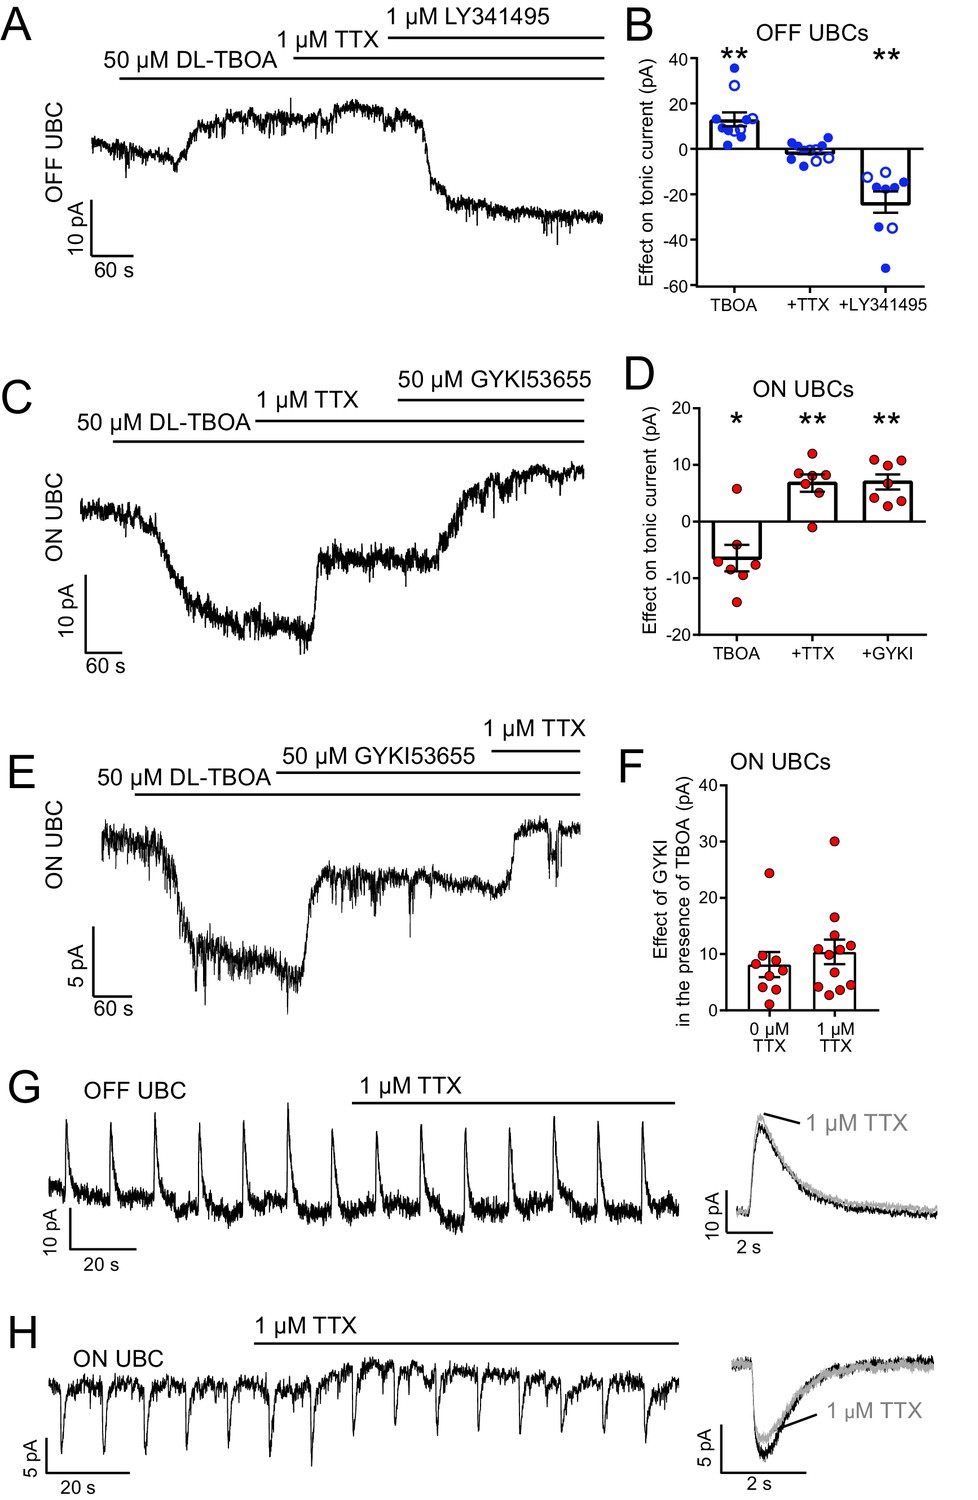
The source of ambient glutamate is not action potential-evoked release.
(A) Example tonic currents in OFF UBC. DL-TBOA increased tonic outward current in all OFF UBCs. Addition of TTX did not reverse this effect. Addition of mGluR2 antagonist LY341495 (1 µM) blocked the outward current, shifting the tonic current inward. (B) Summary of the effect of each additional agent in seven OFF UBCs. On average, there was no effect of TTX on the tonic outward current of OFF UBCs. In some cases, GYKI53655 (50 µM) was applied before DL-TBOA (unfilled circles), but this had no effect and were therefore pooled with examples in the absence of GYKI53655 (filled circles). Paired t-tests: Baseline vs DL-TBOA, p=0.0011, n = 11; DL-TBOA vs DL-TBOA+TTX, p=0.674, n = 11; DL-TBOA+TTX vs DL-TBOA+TTX+LY341495, p=0.0013, n = 9. (C) Example tonic currents in ON UBC. After determination of ON or OFF UBC type by synaptic stimulation or glutamate puff, LY341495 was added before DL-TBOA. DL-TBOA increased tonic inward current. TTX reduced inward current. GYKI further reduced the inward current. (D) Summary of the effect of agents in seven ON UBCs. Paired t-tests: baseline vs DL-TBOA, p=0.033, n = 7; DL-TBOA vs DL-TBOA+TTX, p=0.004, n = 7; DL-TBOA+TTX vs DL-TBOA+TTX+GYKI53655, p=0.002. (E) To test whether TTX was blocking a persistent sodium current that is known to be present in UBCs, GYKI was applied first. Any effect of TTX after GYKI was interpreted as block of persistent sodium current. This example ON UBC had a persistent sodium current that was blocked. (F) Summary of the effect of GYKI in the presence or absence of TTX. GYKI blocked the same amount of tonic AMPA current whether or not action potentials were blocked by TTX, indicating that the sole effect of TTX was to block a persistent Na+ current. Unpaired t-test: p=0.486, n = 21. (G) TTX had little effect on the response of OFF UBCs to 10 ms 1 mM glutamate puffs. Right- average response before (black) and after (gray) TTX. (H) In the ON UBC example, TTX blocked a small tonic inward current but had little effect on the 10 ms 1 mM glutamate puff-evoked current. Right: Average response before (black) and after TTX (gray).
Figure 5
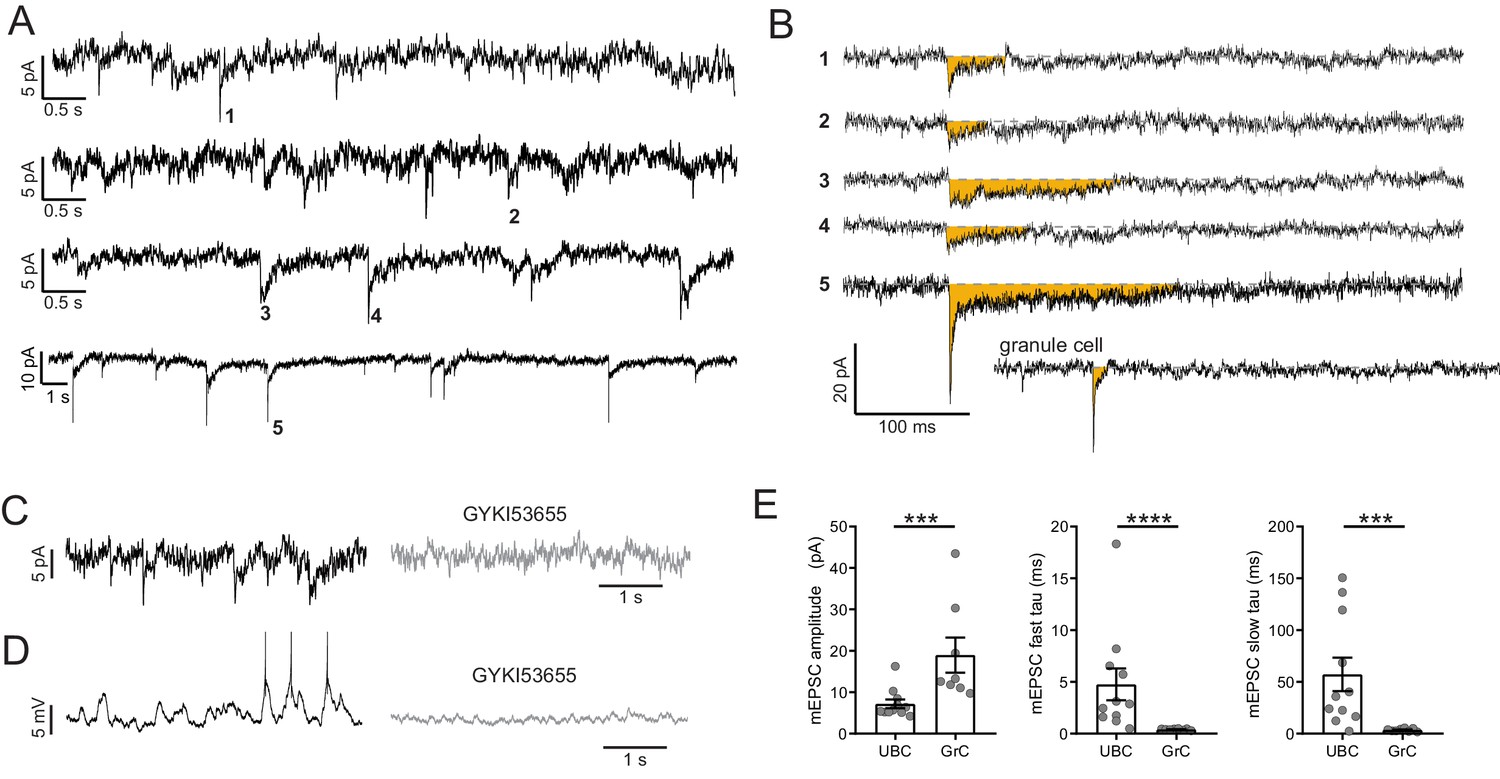
mEPSCs suggest vesicular source of ambient glutamate.
(A) In the presence of TTX, 4 of 15 UBC had mEPSCs that were confidently resolvable above the noise. Each trace is a different cell. Traces are low-pass filtered at 100 Hz, which had a small effect on the amplitude, but was necessary to resolve mEPSCs. (B) Example minis indicated by numbers in (A). Traces were filtered 2.5 kHz and smoothed (10-point binomial smoothing) to avoid distortion of the peak of the mEPSCs. Note the long duration relative to the granule cell example recorded and filtered in the same way. (C) mEPSCs (left) are blocked by GYKI (50 µM) (right). (D) The same cell as in (D) in current clamp. EPSPs that occasionally reached spike threshold (left) were blocked by GYKI (right). (E) mEPSCs from UBCs were smaller in amplitude and slower to decay, quantified by the time constants of double exponential fits. Mann–Whitney tests, n = 11 UBCs, n = 8 GrCs.
Figure 6 with 1 supplement
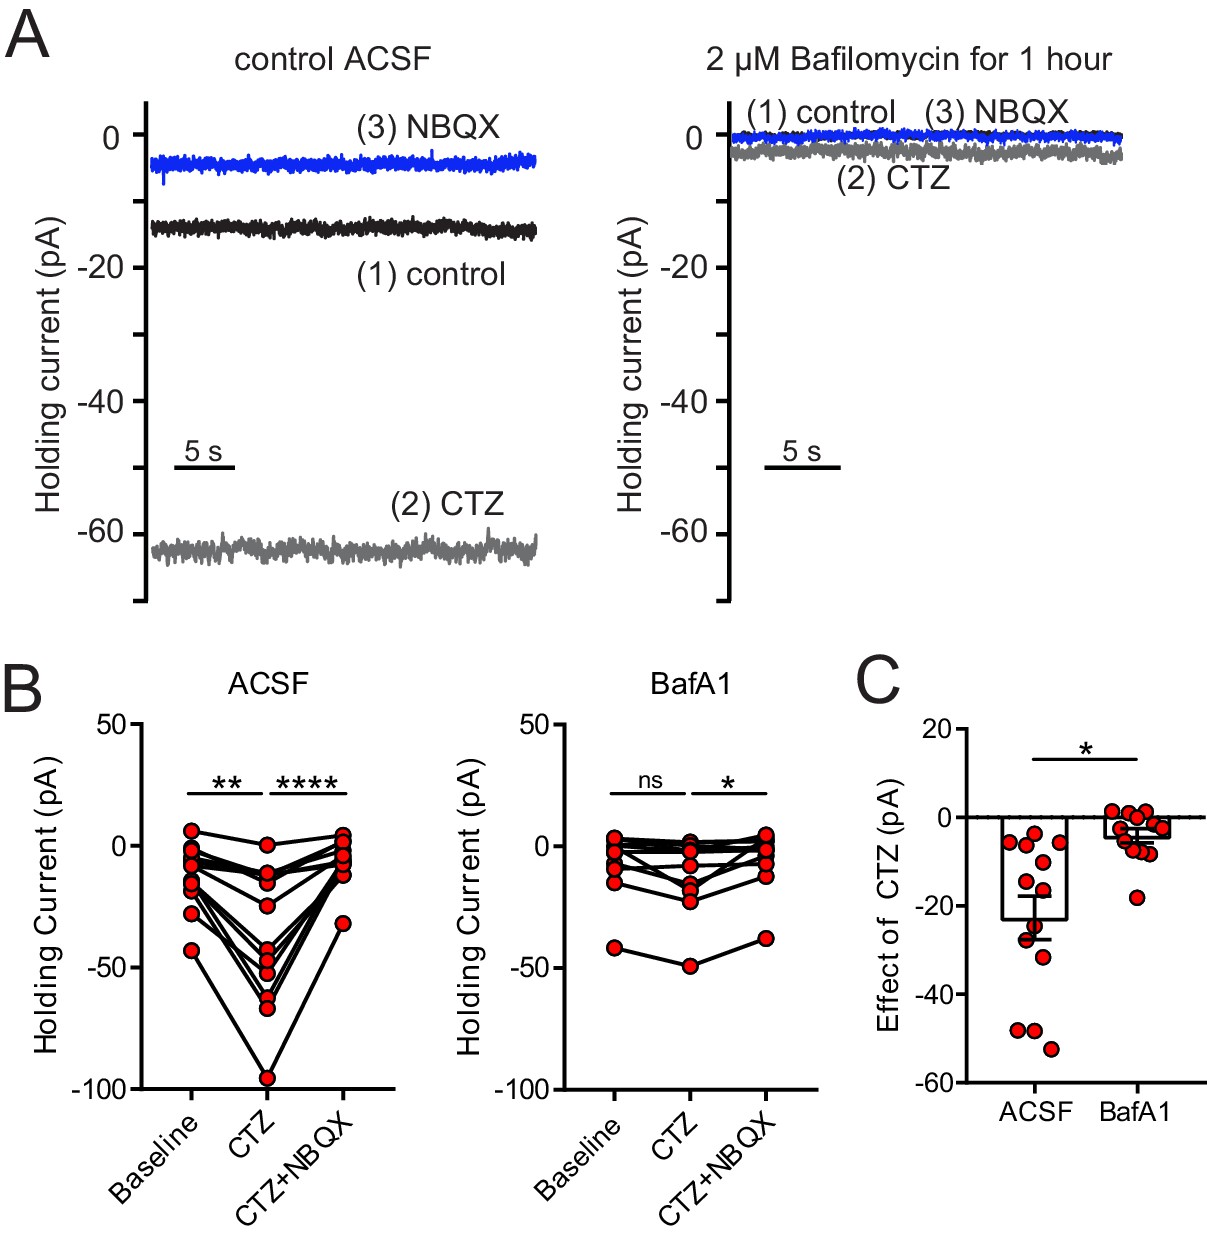
Depletion of glutamate from synaptic vesicles confirms vesicular source of ambient glutamate.
(A) Example recordings of the baseline current of an ON UBC in control (left panel) and of an ON UBC after BafA1 treatment (right), showing the decrease in the current revealed by 100 µM CTZ after treatment with BafA1, with subsequent block by 5 µM NBQX. (B) Left: After incubation with ACSF as a control, CTZ increased the inward holding current significantly, which was reversed by NBQX. Friedman test, p<0.0001, n = 12; Dunn's multiple comparisons tests, baseline vs CTZ, p=0.01, CTZ vs CTZ+NBQX, p<0.001. Right- Incubation in BafA1 reduced the effect of CTZ. Friedman test, p=0.0169, n = 12; Dunn's multiple comparisons tests, Baseline vs CTZ, p=0.459; CTZ vs CTZ+NBQX, p=0.0128. (C) The effect of CTZ was significantly reduced by incubation in BafA1, unpaired t-test, p=0.002, n = 25.
Figure 6—figure supplement 1
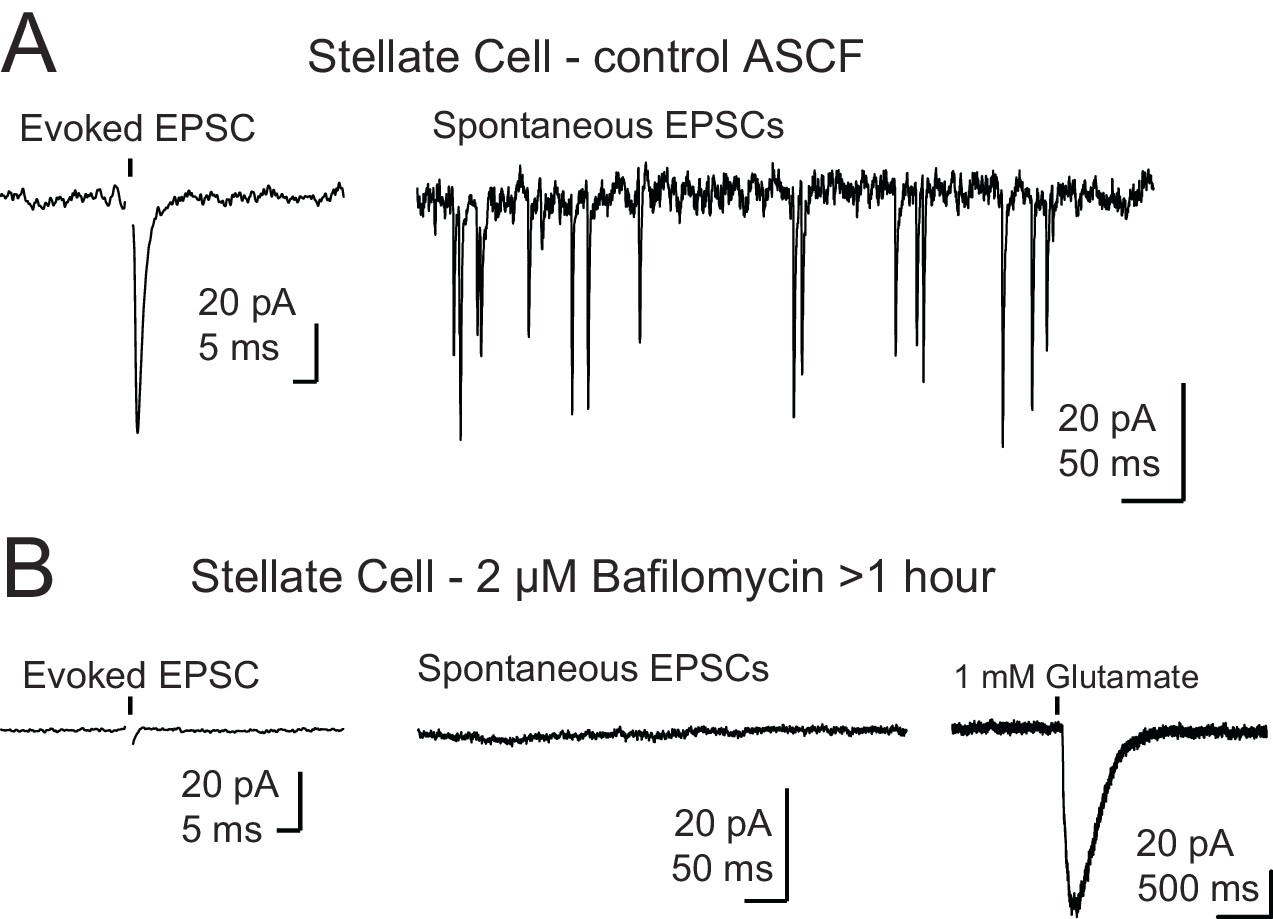
Control for recordings in the presence of bafilomycin A1.
(A) Example traces of a control stellate cell with evoked (left) and spontaneous (right) EPSCs. (B) Example traces from a stellate cell after BafA1 treatment and reduction of vesicular glutamate concentration. Evoked EPSCs and spontaneous EPSCs were absent. Far right trace shows a reliable response to puff application of glutamate demonstrating that postsynaptic receptors were present and functioning. Stellate cells (n = 3) were filled with Alexa 488, and the dendrite locations were easily identified by fluorescence for targeted puff. Black arrows in (A) and (B) show onset of a single electrical stimulus and in (B) black arrowhead indicates onset of a brief puff (10–15 ms) of glutamate. Stimulus artifact was removed for clarity.
Figure 7
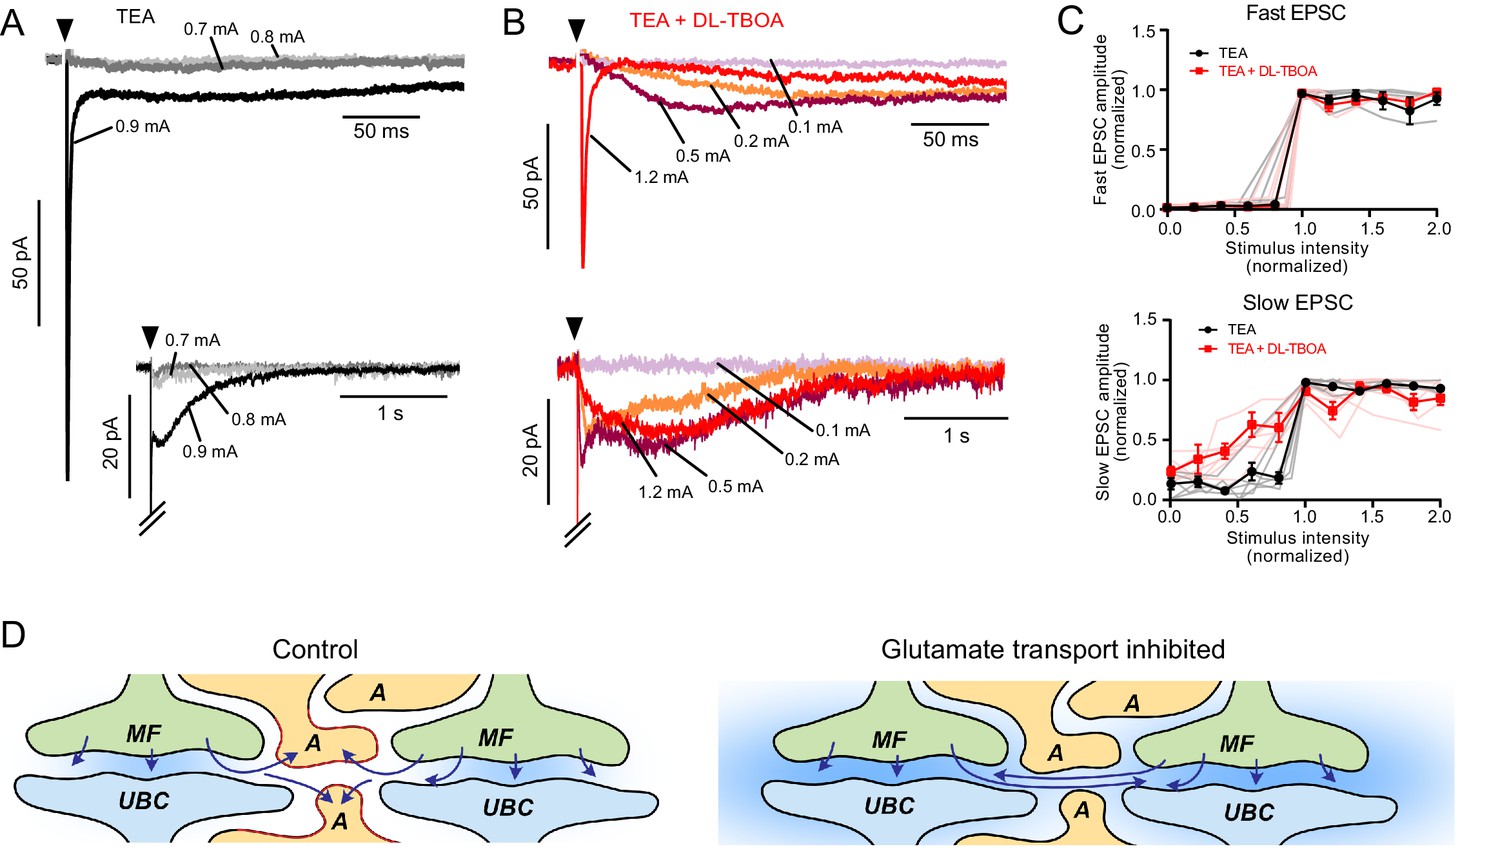
EAATs regulate synaptic integration by UBCs.
(A) Example of AMPAR-mediated EPSC in 1 mM TEA. Top: Single EPSC size (all-or-nothing) at the first stimulation intensity that evoked a current (black). Two stimulation intensities below threshold (light and dark gray) had no EPSC response. Bottom: The same trace with a longer timebase showing the all-or-nothing slow EPSC that occurred at the same stimulation intensity as the fast EPSC. (B) Top: Application of DL-TBOA to the same cell as in (A) reveals slow EPSCs at stimulation intensities below the level that evoked the fast EPSC (red). Note the reduction in EPSC amplitude due to tonic desensitization. Bottom: In DL-TBOA, the slow EPSCs are much longer than in TEA alone. Without DL-TBOA, only 1 of 11 cells had multiple EPSC levels. In DL-TBOA, five of seven cells had at least two different EPSC sizes, indicating that EAATs prevent AMPARs from detecting multiple mossy fibers during strong synaptic stimulation. (C) Top: Fast EPSC amplitudes (relative to the maximal fast EPSC under the same bath conditions) plotted as a function of synaptic stimulation intensity (relative to the lowest intensity that evoked the fast EPSC under the same bath conditions). Both before and after DL-TBOA, the fast EPSC is all-or-nothing. Bottom: Same as above, but showing slow EPSCs. In DL-TBOA, there are multiple amplitude levels. The slow EPSC amplitudes are relative to the maximal slow EPSC in the same bath conditions and the x-axis is relative to the lowest stimulation intensity that evoked the maximal slow EPSC. Error bars mean and SEM. Pink and gray lines are individual experiments. (D) Interpretation of these results. In control conditions (left) glutamate is released from the mossy fiber (MF), detected by the receptors on the UBC, then removed from the synaptic cleft by astrocytes (A). When glutamate transporters are inhibited, not only does ambient glutamate build up (blue background), but glutamate released from neighboring synapses is sensed and integrated as slow rising and slow decaying synaptic currents. Thus, glutamate transporters prevent cross-talk between glomeruli and therefore underlie the ability of glomeruli to function as discrete processing units.
Figure 8
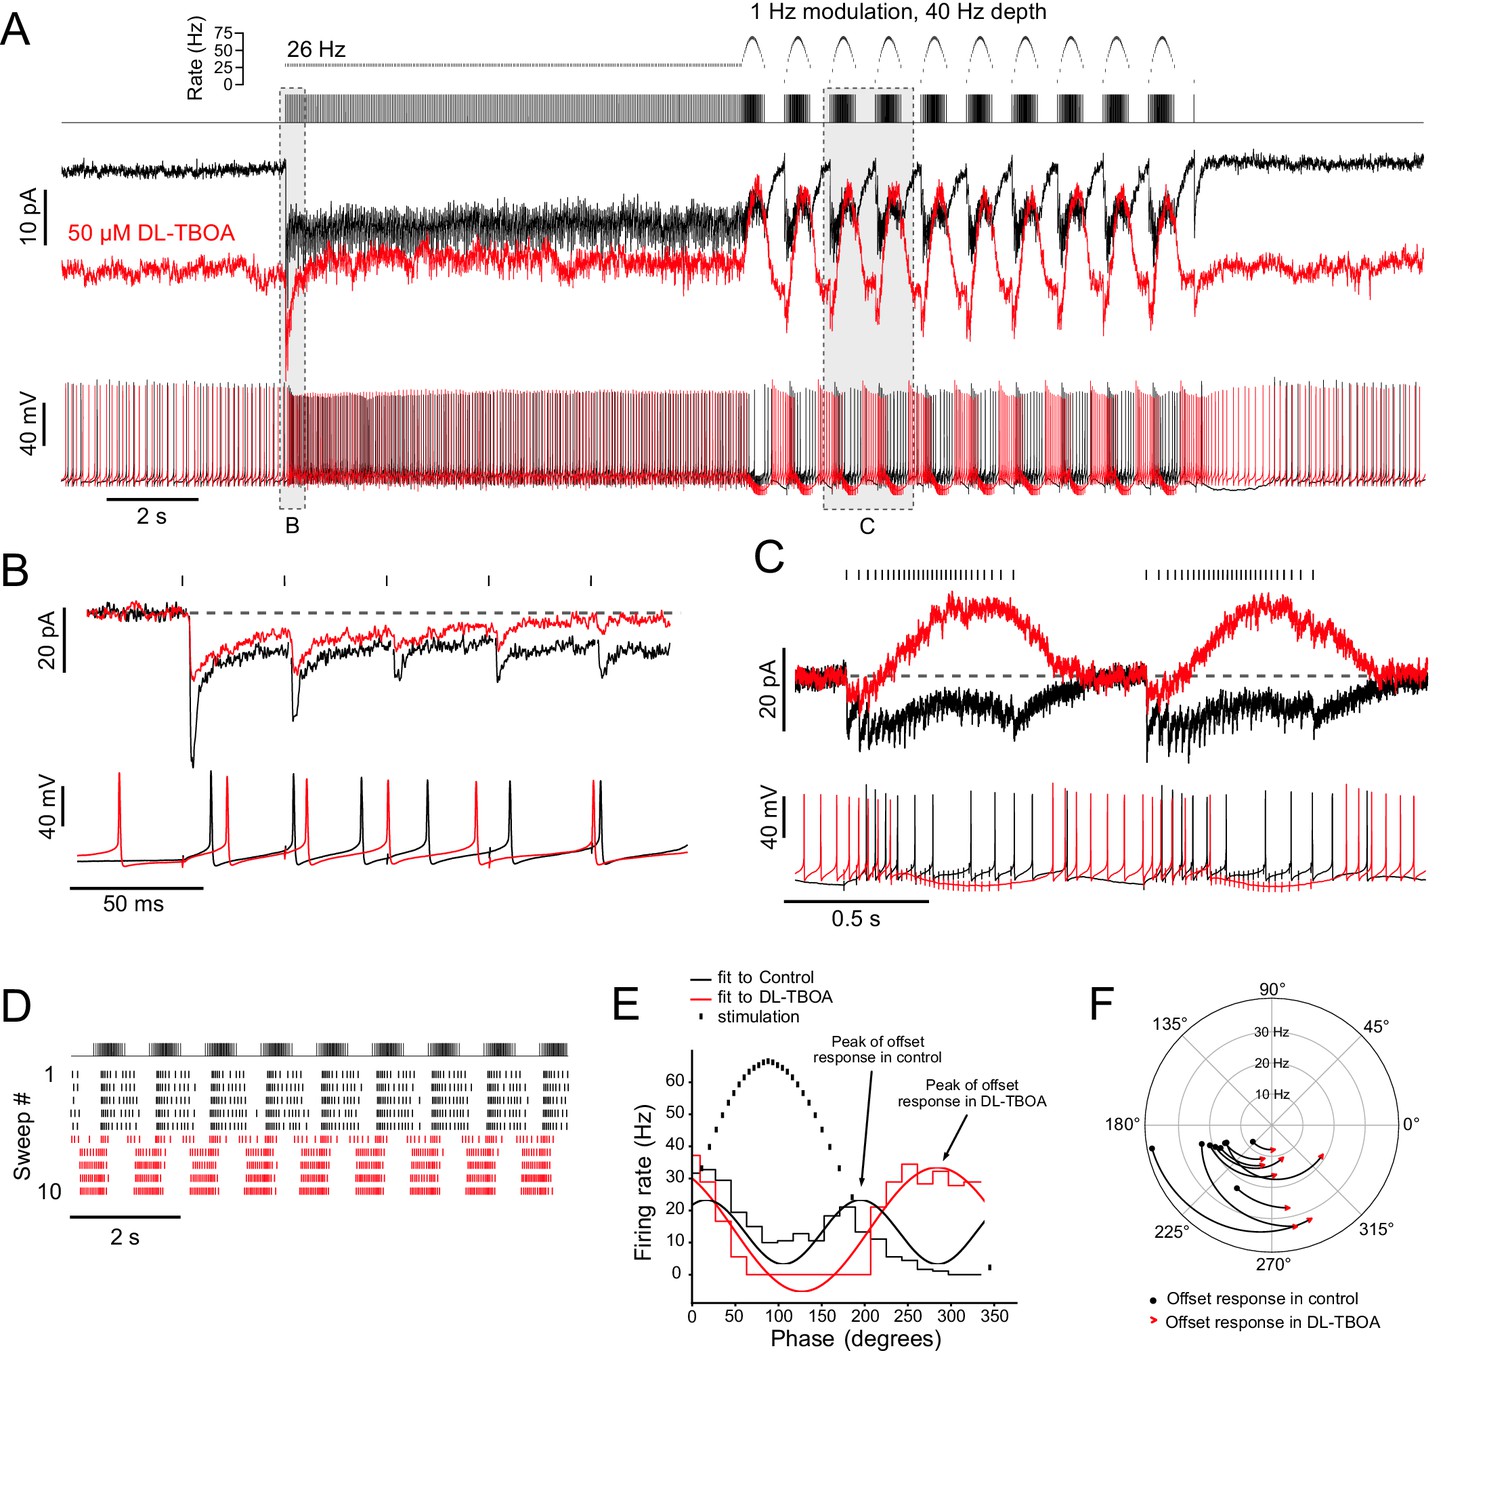
Ambient glutamate determines the phase of the spiking response to frequency-modulated synaptic stimulation.
(A) Example of 1 Hz frequency-modulated synaptic stimulation protocol. Five seconds of no stimulation, followed by 10 s, 26 Hz stimulation, followed by 10 s of modulation with a 40 Hz depth at a modulation rate of 1 Hz. Raster plot shows time of stimuli plotted against instantaneous rate. Below is the stimulus train that was delivered to white matter. Evoked currents are shown for baseline condition (black) and after bath application of DL-TBOA in the same cell (red). DL-TBOA increased inward holding current. Note that during the modulated stimulation the evoked outward current does not go beyond the baseline holding current. Spike trains recorded in current clamp are shown below. Bias current was applied to offset the tonic currents induced by DL-TBOA and to maintain the resting membrane potential at −70 mV. The phase of spiking during the modulated stimulation shifts after block of EAATs. (B) Expanded view of the first five pulses of the 26 Hz stimulation. Currents are baseline subtracted. In DL-TBOA, the first EPSC in the train is smaller, indicating tonic desensitization of AMPARs by ambient glutamate. Below, current clamp shows delayed spiking in presence of DL-TBOA. (C) Expanded view of two cycles of the frequency modulated stimulation. The currents are zeroed right before the increase in stimulation rate. In control, the currents remain net inward during the increased rate of stimulation. In DL-TBOA, desensitization caused a net outward current during the increased stimulation rate. Below, in current clamp, in control conditions, the highest rate of synaptic stimulation caused spiking. In DL-TBOA, the highest rate of stimulation caused hyperpolarization that causes the cell to stop spiking. (D) Raster plot showing the application of DL-TBOA starting at sweep 6 (red). Note the shift in timing of the spikes. (E) PSTHs during the frequency modulated stimulation were made over several sweeps and cycles. Sine waves were fit to the PSTHs, and their period was used to calculate the phase shift caused by DL-TBOA. In this example the UBC fired during increasing and decreasing stimulus rates. In DL-TBOA, the peak of firing was shifted towards 270° and was continuous from the offset of stimulation until the stimulation rate increases. (F) In all cases, DL-TBOA shifted the offset firing response toward the lower stimulation rates, shifting the phase later. The phase of the offset response in control ACSF is represented as a black dot and the phase of the offset response in DL-TBOA of the same ON UBC is represented by the red arrowhead. Firing rate is indicated on the radius. The curves between control and DL-TBOA are arbitrary. These experiments included 5 µM MK-801 in addition to strychnine and SR-95531.
-
Figure 8—source code 1
Python script to produce a sinusoidally modulated pattern of TTL pulses that was used to approximate in vivo-like activity patterns.
The script creates a text file that can be imported into pClamp and used as a stimulus output pattern.
- https://cdn.elifesciences.org/articles/63819/elife-63819-fig8-code1-v2.zip
Tables
Key resources table
| Reagent type (species) or resource | Designation | Source or reference | Identifiers | Additional information |
|---|---|---|---|---|
| Genetic reagent (M. musculus) | C57BL/6J | Jackson Laboratory | RRID: IMSR_JAX:000664 | |
| Genetic reagent (M. musculus) | B6.TgN(grm2-IL2RA/GFP)1kyo | Dr. Robert Duvoisin (OHSU) PMID:9778244 | RBRC: RBRC01194 | |
| Chemical compound, drug | Alexa Fluor 488 hydrazide sodium salt | ThermoFisher Scientific | Cat # A10436 | |
| Chemical compound, drug | Alexa Fluor 594 hydrazide sodium salt | ThermoFisher Scientific | Cat # A10438 | |
| Chemical compound, drug | GYKI-53655 | Tocris | Cat # 2555 | |
| Chemical compound, drug | JNJ-16259685 | Tocris | Cat # 2333 | |
| Chemical compound, drug | LY-341495 | Tocris | Cat # 1209 | |
| Chemical compound, drug | (+)-MK-801 hydrogen maleate | Sigma | Cat # M107 | |
| Chemical compound, drug | (R)-CPP | Abcam | Cat # ab120159 | |
| Chemical compound, drug | Strychnine hydrochloride | Sigma | Cat # S8753 | |
| Chemical compound, drug | SR-95531 hydrobromide | Tocris | Cat # 1262 | |
| Chemical compound, drug | Tetraethylammonium chloride | Sigma | Cat # 86614 | |
| Chemical compound, drug | NBQX disodium salt | Abcam | Cat # ab120046 | |
| Chemical compound, drug | Cyclothiazide | Tocris | Cat # 0713 | |
| Chemical compound, drug | Bafilomycin A1 | InvivoGen | Cat # tlrl-baf1 | |
| Chemical compound, drug | DL-TBOA | Tocris | Cat # 1223 | |
| Chemical compound, drug | TFB-TBOA | Tocris | Cat # 2532 | |
| Chemical compound, drug | Tetrodotoxin citrate | Tocris | Cat # 1069 | |
| Software, algorithm | pClamp 10 | Molecular Devices | RRID:SCR_011323 | |
| Software, algorithm | Igor Pro 8 | WaveMetrics | RRID:SCR_000325 | |
| Software, algorithm | Prism 8 | GraphPad | RRID:SCR_002798 | |
| Software, algorithm | Excel | Microsoft | RRID:SCR_016137 | |
| Software, algorithm | Axograph X | Axograph | RRID:SCR_014284 | |
| Software, algorithm | NEURON | PMID:9248061 | RRID:SCR_005393 | |
| Software, algorithm | Affinity Designer | Serif | RRID:SCR_016952 | |
| Software, algorithm | Python | python.org | RRID:SCR_008394 | |
| Software, algorithm | NumPy | numpy.org | RRID:SCR_008633 | |
| Software, algorithm | MatPlotLib | matplotlib.org | RRID:SCR_008624 |
Additional files
Download links
A two-part list of links to download the article, or parts of the article, in various formats.
Downloads (link to download the article as PDF)
Open citations (links to open the citations from this article in various online reference manager services)
Cite this article (links to download the citations from this article in formats compatible with various reference manager tools)
Incomplete removal of extracellular glutamate controls synaptic transmission and integration at a cerebellar synapse
eLife 10:e63819.
https://doi.org/10.7554/eLife.63819


