Remodeling of whole-body lipid metabolism and a diabetic-like phenotype caused by loss of CDK1 and hepatocyte division
- Institute of Molecular and Cell Biology (IMCB), A*STAR (Agency for Science, Technology and Research), Singapore
- Department of Biochemistry, Yong Loo Lin School of Medicine, National University of Singapore (NUS), Singapore
- Singapore Lipidomics Incubator (SLING), Life Sciences Institute, National University of Singapore (NUS), Singapore
- Laboratory of Metabolic Medicine, Singapore Bioimaging Consortium (SBIC), A*STAR, Singapore
- Department of Medicine, Yong Loo Lin School of Medicine, National University of Singapore (NUS), Singapore
- Biological Resource Centre (BRC), A*STAR, Singapore
- Department of Clinical Sciences, Lund University, Clinical Research Centre (CRC), Sweden
Figures
Figure 1 with 1 supplement
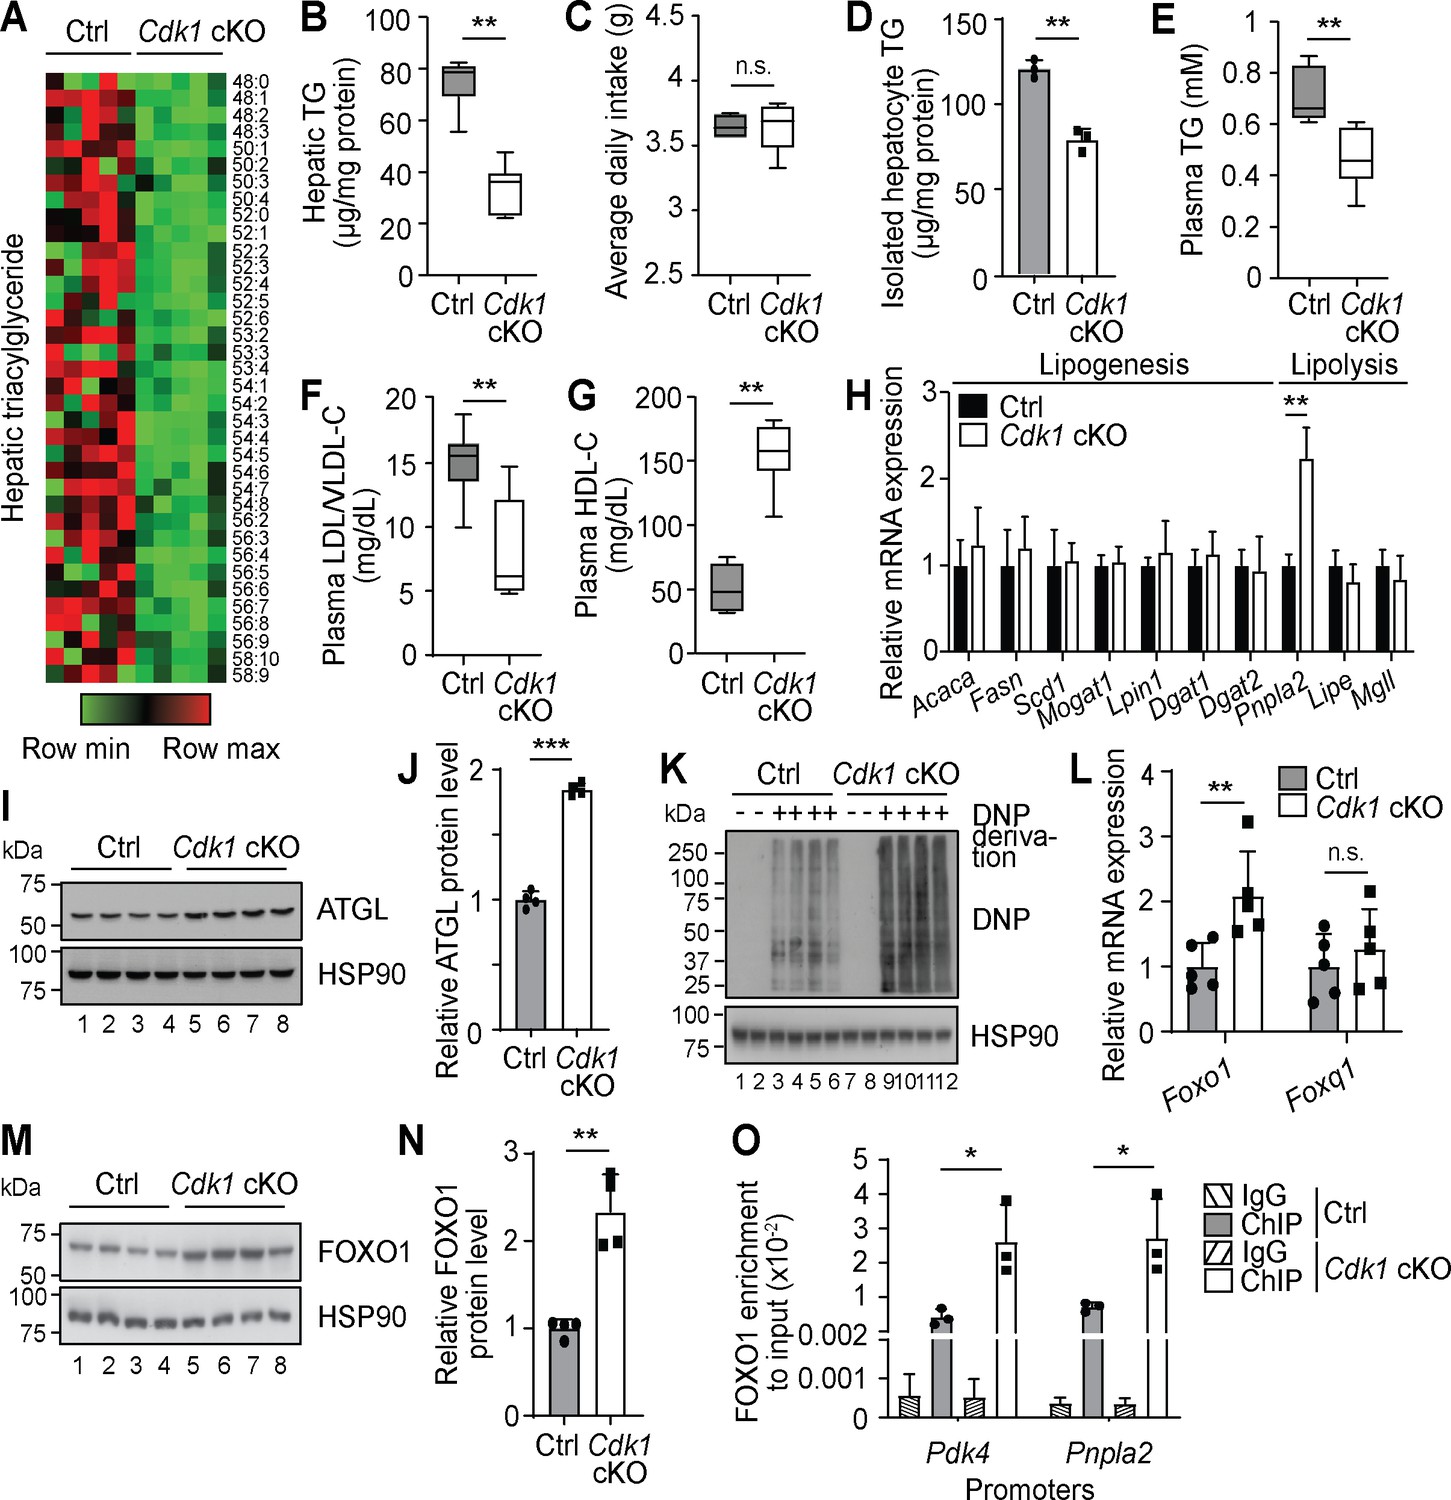
Oxidative stress results in Foxo1-dependent activation of Pnpla2 in young Cdk1 cKO liver.
(A) Heat map of triacylglyceride (TG) species in whole liver of control (Ctrl) and Cdk1 cKO mice as measured by mass spectrometry (lipidomics). Data is available in Supplementary file 1. TG species are also ordered as in Supplementary file 1. (B) Hepatic TG levels as quantified by biochemical assays (n = 6 per genotype). (C) Food intake of control and Cdk1 cKO mice tracked over 2 weeks (6- to 8-week-old) and represented as average daily intake. (D) TG from isolated primary hepatocytes (n = 3 per genotype), (E) plasma TG, (F) plasma LDL/VLDL-cholesterol and (G) plasma HDL-cholesterol levels as quantified by biochemical assays (n = 6 per genotype for plasma biochemical assays). (H) qPCR for lipogenic and lipolytic genes in whole liver (n = 6 per genotype). (I) Immunoblot of liver lysates for ATGL, with HSP90 as loading control. (J) Quantification of ATGL protein levels from immunoblot. Error bars represent S.D. (K) Immunoblot of liver lysates for carbonylated proteins, probed for Dinitrophenol (DNP) hydrazone after DNP derivation, with HSP90 as loading control. (L) qPCR for Foxo1 and Foxq1 in whole liver (n = 5 per genotype). (M) Immunoblot of liver lysates for FOXO1, with HSP90 as loading control. (N) Quantification of FOXO1 protein levels from immunoblot. Error bars represent S.D. (O) Enrichment of FOXO1 localization at promoters of Pdk4 and Pnpla2 in isolated primary hepatocytes upon ChIP-qPCR after normalization to input (n = 3 per genotype). Error bars represent S.E.M. unless otherwise indicated. All experiments were performed on tissue samples or cells from 8-week-old mice. All source data are available in Supplementary file 10 unless specifically indicated.
Figure 1—figure supplement 1
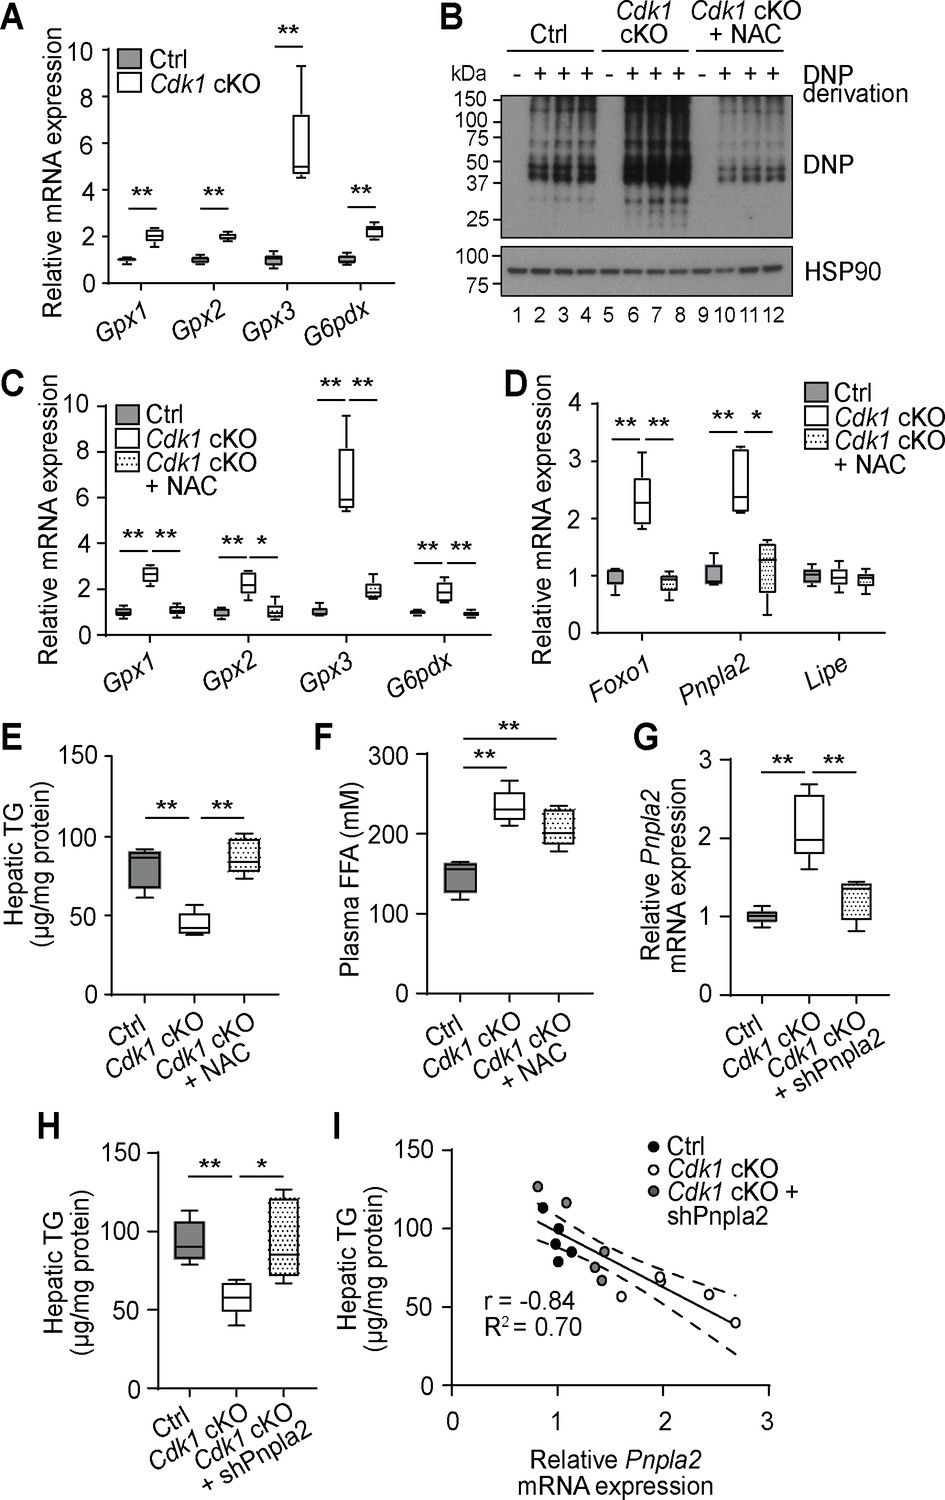
NAC treatment and silencing of Pnpla2 can reverse the reduction of triacylglyceride (TG) phenotype.
(A) qPCR for oxidative stress-associated genes in whole liver (at least n = 5 per genotype). (B) Immunoblot of liver lysates for carbonylated proteins, probed for DNP after DNP derivation. HSP90 serves as loading control. (C) qPCR for oxidative stress-associated genes and (D) Foxo1, Pnpla2, and Lipe in liver of control (Ctrl) or Cdk1 cKO mice fed with normal water or water containing NAC (n = 5 per genotype). (E) Hepatic TG and (F) plasma FFA levels of Ctrl or Cdk1 cKO mice fed with normal water or water containing NAC measured by biochemical assay (n = 5 per condition). (G) qPCR for Pnpla2 in liver of Ctrl mice or Cdk1 cKO mice injected with empty vector or pLKO-shPnpla2 (n = 5 per condition). (H) Hepatic TG levels of Ctrl mice or Cdk1 cKO mice injected with empty vector or pLKO-shPnpla2 (n = 5 per condition). (I) Correlation plot with relative Pnpla2 mRNA expression as x-axis and hepatic TG levels as y-axis. Dotted lines represent 95% confidence intervals. Pearson’s correlation coefficient (r) and goodness-of-fit coefficient (R2) values are indicated in the plot. Error bars for all graphs represent S.E.M.
Figure 2
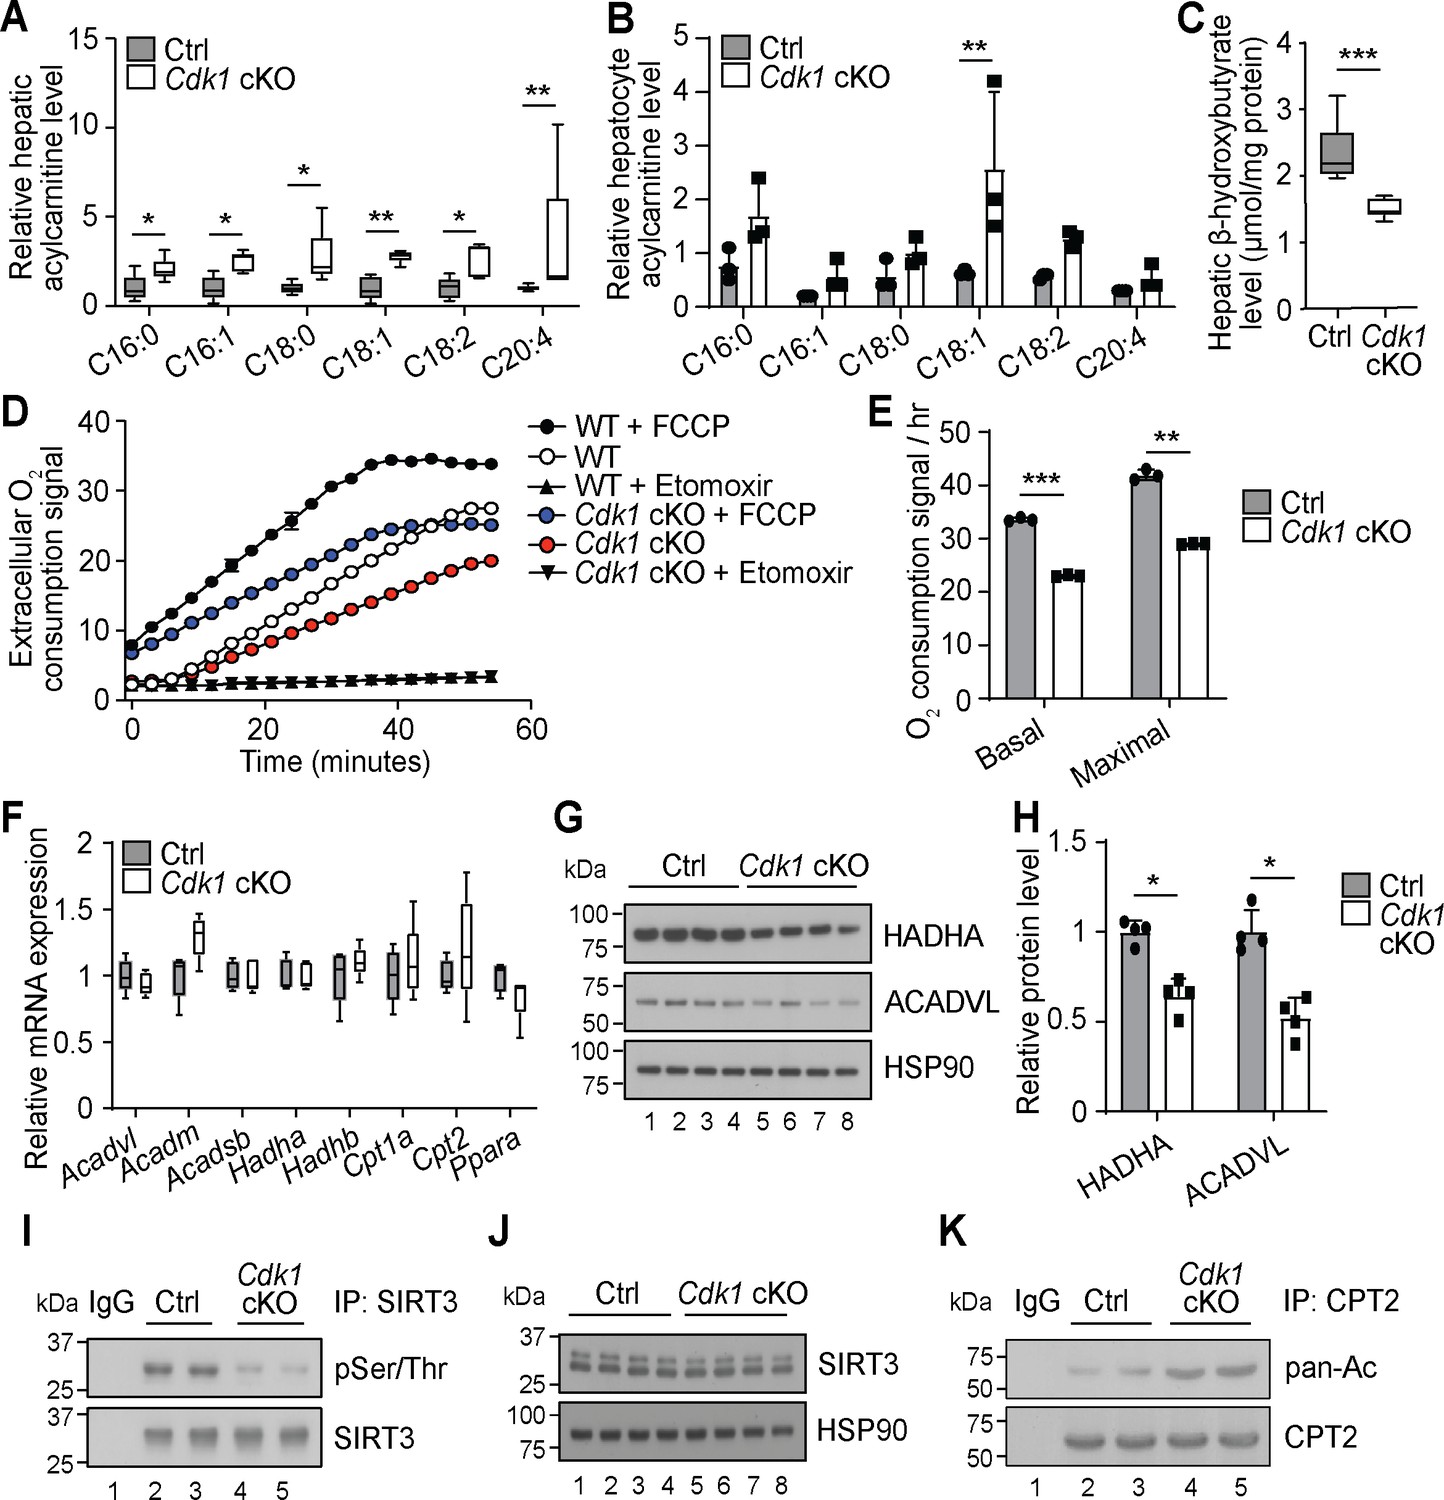
Cdk1 cKO hepatocytes have reduced capacity for fatty acid oxidation (FAO).
Relative acylcarnitine levels in liver (A; n = 5 per genotype) and primary hepatocytes (B; n = 3 per genotype) of control (Ctrl) and Cdk1 cKO mice as measured by mass spectrometry. Data is available in Supplementary file 1 and Supplementary file 2, respectively. (C) Hepatic β-hydroxybutyrate levels measured using biochemical assays (n = 8 per genotype). Error bars represent S.E.M. (D) FAO assays on isolated primary hepatocytes that were untreated, treated with FCCP to maximize oxidative capacity or treated with Etomoxir to block FAO. (E) Quantification of basal and maximal FAO capacity of isolated hepatocytes based on oxygen consumption signal of untreated and FCCP-treated hepatocytes, respectively, from the FAO assays. Statistical significance was calculated using unpaired two-tailed t-test with Welch’s correction. (F) qPCR for expression of FAO genes in whole liver (at least n = 4 per genotype). Error bars represent S.E.M. (G) Immunoblot of liver lysate, probed for HADHA and ACADVL with HSP90 as loading control. (H) Quantification of HADHA and ACADVL protein levels from immunoblot. (I) SIRT3 was immunoprecipitated from lysates of Ctrl or Cdk1 cKO liver and probed for phosphorylated Ser/Thr (pSer/Thr). IgG was used as negative control. (J) Immunoblot of liver lysate, probed for SIRT3 with HSP90 as loading control. (K) CPT2 was immunoprecipitated from lysates of Ctrl or Cdk1 cKO liver and probed for pan-acetylated residues (pan-Ac). IgG was used as negative control. Error bars represent S.D. unless otherwise indicated. All experiments were performed on tissue samples or cells from 8-week-old mice. All source data are available in Supplementary file 10 unless specifically indicated.
Figure 3

Free fatty acids (FFAs) are transported to the adipose tissue for storage in young Cdk1 cKO mice.
(A) Relative plasma FFA levels in control (Ctrl) and Cdk1 cKO mice as measured by mass spectrometry (n = 5 per genotype). Data is available in Supplementary file 3. (B) Ratio of total fat mass, as measured by magnetic resonance imaging, to body weight (n = 5 for each genotype). (C) Ratio of subcutaneous WAT (scWAT) or epididymal WAT (epWAT) weight to body weight (n = 10 per genotype). (D) Body weight change between start and end of 2-week food intake tracking period. (E) Ratio of body weight change to food intake. (F) Representative H and E image of scWAT and epWAT from control and Cdk1 cKO mice. Scale bar represents 100 μm in all panels. (G) Quantification of size of adipocytes from H and E images (at least 500 adipocytes per mouse were measured, n = 5 per genotype). (H) Adipose triacylglyceride levels from scWAT and epWAT measured using biochemical assays (n = 5 per genotype). qPCR for lipogenic genes in scWAT (I) and epWAT (J) of control and Cdk1 cKO mice (at least n = 4 per genotype). Error bars for all graphs represent S.E.M. All experiments were performed on tissue samples from 8-week-old mice. All source data are available in Supplementary file 10 unless specifically indicated.
Figure 4

Increased plasma fatty acids affect peripheral tissues and induce insulin signaling in young Cdk1 cKO mice.
(A) qPCR for fatty acid oxidation genes in skeletal muscle (quadriceps) from control (Ctrl) and Cdk1 cKO mice (n = 5 per genotype). (B) Plasma insulin level examined with ELISA (n = 8 per genotype). (C) qPCR for Ins2 in pancreas of Ctrl and Cdk1 cKO mice (n = 5 per genotype). (D) Fed state blood glucose measurements using glucose meter (at least n = 8 per genotype). (E) Hepatic glycogen content measured with biochemical assays (n = 5 per genotype). (F) Immunoblot of liver lysate probed for INSRB, phosphorylated INSRB at Y1151/1152 (pY1151/1152-INSRB), AKT, and phosphorylated AKT at T308 (pT308-AKT). HSP90 serves as loading control. (G) Quantification of pY1151/1152-INSRB levels normalized to total INSRB protein and (H) pT308-AKT levels normalized to total AKT protein from immunoblot. Error bars for immunoblot quantifications represent S.D. Blood glucose measurements (I) and area under curve analysis (J) from intraperitoneal glucose tolerance test (at least n = 10 per genotype). Error bars for all graphs represent S.E.M. unless otherwise indicated. All experiments were performed on tissue samples from 8-week-old mice. All source data are available in Supplementary file 10.
Figure 5 with 1 supplement
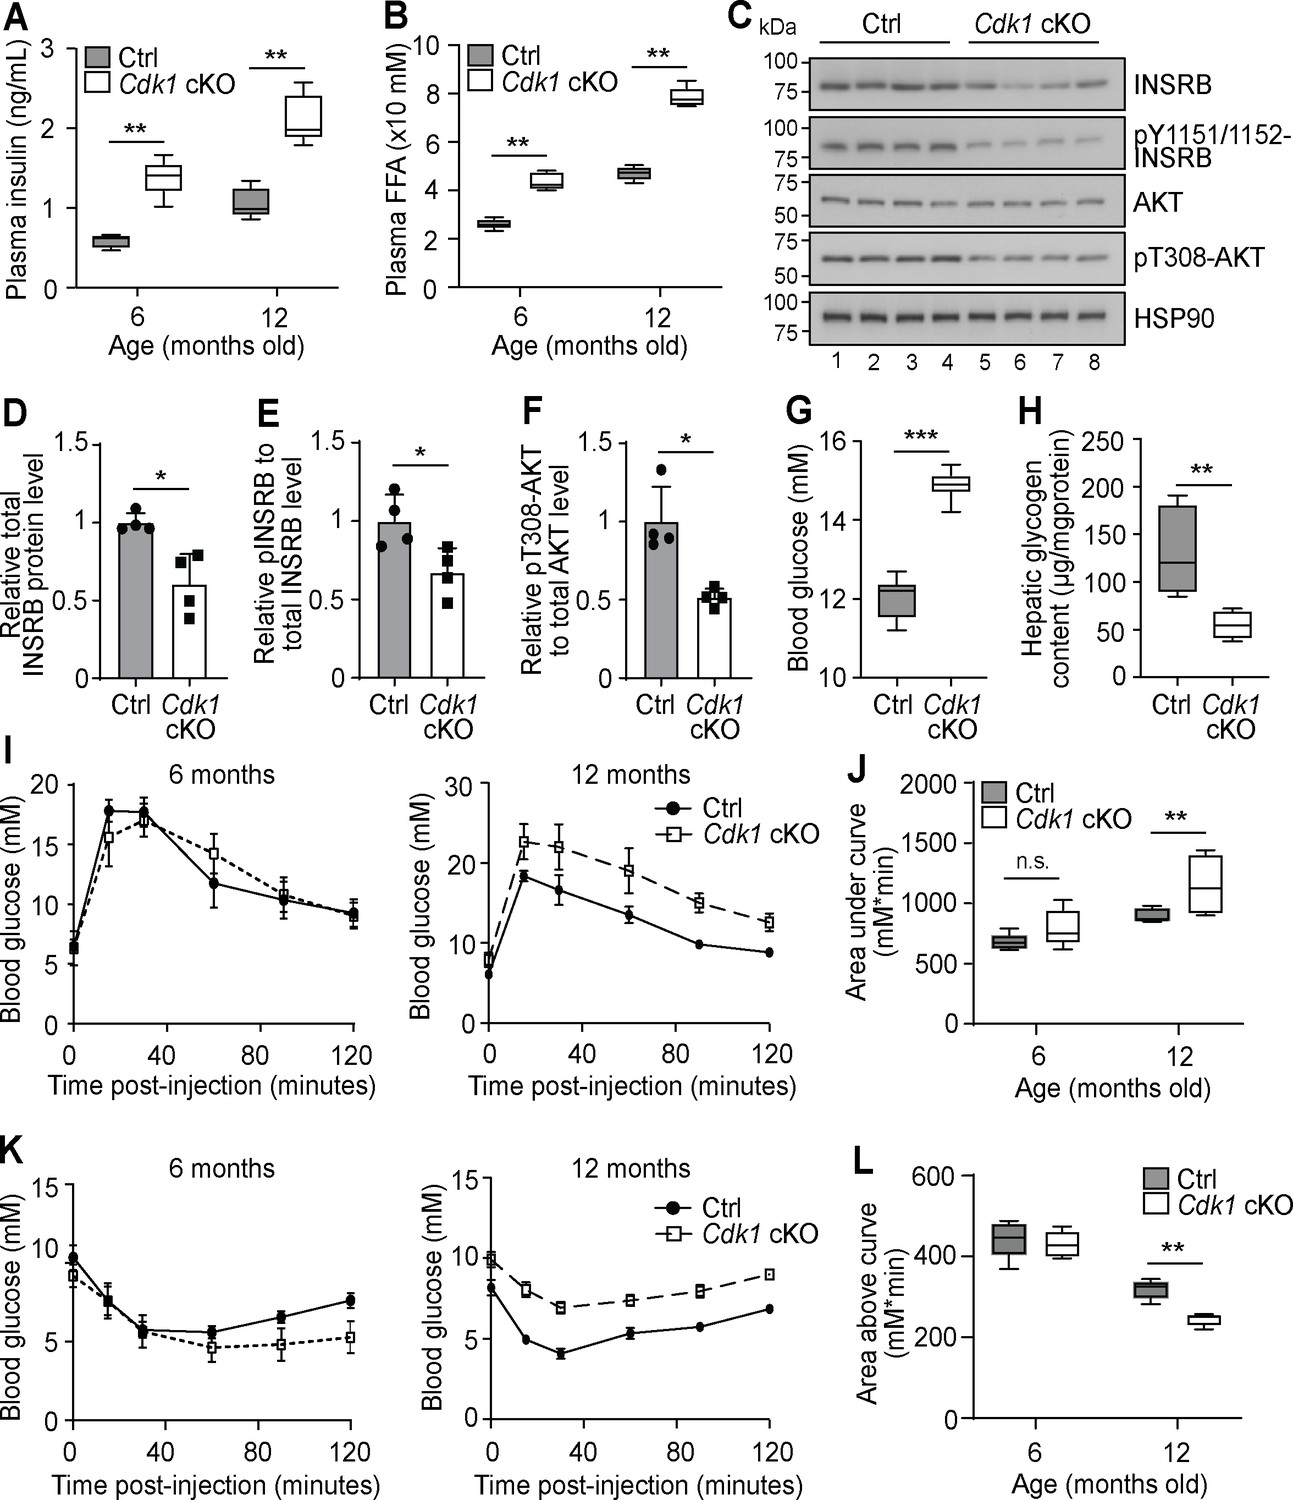
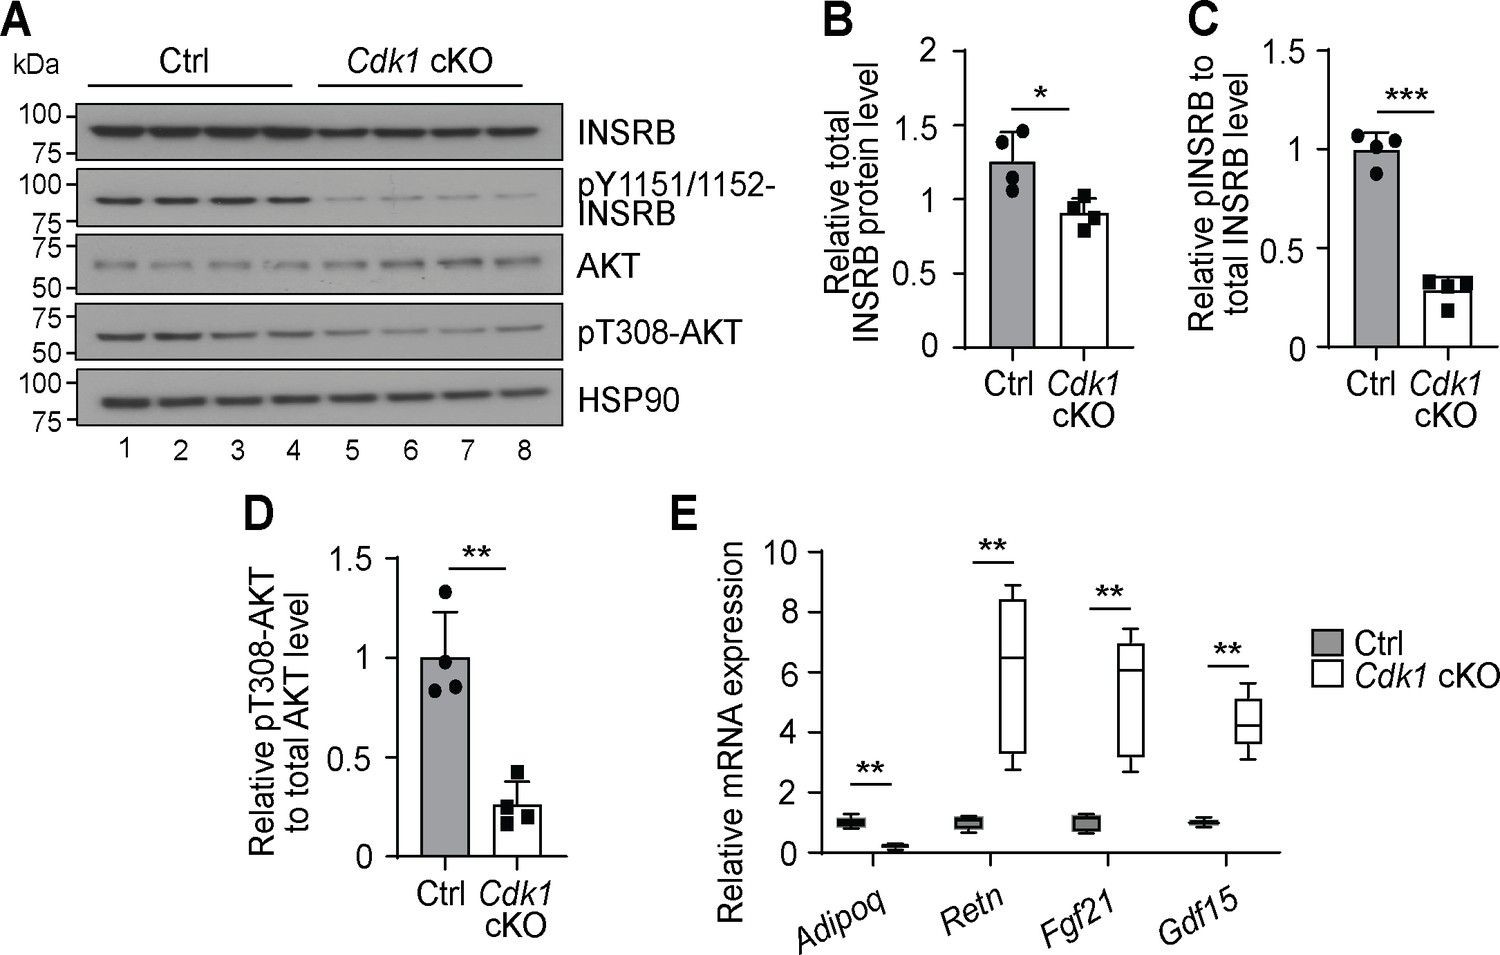
Aged Cdk1 cKO mice develop insulin resistance.
(A) Plasma insulin levels measured at 6 and 12 months old by ELISA (n = 5 per genotype per age). Error bars represent S.E.M. (B) Plasma FFA levels measured at 6 and 12 months old by biochemical assays (n = 5 per genotype per age). Error bars represent S.E.M. (C) Immunoblot of liver lysates from 12-month-old mice, probed for INSRB, phosphorylated INSRB at Y1151/1152 (pY1151/1152-INSRB), AKT, and phosphorylated AKT at T308 (pT308-AKT), with HSP90 as loading control. Quantification of total INSRB protein levels (D), pY1151/1152-INSRB levels normalized to total INSRB protein (E), and pT308-AKT normalized to total AKT protein (F) from immunoblot. (G) Fed state blood glucose measurements (at least n = 8 per genotype) and (H) hepatic glycogen content of 12-month-old mice (n = 5 per genotype). Error bars represent S.E.M. (I) Blood glucose measurements and (J) area under curve analysis from intraperitoneal glucose tolerance test (ipGTT) of 6- and 12-month-old mice (at least n = 5 per genotype). (K) Blood glucose measurements and (L) area above curve analysis from intraperitoneal insulin tolerance test (ipITT) of 6- and 12-month-old mice (n = 5 per genotype). Error bars represent S.D. unless otherwise stated. All source data are available in Supplementary file 10.
Figure 5—figure supplement 1
Adipose tissue from aged Cdk1 cKO mice exhibit reduced insulin signaling.
(A) Immunoblot of epWAT lysates from 12-month-old mice, probed for INSRB, phosphorylated INSRB at Y1151/1152 (pY1151/1152-INSRB), AKT, and phosphorylated AKT at T308 (pT308-AKT), with HSP90 as loading control. Quantification of total INSRB protein levels (B), pY1151/1152-INSRB levels normalized to total INSRB protein (C), and pT308-AKT normalized to total AKT protein (D) from immunoblot. (E) qPCR for adipokines in adipose tissue of 12-month-old Ctrl and Cdk1 cKO mice (n = 5 per genotype).
Figure 6 with 1 supplement

Aged Cdk1 cKO mice develop hepatic steatosis progressing to steatohepatitis.
(A) Representative H&E, Oil Red O, and Sirius Red staining of 12-month-old control (Ctrl) and Cdk1 cKO liver sections. Scale bar represents 100 μm in all panels. (B) Hepatic triacylglycerides (TGs) measured by biochemical assays (n = 5 per genotype). (C) qPCR of genes associated with lipogenesis and lipid accumulation in whole liver (n = 5 per genotype). (D) Immunoblot of liver lysates from 12-month-old mice, probed for SREBP1c. HSP90 image is reused from Figure 5C as samples were ran on the same blot. (E) Quantification of SREBP1c protein level from immunoblot. Error bars represent S.D. (F) Heat map of TG species in whole liver of 12-month-old Ctrl and Cdk1 cKO mice as measured by mass spectrometry (lipidomics). Data is available in Supplementary file 5. (G) Quantification of percentage of Sirius-Red-positive area (five images per mouse, n = 5 per genotype). (H) Heat map of diacylglyceride species in whole liver of Ctrl and Cdk1 cKO mice as measured by mass spectrometry (metabolomics). Relative levels of acylcarnitines (I), retinol metabolism metabolites (J), glutathione redox status (K), and purine catabolism metabolites (L) from metabolomics data. Metabolomics data was previously published (Narayanaswamy et al., 2020). Error bars represent S.E.M. unless otherwise stated. All source data (besides metabolomics data) are available in Supplementary file 10.
Figure 6—figure supplement 1
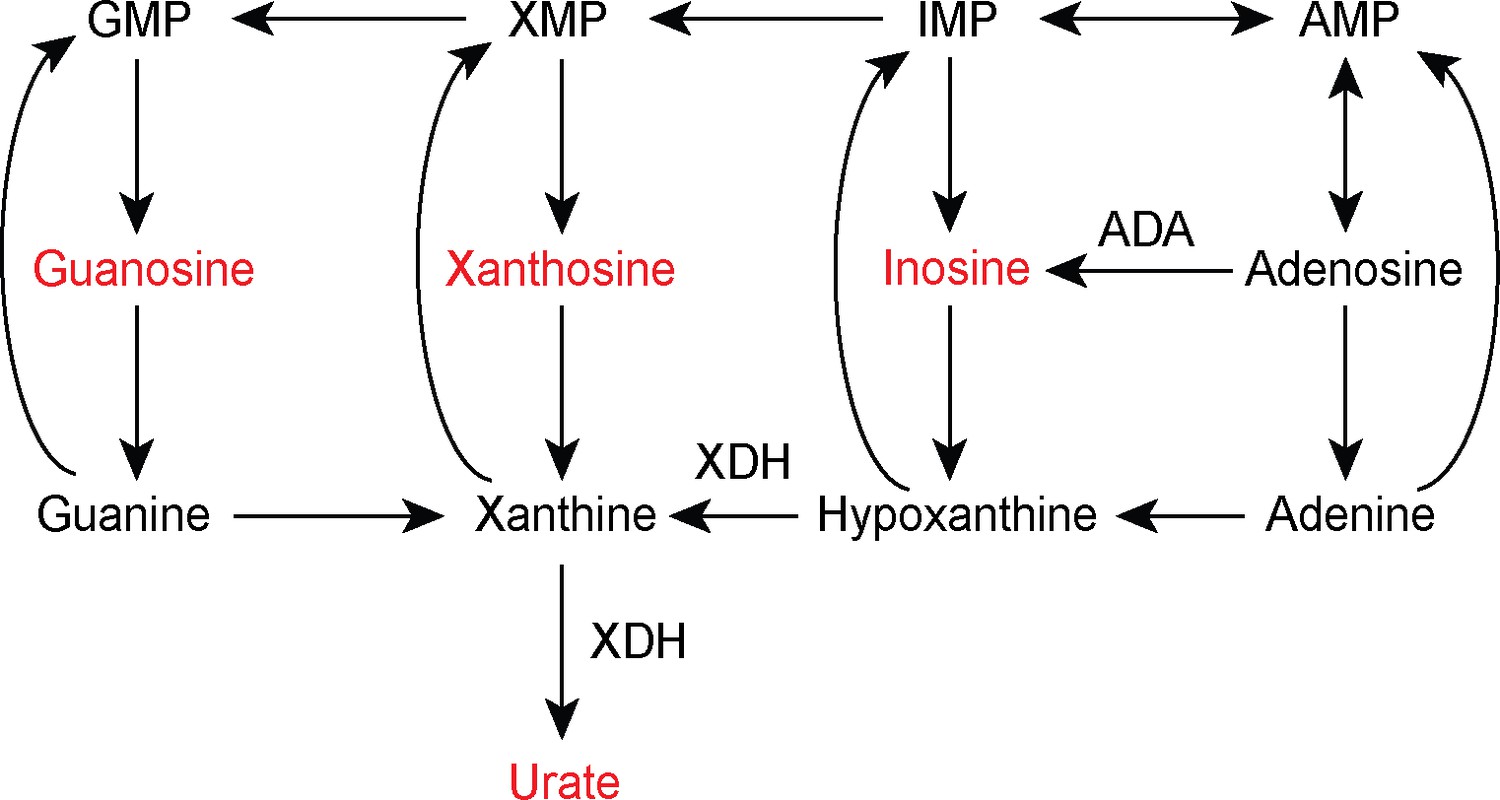
Purine catabolism pathway.
Metabolites that were increased in the metabolomics analysis of aged Cdk1 cKO mice are highlighted in red. Enzymes with known associations to liver metabolic disease are included. ADA: Adenosine deaminase. XDH: Xanthine dehydrogenase.
Figure 7

Transcriptomic analysis of aged Cdk1 cKO mice.
(A) Principal component analysis of RNA-seq data from 12-month-old mice. (B) Volcano plot of RNA-seq data. Significantly differentially expressed genes (q-value <0.1) are represented by red dots, while non-significant genes by black dots. (C) Heat map of expression data from RNA-seq of genes from a severe NAFLD 20-gene signature. RNA-seq data is available in Supplementary file 6. (D) qPCR validation of selected genes from the 20-gene signature (n = 5 per genotype). (E) KEGG pathway analysis of differentially expressed genes (red for upregulated genes, green for downregulated genes) from RNA-seq data. Number of genes over the total number of genes associated with each KEGG term is indicated at the end of the respective bars. (F) ChIP enrichment analysis (ChEA) of differentially expressed genes from RNA-seq data. KEGG and ChEA data are available in Supplementary file 7. (G) Enrichment of LXRα localization at promoters of Srebf1 and Scd1 upon ChIP-qPCR after normalization to input. Error bars for all graphs represent S.E.M. Source data for qPCR and ChIP-qPCR are available in Supplementary file 10.
Figure 8
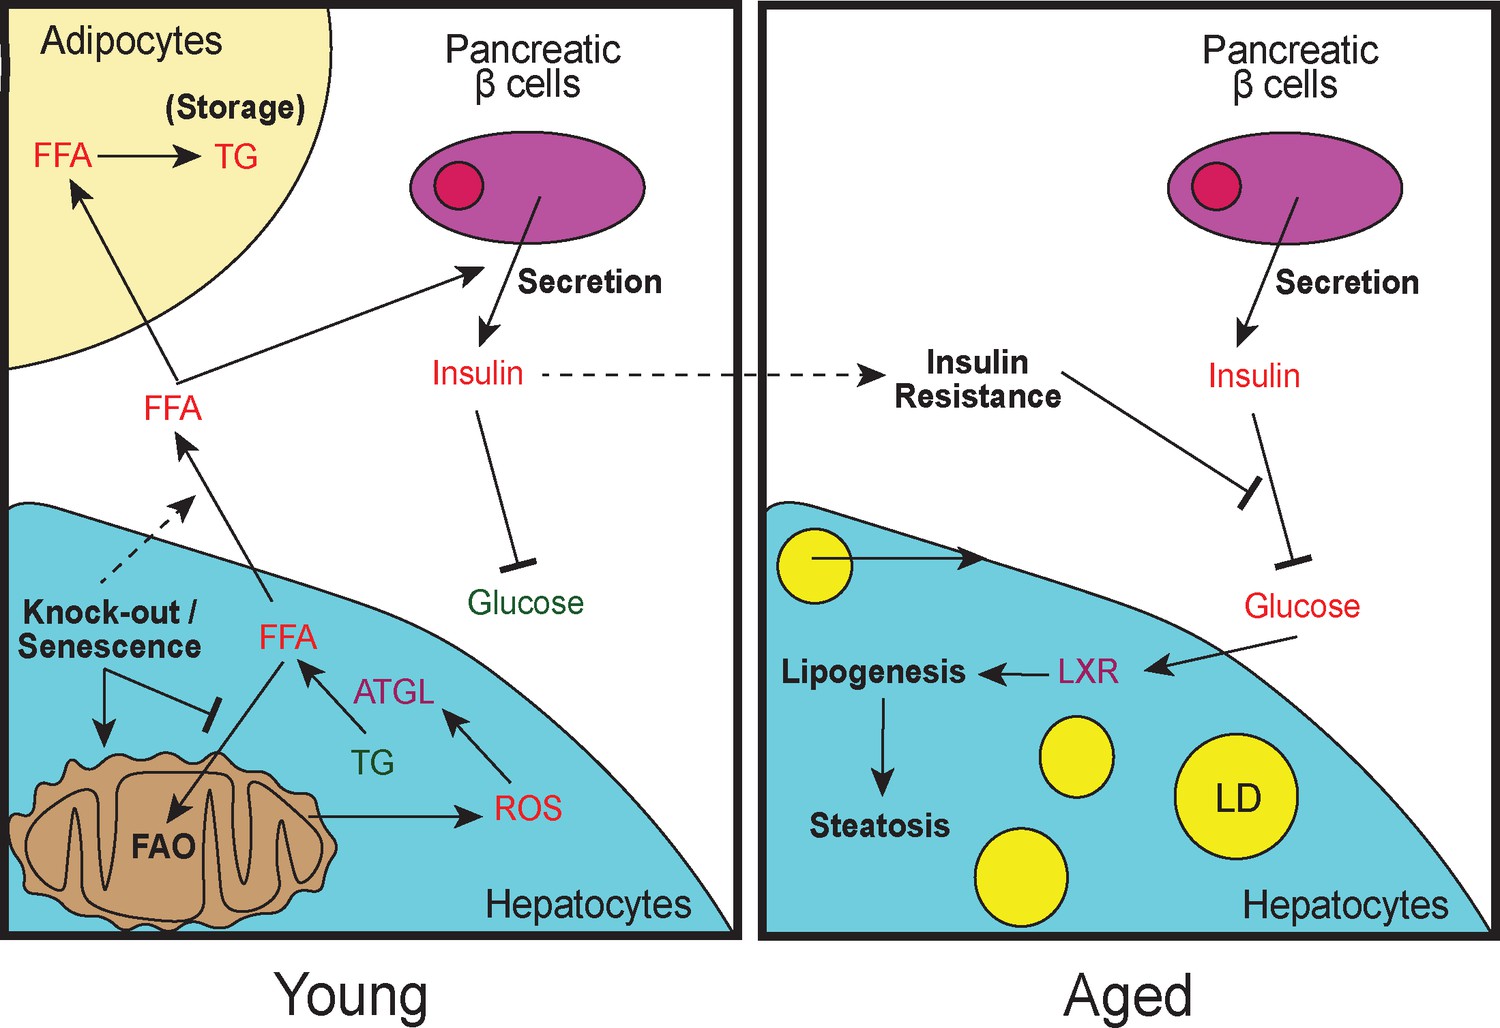
Model of lipid remodeling in young and aged Cdk1 cKO mice.
Upon knockout of Cdk1 or senescence, whereby CDK1 activity is inhibited by CDK1 inhibitors, there is a block of FAO, leading to an accumulation of FFA in young Cdk1 cKO mice. This is further exacerbated by mitochondrial oxidative stress that promotes FOXO1-dependent ATGL upregulation and increased lipolysis. The accumulated FFA then enter the bloodstream and is stored as TGs in adipocytes in the WAT. Elevated FFA levels in the bloodstream can also induce greater insulin secretion by pancreatic β-cells (hyperinsulinemia), leading to reduced blood glucose. However, over time, chronic hyperinsulinemia results in the development of insulin resistance in aged Cdk1 cKO mice, which prevents the blood glucose lowering effect of insulin, causing hyperglycemia. Hyperglycemia, in turn, activates LXR activity and drives lipogenesis, eventually culminating in the manifestation of hepatic steatosis and a NAFLD-like phenotype.
Figure 9
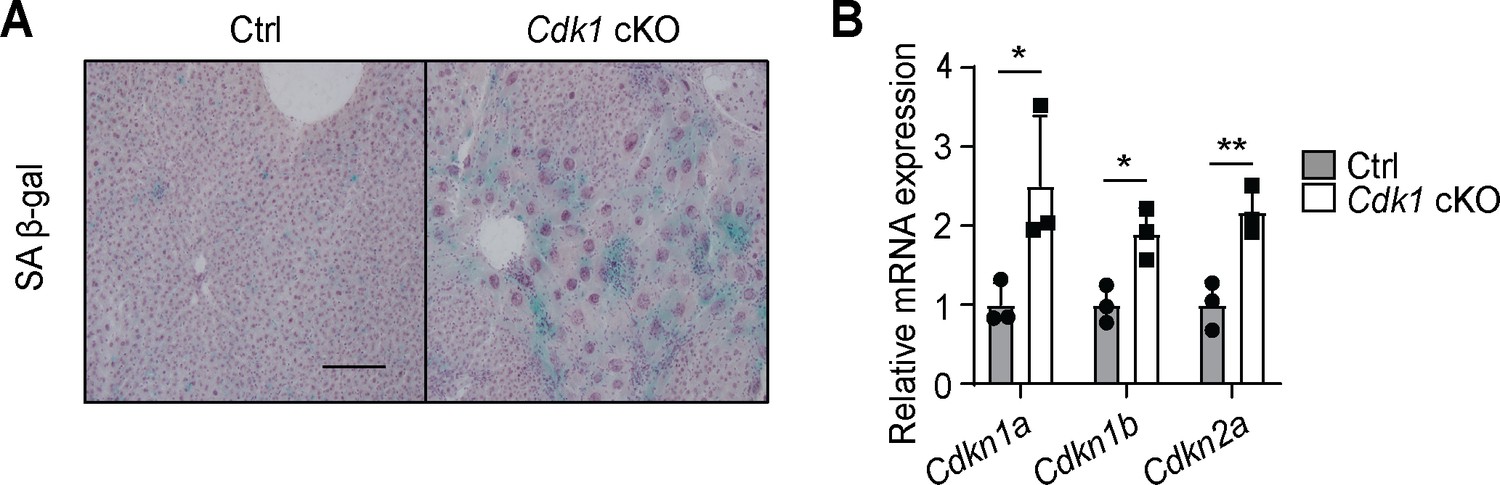
Senescence develops in young Cdk1 cKO mice.
(A) Representative image of senescence-associated β-galactosidase (SA β-gal) staining of liver sections from 8-week-old control (Ctrl) and Cdk1 cKO mice. Scale bar represents 50 µm. (B) qPCR for Cdkn1a [p21cip1/waf1], Cdkn1b [p27Kip1], and Cdkn2a [p16ink4a] in liver from 8-week-old Ctrl and Cdk1 cKO mice (n = 3 per genotype). Data is available in Supplementary file 10.
Tables
Key resources table
| Reagent type (species) or resource | Designation | Source or reference | Identifiers | Additional information |
|---|---|---|---|---|
| Gene (Mus musculus) | Cdk1 | NCBI Gene | ID:12534 | |
| Gene (Mus musculus) | Cpt2 | NCBI Gene | ID:12896 | |
| Gene (Mus musculus) | Foxo1 | NCBI Gene | ID:56458 | |
| Gene (Mus musculus) | Pnpla2 | NCBI Gene | ID:66853 | |
| Strain, strain background (Escherichia coli) | Stbl3 | Thermo Fisher Scientific | Cat#:C7373-03 | For cloning and maintaining lentiviral vectors |
| Genetic reagent (Mus musculus) | Alb-Cre | DOI: 10.1002/(sici)1526-968x(200002)26:2 < 149::aid-gene16 > 3.0.co;2 v | RRID:MGI:6258240 | Control to the Cdk1 cKO mice |
| Genetic reagent (Mus musculus) | Cdk1 cKO | DOI: 10.1073/pnas.1115201109 | RRID:MGI:5318109 | Hepatocyte-specific knockout of Cdk1 gene |
| Transfected construct (Mus musculus) | pLKO.1 | Addgene | Cat#:#8453; RRID:Addgene_10878 | Empty vector |
| Transfected construct (Mus musculus) | pLKO-shPnpla2 | This paper | Expression of shRNA against Pnpla2 (sequence: GGAGAGAACGTCATCATAT) | |
| Biological sample (Mus musculus, male) | Liver, subcutaneous WAT and epididymal WAT from Cdk1 cKO mice | This paper | Freshly isolated from 2-, -6, or 12-month-old Mus musculus | |
| Biological sample (Mus musculus, male) | Plasma from Cdk1 cKO mice | This paper | Freshly isolated from 2, 6, or 12 month old Mus musculus | |
| Antibody | Anti-ACADVL (Mouse monoclonal) | Santa Cruz Biotechnology | Cat#:sc-376239; RRID:AB_10989696 | WB (1:1000) |
| Antibody | Anti-AKT (Rabbit polyclonal) | Cell Signaling | Cat#:#9272; RRID:AB_329827 | WB (1:2000) |
| Antibody | Anti-pT308-AKT (Rabbit polyclonal) | Cell Signaling | Cat#:#9275; RRID:AB_329829 | WB (1:500) |
| Antibody | Anti-ATGL (Mouse monoclonal) | Santa Cruz Biotechnology | Cat#:sc-365278; RRID:AB_10859044 | WB (1:2000) |
| Antibody | Anti-CPT2 (Rabbit polyclonal) | Proteintech | Cat#:26555–1-AP; RRID:AB_2880551 | IP (2 µL per 500 µg protein), WB (1:2000) |
| Antibody | Anti-FOXO1 (Rabbit monoclonal) | Cell Signaling | Cat#:#2880; RRID:AB_2106495 | ChIP (2 µL per 10 µg chromatin), WB (1:1000) |
| Antibody | Anti-HADHA (Mouse monoclonal) | Santa Cruz Biotechnology | Cat#:sc-374497; RRID:AB_10987868 | WB (1:500) |
| Antibody | Anti-HSP90 (Mouse monoclonal) | BD Transduction Laboratories | Cat#:610418; RRID:AB_397798 | WB (1:10,000) |
| Antibody | Anti-INSRB (Rabbit polyclonal) | Santa Cruz Biotechnology | Cat#:sc-711; RRID:AB_631835 | WB (1:2000) |
| Antibody | Anti-pY1151/1152-INSRB (Mouse monoclonal) | Santa Cruz Biotechnology | Cat#:sc-81500; RRID:AB_1125642 | WB (1:500) |
| Antibody | Anti-LXRα (Mouse monoclonal) | Abcam | Cat#:ab41902; RRID:AB_776094 | ChIP (2 µL per 10 µg chromatin) |
| Antibody | Anti-pan-acetylation (Mouse monoclonal) | Proteintech | Cat#:66289–1-Ig; RRID:AB_2881672 | WB (1:1000) |
| Antibody | Anti-phospho-Ser/Thr (Rabbit polyclonal) | Abcam | Cat#:ab117253; RRID:AB_10903259 | WB (1:4000) |
| Antibody | Anti-SIRT3 (Rabbit monoclonal) | Cell Signaling | Cat#:#5490; RRID:AB_10828246 | IP (2 µL per 500 µg protein), WB (1:2000) |
| Antibody | Anti-SREBP1c (Rabbit polyclonal) | Abcam | Cat#:ab28481; RRID:AB_778069 | WB (1:1000) |
| Peptide, recombinant protein | Actrapid, fast-acting insulin | Novo Nordisk | ||
| Peptide, recombinant protein | rDNase | Macherey-Nagel | Cat#:740963 | |
| Commercial assay or kit | Triglyceride Assay Kit | Abcam | Cat#:ab65336 | |
| Commercial assay or kit | HDL and LDL/VLDL Cholesterol Assay Kit | Abcam | Cat#:ab65390 | |
| Commercial assay or kit | Free Fatty Acid Assay Kit | Cell Biolabs | Cat#:STA-618 | |
| Commercial assay or kit | β-Hydroxybutyrate (Ketone Body) Colorimetric Assay Kit | Cayman Chemicals | Cat#:700190 | |
| Commercial assay or kit | Ultra Sensitive Mouse Insulin ELISA Kit | Crystal Chem | Cat#:90080 | |
| Commercial assay or kit | Glycogen Assay Kit | Abcam | Cat#:ab83369 | |
| Commercial assay or kit | Fatty Acid Oxidation Assay Kit | Abcam | Cat#:ab217602 | |
| Commercial assay or kit | Extracellular Oxygen Consumption Assay Kit | Abcam | Cat#:ab197243 | |
| Commercial assay or kit | Maxima First Strand cDNA Synthesis Kit | Thermo Fisher Scientific | Cat#:K1641 | |
| Commercial assay or kit | Maxima SYBR Green qPCR Master Mix | Thermo Fisher Scientific | Cat#:K0221 | |
| Commercial assay or kit | PureLink RNA Mini Kit | Thermo Fisher Scientific | Cat#:12183025 | |
| Commercial assay or kit | Oxidized Protein Western Blot Detection Kit | Abcam | Cat#: ab178020 | |
| Chemical compound, drug | N-acetylcysteine | Sigma-Aldrich | Cat#:A7250 | |
| Software, algorithm | GraphPad Prism | GraphPad | RRID:SCR_002798 | Version 6 |
| Software, algorithm | STAR-mapper | DOI: 10.1093/bioinformatics/bts635 | For RNA-seq analysis | |
| Software, algorithm | RSEM | DOI:10.1186/1471-2105-12-323 | RRID:SCR_013027 | For RNA-seq analysis |
| Software, algorithm | ClustVis | DOI:10.1093/nar/gkv468 | RRID:SCR_017133 | For RNA-seq analysis |
| Software, algorithm | Enrichr | DOI:10.1093/nar/gkw377 | RRID:SCR_001575 | For RNA-seq analysis |
| Software, algorithm | MetaboKit | DOI:10.1039/d0mo00030b | For untargeted metabolomics analysis | |
| Other | Accu-Chek Performa Nano | Accu-Chek | Blood glucose meter | |
| Other | Accu-Chek test strips | Accu-Chek | Code 222 | Test strips for blood glucose meter |
Additional files
-
Supplementary file 1
Lipidomics analysis of liver of 8-week-old control and Cdk1 cKO mice.
- https://cdn.elifesciences.org/articles/63835/elife-63835-supp1-v3.xlsx
-
Supplementary file 2
Lipidomics analysis of hepatocytes isolated from 8-week-old control and Cdk1 cKO mice.
- https://cdn.elifesciences.org/articles/63835/elife-63835-supp2-v3.xlsx
-
Supplementary file 3
Free fatty acid analysis of plasma from 8-week-old control and Cdk1 cKO mice.
- https://cdn.elifesciences.org/articles/63835/elife-63835-supp3-v3.xlsx
-
Supplementary file 4
Histopathological scoring of H and E liver sections from 12-month-old control and Cdk1 cKO mice.
- https://cdn.elifesciences.org/articles/63835/elife-63835-supp4-v3.xlsx
-
Supplementary file 5
Lipidomics analysis of liver of 12-month-old control and Cdk1 cKO mice.
- https://cdn.elifesciences.org/articles/63835/elife-63835-supp5-v3.xlsx
-
Supplementary file 6
List of total detected and differentially expressed genes from RNA-seq data from liver of 12-month-old control and Cdk1 cKO mice.
- https://cdn.elifesciences.org/articles/63835/elife-63835-supp6-v3.xlsx
-
Supplementary file 7
List of KEGG terms for up- and downregulated differentially expressed genes and list of transcription factors from ChIP enrichment analysis.
- https://cdn.elifesciences.org/articles/63835/elife-63835-supp7-v3.xlsx
-
Supplementary file 8
MRM list for mass spectrometry lipidomics analysis.
- https://cdn.elifesciences.org/articles/63835/elife-63835-supp8-v3.xlsx
-
Supplementary file 9
List of primers used for qPCR.
- https://cdn.elifesciences.org/articles/63835/elife-63835-supp9-v3.xlsx
-
Supplementary file 10
Source data used for all figures.
- https://cdn.elifesciences.org/articles/63835/elife-63835-supp10-v3.xlsx
-
Transparent reporting form
- https://cdn.elifesciences.org/articles/63835/elife-63835-transrepform-v3.docx
Download links
A two-part list of links to download the article, or parts of the article, in various formats.
Downloads (link to download the article as PDF)
Open citations (links to open the citations from this article in various online reference manager services)
Cite this article (links to download the citations from this article in formats compatible with various reference manager tools)
Remodeling of whole-body lipid metabolism and a diabetic-like phenotype caused by loss of CDK1 and hepatocyte division
eLife 9:e63835.
https://doi.org/10.7554/eLife.63835


