Psychosocial experiences modulate asthma-associated genes through gene-environment interactions
- Center for Molecular Medicine and Genetics, Wayne State University, United States
- Department of Psychology, Miami University, United States
- Department of Biostatistics, University of Michigan, United States
- College of Public Health, University of South Florida, United States
- Department of Psychology, Wayne State University, United States
- Department of Family Medicine and Public Health Sciences, Wayne State University, United States
- Department of Obstetrics and Gynecology, Wayne State University, United States
Figures
Figure 1 with 8 supplements

Transcriptional signatures of psychosocial experiences and asthma symptoms.
(a) Central hypothesis. (b) Number of genes in elastic net regression models that explain at least 1% of variance. Colors represent different categories of variables. (c) Pearson’s correlations between cross-validated transcriptional signatures and measured variables for elastic net regression models that explain at least 1% of variance. (d) Forced expiratory volume in one second [FEV1] percent predicted transcriptional signature model fit (Pearson’s rho = 0.76, p<0.001). (e) MacArthur socioeconomic status transcriptional signature model fit (Pearson’s rho = 0.67, p<0.001). (f) Longitudinal change in observed neutrophils (x axis) and longitudinal change in transcriptional signature of neutrophils (y axis) (Pearson’s rho = 0.72, p<0.001, gray = identity line).
-
Figure 1—source data 1
GLMnet model weights for the transcriptional signatures.
The transcriptional signatures are in columns, while the genes are in rows.
- https://cdn.elifesciences.org/articles/63852/elife-63852-fig1-data1-v3.txt
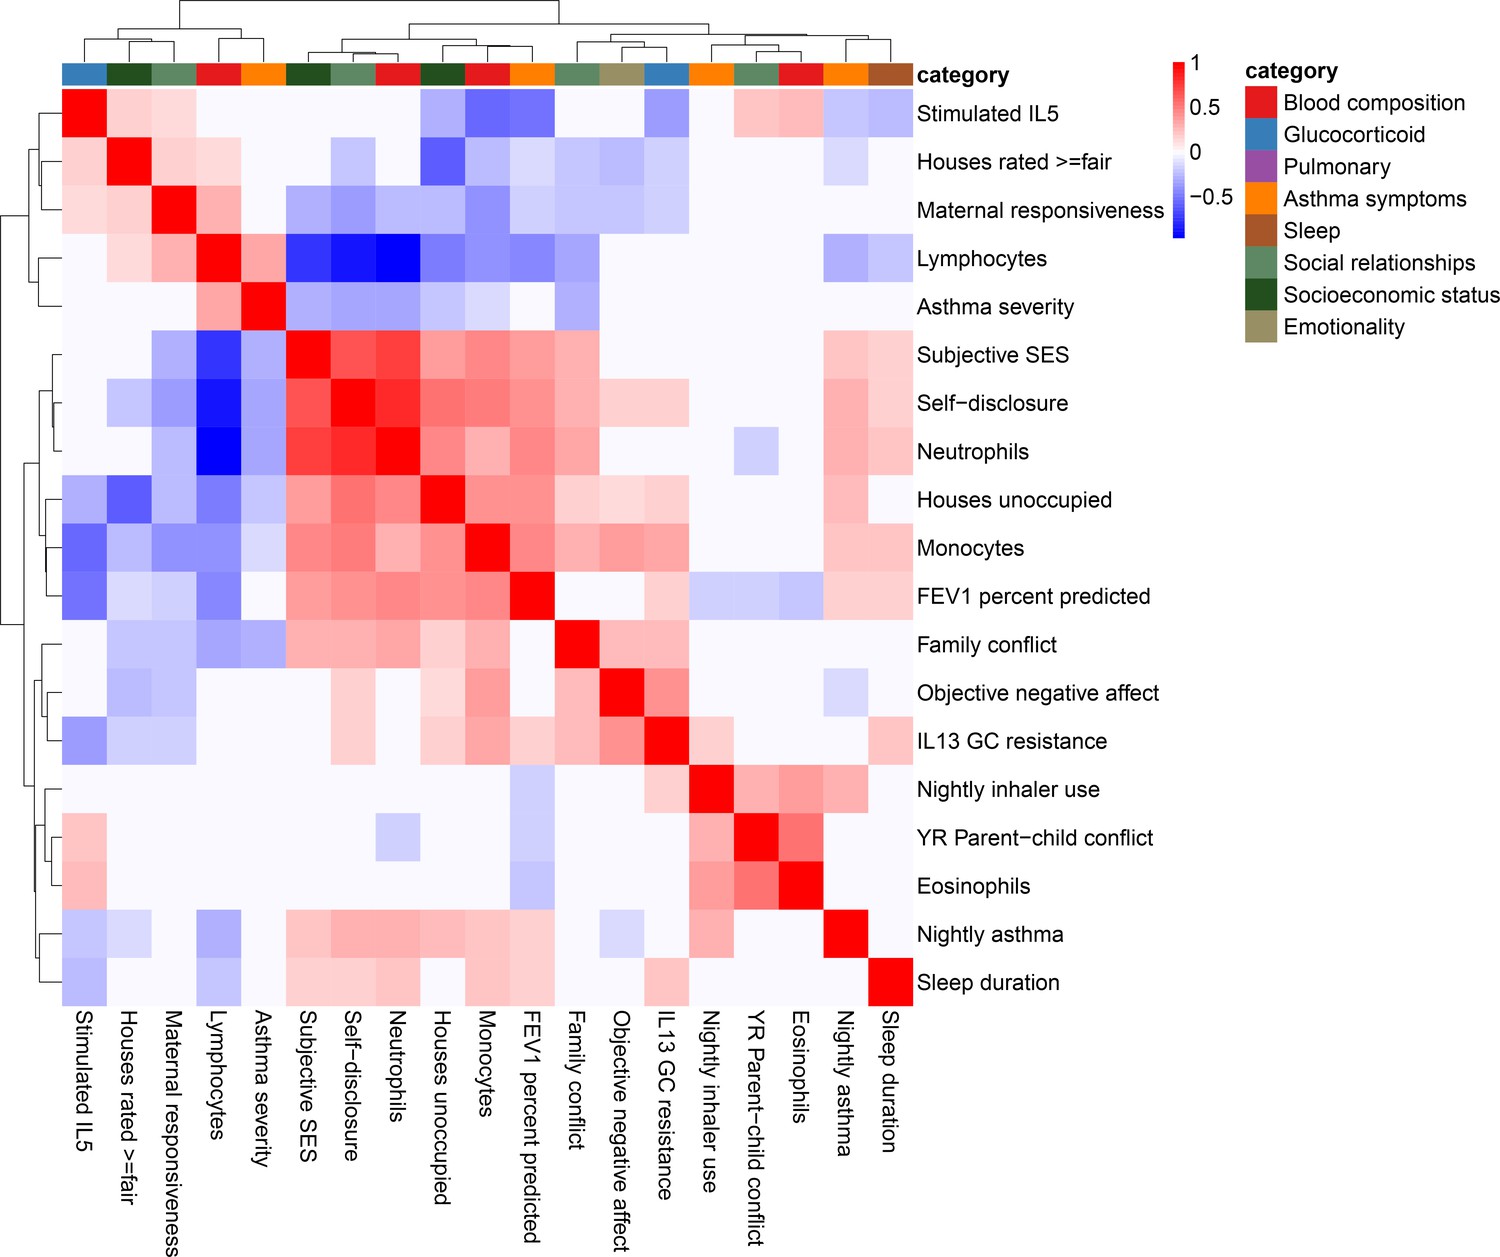
Figure 1—figure supplement 1
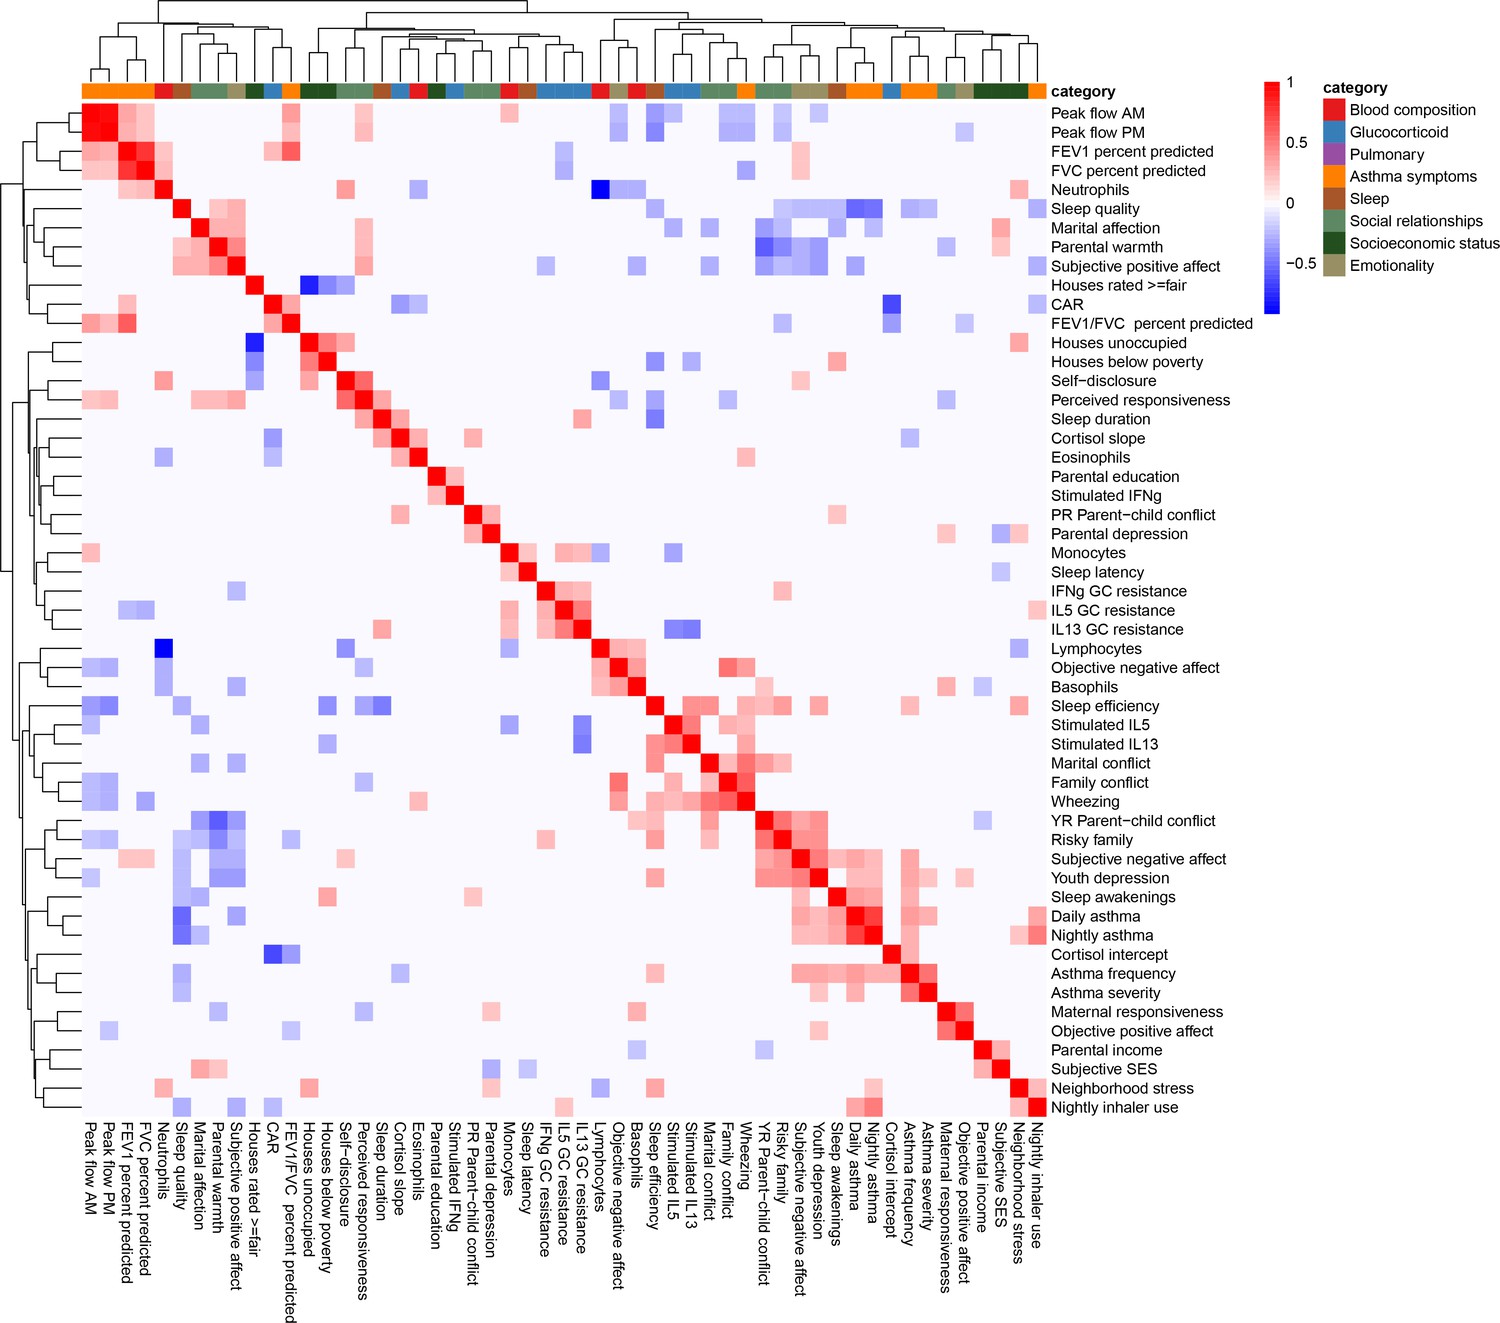
Clustered heatmap of (Pearson) correlations between all variables used in the study.
Color indicates the strength and direction of correlation; white indicates p-value>0.05. Hierarchical clustering is represented on the top and side of the heatmap. Variables are grouped by colors indicating the different categories considered.
Figure 1—figure supplement 2
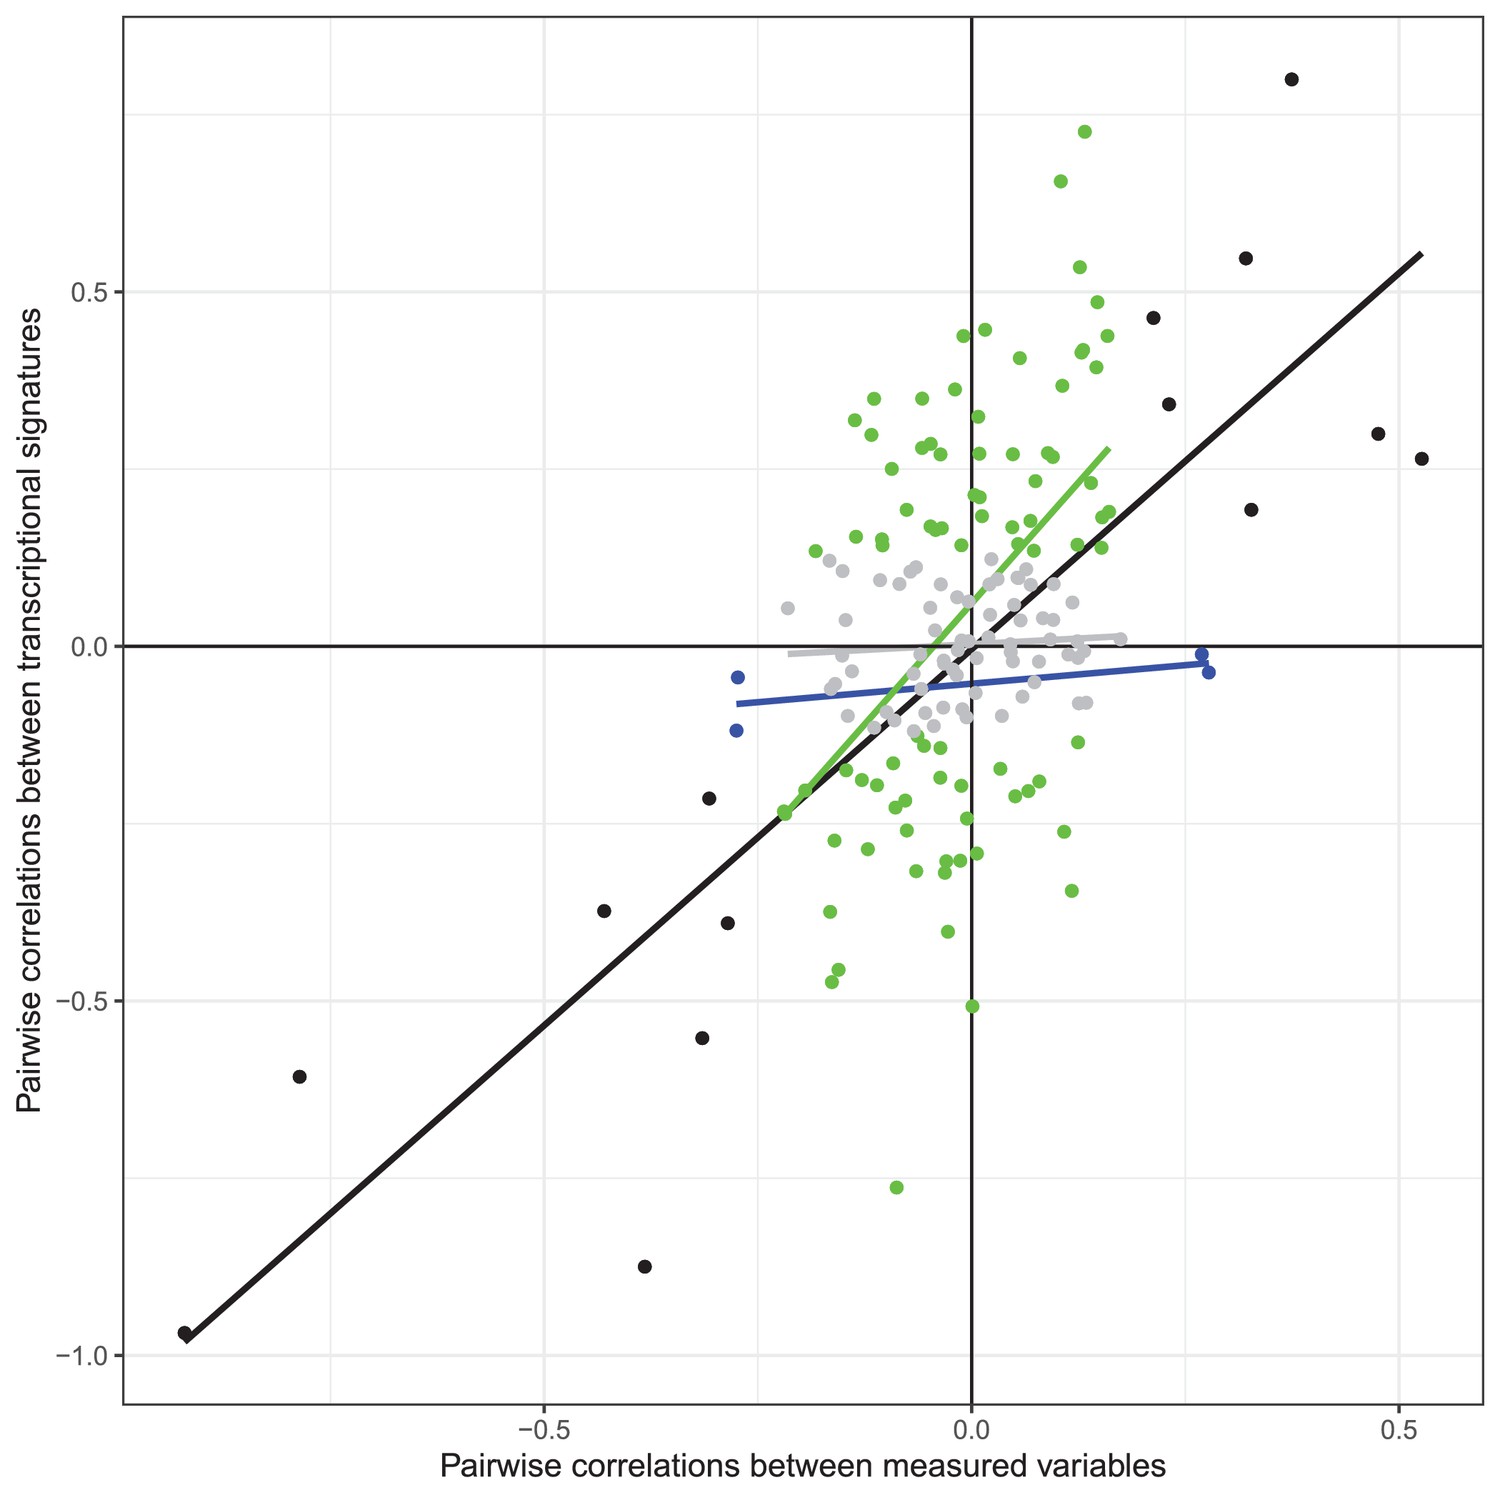
Scatterplot of Pearson's correlation coefficients between each pair of observed variables (x axis) and metagenes (y axis) for the 19 variables with transcriptional signatures explaining >1% of observed variance.
Color represents significance of the correlation (gray: nonsignificant correlations in observed variables or metagenes; blue: significant correlation between observed variables only; green: significant correlation between transcriptional signatures only; black: correlation significant in both observed variables and metagenes).
Figure 1—figure supplement 3
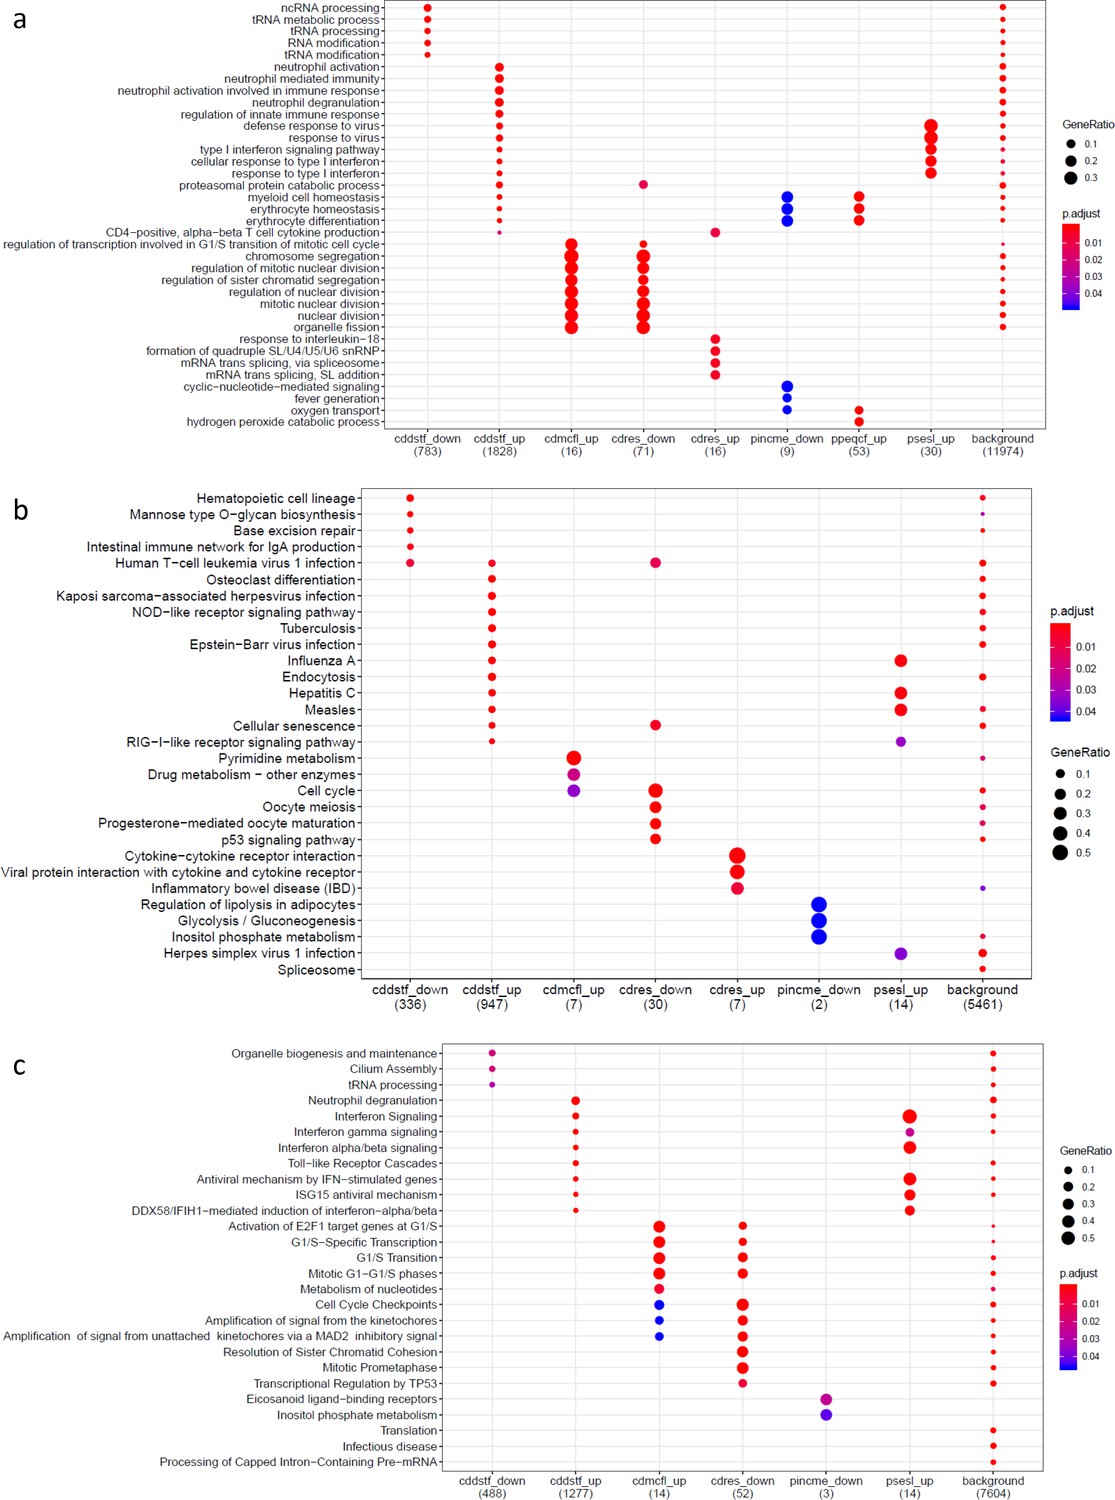
Gene set enrichment analysis results on genes differentially expressed for psychosocial experiences.
(a) Gene Ontology, (b) Kyoto Encyclopedia of Genes and Genomes, and (c) Reactome Pathway Database. Variable symbols: cddstf: self-disclosure; cdmcfl: child-reported conflict with mother; cdres: perceived responsiveness; pincme: parent’s income; ppeqcf: parent-reported conflict with child; psesl: subjective socioeconomic status. Down denotes downregulated genes, up denotes upregulated genes.
Figure 1—figure supplement 4
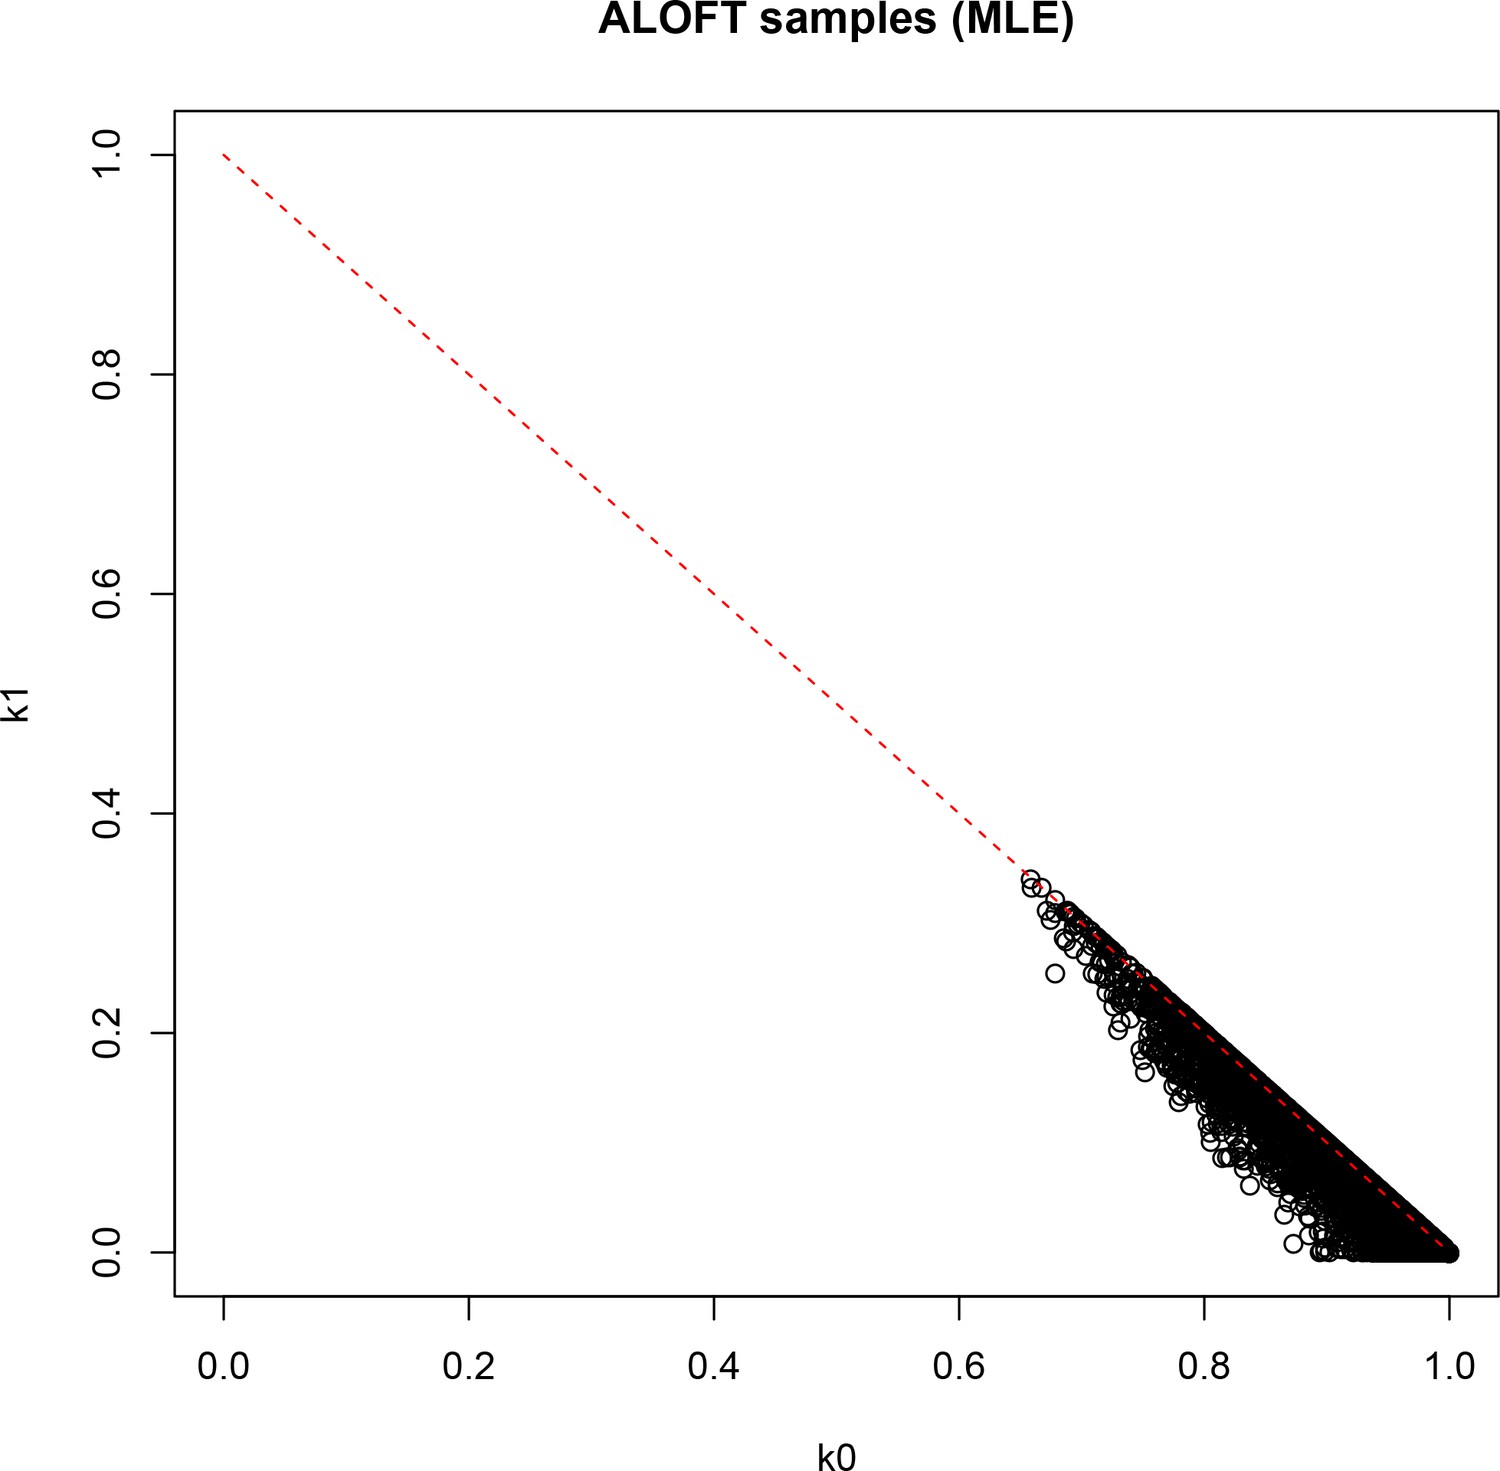
Result of identity-by-descent analysis (IBD; maximum likelihood estimation [MLE]) on DNA-derived genotypes for all 251 participants.
k0: probability of sharing zero alleles IBD; k1: probability of sharing one allele IBD.
Figure 1—figure supplement 5
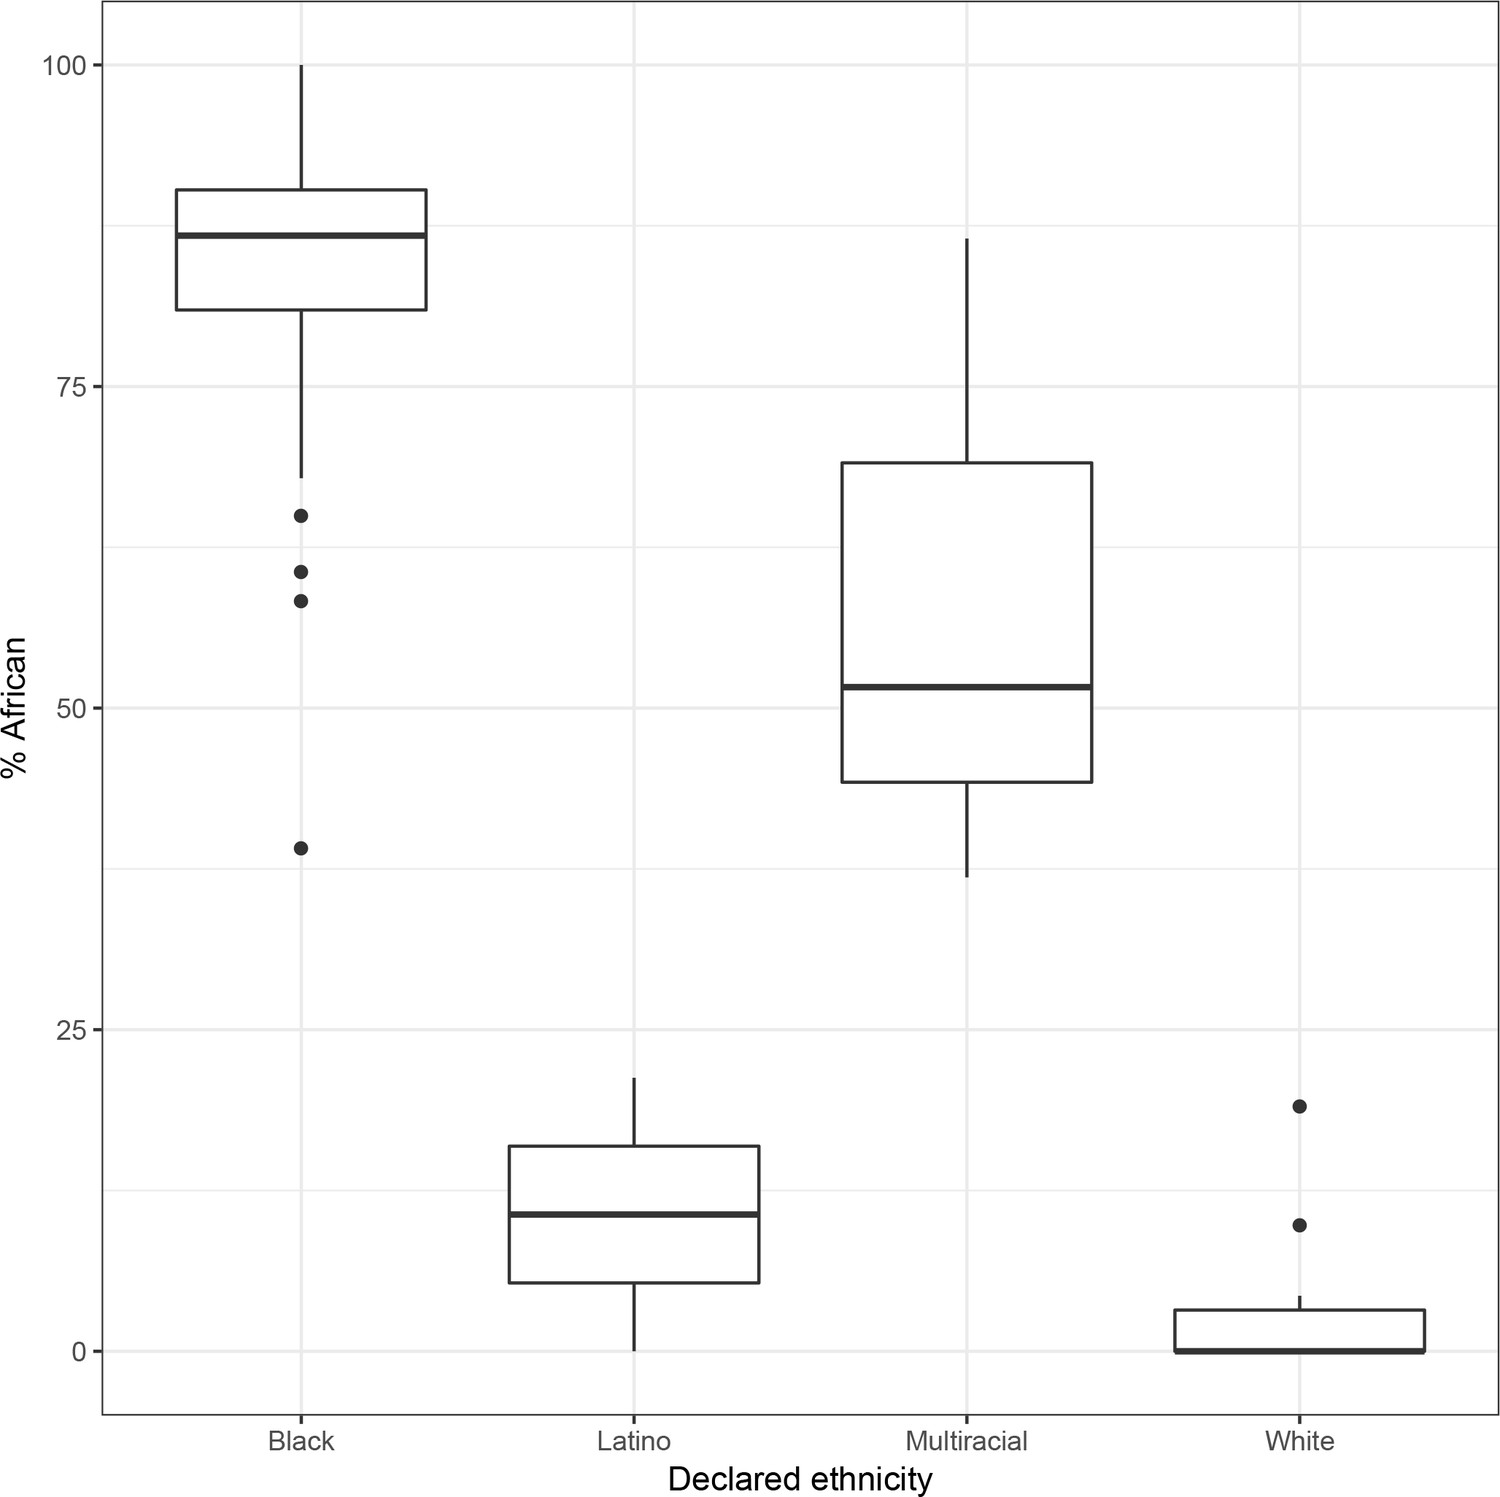
Self-reported ethnicity (x axis) vs. percent global African ancestry (y axis) in 119 participants for whom declared ethnicity is available.
Figure 1—figure supplement 6
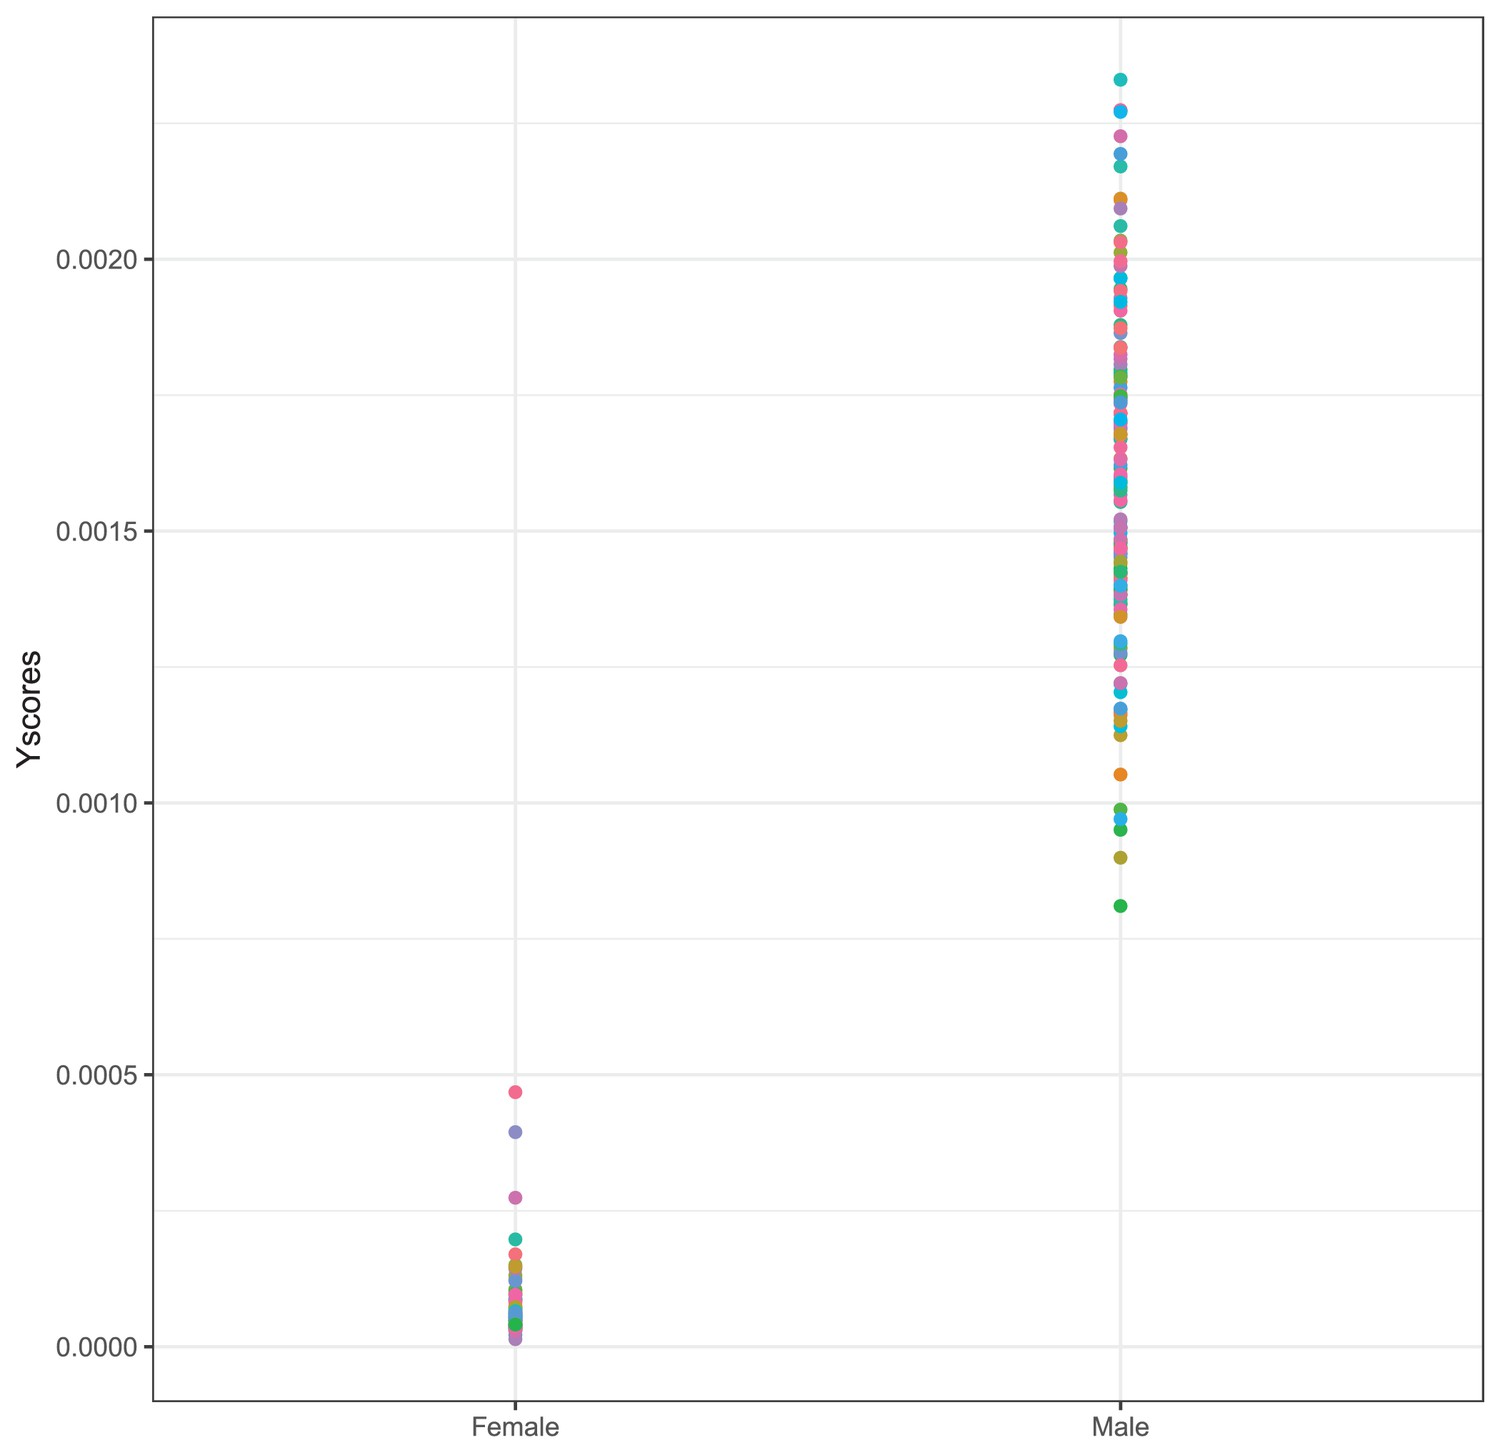
Proportion of reads mapping to the Y chromosome over all mapped reads separately for self-reported females and males.
Each dot is one sample.
Figure 1—figure supplement 7
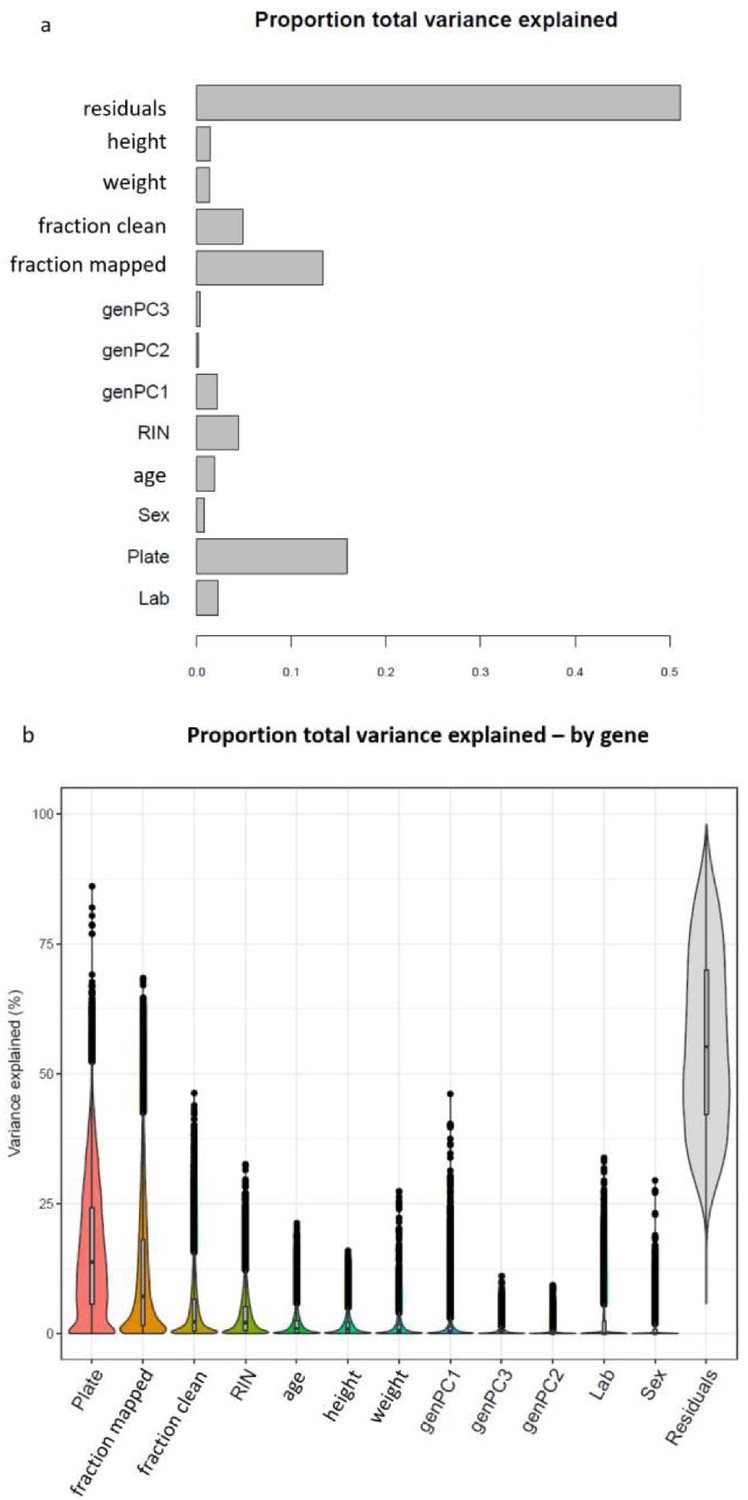
Sources of variation in gene expression data.
(a) Proportion of global variance in gene expression explained by each covariate tested within a single linear model. (b) Proportion of variance explained by each covariate for each analyzed gene.
Figure 1—figure supplement 8
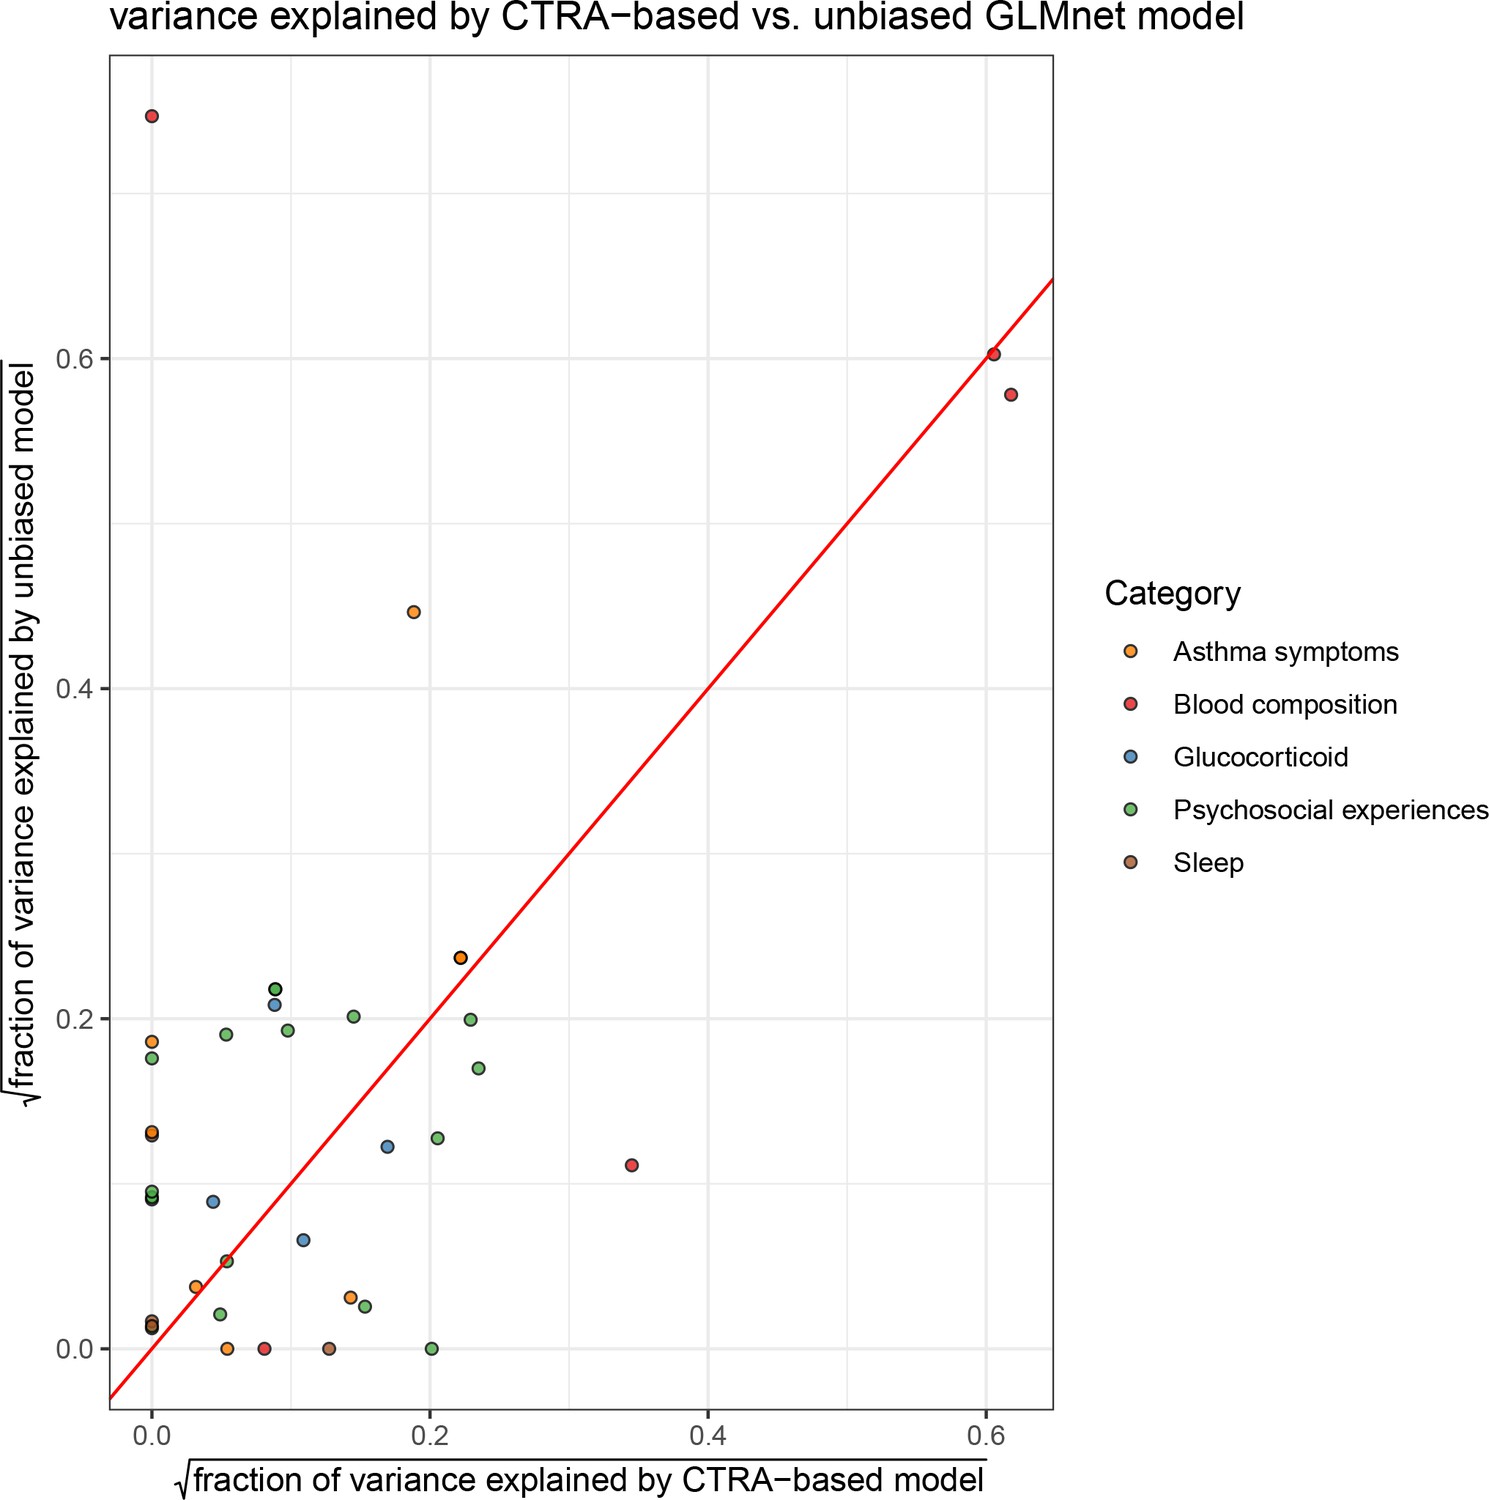
Comparison of variance explained by conserved transcriptional response to adversity (CTRA)-based (x axis) and unbiased (y axis) elastic net prediction models; color indicates type of variable (red = identity line).
Figure 2 with 2 supplements
Correlation among psychosocial and clinical transcriptional signatures.
Heatmap of Pearson’s correlations between transcriptional signatures explaining at least 1% of variance. Heatmap color indicates strength and direction of correlation; white indicates p-value>0.05. Hierarchical clustering of variables is represented above the heatmap, with colors indicating categories for each variable as indicated in the legend.
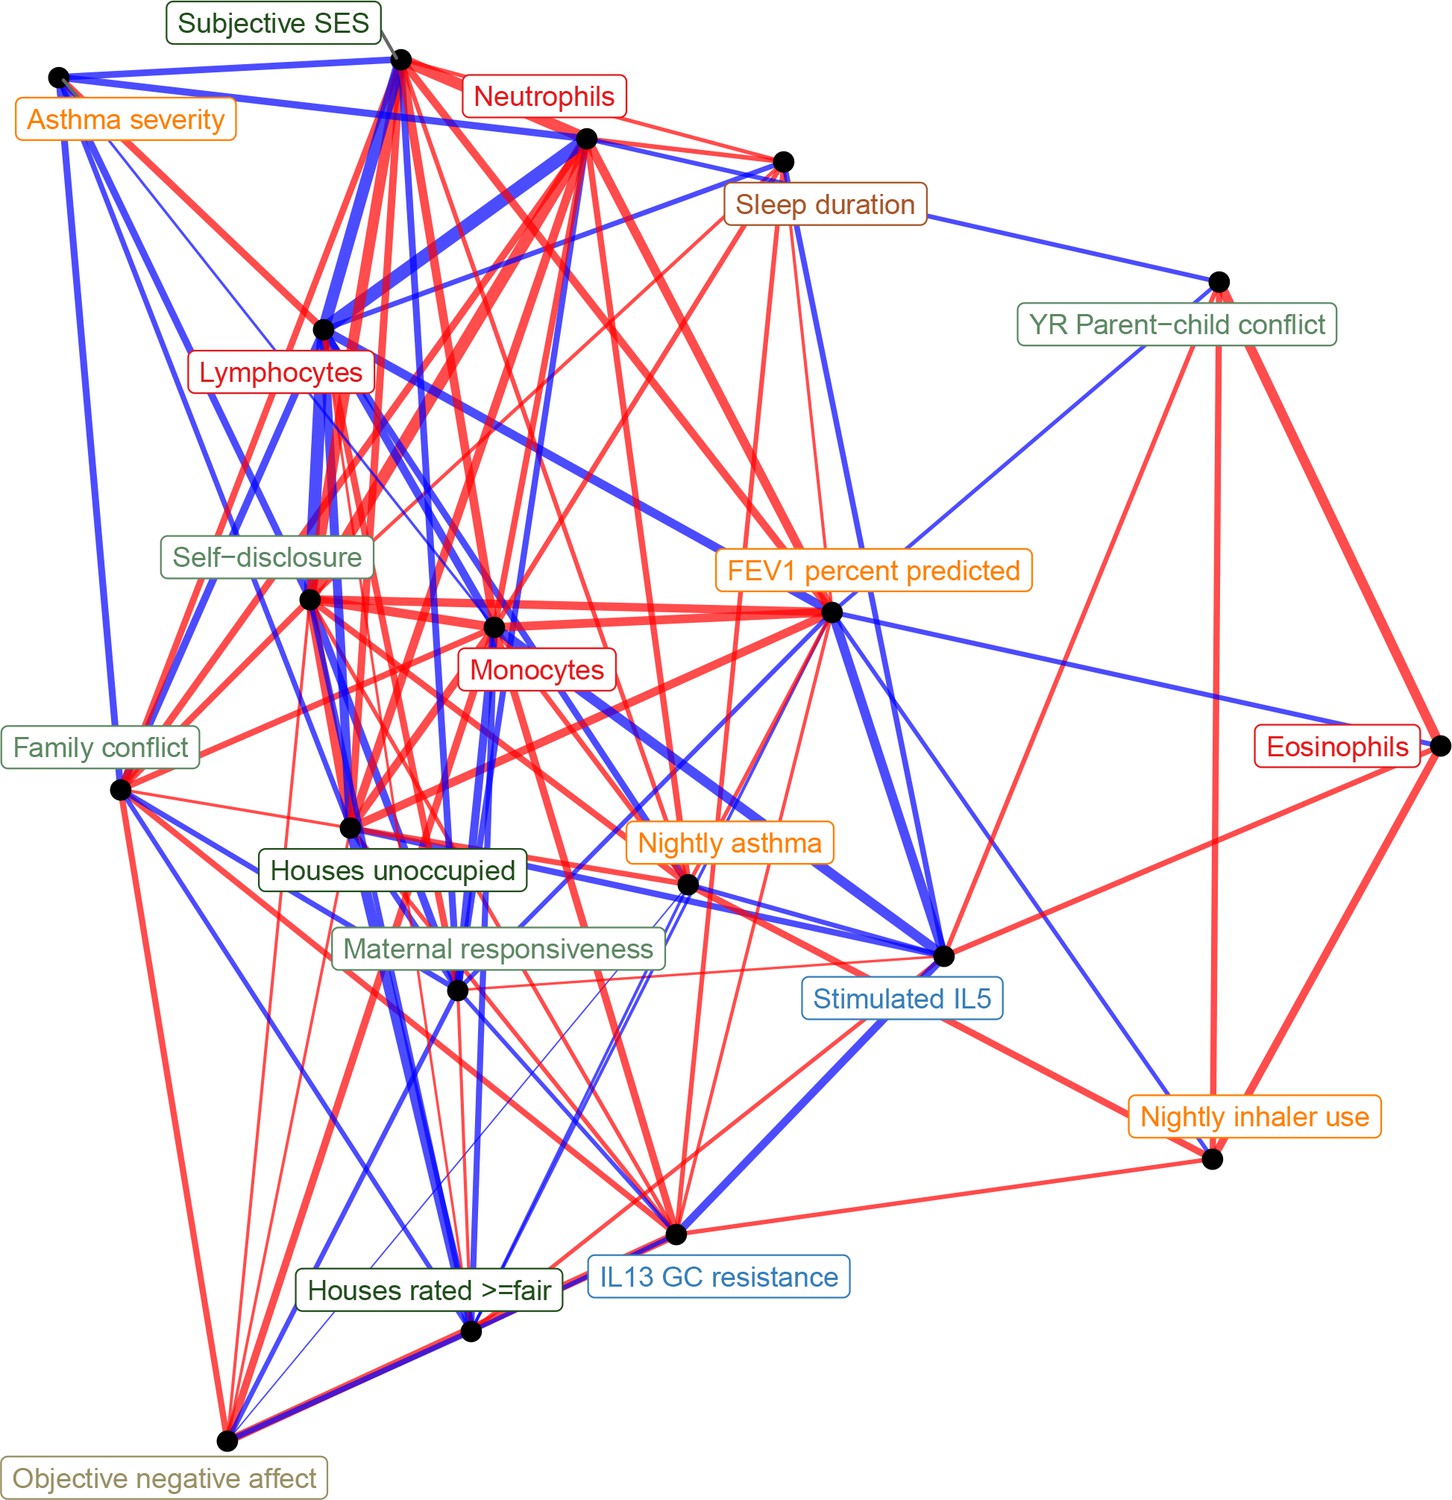
Figure 2—figure supplement 1

Network representation of correlations between transcriptional signatures of psychosocial experiences (edge width reflects absolute value of Pearson's correlation score, edge color reflects positive [red] or negative [blue] correlation).
Figure 2—figure supplement 2
Network representation of correlations between all transcriptional signatures (edge width reflects absolute value of Pearson's correlation score, edge color reflects positive [red] or negative [blue] correlation).
Figure 3 with 5 supplements
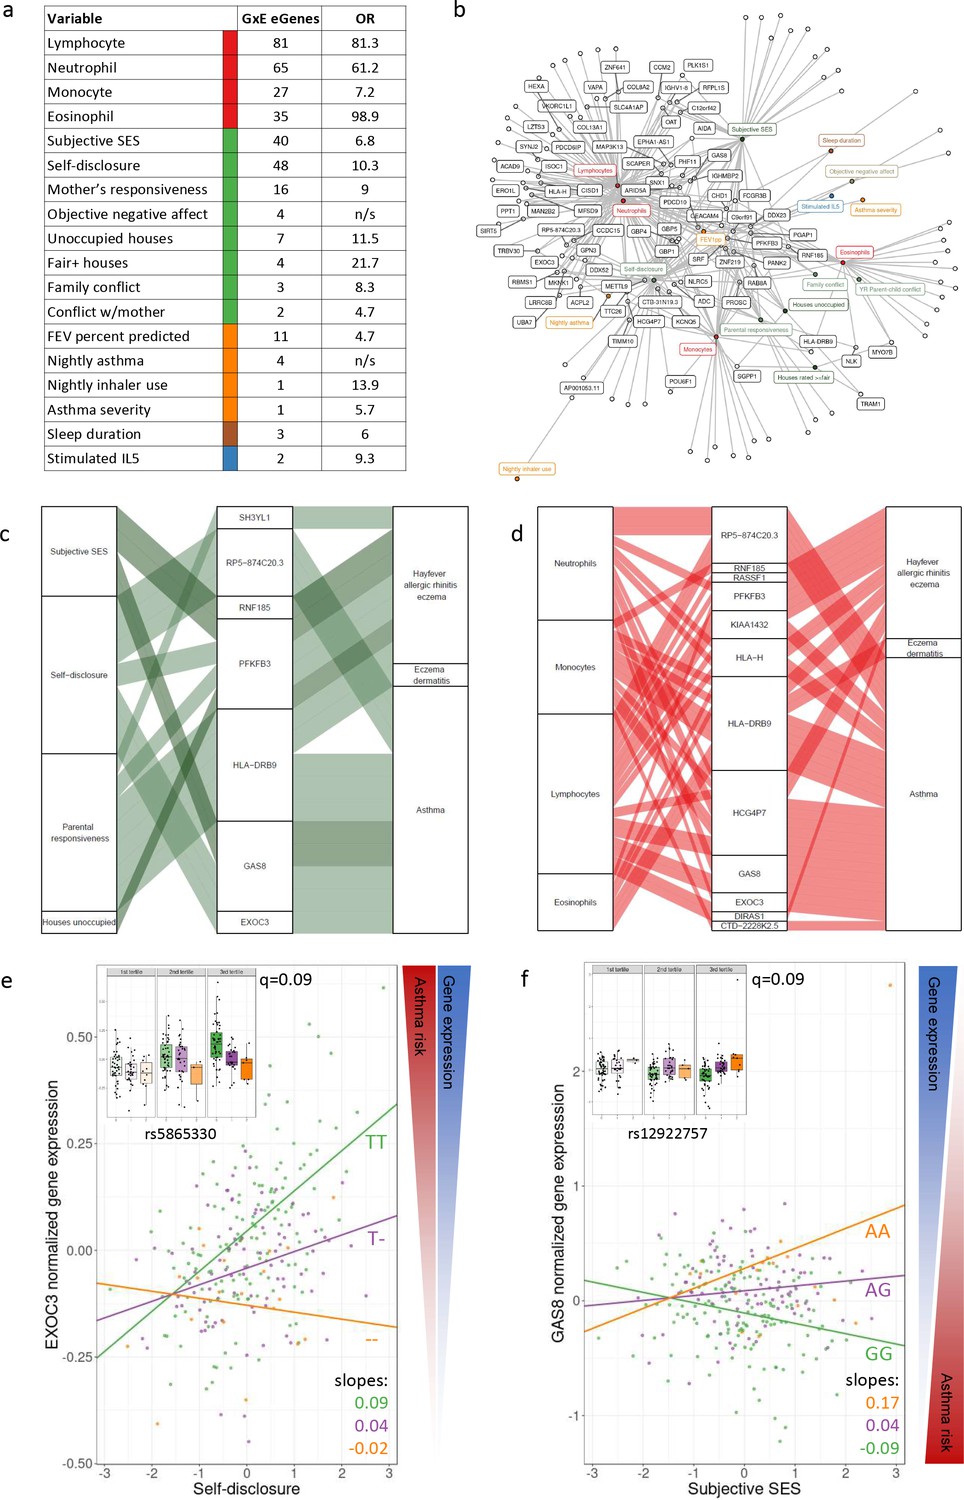
GxE effects on gene expression and asthma risk.
(a) Interaction expression quantitative trait locus (eQTL) results. GxE genes: number of significant GxE interactions with transcriptional signatures at 10% FDR; OR: odds ratio of enrichment of GxE genes with measured variable (p<0.01) in GxE genes with transcriptional signatures (p<0.01). (b) Network of interactions between environments and eGenes. Each node represents an eGene with an interaction eQTL (black) or a variable that modulates the genetic effect on gene expression. Only nodes with at least two interactions are labeled. Edges represent significant interaction eQTLs (10% FDR). (c, d) Causal gene-complex trait interactions identified through transcriptome-wide association studies (TWAS) are modulated by psychosocial experiences. Psychosocial variables (c) or blood composition (d) are in the left column, eGenes in the central column and complex traits in the right column. A connecting line represents either a causal link between eGene and asthma or allergic disease trait identified through TWAS (middle to right) or a significant interaction eQTL (left to middle). (e, f) Examples of genes causally associated with asthma and with GxE effects that modulate genetic risk. Both genes are causally associated with asthma in TWAS. Each dot is an individual. The same data are presented in the inset and main figure within each panel. In the main figure, the trend lines represent the best model fit between the psychosocial variable and gene expression for each genotype class. The slope of each line and the q-value for the GxE effect are also reported. The boxplot in the inset represents the same normalized gene expression data across the three tertiles of the psychosocial variable.
-
Figure 3—source data 1
Results of cis-expression quantitative trait locus (cis-eQTL) mapping permutation pass with FastQTL correcting for top 18 gene expression principal components [PCs] (space-delimited file).
Columns are as follows. 1: Ensembl ID of the tested gene; 2: number of variants tested in cis for this gene; 3: maximum likelihood estimation (MLE) of the shape1 parameter of the beta distribution; 4: MLE of the shape2 parameter of the beta distribution; 5: dummy; 6: ID of the best variant found for this molecular phenotypes (i.e., with the smallest p-value); 7: distance between the molecular phenotype-variant pair; 8: the nominal p-value of association that quantifies how significant from 0, the regression coefficient is; 9: the slope associated with the nominal p-value of association; 10: a first permutation p-value directly obtained from the permutations with the direct method (corrected nominal p-value that accounts for the fact that multiple variants are tested per molecular phenotype); 11: a second permutation p-value obtained via beta approximation (used to calculate FDR).
- https://cdn.elifesciences.org/articles/63852/elife-63852-fig3-data1-v3.txt
-
Figure 3—source data 2
Results of cis-expression quantitative trait locus (cis-eQTL) mapping permutation pass with FastQTL without correction for gene expression principal components [PCs] (space-delimited file).
Columns are as follows. 1: Ensembl ID of the tested gene; 2: number of variants tested in cis for this gene; 3: maximum likelihood estimation (MLE) of the shape1 parameter of the beta distribution; 4: MLE of the shape2 parameter of the beta distribution; 5: dummy; 6: ID of the best variant found for this molecular phenotypes (i.e., with the smallest p-value); 7: distance between the molecular phenotype-variant pair; 8: the nominal p-value of association that quantifies how significant from 0, the regression coefficient is; 9: the slope associated with the nominal p-value of association; 10: a first permutation p-value directly obtained from the permutations with the direct method (corrected nominal p-value that accounts for the fact that multiple variants are tested per molecular phenotype); 11: a second permutation p-value obtained via beta approximation (used to calculate FDR).
- https://cdn.elifesciences.org/articles/63852/elife-63852-fig3-data2-v3.txt
-
Figure 3—source data 3
Overlap of eGenes with psychosocial effects and significant probabilistic transcriptome-wide association studies (PTWAS) association results (5% FDR) for asthma and allergic disease.
Columns are as follows. 1: GWAS trait tested in PTWAS; 2: Ensembl ID of the tested gene; 3: most significant tissue in PTWAS; 4: multitissue PTWAS p-value; 5–24: as in Figure 3—source data 4.
- https://cdn.elifesciences.org/articles/63852/elife-63852-fig3-data3-v3.txt
-
Figure 3—source data 4
Results of cis-interaction-expression quantitative trait locus (eQTL) mapping (tab-delimited file).
Columns are as follows. 1: Ensembl ID of the tested gene; 2: ID of the tested variant; 3: p-value of the GxE model intercept; 4: p-value of the genotype dosage effect; 5: p-value of the transcriptional signature effect; 6: p-value of the interaction between genotype dosage and transcriptional signature effect; 7: intercept; 8: dosage effect; 9: transcriptional signature effect; 10: interaction between genotype dosage and transcriptional signature effect; 11: intercept standard error (SE); 12: genotype dosage effect SE; 13: transcriptional signature effect SE; 14: interaction between genotype dosage and transcriptional signature effect SE; 15: q-value of the GxE model intercept; 16: q-value of the genotype dosage effect; 17: q-value of the transcriptional signature effect; 18: q-value of the interaction between genotype dosage and transcriptional signature effect; 19: tested transcriptional signature; 20: permutation-corrected p-value of the interaction between genotype dosage and transcriptional signature effect; 21: q-value of the permutation-corrected p-value of the interaction between genotype dosage and transcriptional signature effect.
- https://cdn.elifesciences.org/articles/63852/elife-63852-fig3-data4-v3.txt
-
Figure 3—source data 5
Overlap of GxE interactions and significant probabilistic transcriptome-wide association studies (PTWAS) association results (5% FDR).
Columns as in Figure 3—source data 3.
- https://cdn.elifesciences.org/articles/63852/elife-63852-fig3-data5-v3.txt
-
Figure 3—source data 6
Results of cis-interaction-expression quantitative trait locus (eQTL) mapping after correcting for cell composition effects (tab-delimited file).
Columns as in Figure 3—source data 4.
- https://cdn.elifesciences.org/articles/63852/elife-63852-fig3-data6-v3.txt
-
Figure 3—source data 7
Results of cis-interaction-expression quantitative trait locus (eQTL) mapping with measured variables (tab-delimited file).
Columns as in Figure 3—source data 4.
- https://cdn.elifesciences.org/articles/63852/elife-63852-fig3-data7-v3.txt
Figure 3—figure supplement 1

QQplots of expression quantitative trait locus (eQTL)-transcriptional signature interaction test permutation-corrected p-values, combined for blood composition (top) and psychosocial variables (bottom).
Color indicates whether the equivalent interaction test with observed variable was nominally significant (p-corrected <0.01, coral) or not significant (p-corrected >0.01, black).
Figure 3—figure supplement 2
Genetic variants interact with psychosocial environments to alter expression of genes linked to asthma and allergic disease.
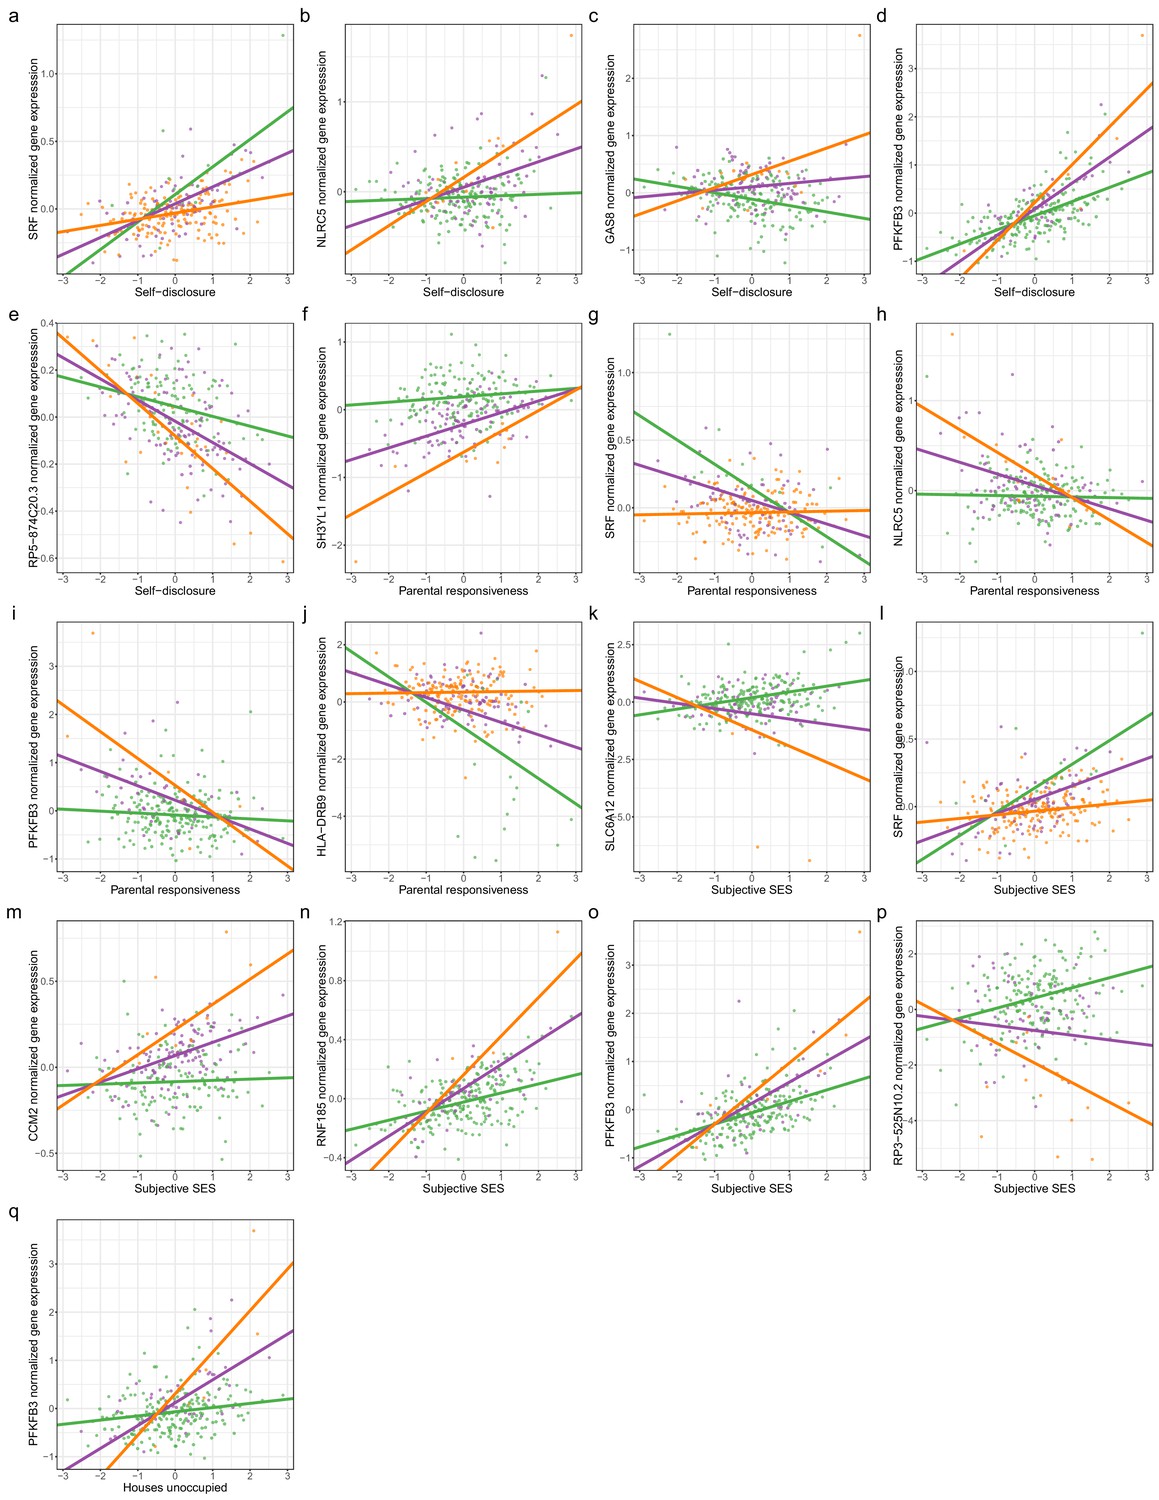
Scatterplots depict the following. (a) Self-disclosure interacts with expression quantitative trait locus (eQTL) rs6458333:G:C to alter expression of SRF. (b) Self-disclosure interacts with eQTL rs7203263:C:G to alter expression of NLRC5. (c) Self-disclosure interacts with eQTL rs12922757:G:A to alter expression of GAS8. (d) Self-disclosure interacts with eQTL rs5015567:G:A to alter expression of PFKFB3. (e) Self-disclosure interacts with eQTL rs200494:T:G to alter expression of RP5-874C20.3. (f) Objective maternal responsiveness interacts with eQTL rs17713729:A:C to alter expression of SH3YL1. (g) Objective maternal responsiveness interacts with eQTL rs6458333:G:C to alter expression of SRF. (h) Objective maternal responsiveness interacts with eQTL rs7203263:C:G to alter expression of NLRC5. (i) Objective maternal responsiveness interacts with eQTL rs5015567:G:A to alter expression of PFKFB3. (j) Objective maternal responsiveness interacts with eQTL rs9269774:G:A to alter expression of HLA-DRB9. (k) Socioeconomic status interacts with eQTL rs12424772:A:T to alter expression of SLC6A12. (l) Socioeconomic status interacts with eQTL rs6458333:G:C to alter expression of SRF. (m) Socioeconomic status interacts with eQTL rs7788412:A:G to alter expression of CCM2. (n) Socioeconomic status interacts with eQTL rs36123367:AT:A to alter expression of RNF185. (o) Socioeconomic status interacts with eQTL rs5015567:G:A to alter expression of PFKFB3. (p) Socioeconomic status interacts with eQTL rs12194992:G:A to alter expression of RP3-525N10.2. (q) Percent houses unoccupied interacts with eQTL rs5015567:G:A to alter expression of PFKFB3. Colors signify the genotype class. Green: homozygous reference; purple: heterozygous; orange: homozygous alternate.
Figure 3—figure supplement 3
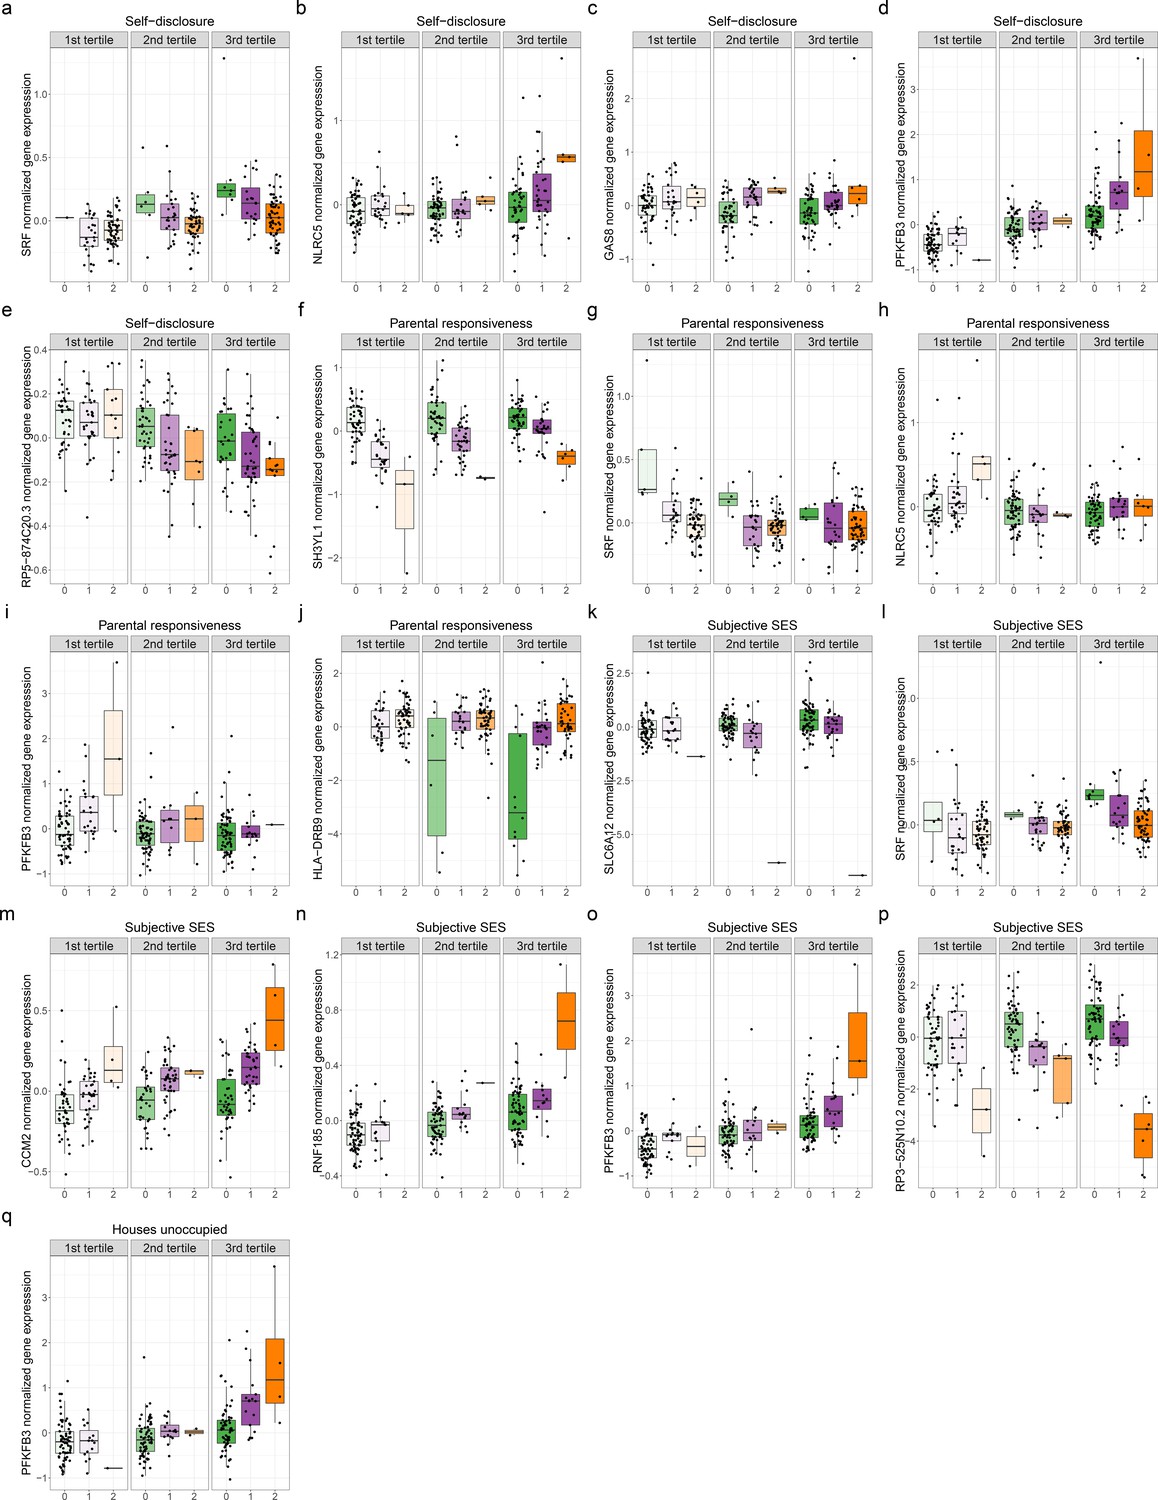
Genetic variants interact with psychosocial environments to alter expression of genes linked to asthma and allergic disease.
Boxplots depict the following. (a) Self-disclosure interacts with expression quantitative trait locus (eQTL) rs6458333:G:C to alter expression of SRF. (b) Self-disclosure interacts with eQTL rs7203263:C:G to alter expression of NLRC5. (c) Self-disclosure interacts with eQTL rs12922757:G:A to alter expression of GAS8. (d) Self-disclosure interacts with eQTL rs5015567:G:A to alter expression of PFKFB3. (e) Self-disclosure interacts with eQTL rs200494:T:G to alter expression of RP5-874C20.3. (f) Objective maternal responsiveness interacts with eQTL rs17713729:A:C to alter expression of SH3YL1. (g) Objective maternal responsiveness interacts with eQTL rs6458333:G:C to alter expression of SRF. (h) Objective maternal responsiveness interacts with eQTL rs7203263:C:G to alter expression of NLRC5. (i) Objective maternal responsiveness interacts with eQTL rs5015567:G:A to alter expression of PFKFB3. (j) Objective maternal responsiveness interacts with eQTL rs9269774:G:A to alter expression of HLA-DRB9. (k) Socioeconomic status interact with eQTL rs12424772:A:T to alter expression of SLC6A12. (l) Socioeconomic status interacts with eQTL rs6458333:G:C to alter expression of SRF. (m) Socioeconomic status interacts with eQTL rs7788412:A:G to alter expression of CCM2. (n) Socioeconomic status interacts with eQTL rs36123367:AT:A to alter expression of RNF185. (o) Socioeconomic status interacts with eQTL rs5015567:G:A to alter expression of PFKFB3. (p) Socioeconomic status interacts with eQTL rs12194992:G:A to alter expression of RP3-525N10.2. (q) Percent houses unoccupied interacts with eQTL rs5015567:G:A to alter expression of PFKFB3. X axis specifies the number of alternate alleles. Colors signify the genotype class. Green: homozygous reference; purple: heterozygous; orange: homozygous alternate.
Figure 3—figure supplement 4
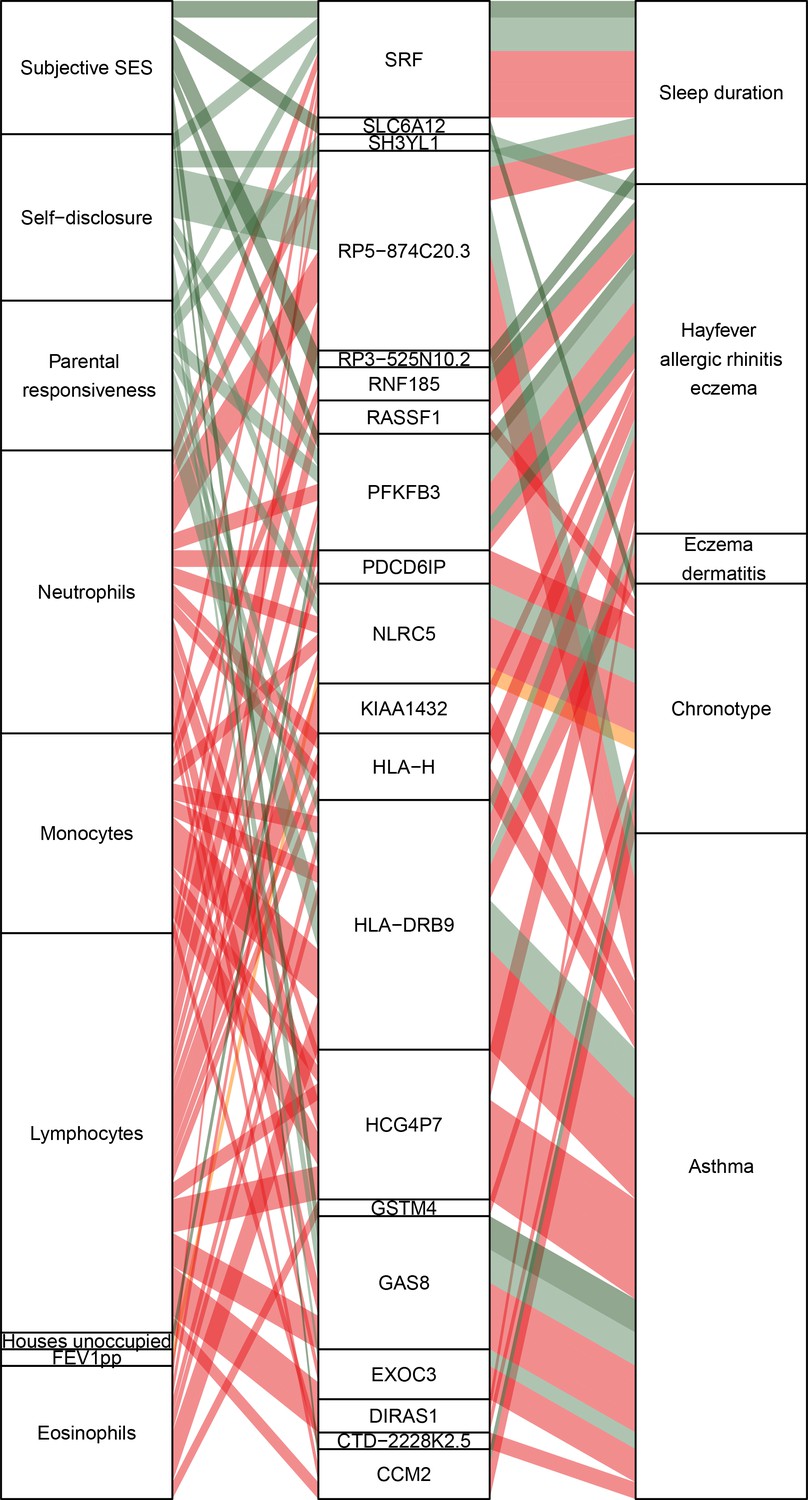
Causal gene-complex trait interactions identified through transcriptome-wide association studies (TWAS) are modulated by psychosocial experiences.
Psychosocial and biological variables are in the left column, eGenes in the central column, and complex traits in the right column. A connecting line represents either a causal link between eGene and trait identified through TWAS (middle to right) or a significant interaction expression quantitative trait locus (eQTL) (left to middle). Red represents blood composition variables, orange represents asthma variables, and green represents psychosocial variables.
Figure 3—figure supplement 5
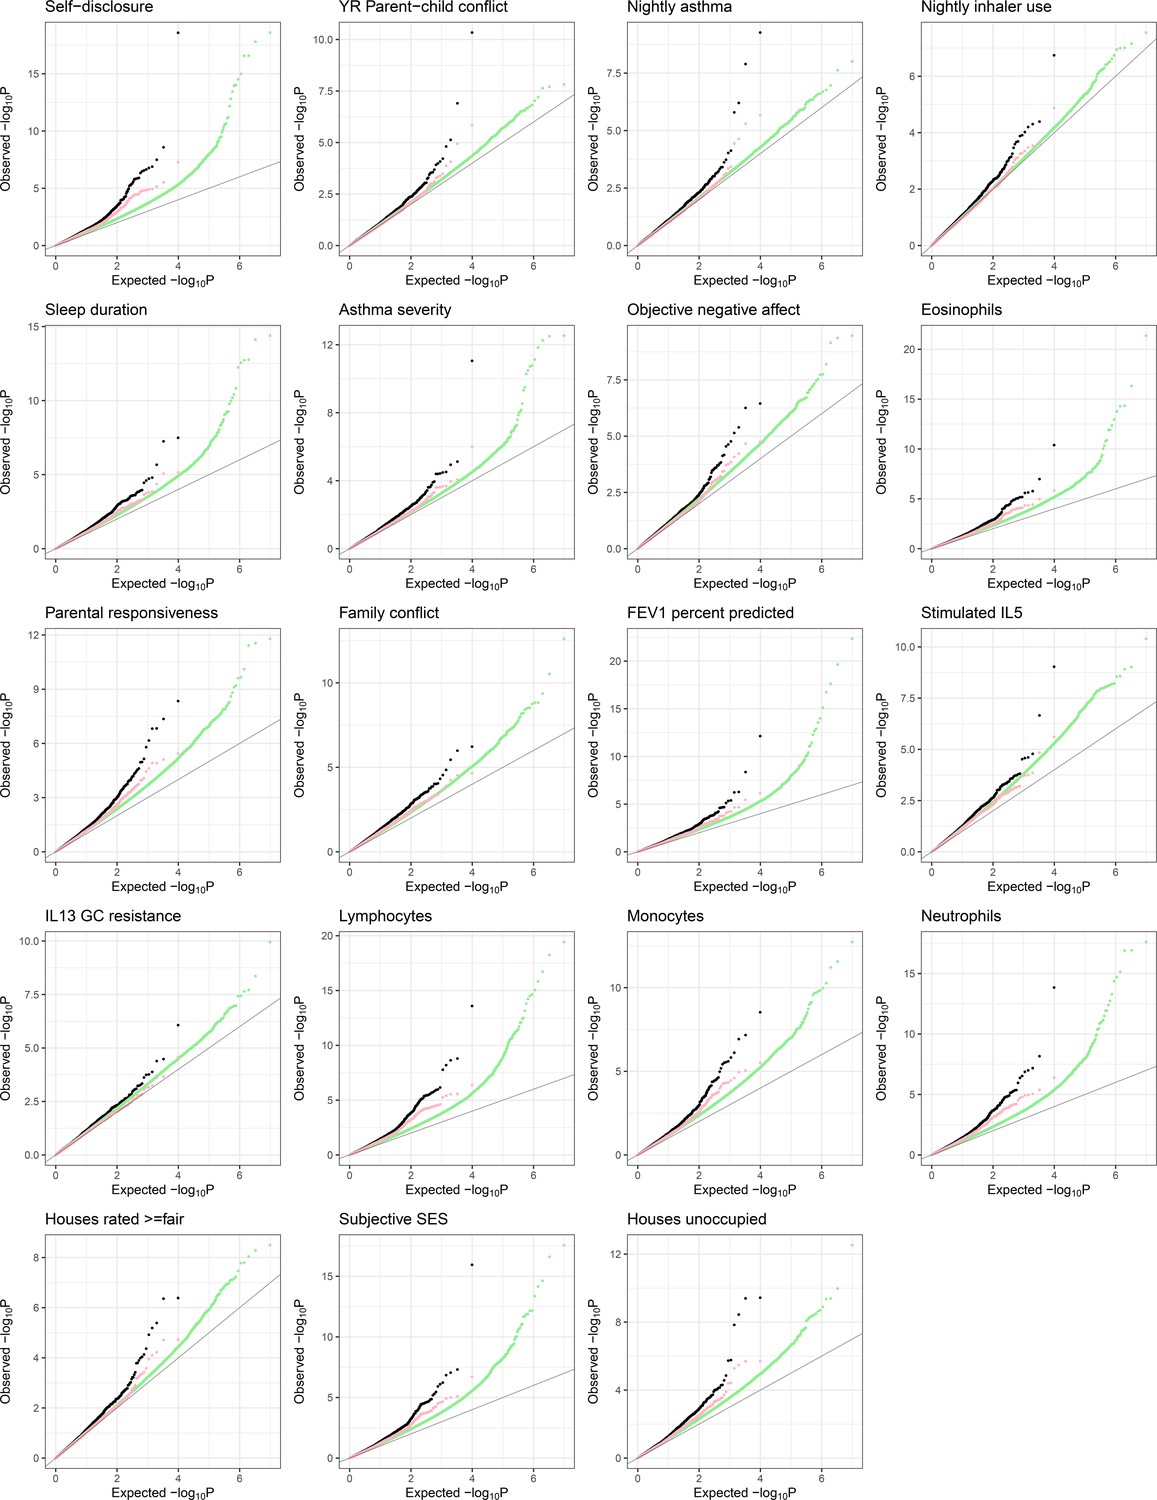
QQplots of interaction expression quantitative trait locus (eQTL) mapping test p-values (black), permutation p-values (green), and permutation-corrected p-values (pink).
Additional files
-
Supplementary file 1
Supplementary tables.
(a) Basic demographic information on 119 individuals used to train the transcriptional signature models (‘training’) and the entire cohort of 251 participants (‘total’). Reported are the count (N) and percentage of non-missing values per each category. For each variable in parentheses, we reported the p-values for significant differences in variable distribution between the training group and the group not included in the model. (b) List of variables collected for the current study. DD: daily diary; SD: sleep diary; EAR: coded from Electronically Activated Recorder; YR: youth reported; PR: parent reported; CD: census data; GC: glucocorticoid; SD: standard deviation; α: Chronbach's alpha measuring reliability as the average correlation between scale items, as a function of the number of items included in the scale, N initial – sample size used for differential gene expression analysis and building transcriptional signatures (mean, SD, and α are reported for this subset), N longitudinal – number of samples with measurements from two time points available, N expanded – final sample size used for transcriptional signature and GxE validations. (c) Evaluation of transcriptional signatures derived using elastic net regression. For each variable, we report Pearson’s correlation coefficient, p-value, cross-validated percent variance explained, and sample size for the training dataset (columns 2–5), and Pearson’s correlation coefficient, p-value, and sample size for the entire cohort (columns 6–8). (d) Longitudinal replication of transcriptional signatures. For each variable, we report Spearman’s correlation coefficient between longitudinal change in observed variable and change in the transcriptional signature, p-value, coefficient of variation of longitudinal change in observed variable, and sample size. (e) Differentially expressed genes (DEGs) for all psychosocial variables (10% FDR; N: sample size). (f) Full DESeq results for differential gene expression analyses for psychosocial variables. (g) Correlations between z-scores of GxE interaction effects measured using transcriptional signatures and observed data. For each variable, we report Spearman’s correlation coefficient and its p-value, and odds ratio and p-value from Fisher’s test for enrichment of nominally significant results (permutation-corrected p-value<0.01) between GxE expression quantitative trait locus (eQTL) testing using transcriptional signatures and observed data. (h) Correlations between the top three principal components of covariate matrix and individual covariates (Pearson's product-moment correlations with numeric variables, polyserial correlations with bivariate variables; ns: correlation p-value>0.05). (i) DEGs associated with blood cell composition (10% FDR; N: sample size). (j) Full DESeq results for differential gene expression analyses for blood composition variables.
- https://cdn.elifesciences.org/articles/63852/elife-63852-supp1-v3.xlsx
-
Supplementary file 2
Detailed descriptions of methods for psychosocial data collection.
- https://cdn.elifesciences.org/articles/63852/elife-63852-supp2-v3.docx
-
Transparent reporting form
- https://cdn.elifesciences.org/articles/63852/elife-63852-transrepform-v3.docx
-
Reporting standard 1
STREGA reporting recommendations, extended from STROBE Statement.
- https://cdn.elifesciences.org/articles/63852/elife-63852-repstand1-v3.doc
Download links
A two-part list of links to download the article, or parts of the article, in various formats.
Downloads (link to download the article as PDF)
Open citations (links to open the citations from this article in various online reference manager services)
Cite this article (links to download the citations from this article in formats compatible with various reference manager tools)
Psychosocial experiences modulate asthma-associated genes through gene-environment interactions
eLife 10:e63852.
https://doi.org/10.7554/eLife.63852


