Molecular insights into substrate recognition and discrimination by the N-terminal domain of Lon AAA+ protease
- Institute of Biochemistry and Molecular Biology, College of Medicine, National Taiwan University, Taiwan
- Institute of Biological Chemistry, Academia Sinica, Taiwan
- Instrumentation Center, National Taiwan University, Taiwan
- Institute of Biochemical Sciences, College of Life Science, National Taiwan University, Taiwan
Figures
Figure 1 with 1 supplement
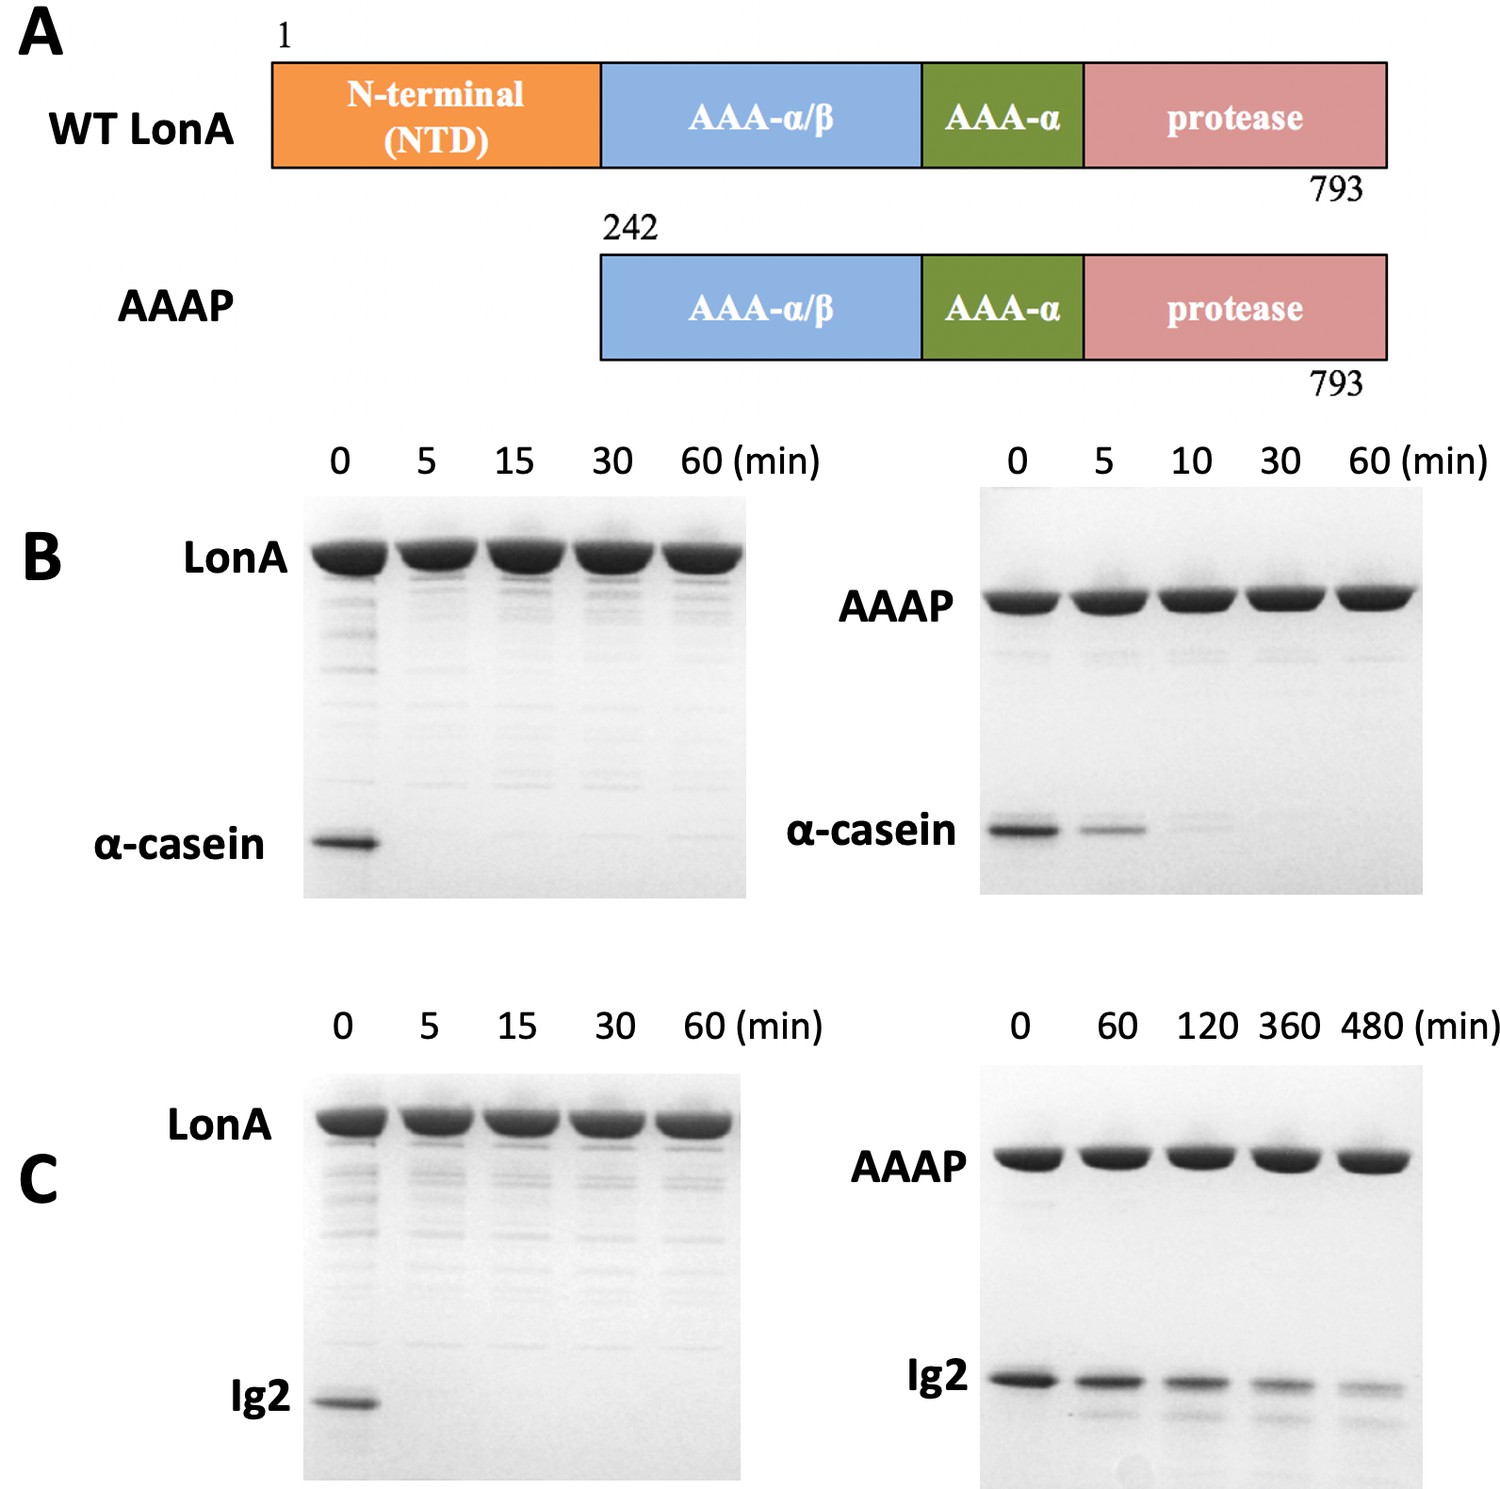
The NTD of Meiothermus taiwanensis LonA (MtaLonA) is essential for efficient degradation of a thermally unfolded substrate, but not the intrinsically disordered substrate, α-casein.
(A) Schematic diagrams illustrating domain organization of full-length MtaLonA and the N-terminal domain truncated AAAP. (B) Degradation of 4 μM α-casein by 0.4 μM (hexamer) of full-length MtaLonA (FL) and AAAP at 55°C. (C) Degradation of 4 μM Ig2 by 0.4 μM (hexamer) of full length and AAAP at 55°C.
Figure 1—figure supplement 1

The thermal stability of LonA, Ig2, and NN206.
The melting temperatures of MtaLonA and NN206 are 68°C and 85.5°C, respectively. The Tm of substrate Ig2 is 46°C, suggesting that the structure of Ig2 is thermal denatured as a substrate of MtaLonA at 55°C.
Figure 2 with 1 supplement
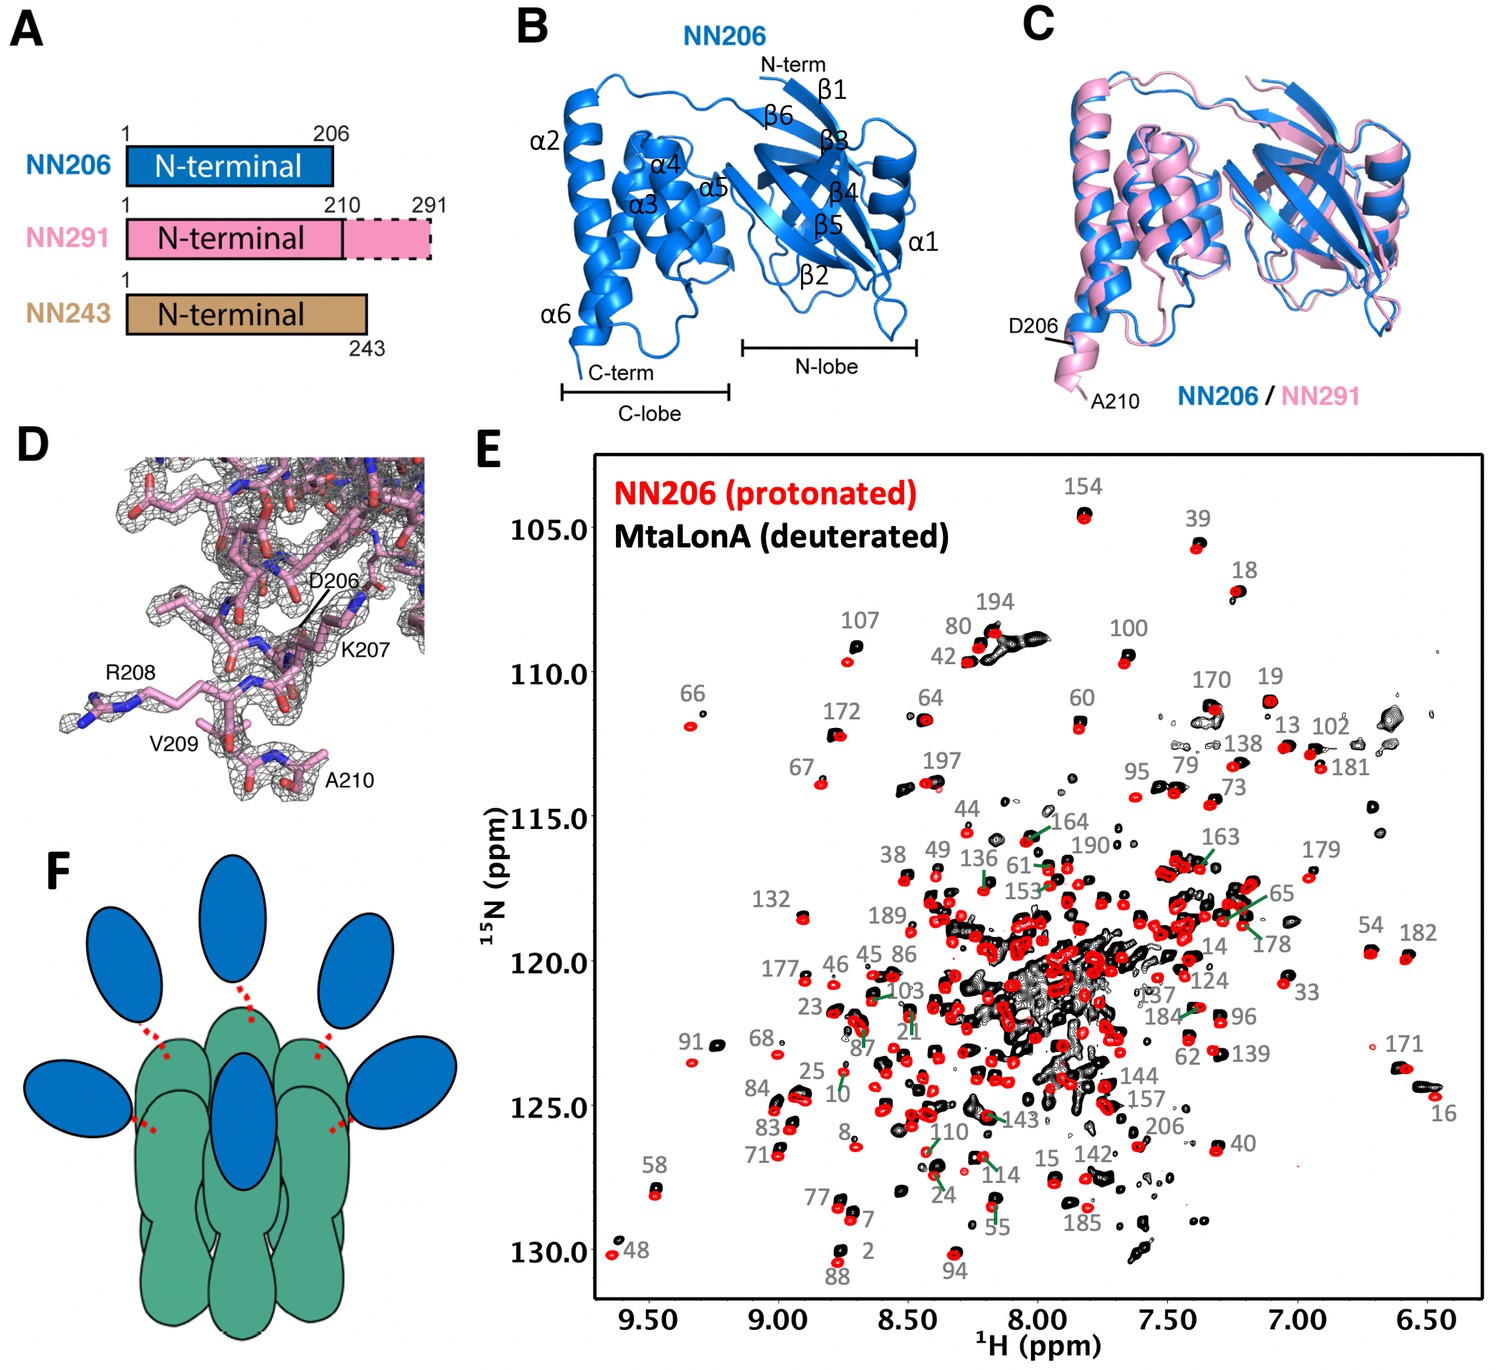
Overall structures of the N-terminal domain of MtaLonA.
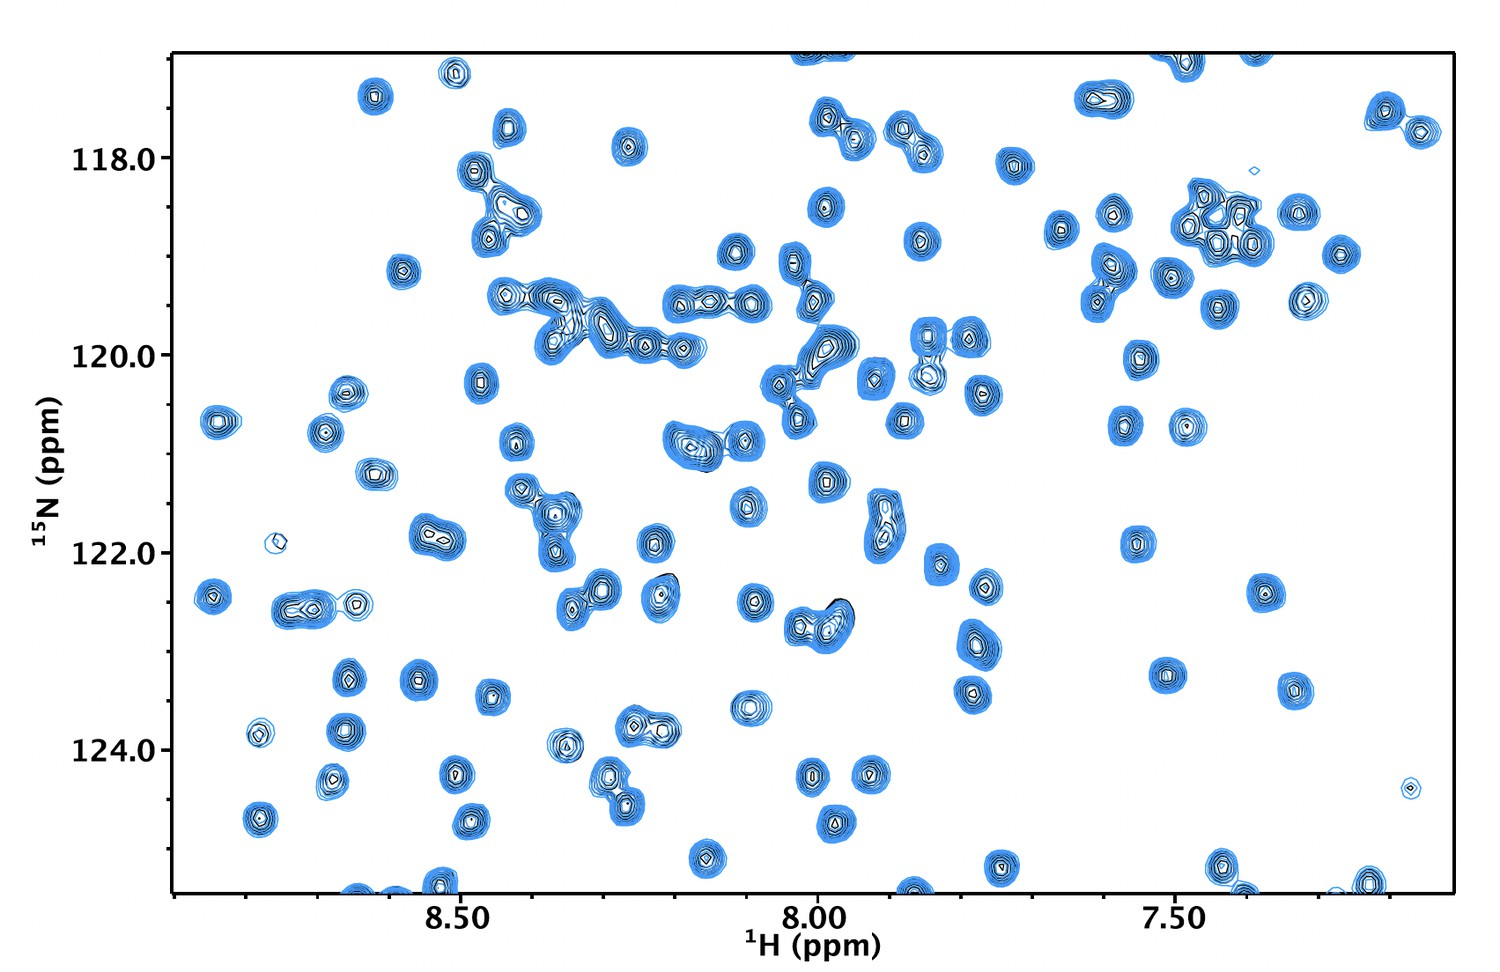
(A) The three N-terminal constructs NN206, NN291, and NN243. The disordered region is shown in the dashed box. (B) Structure of NN206. NN206 forms a bilobal fold: (1) the N-terminal lobe forming three β-sheets (β1/β3/β4/β5, β2/β5/β4, and β1/β6/β5); (2) the C-terminal lobe consisting of a five-helix bundle. (C) Superposition of NN206 (marine) and NN291 (pink) structures. (D) The refined 2Fo-Fc electron density map around the C-terminal residue A210 of NN291, contoured at 1.0 σ. (E) Comparison of 1H–15N TROSY-HSQC spectra of protonated NN206 (red) and highly deuterated15N-labled MtaLonA (black) recorded at 55°C. A systematic chemical shift offset is due to deuterium isotope effects. The well-dispersed resonances are labeled with residue numbers. About 200 well-resolved correlations are superimposable, suggesting that NTD is loosely linked to the hexameric core via a flexible linker. (F) Each of the six NTDs may connect to the hexameric core of fused AAA+ and protease domains by a flexible ~40-residue linker. The NTDs and ATPase–Protease chamber are illustrated in blue and green colors, respectively. Dashed lines represent the flexible linker regions.
Figure 2—figure supplement 1
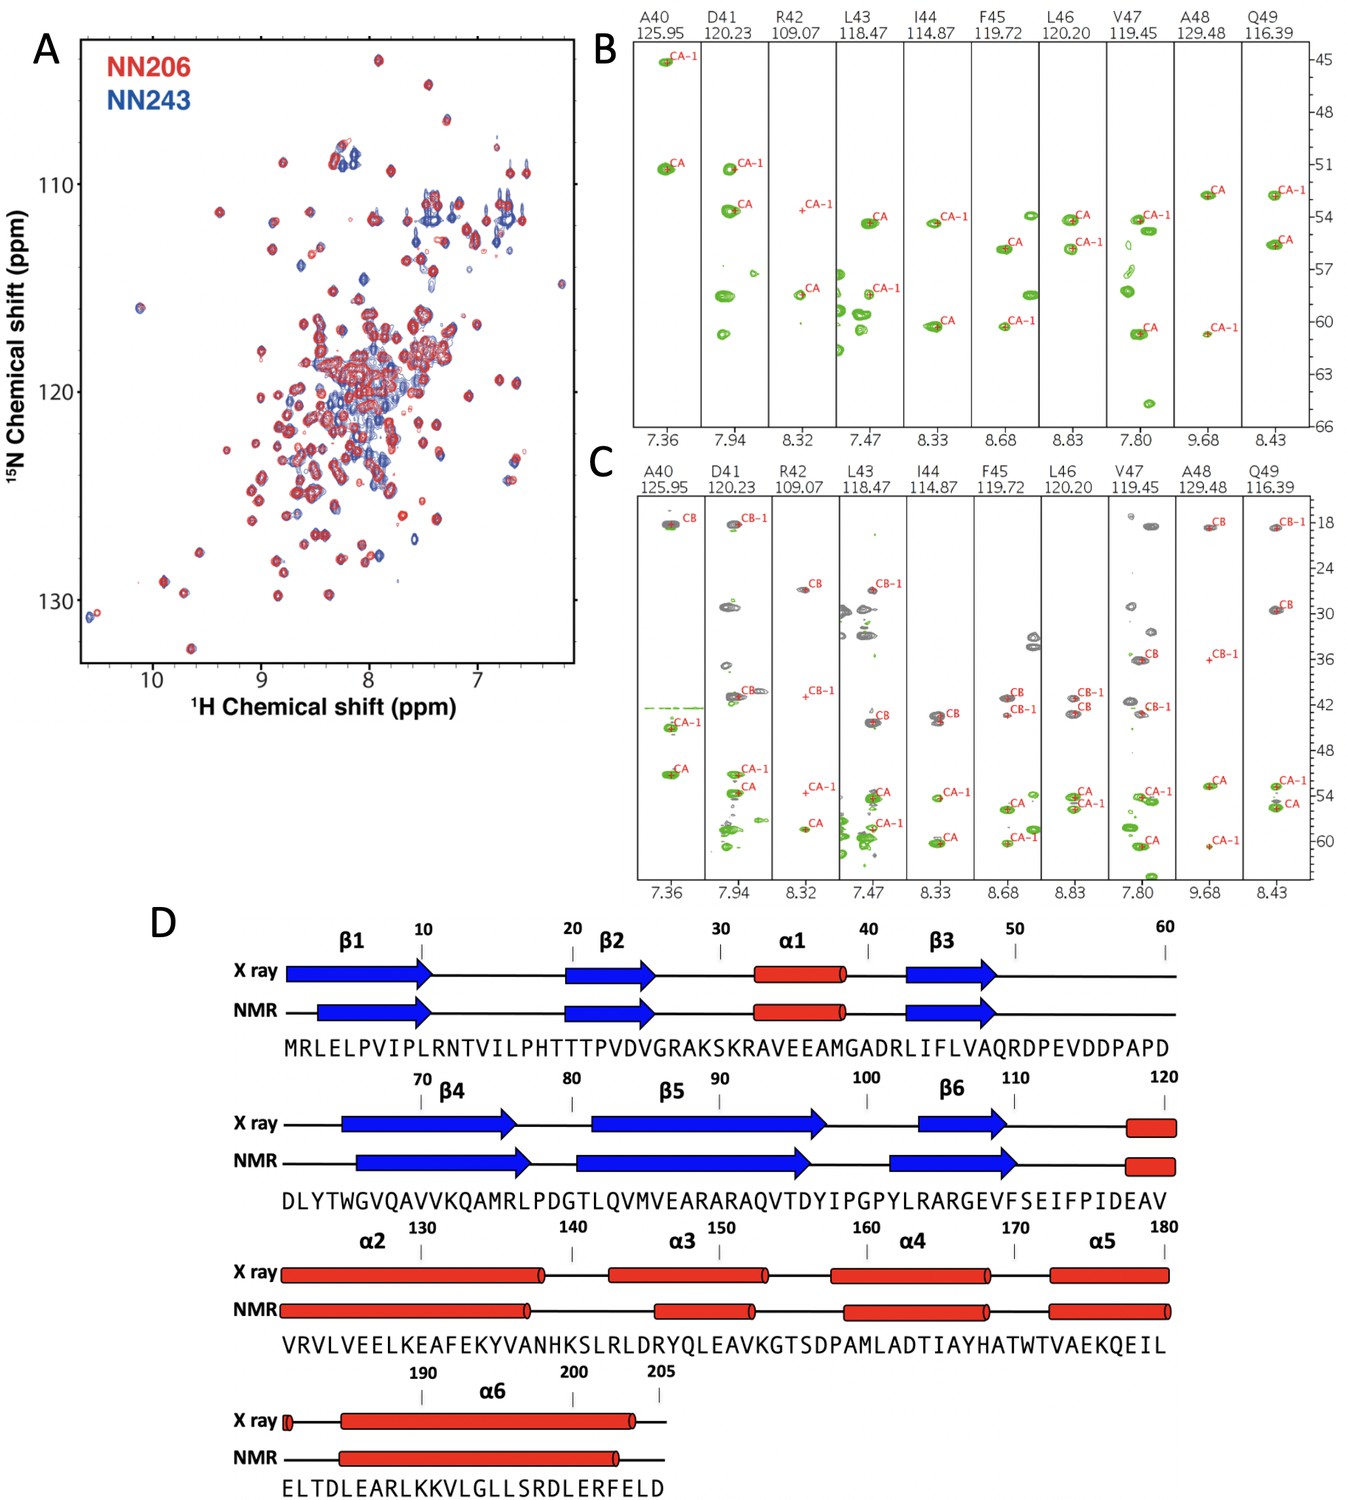
NMR characterization of MtaLonA NTD.
(A) Overlay of 2D 1H–15N TROSY-HSQC NMR spectra of NN206 (red) and NN243 (blue). (B) Backbone amide resonances of NN206. Strip plots of HNCA spectrum of NN205 and the sequential connectivity are shown from A40 to Q49. (C) Strip plots of and HNCACB spectrum of NN206 and the sequential connectivity are shown from A40 to Q49. (D) A comparison between the NMR-derived secondary structure for the NN206 construct and the solved X-ray structure. Globally, the NMR-derived secondary structure of NN206, based on the method of Chemical Shift Index, is highly similar to its solved X-ray structure.
Figure 3 with 5 supplements
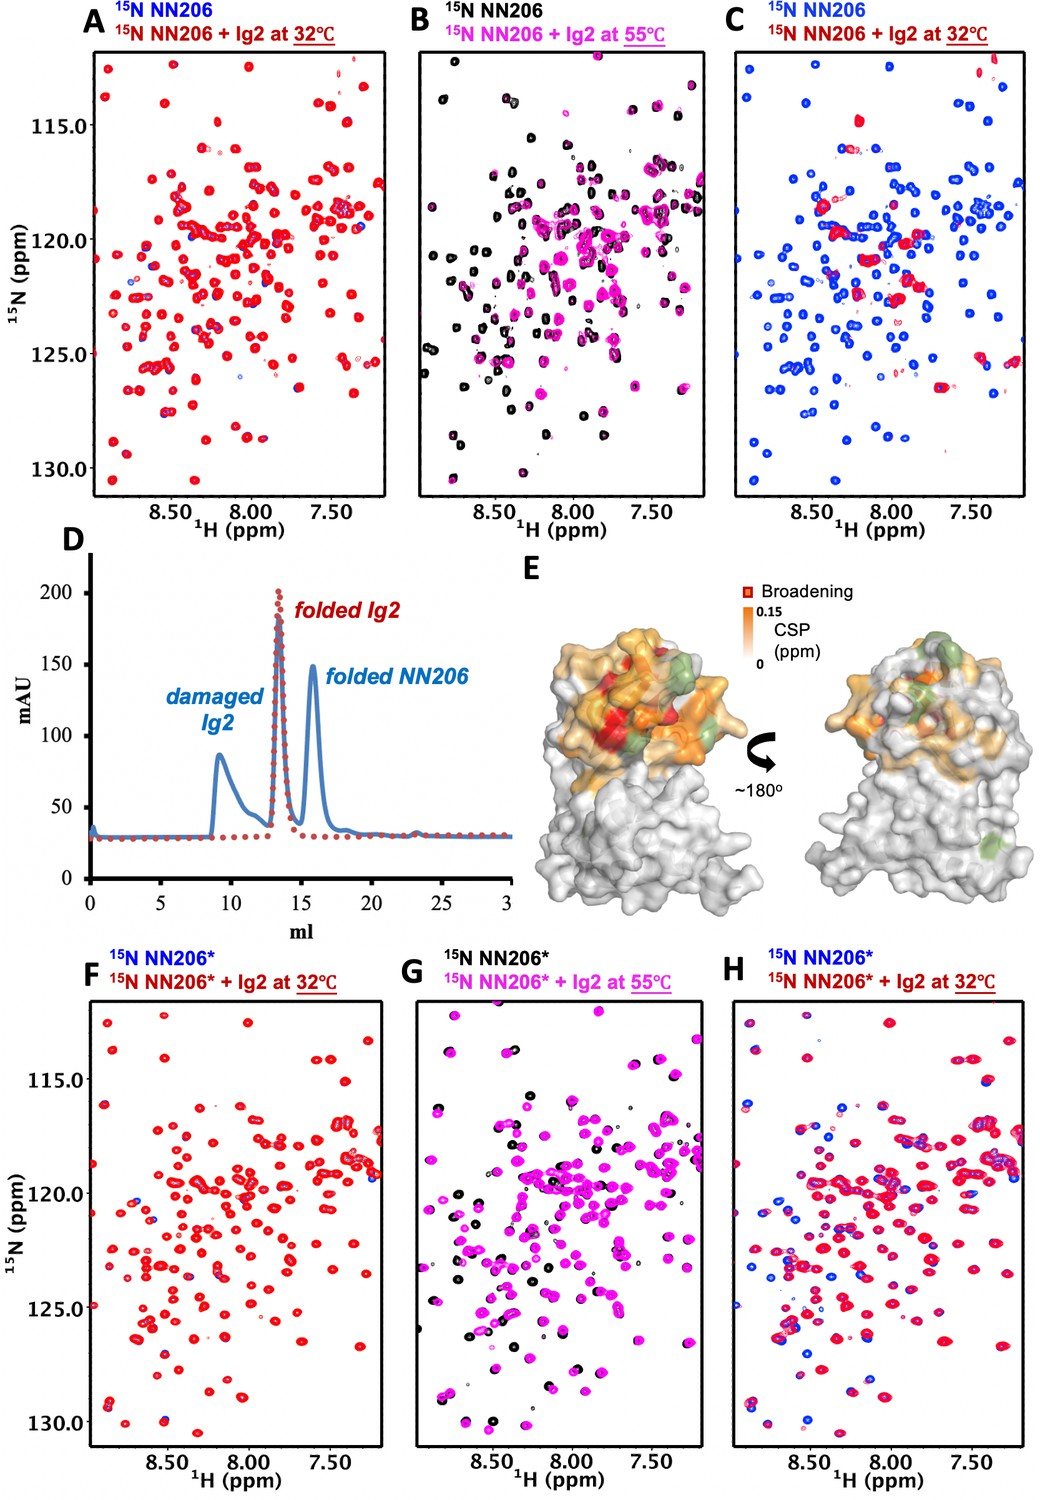
The N-lobe of MtaLonA NTD is involved in recognition of thermally unfolded substrate Ig2.
(A) 1H–15N TROSY-HSQC spectra of NN206 in the absence (blue) and presence (red) of unlabeled Ig2 recorded at 32°C. (B) Comparison of 1H–15N TROSY-HSQC spectra of NN206 in the apo (black) and Ig2-bound (magenta) states recorded at 55°C. (C) After one thermal cycle, 1H–15N TROSY-HSQC spectra of NN206 in the absence (blue) and presence (red) of Ig2 recorded at 32°C. (D) Gel filtration profiles of the NMR sample containing both 15N-labeled NN206 (300 µM) and unlabeled Ig2 (600 µM) treated with thermal cycling shown in blue and folded Ig2 (red dashed lines) analyzed by Superdex 200 10/300 GL column. (E) Interaction interface of NN206: Ig2 mapped onto the structure of MtaLonA NTD, based on the spectrum recorded at 55°C. Proline residue is shown in green. (F) 1H–15N TROSY-HSQC spectra of NN206* in the absence (blue) and presence (red) of Ig2 recorded through thermal cycling from 32°C (F) to 55°C (G) and then returning to 32°C (H).
Figure 3—figure supplement 1
The thermal stability of NN206.
MtaLonA NTD remains stable over the entire thermal cycling. 2D 15N-1H TROSY-HSQC NMR spectra of apo NN206 are overlaid and compared before (black) and after (blue) one thermal cycle.
Figure 3—figure supplement 2
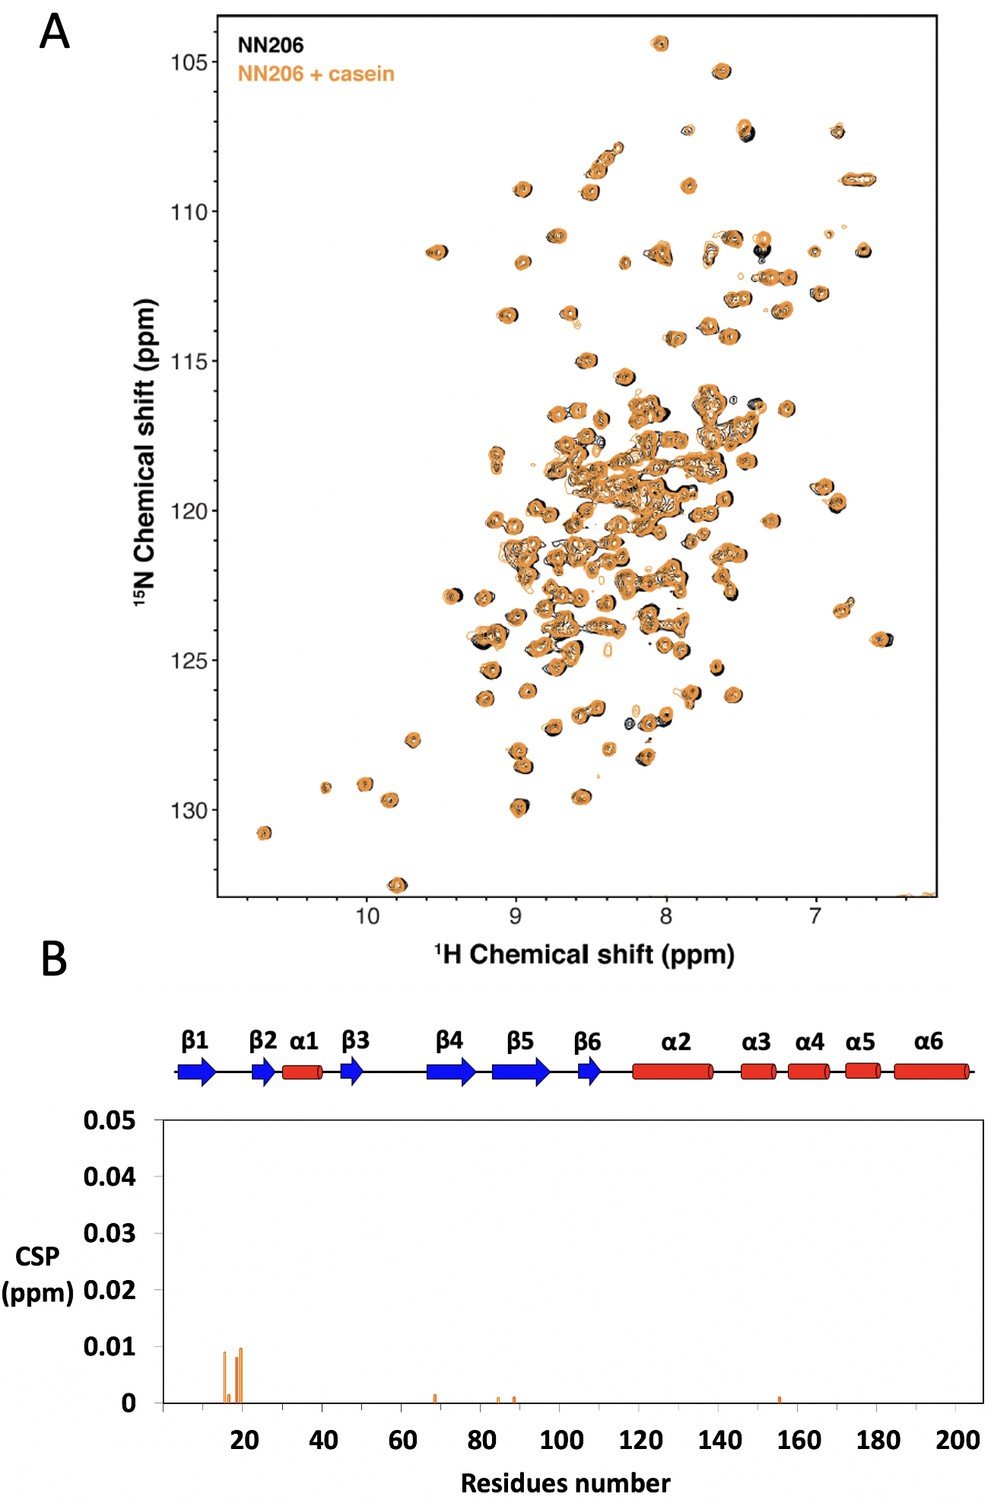
NMR characterization of MtaLonA NTD interacting with α-casein.
(A) Overlay of 15N-1H TROSY-HSQC spectra of NN206 in apo (black) and α-casein-bound (orange) states recorded at 55°C. (B) CSPs of amide moieties of 15N-labeled NN206 after addition of unlabeled α-casein at 55°C, plotted against NN206 residue number.
Figure 3—figure supplement 3
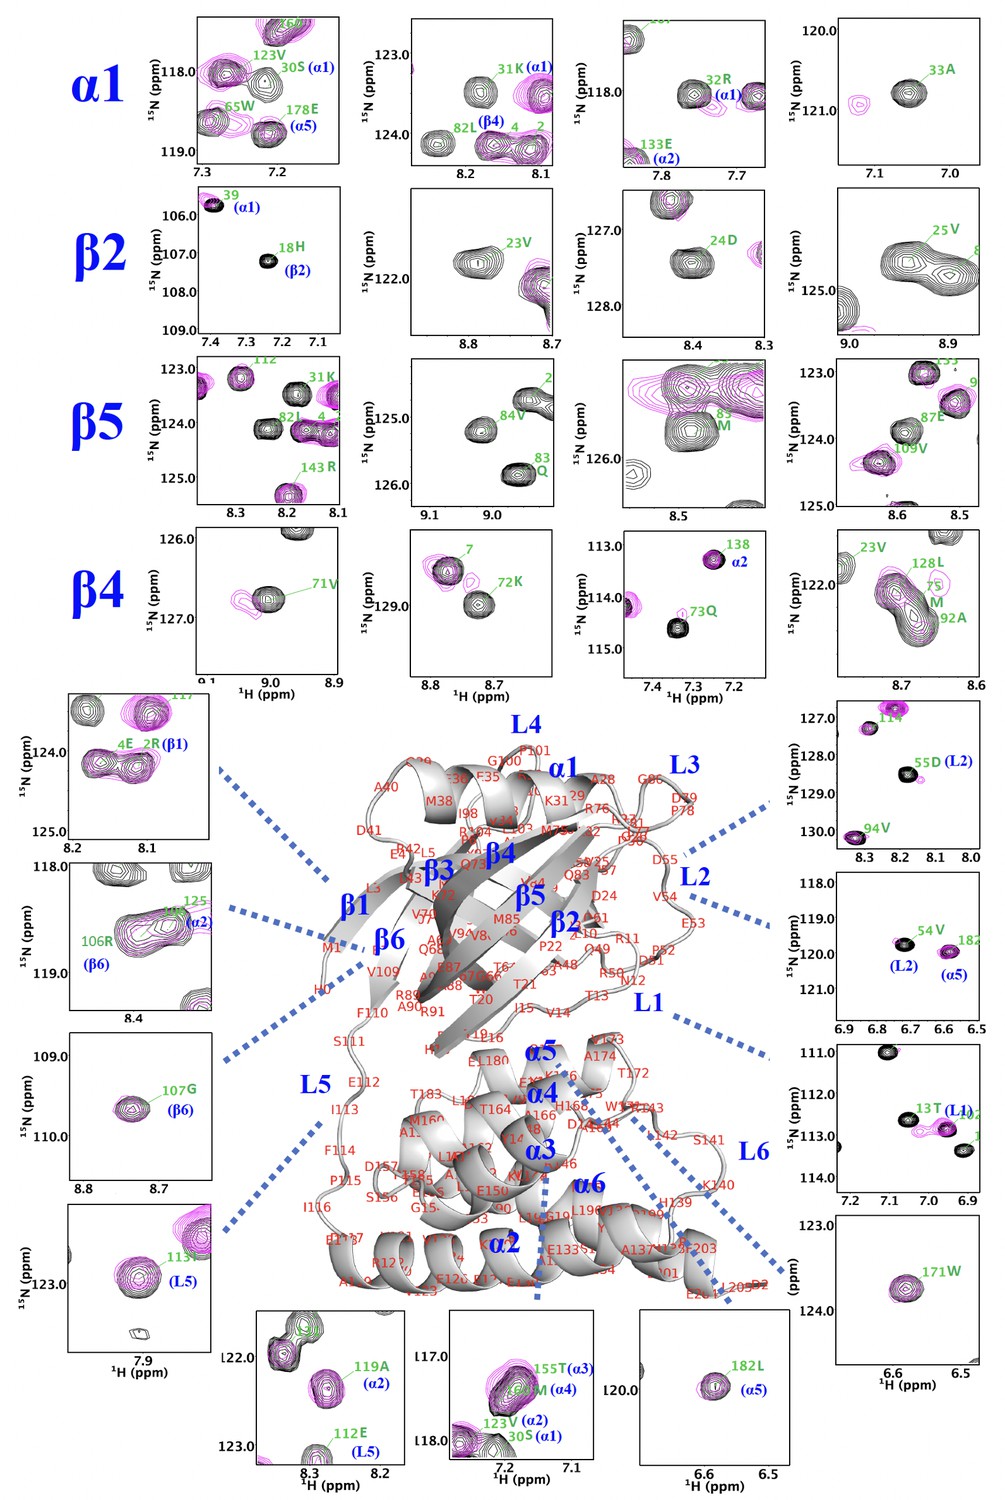
NMR analysis indicates that thermally damaged Ig2 induces significant CSPs and broadened resonances in the NTD N-lobe.
Comparison of 1H–15N TROSY-HSQC spectra of NN206 in the apo (black) and Ig2-bound (magenta) states. The residues of NTD with the CSPs are part of the interaction interface, located mainly at β‐sheet β2/β5/β4, loop L1, L2, L3, and helix α1.
Figure 3—figure supplement 4
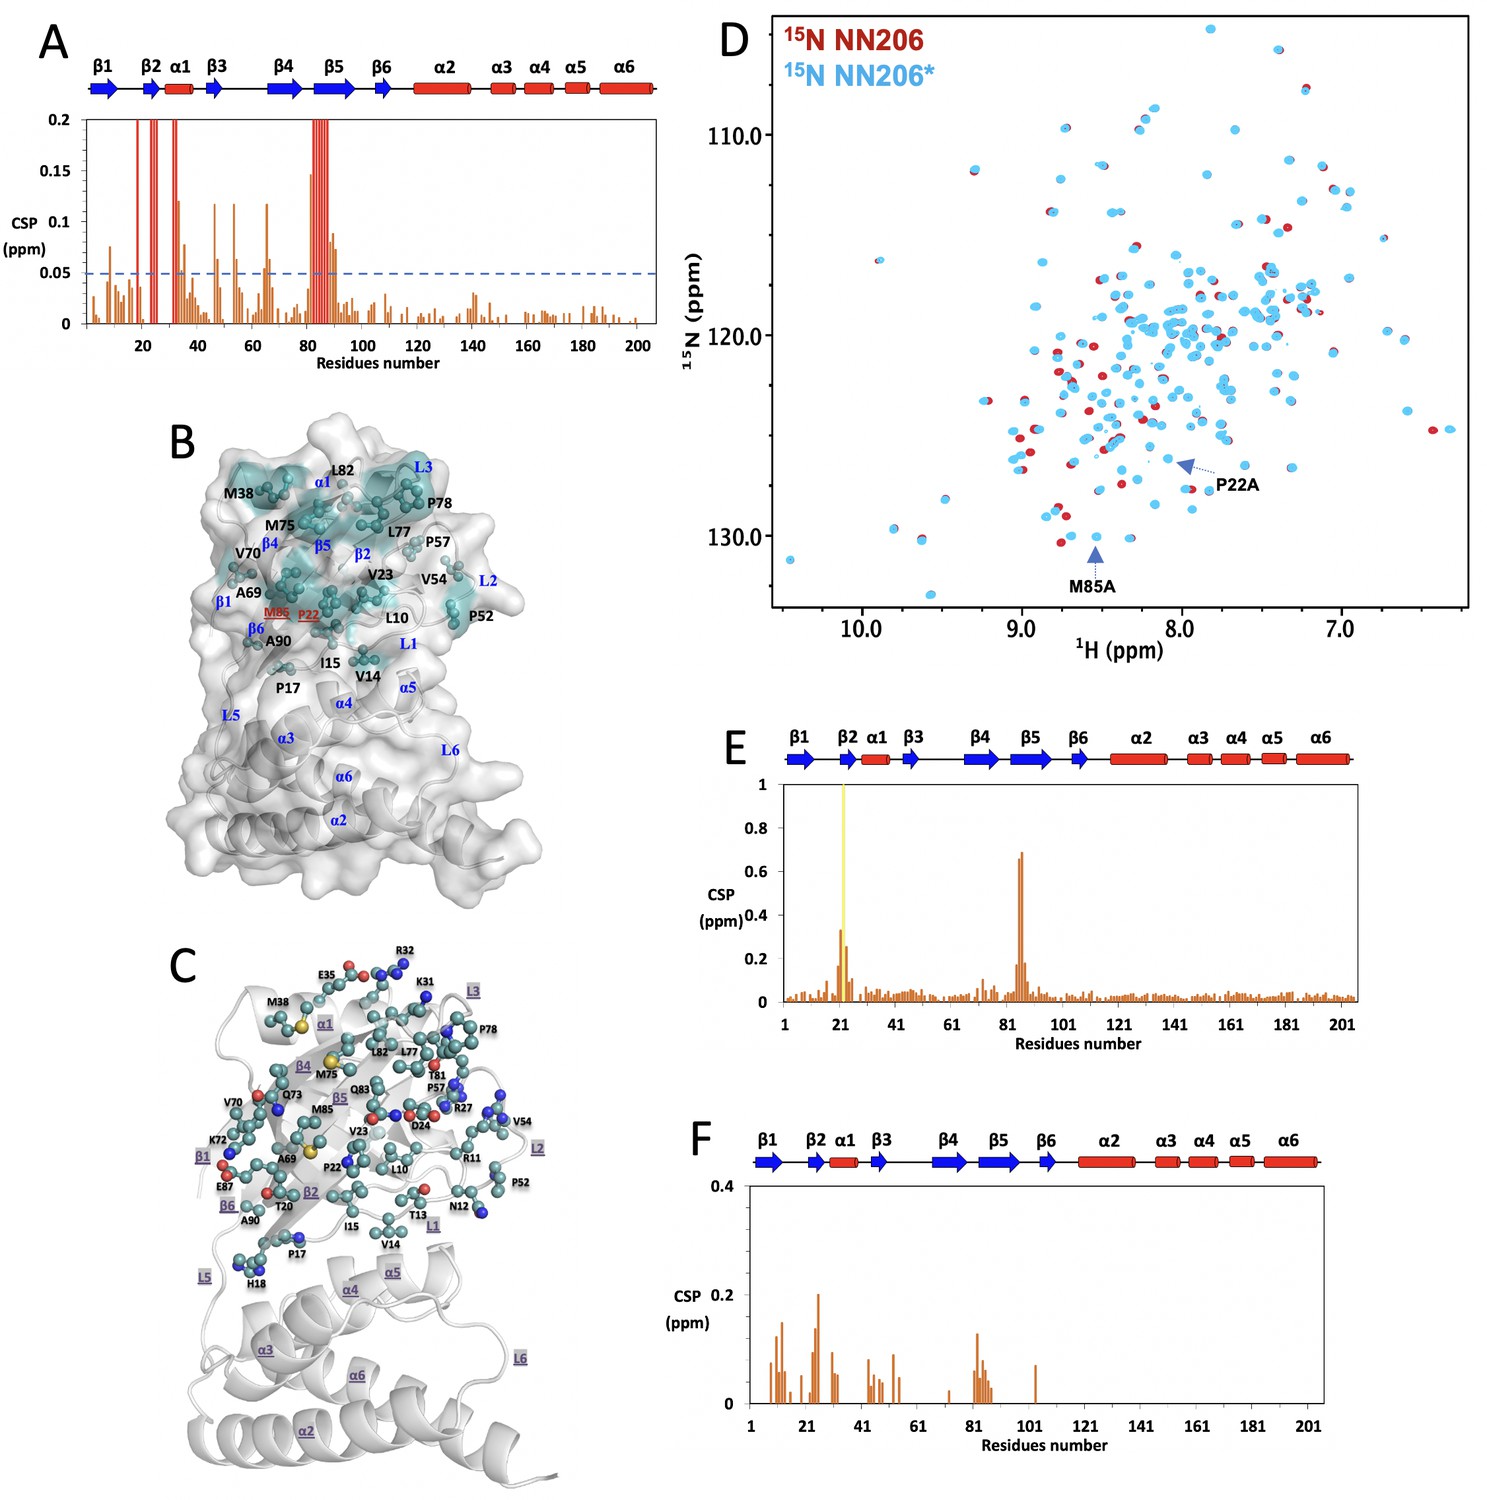
NMR characterization of MtaLonA NTD* interacting with thermally damaged Ig2.
(A) CSPs of amide moieties of 15N-labeled NN206 after binding unlabeled Ig2 at 55°C, plotted against NN206 residue number. A significance level for CSP is indicated by a dotted line. (B) The exposed hydrophobic residues that make up the damaged Ig2-binding sites are shown as balls and sticks. Mutations of two exposed hydrophobic residues P22 and M85, located at the center of β‐sheet β2/β5/β4, lead to reduce the hydrophobicity of the contiguous hydrophobic surface in the N-lobe subdomain. (C) Thermally damaged Ig2 induces significant CSPs and broadened resonances mainly at helix α1, loop L1, L2, L3, and β-sheet β2/β5/β4, which consist primarily of hydrophobic residues and are decorated by a number of polar residues. (D) Overlay of 15N-1H HSQC spectra of NN206 (red) and NN206* (blue) recorded at 55°C. Spectral analysis shows chemical shift differences between NN206 and NN206* are negligible, suggesting that they have very similar structures, with the exception of the region surrounding the point substitutions. (E) CSPs of amide moieties of 15N-labeled NN206 upon introduction of P22A/M85A double mutation. (F) CSPs of amide moieties of 15N-labeled NN206* after binding unlabeled Ig2 at 55°C, plotted against NN206 residue number.
Figure 3—figure supplement 5
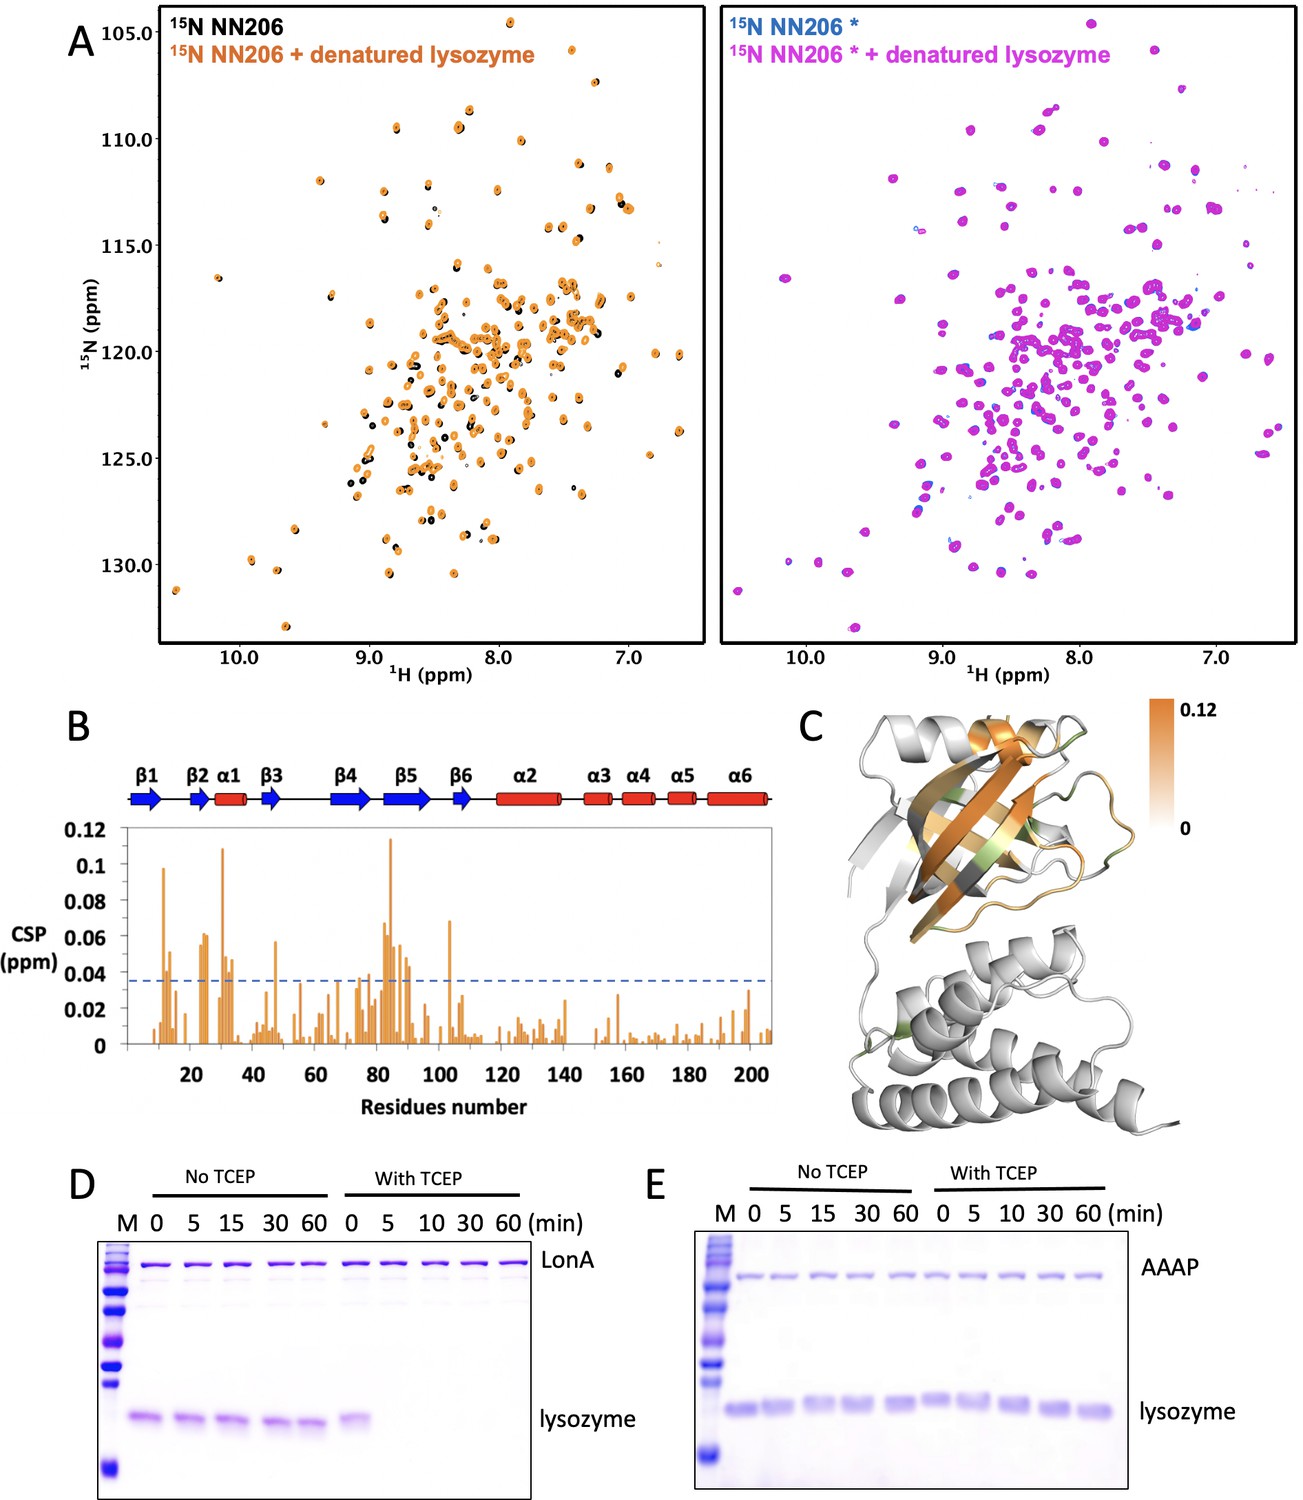
Interaction of NTDs with the scrambled lysozyme.
(A) Overlay of 1H–15N HSQC spectra of 50 μM NN206 in the absence (black) and presence (orange) of 25 μM of TCEP-treated denatured lysozyme. Overlay of 1H–15N HSQC spectra of 50 μM NN206* in the absence (blue) and presence (magenta) of TCEP-treated denatured lysozyme. (B) CSPs of amide moieties of NN206 after binding the scarmbled lysozyme at 32°C, plotted against NN206 residue number. The secondary structure of the native-state NN206 is indicated on the top of the chart. A significance level for CSP is indicated by a dotted line. (C) Structural mapping of the chemical shift perturbations (orange) of NN206 caused by TCEP-treated denatured lysozyme. 12 proline residues are shown in green. (D) Degradation of native and denatured lysozyme (4 μM) by full-length MtaLonA (0.067 μM hexamer). (E) Degradation of native and denatured lysozyme (4 μM) by AAAP (0.067 μM hexamer).
Figure 4 with 2 supplements
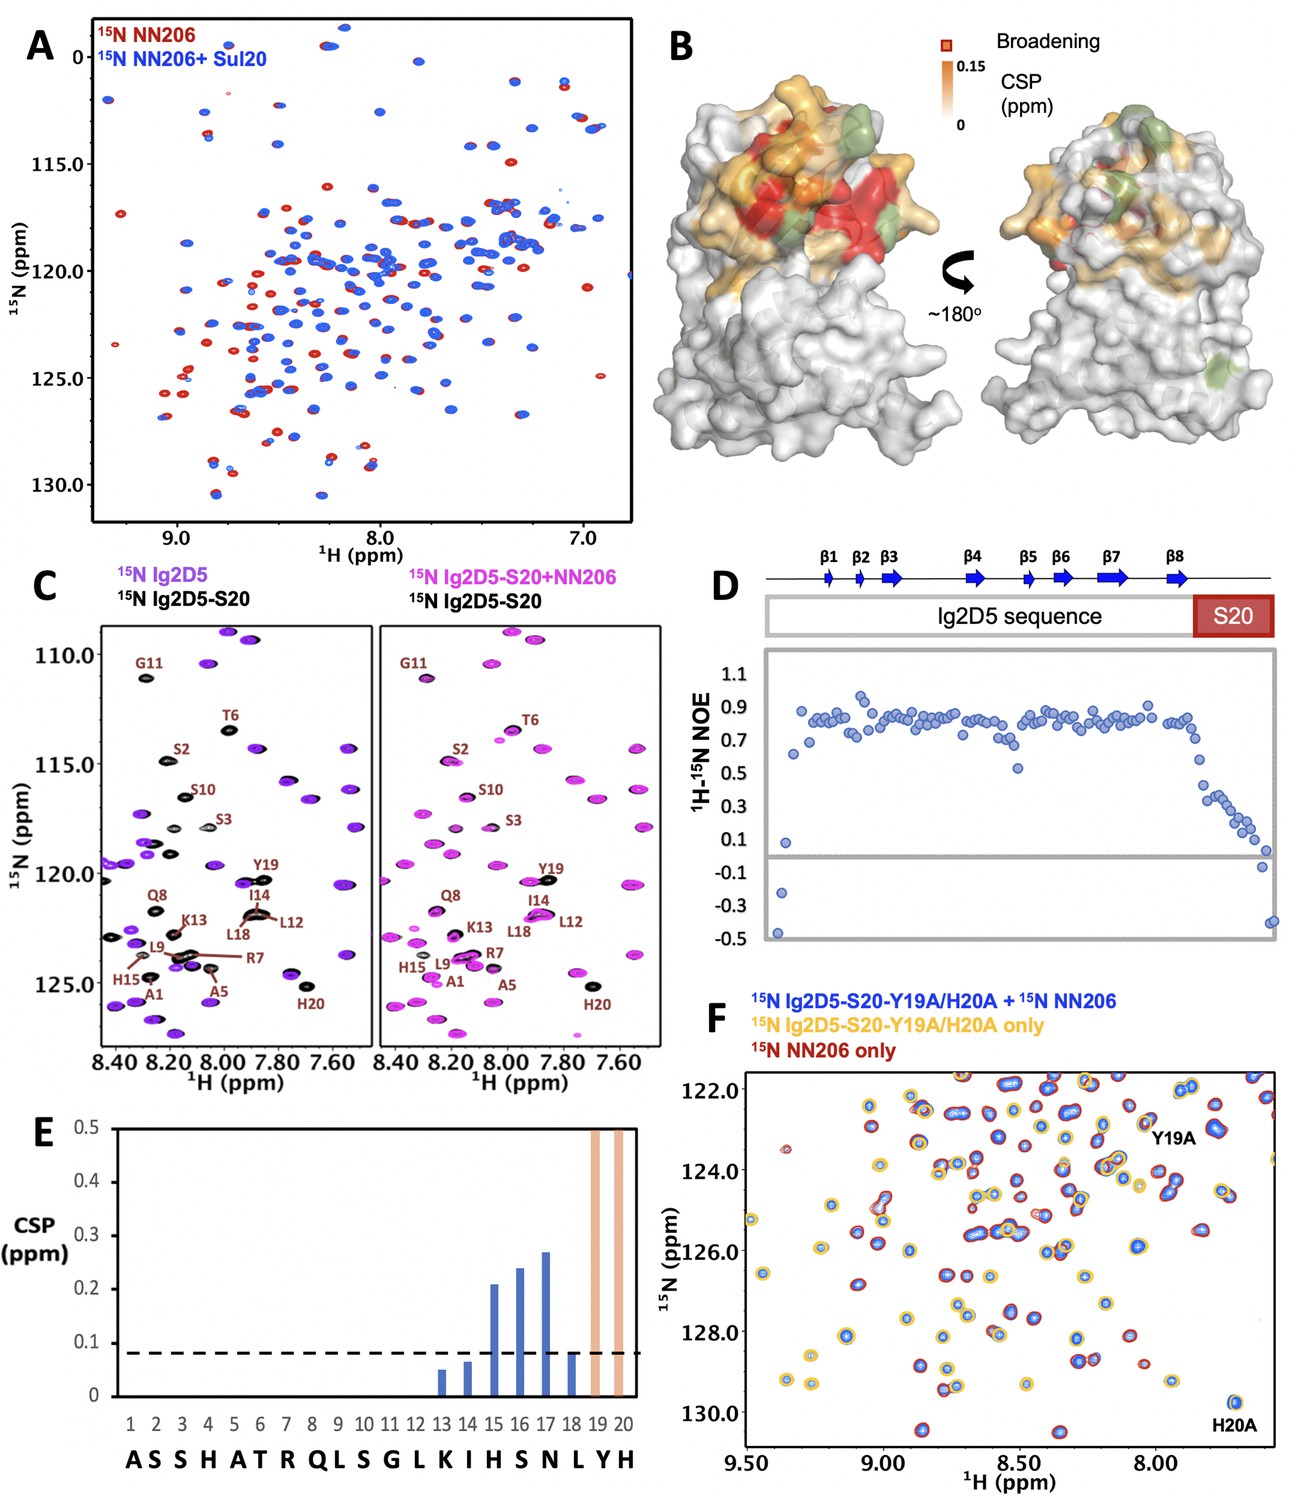
Interaction of MtaLonA NTDs with degron tag Sul20.
(A) Overlay of 1H–15N TROSY-HSQC spectra of NN206 in the absence (red) and presence (blue) of Sul20 peptide. (B) Structural mapping of the chemical shift perturbations (orange) of NN206 caused by Sul20 peptide. Proline residue is shown in green. (C) Overlay of 1H–15N TROSY-HSQC spectra of Ig2D5 (purple) and Ig2D5-S20 (black); overlay of 1H–15N TROSY-HSQC spectra of Ig2D5-S20 in the absence (black) and in the presence (pink) of unlabeled NN206. (D) [1H]–15N nuclear Overhauser effect (NOE) values of Ig2D5-S20. (E) CSPs of amide moieties of Ig2D5-S20 after binding unlabeled NN206, plotted against Sul20 residue number. Residues Y19 and H20 are strongly affected by the binding event based on the resonance broadening beyond detection (shown in orange). A significance level for CSP is indicated by a dotted line. (F) Overlay of 1H–15N TROSY-HSQC spectra of 15N-labeled NN206 in apo state (red) and 15N-labeled Ig2D5-S20-Y19A/H20A in the absence (yellow) and presence (blue) of 15N-labeled NN206.
Figure 4—figure supplement 1
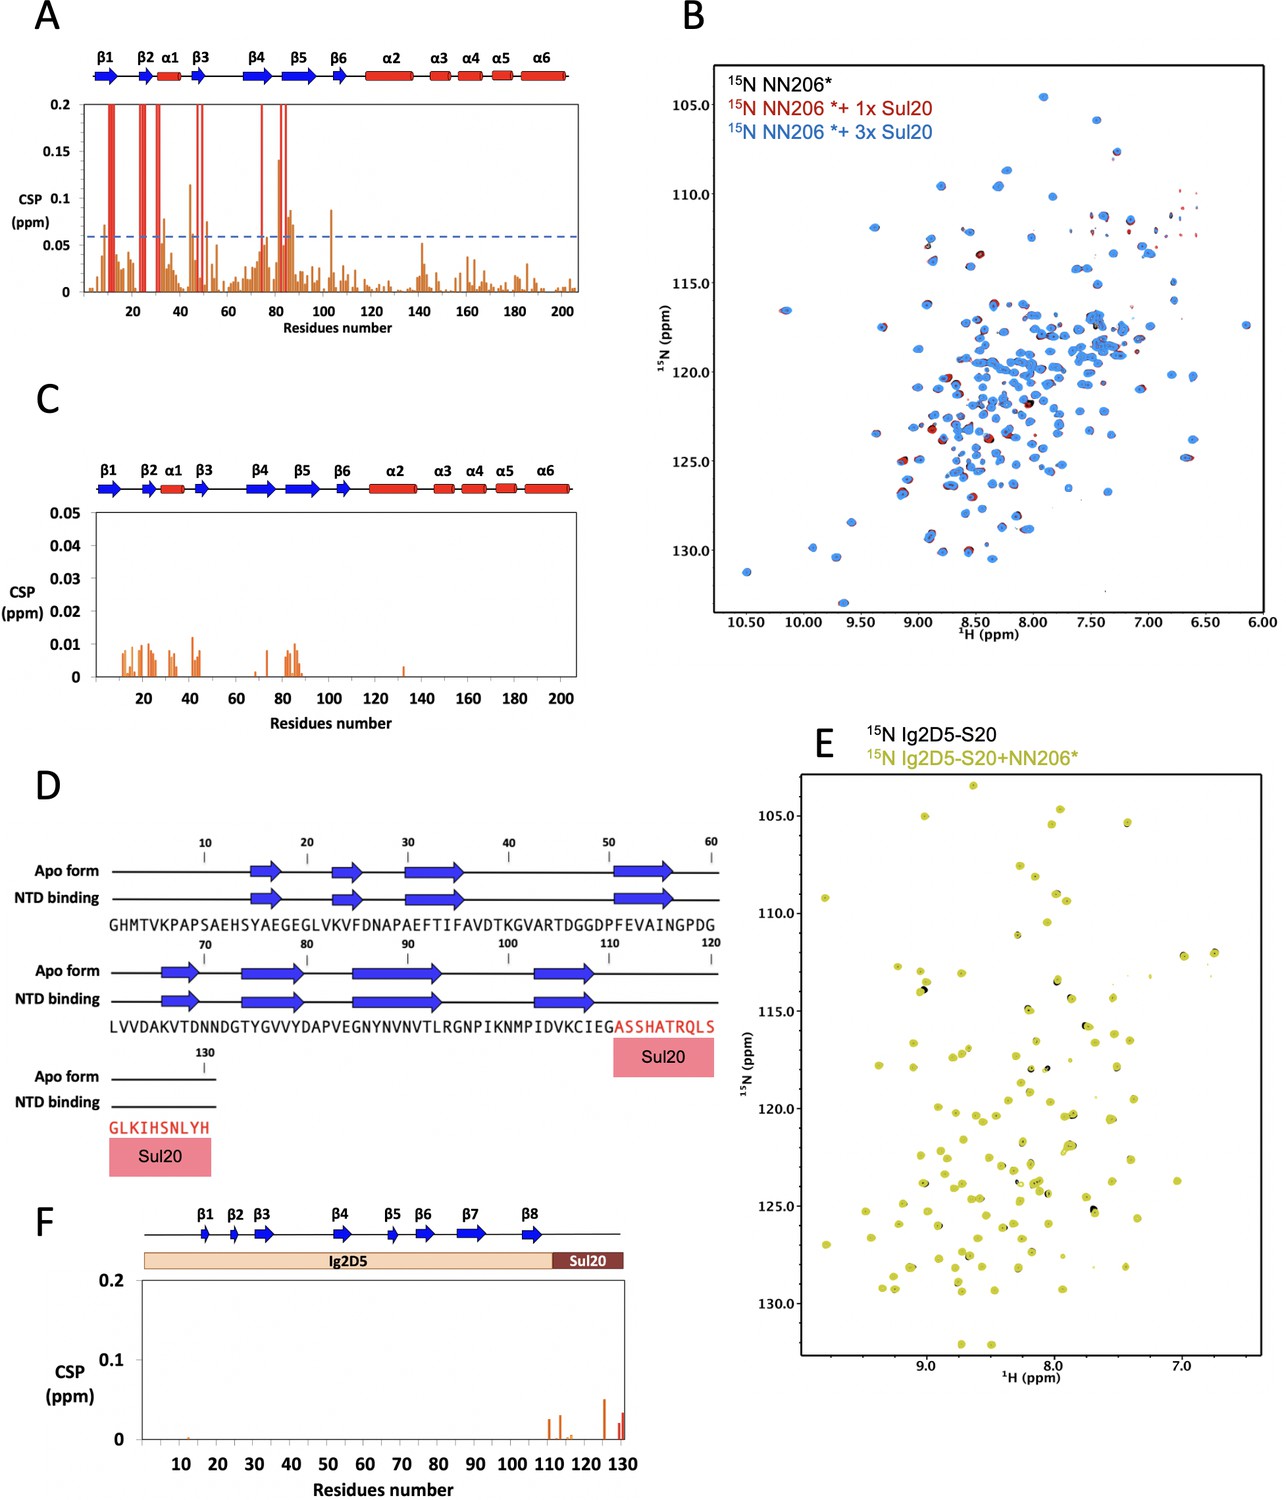
Interaction of NN206* with degron tag Sul20.
(A) CSPs of amide moieties of 15N-labeled NN206 after binding unlabeled Sul20 peptide, plotted against NN206 residue number. A significance level for CSP is indicated by a dotted line. (B) Two-dimensional 15N-1H HSQC spectra of 50 μM 15N-labeled NN206* titrated with increasing concentration of Sul20 peptide: 0 (black), 50 (red), and 150 μM (blue). (C) CSPs of amide moieties of 15N-labeled NN206* after addition of unlabeled Sul20 peptide recorded at 32°C, plotted against NN206 residue number. (D) The NMR-derived secondary structure of Sul20 upon addition with NN206. The secondary structure of Sul20 shows random coil and it remains unchanged in the presence of MtaLonA NTD. The primary sequences of Ig2D5 and Sul20 are shown in black and red, respectively. (E) 1H-15N NMR spectra of Ig2D5-S20 in the absence (black) and presence (yellow) of an equimolar amount of NN206*. (F) CSPs of amide moieties of 15N-labeled Ig2D5-S20 after addition of unlabeled NN206* recorded at 32°C, plotted against Ig2D5-S20 residue number.
Figure 4—figure supplement 2
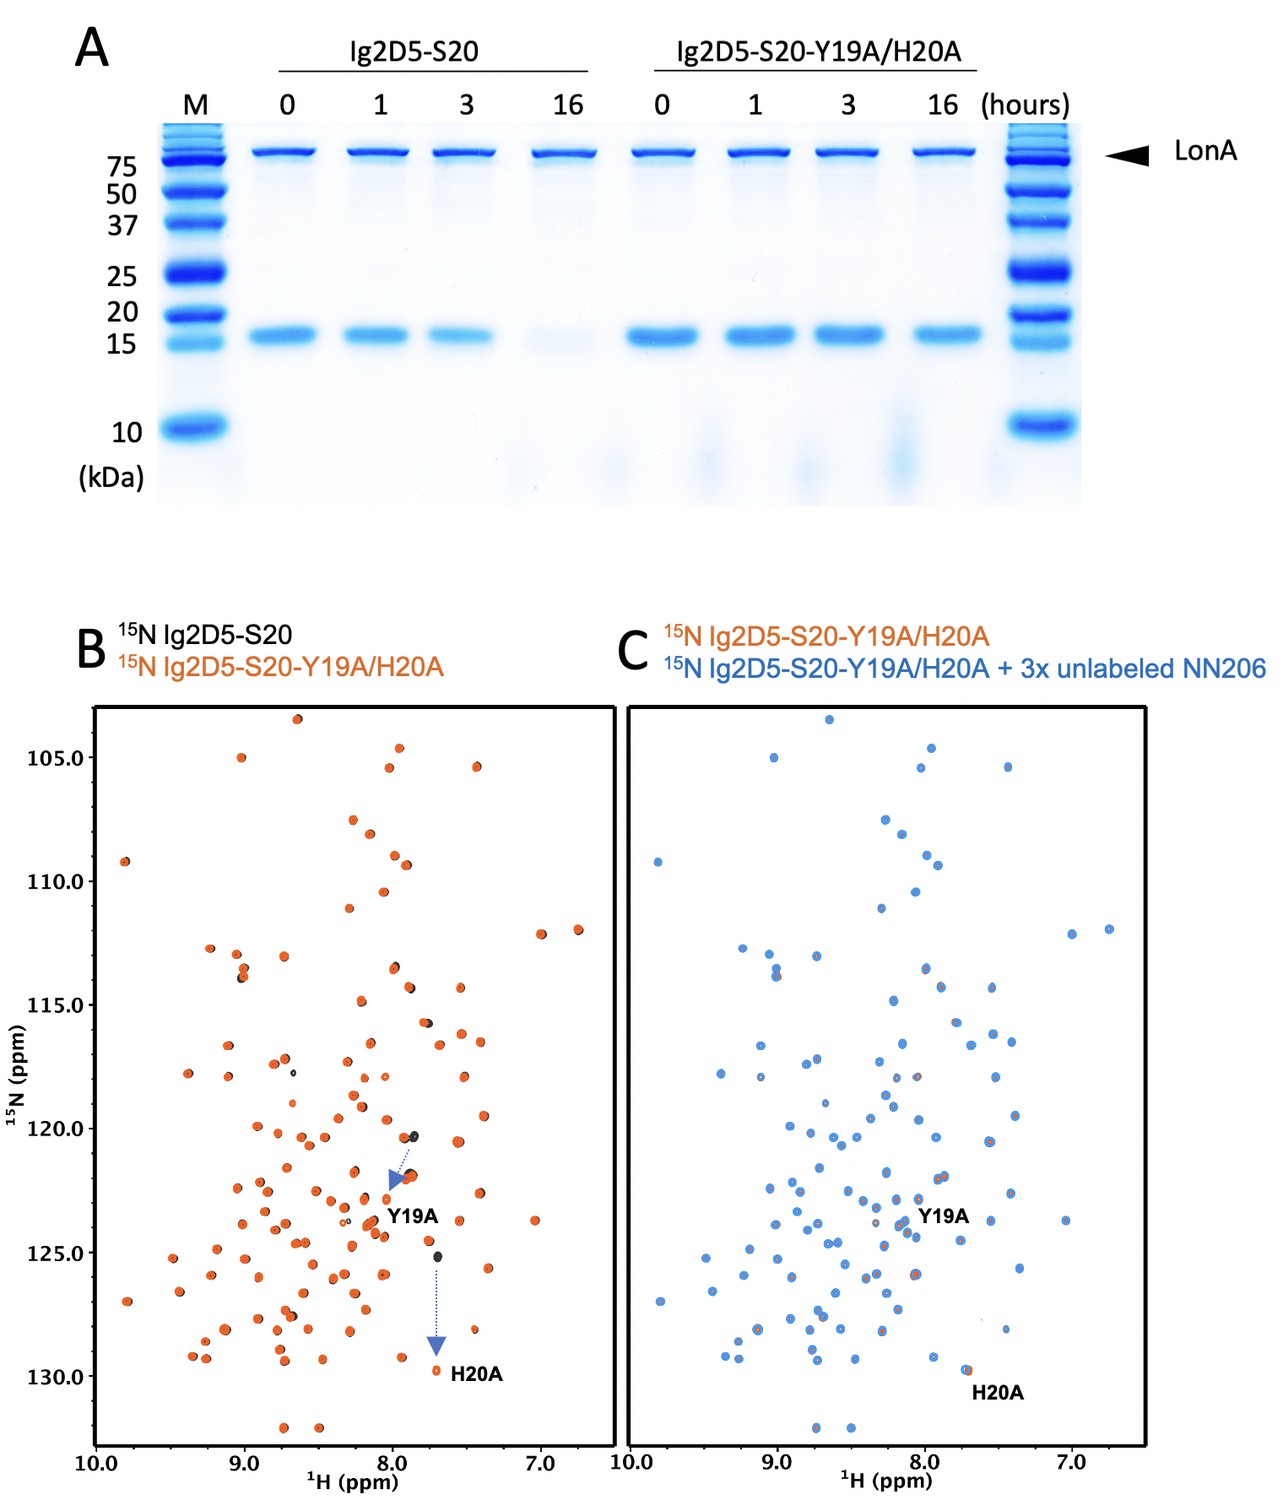
Interaction of Y19A/H20A double mutant of Sul20 tag with MtaLonA NTD.
(A) Degradation of 4 μM Ig2D5-S20 or Ig2D5-S20-Y19A/H20A by 0.067 μM (hexamer) of full-length MtaLonA (FL) at 42°C. (B) Overlay of 1H–15N TROSY-HSQC spectra of Ig2D5-S20 (black) and Ig2D5-S20-Y19A/H20A (orange). (C) Overlay of 1H–15N TROSY-HSQC spectra of 50 μM 15N-labeled Ig2D5-S20-Y19A/H20A (orange) after addition of 150 μM unlabled NN206 (blue) recorded at 32°C.
Figure 5 with 2 supplements
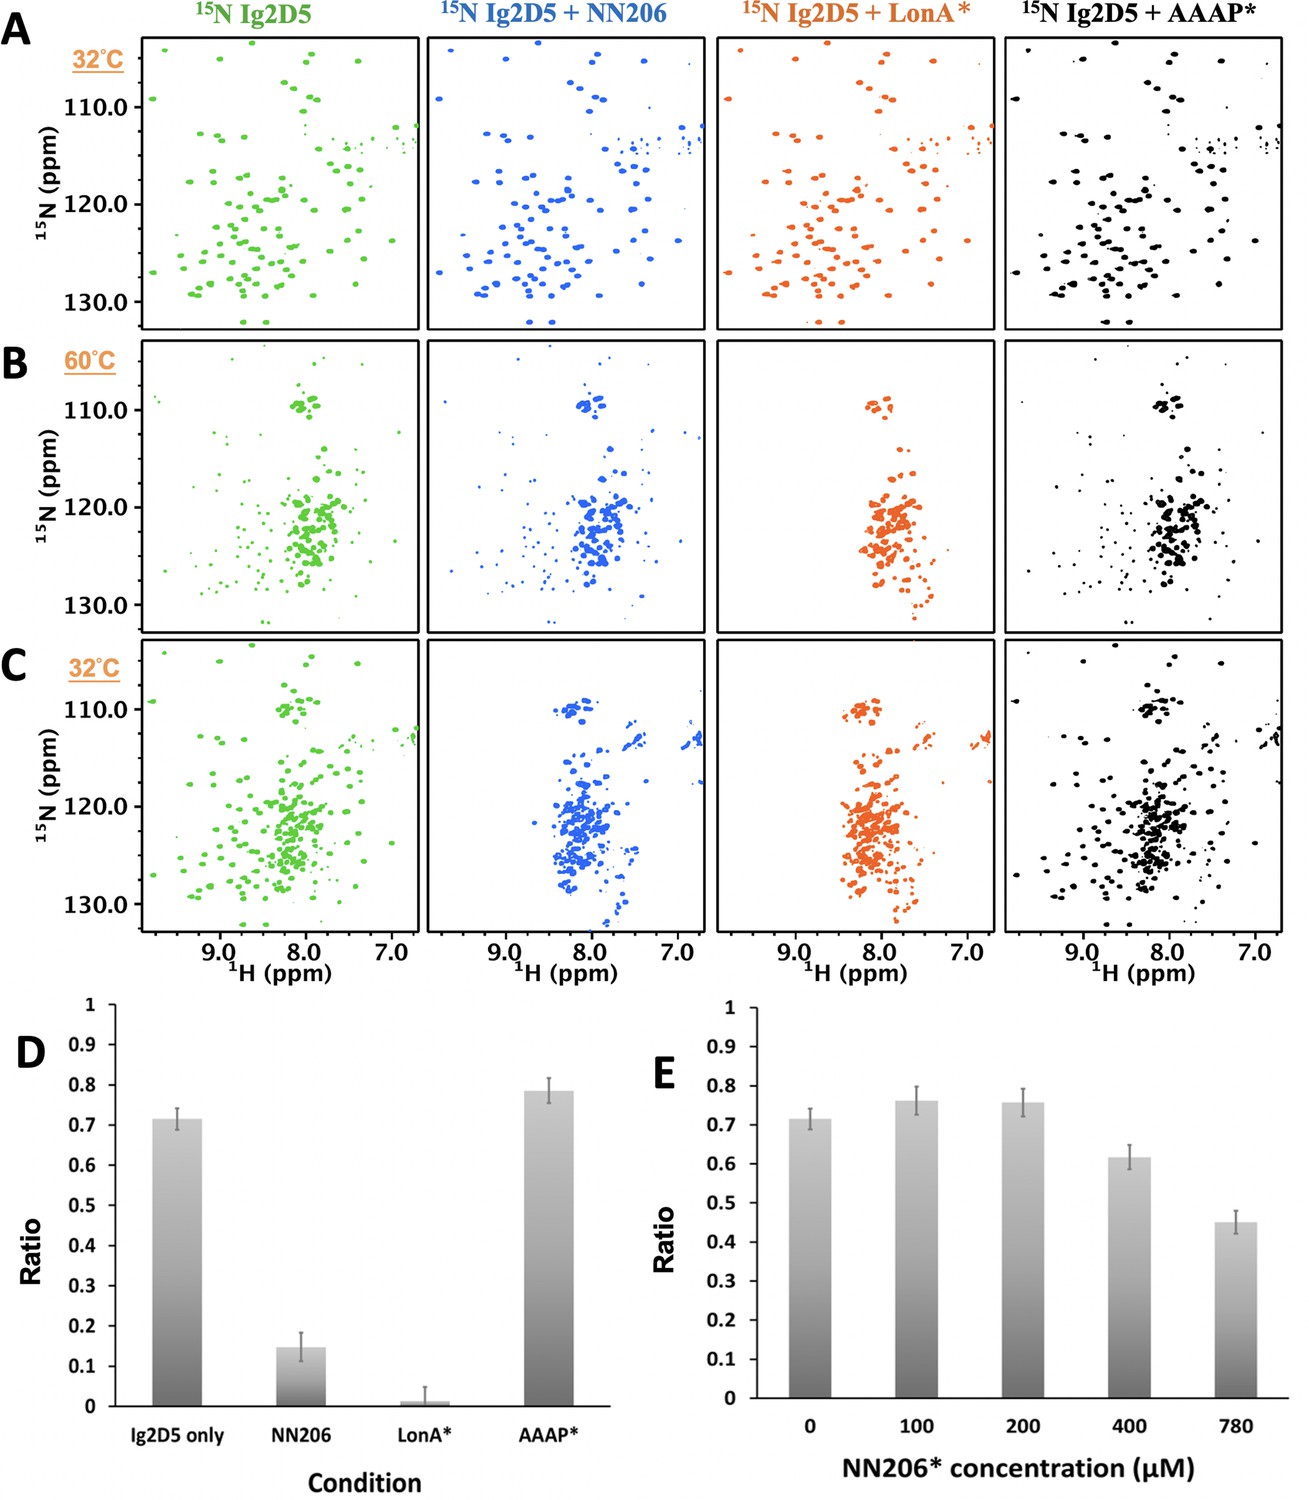
The unfolding-refolding of Ig2D5 is affected in the presence of MtaLonA NTDs.
2D 1H-15N TROSY-HSQC NMR spectra of Ig2D5 in the absence (green) and presence of NN206 (blue), LonA* (full-length MtaLonA with catalytic mutant S678A; coloured orange), or AAAP* (residues 242–793 with catalytic mutant S678A; coloured black) recorded through one thermal cycle starting from 32°C (A) to 60°C (B), and then returning to 32°C (C). (D) Folded ratios of Ig2D5 in the absence and presence of NN206, LonA* or AAAP* after one thermal cycle. (E) Folded ratios of apo Ig2D5 and Ig2D5 titrated with different concentrations of NN206* after one thermal cycle.
Figure 5—figure supplement 1
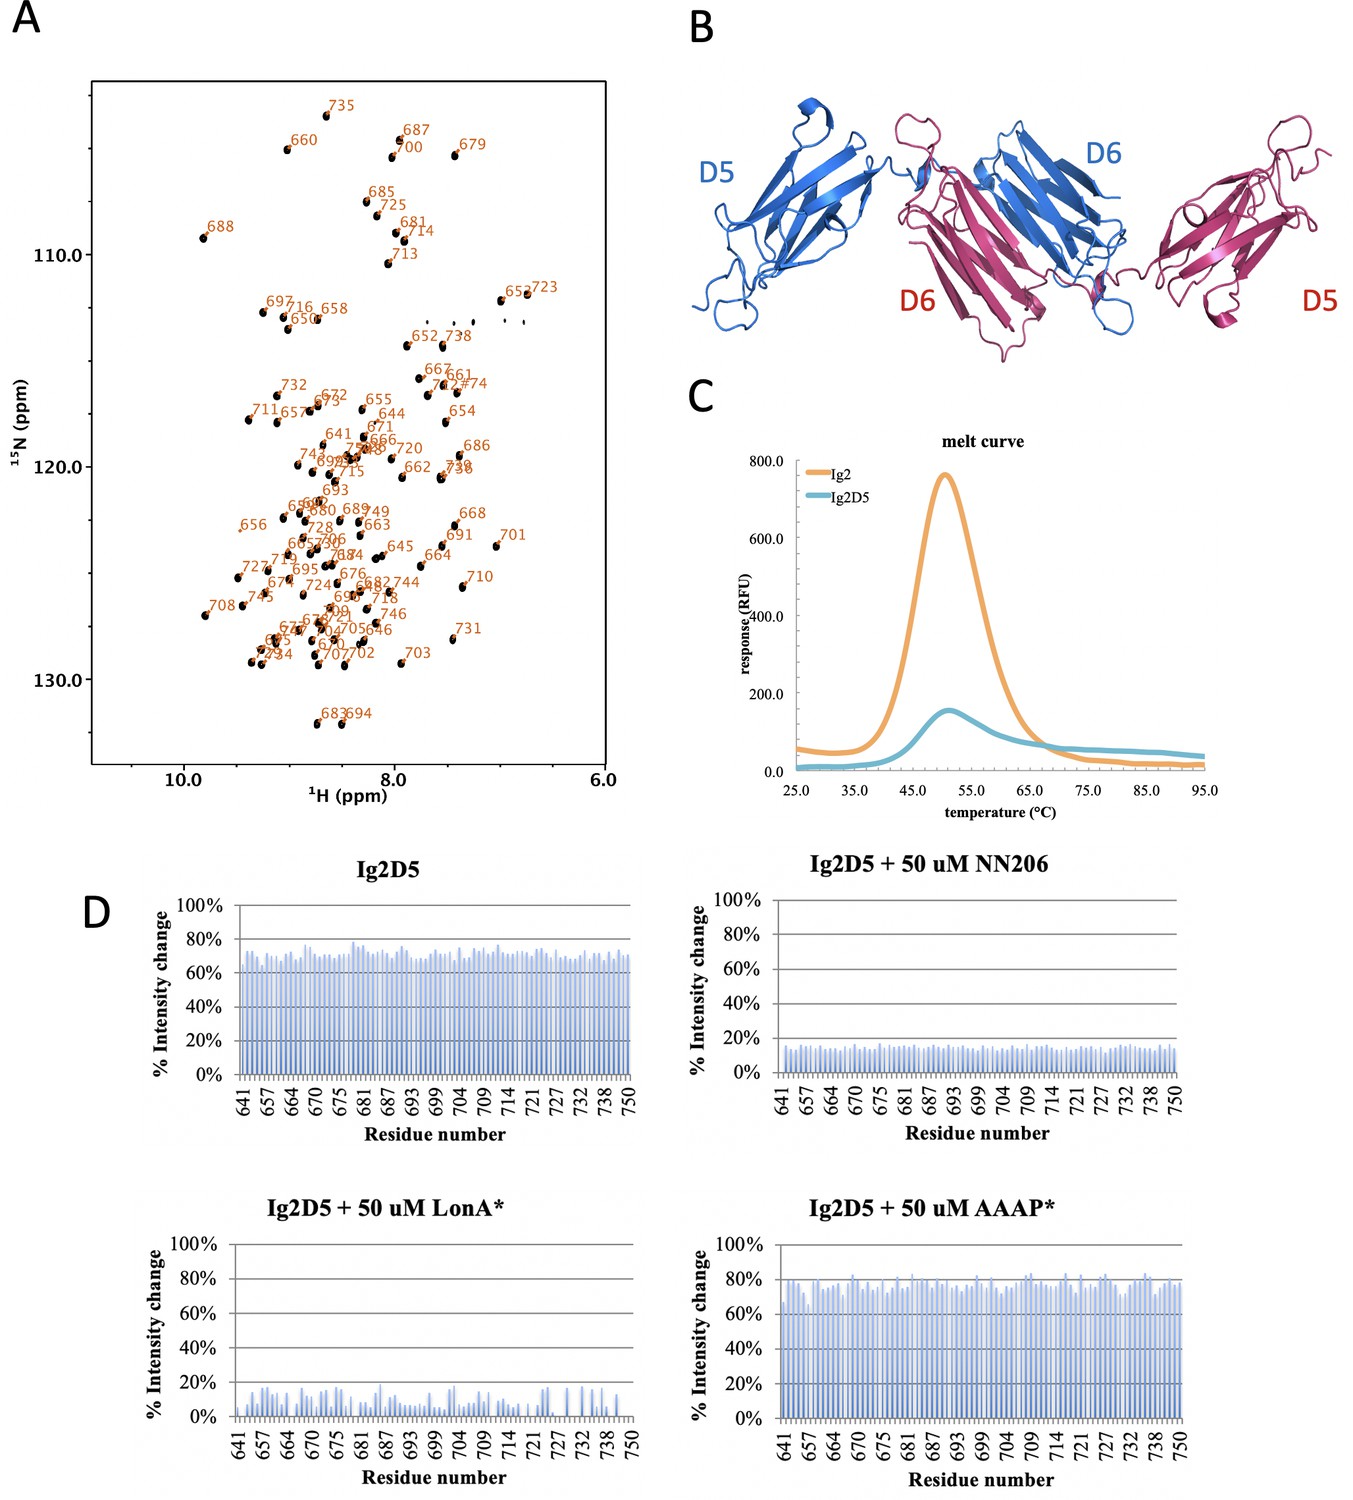
Biophysical characterization of Ig2D5.
(A) 2D 1H-15N TROSY-HSQC NMR spectrum of Ig2D5 (black): backbone amide resonances are labeled according to residue number. (B) Domains 5 and 6 of the gelation factor ABP-120 from Dictyostelium discoideum (PDB code:1QFH). (C) The Tm of substrate Ig2D5 is similar to Ig2. (D) Intensity ratio plots are against selected residue.
Figure 5—figure supplement 2
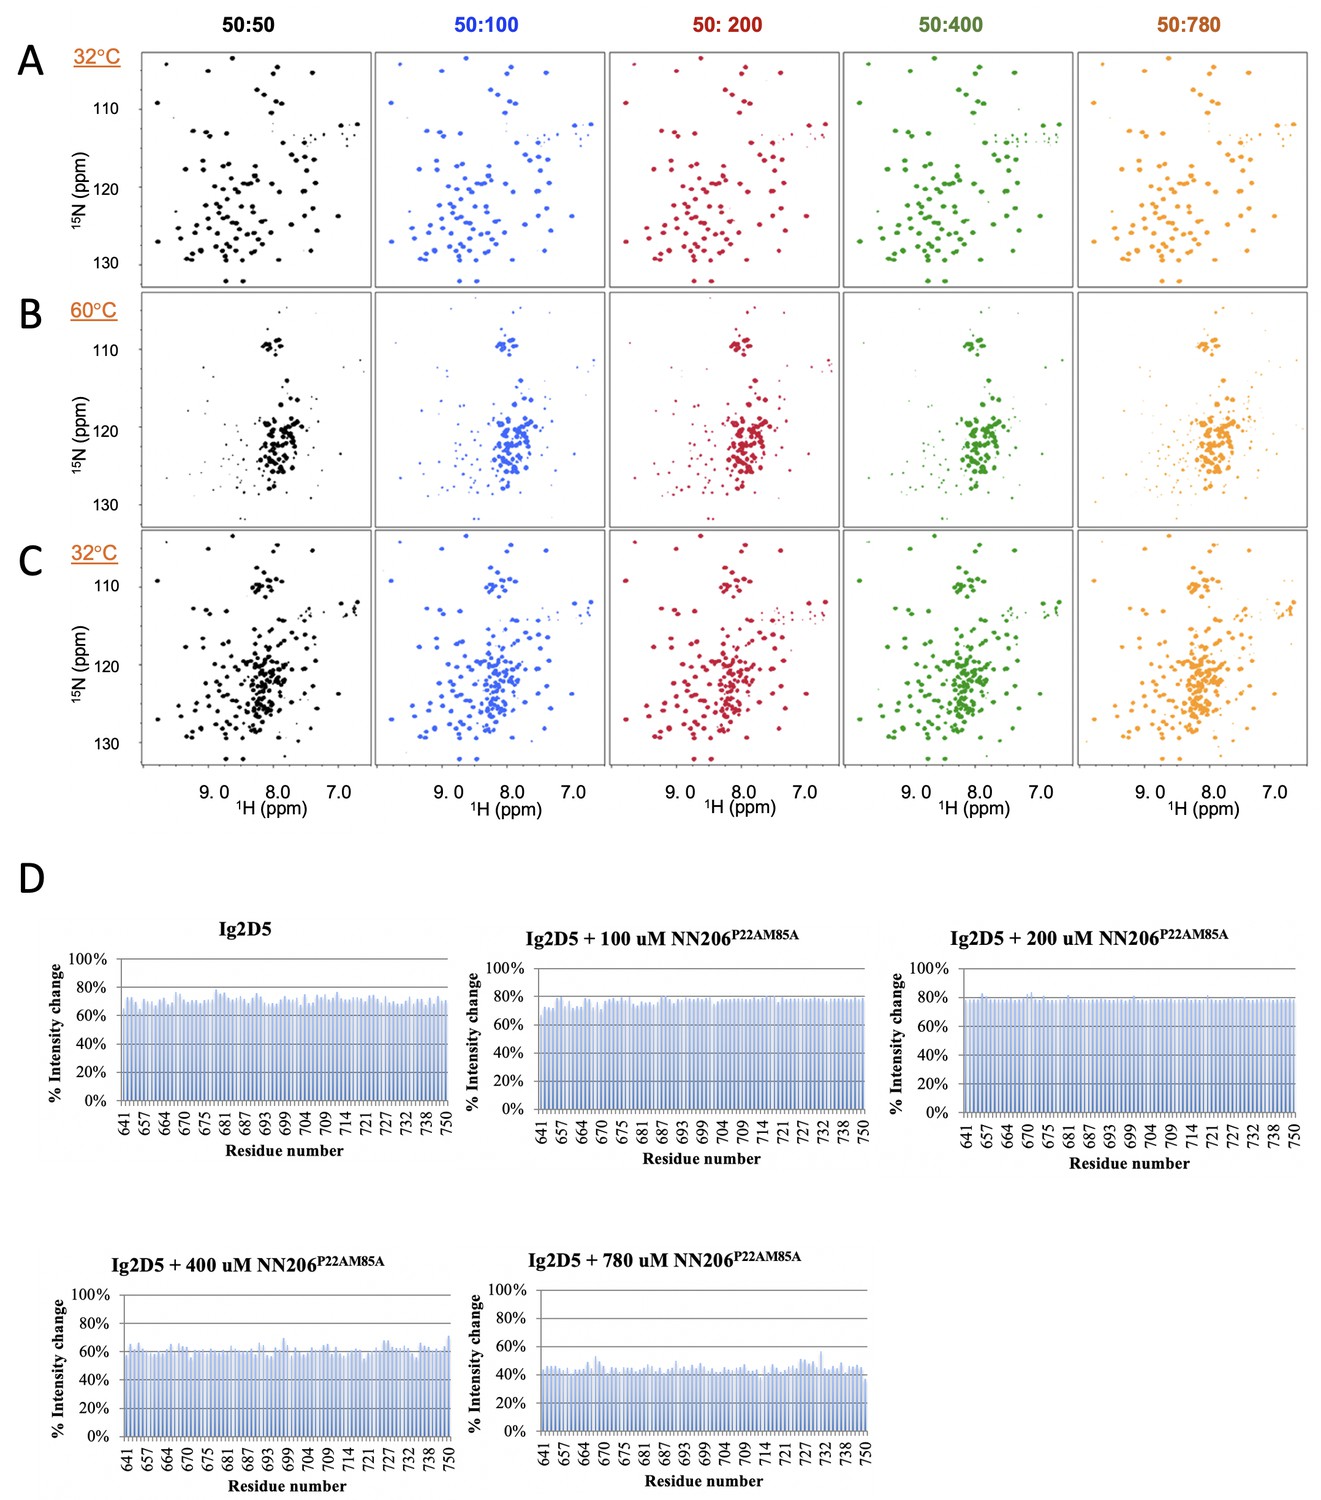
The unfolding-refolding of Ig2D5 in the presence of NN206*.
(A) 2D 1H-15N TROSY-HSQC NMR spectra of Ig2D5 titrated with 50 (black), 100 (blue), 200 (red), 400 (green), or 780 (orange) µM NN206* were recorded during one thermal cycle starting from 32 (A) to 60°C (B), and then returning to 32°C (C). (D) Folded ratio of apo Ig2D5, Ig2D5 titrated with different concentrations of NN206* after one thermal cycle. Intensity ratio plots are against selected residues.
Figure 6 with 1 supplement

The NTD of MtaLonA selectively interacts with unfolded proteins, protein aggregates, and degron-tagged proteins via two hydrophobic patches of its N-lobe.
(A) Based on the titration data, two hydrophobic patches at the N-lobe of MtaLonA are defined as follows: (1) L10, V14, I15, P22, V23, and M85 (termed hpI in the following); (2) M75, L77, P78, and L82 (termed hpII). (B) The hydrophobic patches at the N-lobes of EcLonA NTD are also identified as follows: (1) hpI: L16, V20, V21, P28, L29, and L91; (2) hpII: L81, L83, P84, and V88. (C) The Hp I and II of BsLonA are shown as follows: (1) hpI: L14, L17, L18, V19, V24, L25, L27, and L89; (2) hpII: L79, L81, P82, and I86. (D) Merged Hp I and II of MacLonA are shown as follows: (1) hpI: V12, I16, V17, V22, P24, I25, L66, and V79; (2) hpII: I71, A72, and A77. The conserved hydrophobic patches at the N-lobes may be potentially responsible for conferring substrate selectivity toward damaged proteins and degrons. The PDB codes are indicated in parentheses.
Figure 6—figure supplement 1
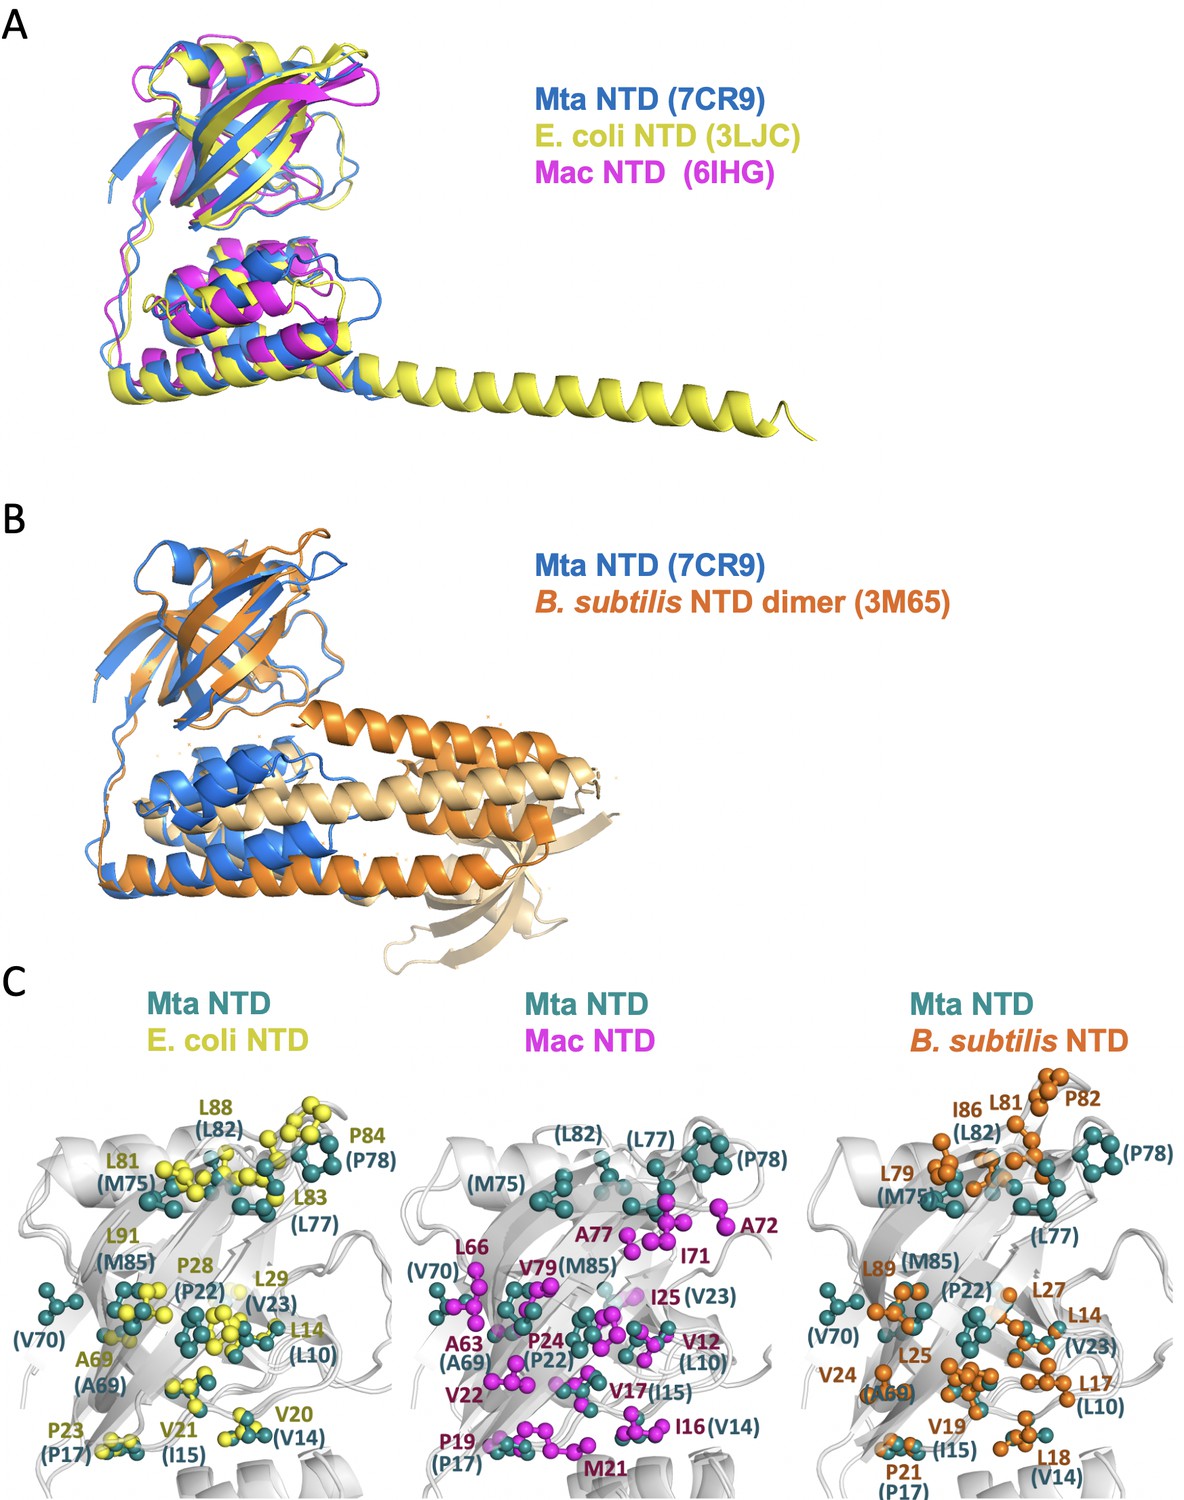
Structural superposition of the N-terminal fragments from MtaLon, EcLon, MacLon, and BsLon.
(A) The structures of the N-terminal fragments from MtaLon, EcLon, and MacLon showed that the N- and the C-lobes are joined together via a short linker. The PDB codes are indicated in parentheses. (B) The N-terminal fragment from B. subtilis LonA was previously reported to adopt a domain-swapped dimer where the N-lobe of one monomer is positioned next to the C-lobe of the other monomer. (C) All four structures exhibit highly similar hydrophobic patches at the N-lobes of their NTD.
Figure 7
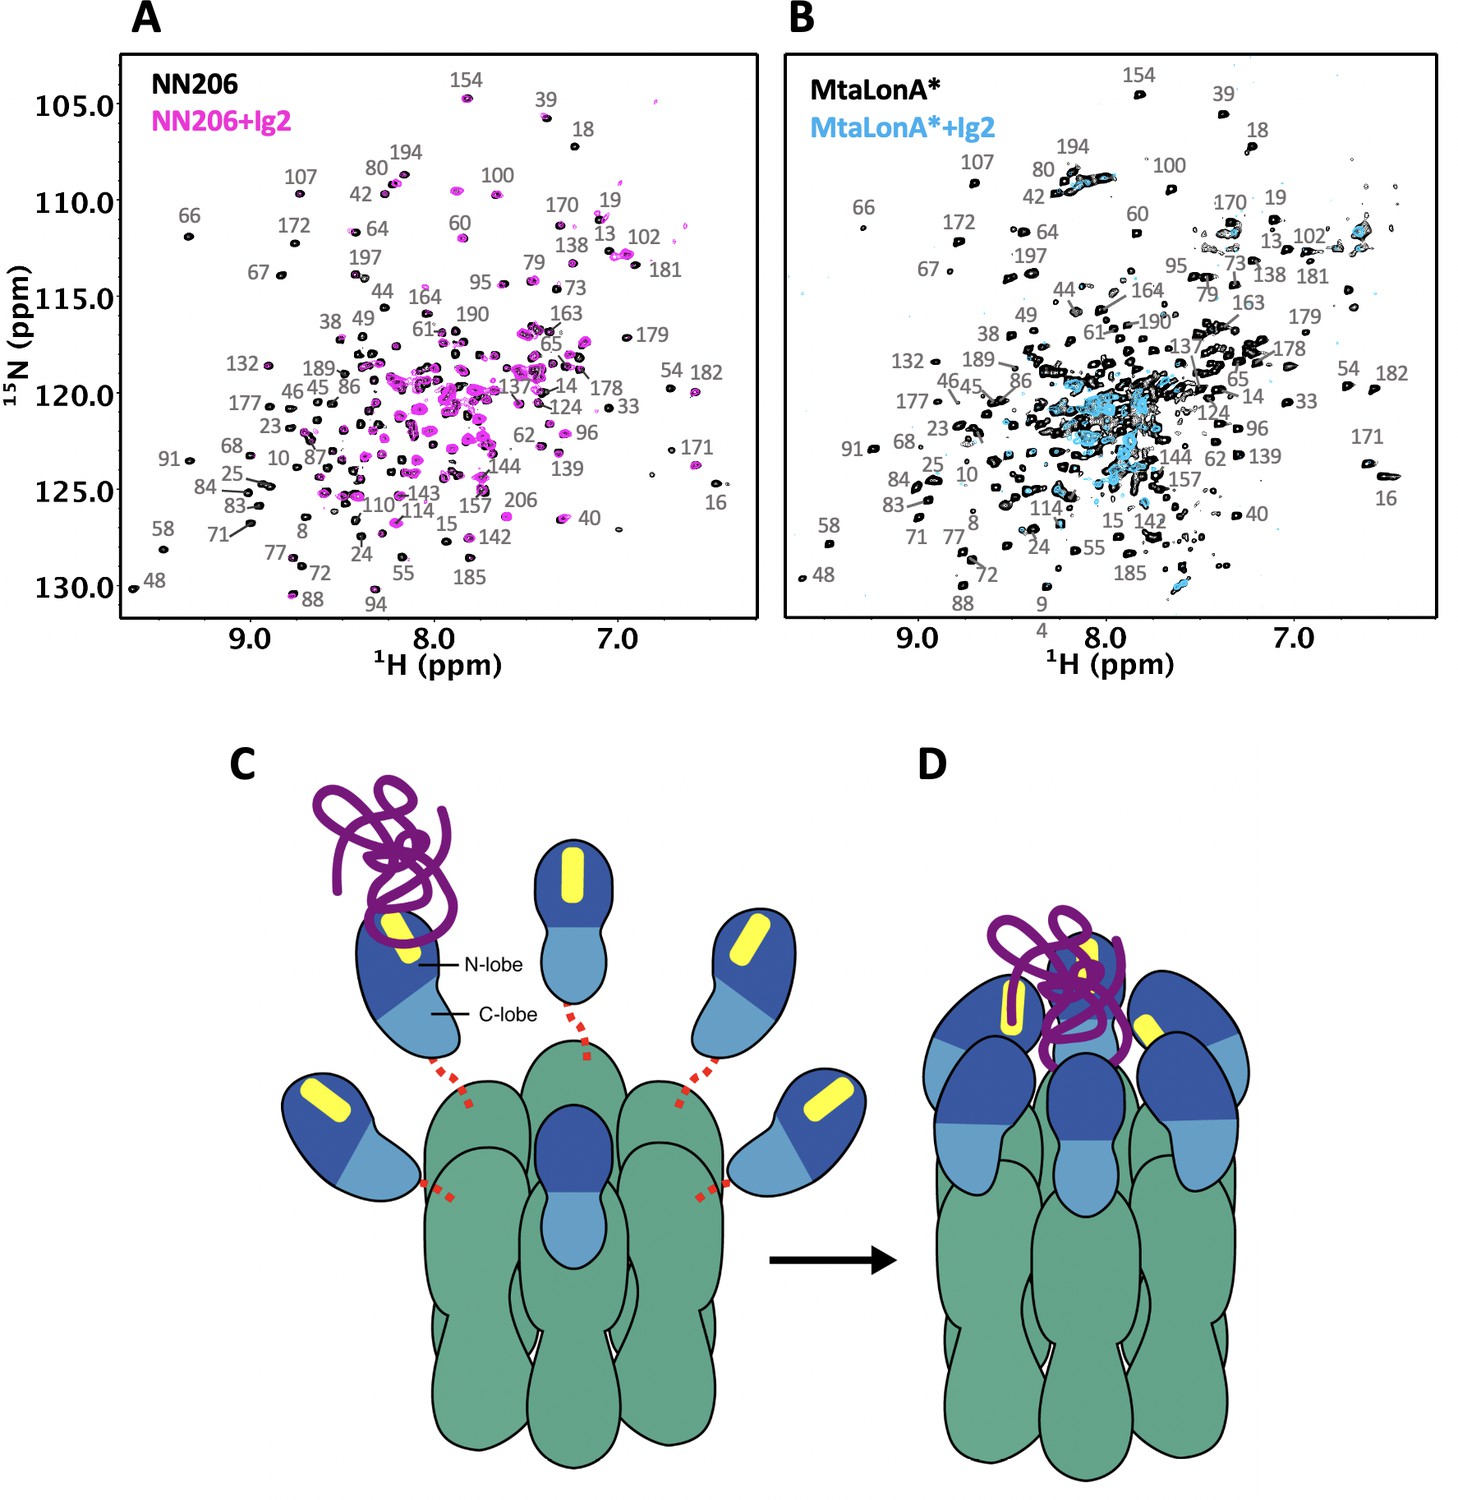
Proposed model for NTD-mediated substrate interaction.
(A) 1H–15N TROSY-HSQC spectra of protonated 15N-labeled NTD in the absence (black) and presence (magenta) of unlabeled Ig2 recorded at 55°C. (B) 1H–15N TROSY-HSQC spectra of highly deuterated 15N-labled LonA* in the absence (black) and presence (blue) of unlabeled Ig2 recorded at 55°C. (C) The flexibly linked NTD of the hexametric LonA is swaying from side to side and back and forth to survey, recognize, and trap substrates with exposed hydrophobic sequences. Substrate, N-lobe, C-lobe, and the ATPase–Protease chamber are illustrated in purple, marine, blue, and green colors, respectively. The substrate-binding patches are depicted in yellow. Dashed lines represent the flexible linker regions. (D) After initial binding, other NTDs may join to increase the avidity of the LonA–substrate interaction. The substrate polypeptide chain is pulled inside the chamber and undergoes proteolysis by protease modules of LonA.
Tables
Table 1
Data collection and refinement statistics.
| NN206 | NN291 | |
|---|---|---|
| PDB entry | 7CR9 | 7CRA |
| Data collection | ||
| Space group | P212121 | P6322 |
| Cell dimensions | ||
| a, b, c (Å) | 32.830, 58.296, 198.492 | 86.016, 86.016, 110.126 |
| α, β, γ (°) | 90, 90, 90 | 90, 90, 120 |
| Resolution (Å) | 30–2.09 (2.16–2.09)* | 30–1.7 (1.76–1.7) |
| Rmerge | 0.106 (0.937) | 0.069 (0.779) |
| I/σI | 17.9 (3.0) | 49.1 (4.7) |
| Completeness (%) | 99.7 (100) | 100 (100) |
| Redundancy | 6.5 (6.6) | 20.9 (21.4) |
| Refinement | ||
| Resolution (Å) | 29.409–2.1 (2.149–2.1) | 30–1.7 (1.744–1.7) |
| Rwork/Rfree | 0.209/0.249 | 0.197/0.237 |
| No. atoms | ||
| Protein Ligand (SO42−) | 3285 0 | 1684 10 |
| Water | 107 | 244 |
| B-factors | ||
| Protein Ligand (SO42−) | 53.14 | 16.18 27.45 |
| Water | 52.66 | 28.21 |
| R.m.s deviations | ||
| Bond lengths (Å) | 0.004 | 0.009 |
| Bond angles (°) | 0.74 | 1.34 |
| Ramachandran | ||
| Favored (%) | 96.81 | 96.67 |
| Allowed (%) | 2.46 | 2.38 |
| Outliers (%) | 0.74 | 0.95 |
-
Number of crystals for each structure should be noted in footnote.
*Highest resolution shell is shown in parentheses.
Key resources table
| Reagent type (species) or resource | Designation | Source or reference | Identifiers | Additional information |
|---|---|---|---|---|
| Peptide | Sul20 peptide (Sequence: ASSHATRQLSGLKIHSNLYH) | GenScript (https://www.genscript.com/) | at > 95% purity | |
| Strain, strain background (Escherichia coli) | BL21(DE3) | Novagen | ||
| Plasmid | pET-NN206 | This paper | ||
| Plasmid | pET-NN243 | This paper | ||
| Plasmid | pET-NN291 | This paper | ||
| Plasmid | pET-MtaLon | Reference 18 | ||
| Plasmid | pET-AAAP | Reference 18 | ||
| Plasmid | pET-MtaLon* | Reference 18 | ||
| Plasmid | pET-AAAP* | Reference 18 | ||
| Plasmid | pET-NN206* | This paper | ||
| Plasmid | pET-Ig2 | This paper | ||
| Plasmid | pET-Ig2D5 | This paper | ||
| Plasmid | pET-Ig2D5-S20 | This paper | ||
| Plasmid | pET-Ig2D5-S20-Y19A/H20A | This paper | A Y19A/H20A double mutant in Ig2D5-S20 construct | |
| Software, algorithm | PyMOL | https://pymol.org/2/ | RRID:SCR_000305 | |
| Software, algorithm | CARA | http://cara.nmr.ch/doku.php | ||
| Software, algorithm | NMRPipe | https://www.ibbr.umd.edu/nmrpipe/install.html | ||
| Software, algorithm | NMRView | http://www.onemoonscientific.com | ||
| Sequence-based reagent | Ig2D5-Sul20 Y19AH20A_F | This paper | PCR primers | TGGTGCTCGAGTTAGGCGGCCAGGTTAGAGTGGAT |
| Sequence-based reagent | Ig2D5-Sul20 Y19AH20A_R | This paper | PCR primers | ATCCACTCTAACCTGGCCGCCTAACTCGAGCACCA |
| Sequence-based reagent | NN206 P22A_F | This paper | PCR primers | CCACGTCCACCGCGGTGGTGGTGTG |
| Sequence-based reagent | NN206 P22A_R | This paper | PCR primers | CACACCACCACCGCGGTGGACGTGG |
| Sequence-based reagent | NN206 M85A_F | This paper | PCR primers | CCGGGCTTCCACCGCGACCTGCAGGGTG |
| Sequence-based reagent | NN206 M85A_R | This paper | PCR primers | CACCCTGCAGGTCGCGGTGGAAGCCCGG |
Additional files
Download links
A two-part list of links to download the article, or parts of the article, in various formats.
Downloads (link to download the article as PDF)
Open citations (links to open the citations from this article in various online reference manager services)
Cite this article (links to download the citations from this article in formats compatible with various reference manager tools)
Molecular insights into substrate recognition and discrimination by the N-terminal domain of Lon AAA+ protease
eLife 10:e64056.
https://doi.org/10.7554/eLife.64056


