Structural determinants of voltage-gating properties in calcium channels
- Department of Physiology and Medical Physics, Medical University Innsbruck, Austria
- Department of General, Inorganic and Theoretical Chemistry, University of Innsbruck, Austria
- Department of Pharmacology and Toxicology, Institute of Pharmacy and Center for Molecular Biosciences, University of Innsbruck, Austria
Figures
Figure 1 with 2 supplements
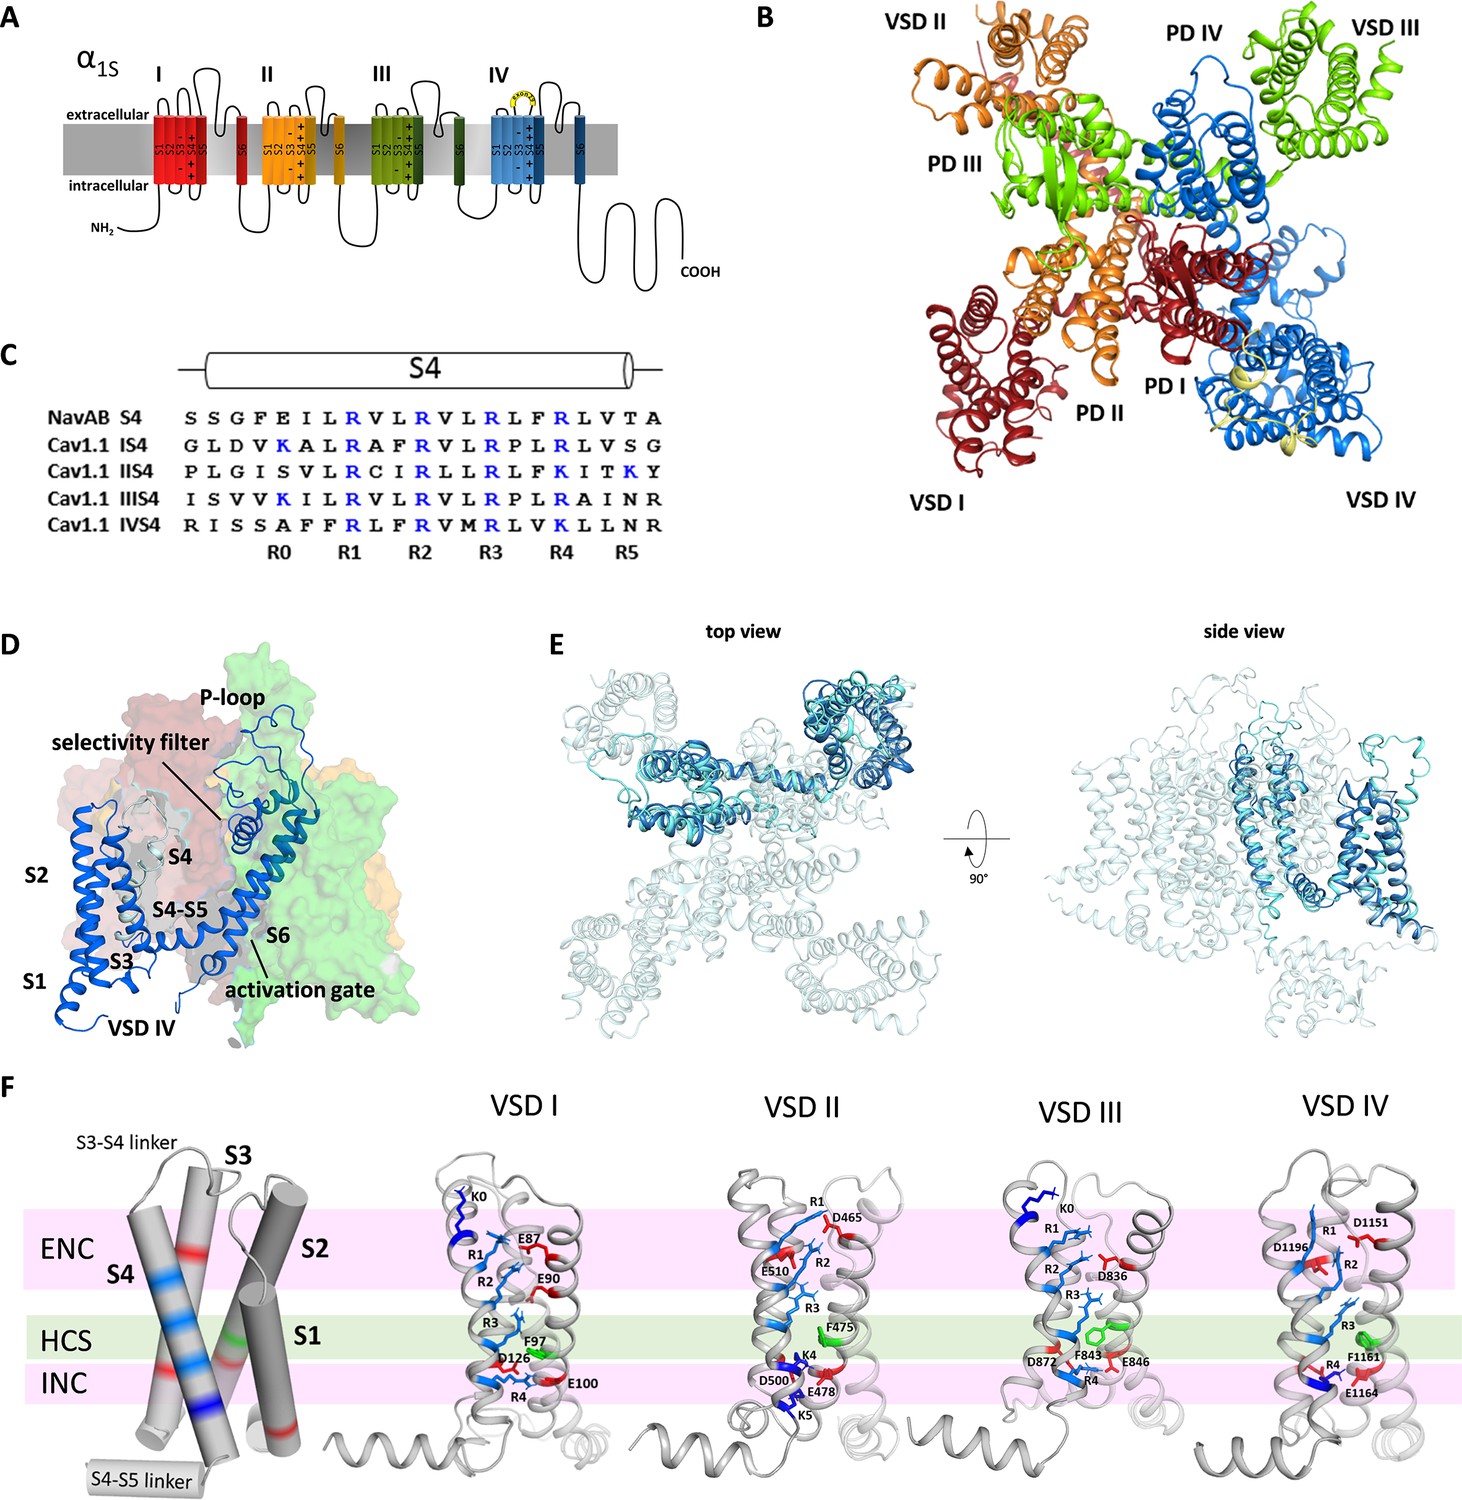
Structure model of the hetero-tetrameric human CaV1.1.
(A) Domain structure of eukaryotic CaV channels. (B) Structure model of the human CaV1.1 α1 subunit (top view; color code as in A) refined with molecular dynamics (MD) simulation in a membrane environment (see 'Materials and methods') based on the 3.6 Å structure of rabbit CaV1.1 (Pan et al., 2018; Wu et al., 2016). (C) Sequence alignment of the S4 helices of each CaV1.1 voltage sensing domain (VSD) compared to the homo-tetrameric NaVAb; gating charges (R, K) are indicated in blue. (D) Structure of a single repeat (IV) within the space-filling model of CaV1.1. (E) Structural overlay of NaVAb with VSD IV of CaV1.1. (F) Cylindrical representation of the VSD structure showing the positive gating charges in S4 (blue) and countercharges (red) of the intra- and extracellular negative clusters (INC, ENC) in S1, S2, and S3. The phenylalanine in S2, marking the hydrophobic constriction site (HCS), is indicated in green. Ribbon models of the four VSDs of CaV1.1 in the up-state, showing the side chains of the S4 gating charges (R, light blue; K, dark blue) and their putative ion-pair partners (red). Note that the numbers and positions of the ion-pair interactions in the ENC differ between the VSDs.
Figure 1—figure supplement 1
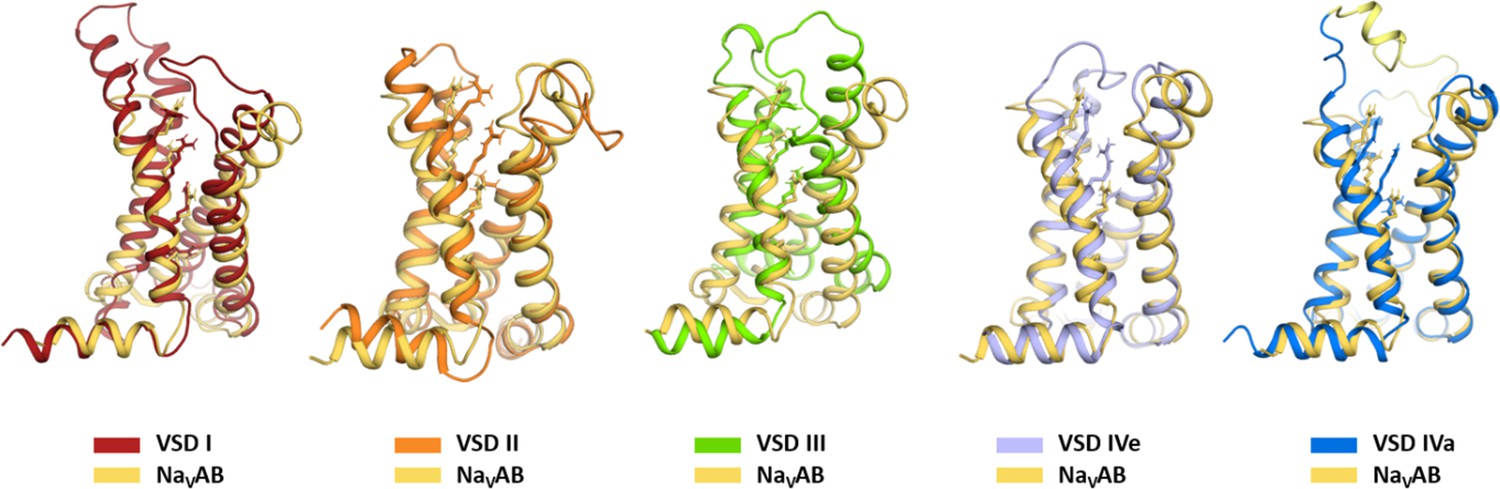
Structure comparison of the four voltage sensing domains (VSDs) of CaV1.1 with the VSD of NaVAb.
Comparison of the individual four VSDs of CaV1.1 with the VSD of NaVAb (Payandeh et al., 2011) illustrates the overall similarity with the ancestral channel. At the same time highlights the structural differences between the CaV1.1 VSDs. NaVAb, orange; CaV1.1 VSD are color-coded according to Figure 1A; exon 29 in the S3-S4 linker of VSD IVa is shown in yellow.
Figure 1—figure supplement 2
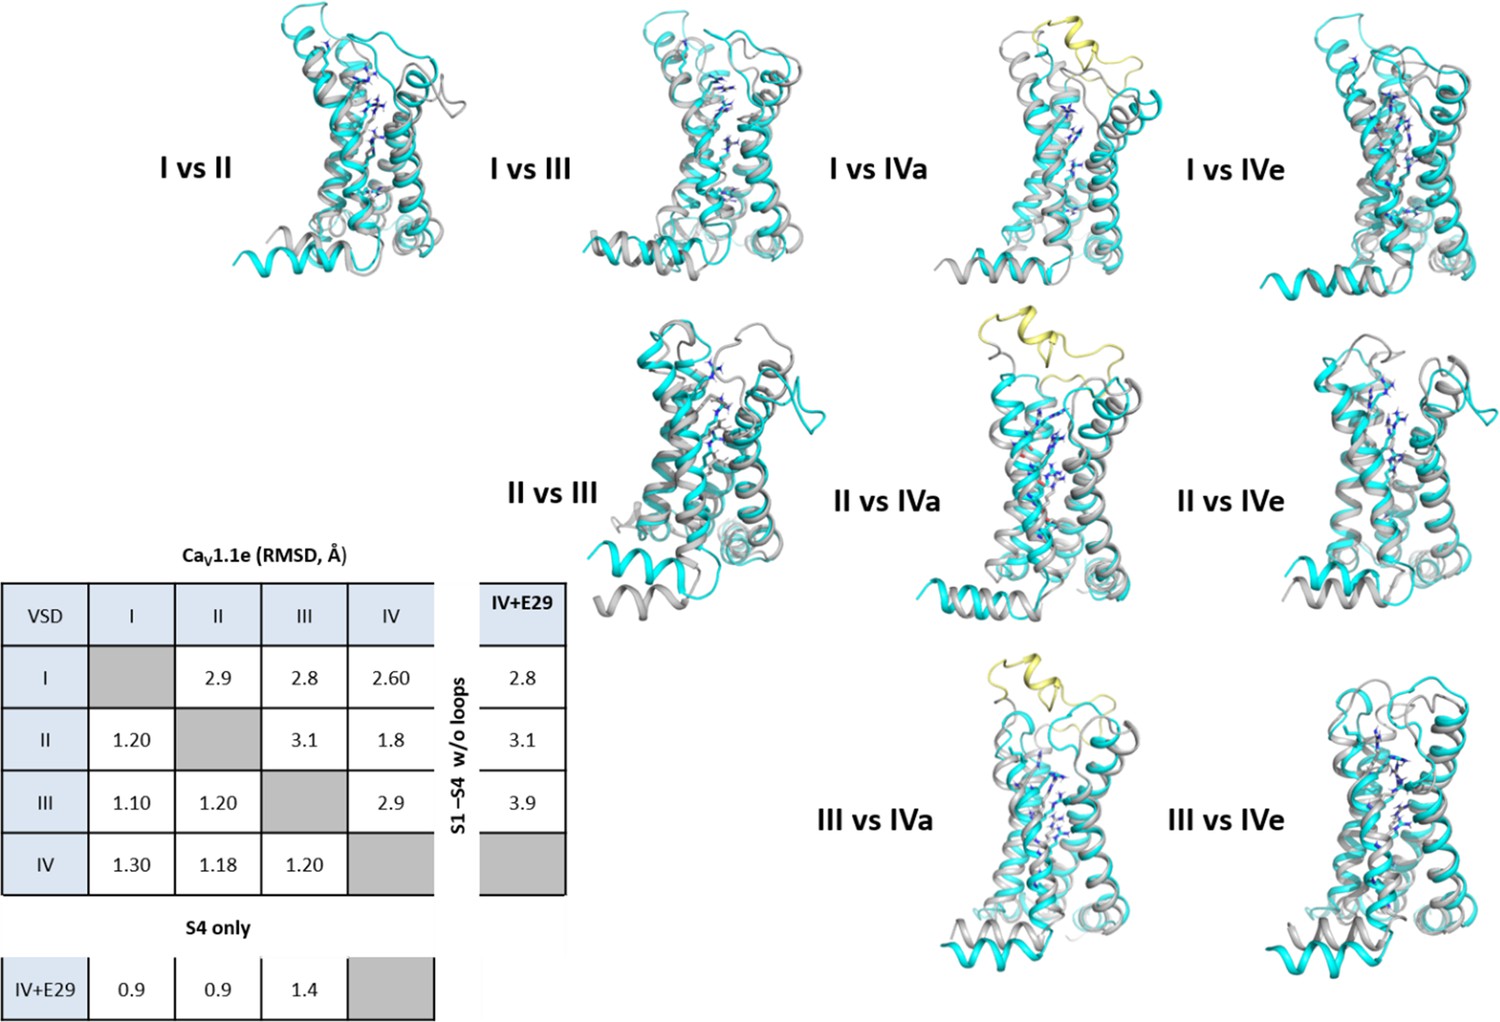
Structure comparison between the four voltage sensing domains (VSDs) of CaV1.1.
Structural overlay of all four VSDs with each other to visualize the structural differences between each VSD. The first mentioned of each pair is shown in turquoise, the second in gray; exon 29 in the IVS3-S4 loop is shown in yellow. The root-mean-square deviation (RMSD) values calculated of the VSDs without loops indicate the similarities of VSD I with VSD III, and of VSD II with VSD IV. Insertion of exon 29 in VSD IVa decreases its structural similarity with the other VSDs.
Figure 2 with 5 supplements
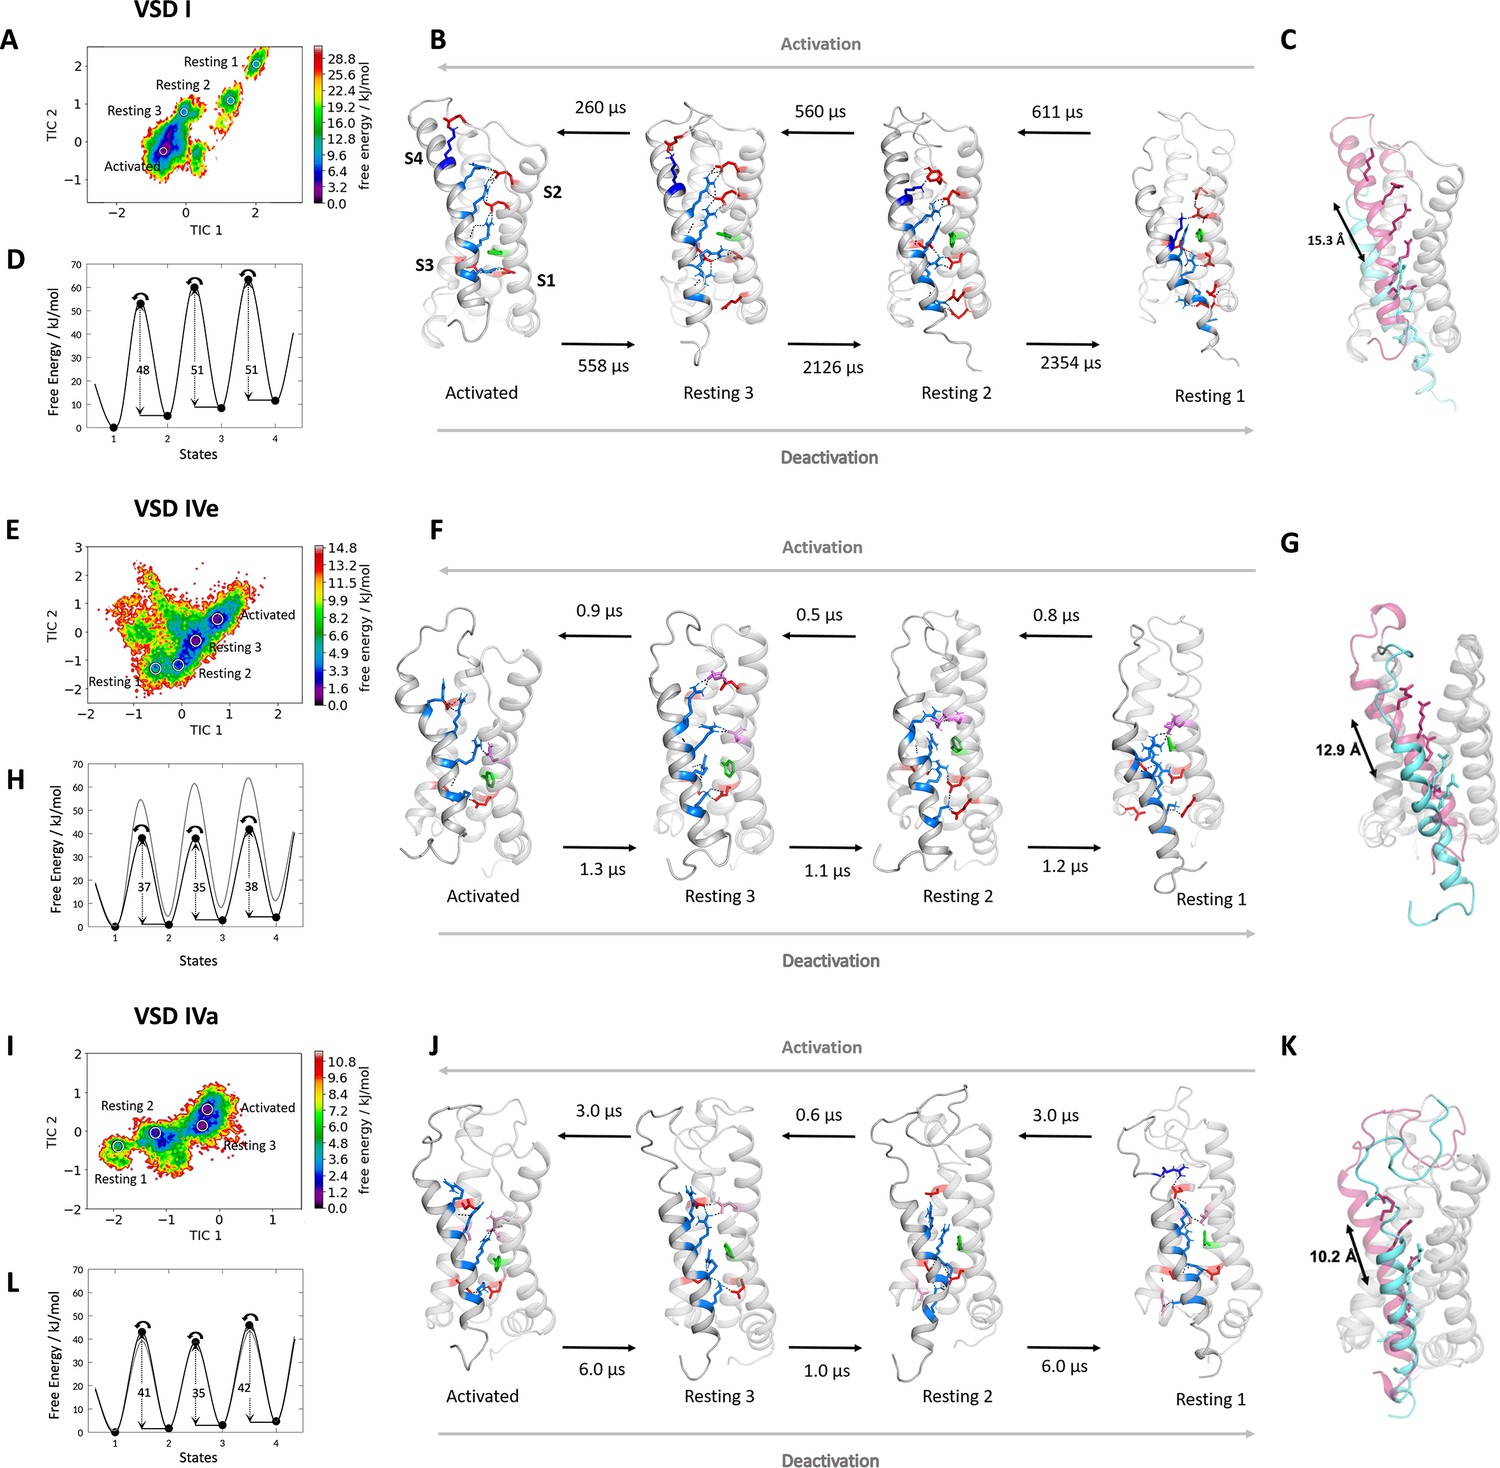
Molecular dynamics (MD) simulation and kinetics of voltage sensor transitions of voltage sensing domains (VSDs) I and IV with and without exon 29.
(A,E,I) The free energy surfaces of 5.0 µs trajectories of VSD I (A), VSD IV of CaV1.1e (E), and CaV1.1a including exon 29 (I) reconstructed in the time-lagged independent component analysis (tICA) coordinate space resulted in four macrostates. (B,F,J) Representative structures of each VSD in the four macrostates correspond to three resting and the activated states. The S4 gating charges (blue) show a sequential movement relative to the phenylalanine (green) in the hydrophobic constriction site (HCS) and stabilizing interactions with ion-pair partners (red) and H-bond donors/acceptors (pink) in the intracellular negative cluster (INC) and extracellular negative cluster (ENC). Transition kinetics (in µs) were calculated using a Markov state model. (C,G,K) Overlays of the activated (magenta) and resting state 1 (cyan) illustrating the maximum displacement of S4 during activation. (D,H,L) Schematic 1D representations of the free energy surface of VSD I (D), VSD IV of CaV1.1e (H), and CaV1.1a (L), with energy barriers calculated using transition state theory at 0 mV favoring the activated state. Gray trace in (H) shows free energy surface of (D) for comparison; gray trace in (L) shows free energy surface of (H) for comparison. Because in skeletal muscle cells, VSDs II and III probably control excitation-contraction coupling (Flucher, 2020; Flucher, 2016), and as their contribution to channel gating is less well understood, we did not include them in the present study.
Figure 2—figure supplement 1
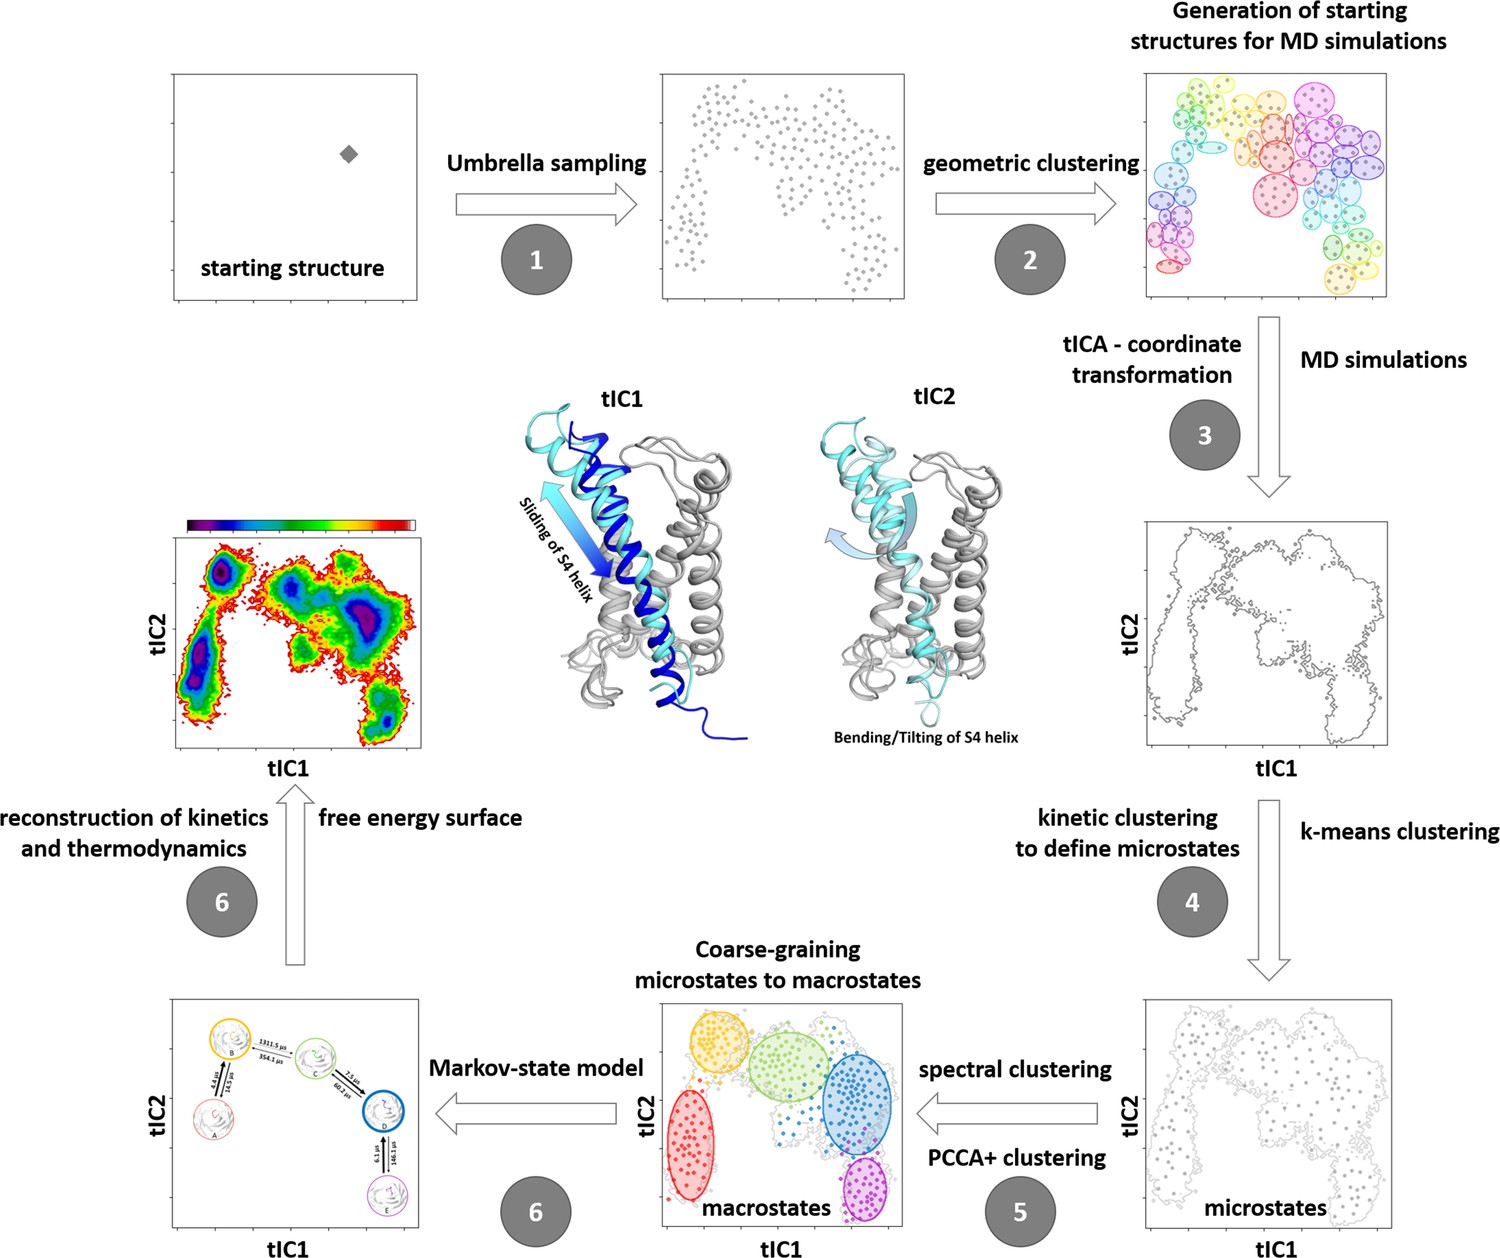
Schematic illustration of our robust protocol for describing and characterizing protein dynamics and statistically validating the results by constructing a Markov state model (MSM).
(1) We applied Umbrella sampling as enhanced sampling technique to overcome the timescale limitations of classical molecular dynamics with the aim of generating structurally diverse starting points for further molecular dynamics (MD) simulations along the putative activation pathway. (2) The resulting Umbrella trajectories were clustered geometrically resulting in the distinct starting structures for subsequent classical MD simulations. (3) The obtained trajectories (aggregated simulation time close to 5 µs) were used to construct a tICA (time-lagged independent component analysis). This kinetic coordinate system represents the basis for the MSM. The symbolic structures in the center show the movements represented by TIC1 and TIC2. (4) To allow subsequent MSM, the so-called microstates have to be identified by applying k-means clustering. (5) These microstates are coarse-grained into macrostates by performing spectral clustering. (6) The free energy surface and the transition times are obtained by including the resulting weights and probabilities of the MSM. Note that the figures represent schematic examples and not data from the present modeling.
Figure 2—figure supplement 2
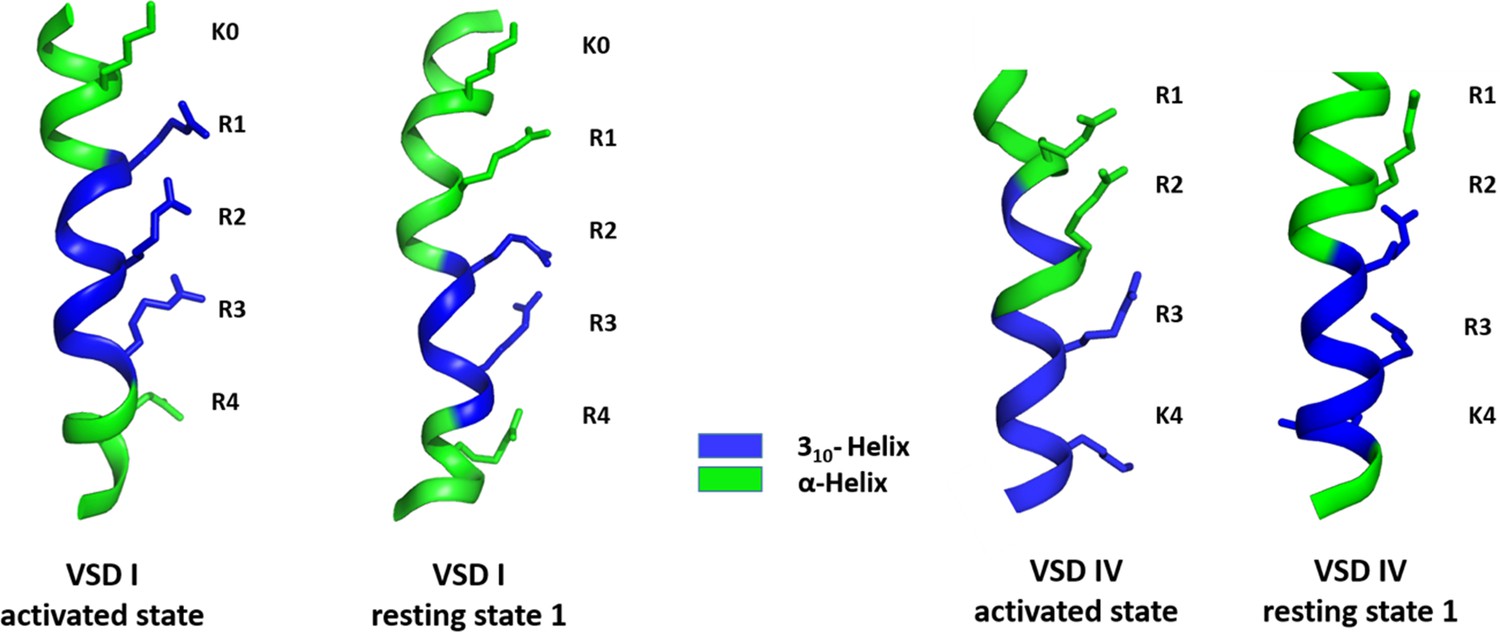
310-Helix content of the S4 helices of CaV1.1 voltage sensing domains (VSDs) I and IV in the activated and resting state 1.
As predicted by the sliding helix model ,the S4 helices of CaV1.1 VSD I (left) and VSD IV (right) assume a 310 helical conformation, thus aligning consecutive gating charges in one direction. The length and position of this 310 helical stretch differ between the two VSDs and between the activated and resting states.
Figure 2—figure supplement 3
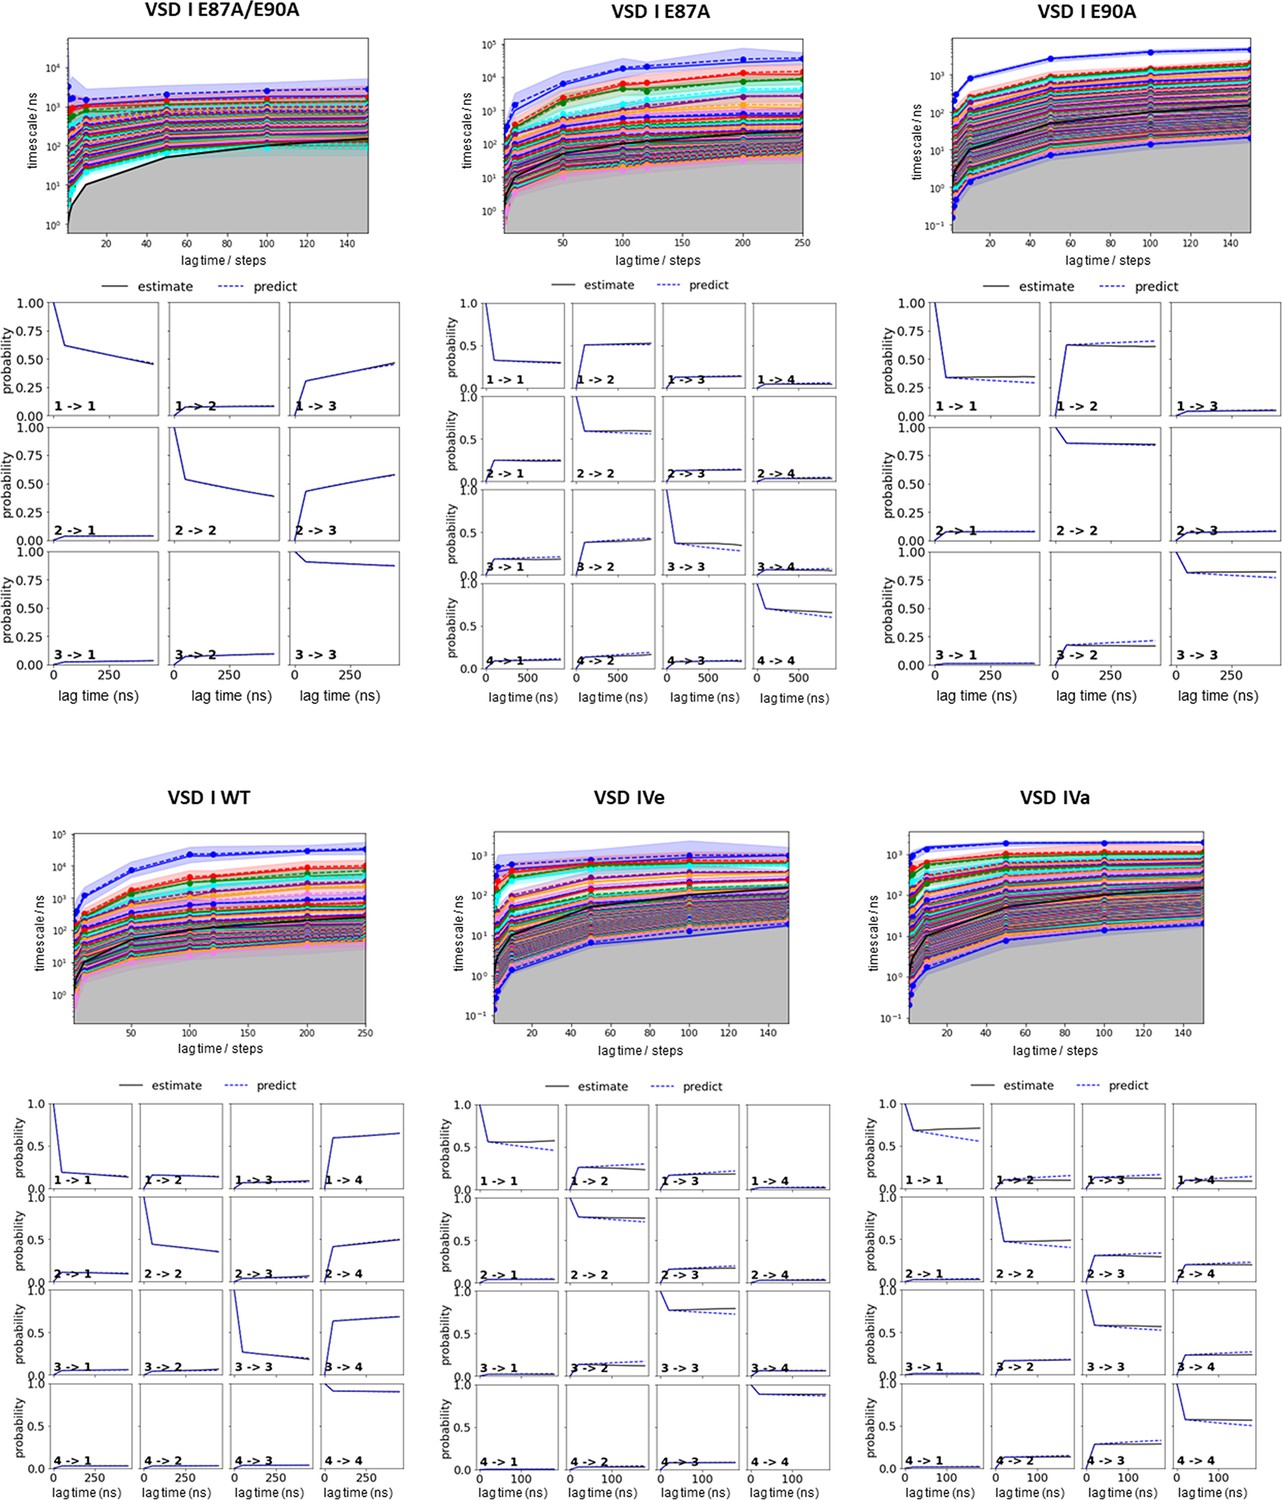
Parameter selection and validation of the Markov state models (MSMs) corresponding to the results presented in Figures 2, 4, and 5.
Implied timescales as function of lag time for each system (top). A lag time of 100 steps has been selected to build the MSM. The Chapman-Kolmogorov tests (bottom) for the respective MSM of each voltage sensing domain (VSD) demonstrate the reliability of our MSM. The individual panels of the Chapman-Kolmogorov tests show transitions between two states as labeled respectively. The x-axis denotes multiples of the lag time and the y-axis represents the probability. The plots show a comparison between MSMs estimated at higher lag times and depict extrapolations of the MSMs at a single lag time.
Figure 2—figure supplement 4
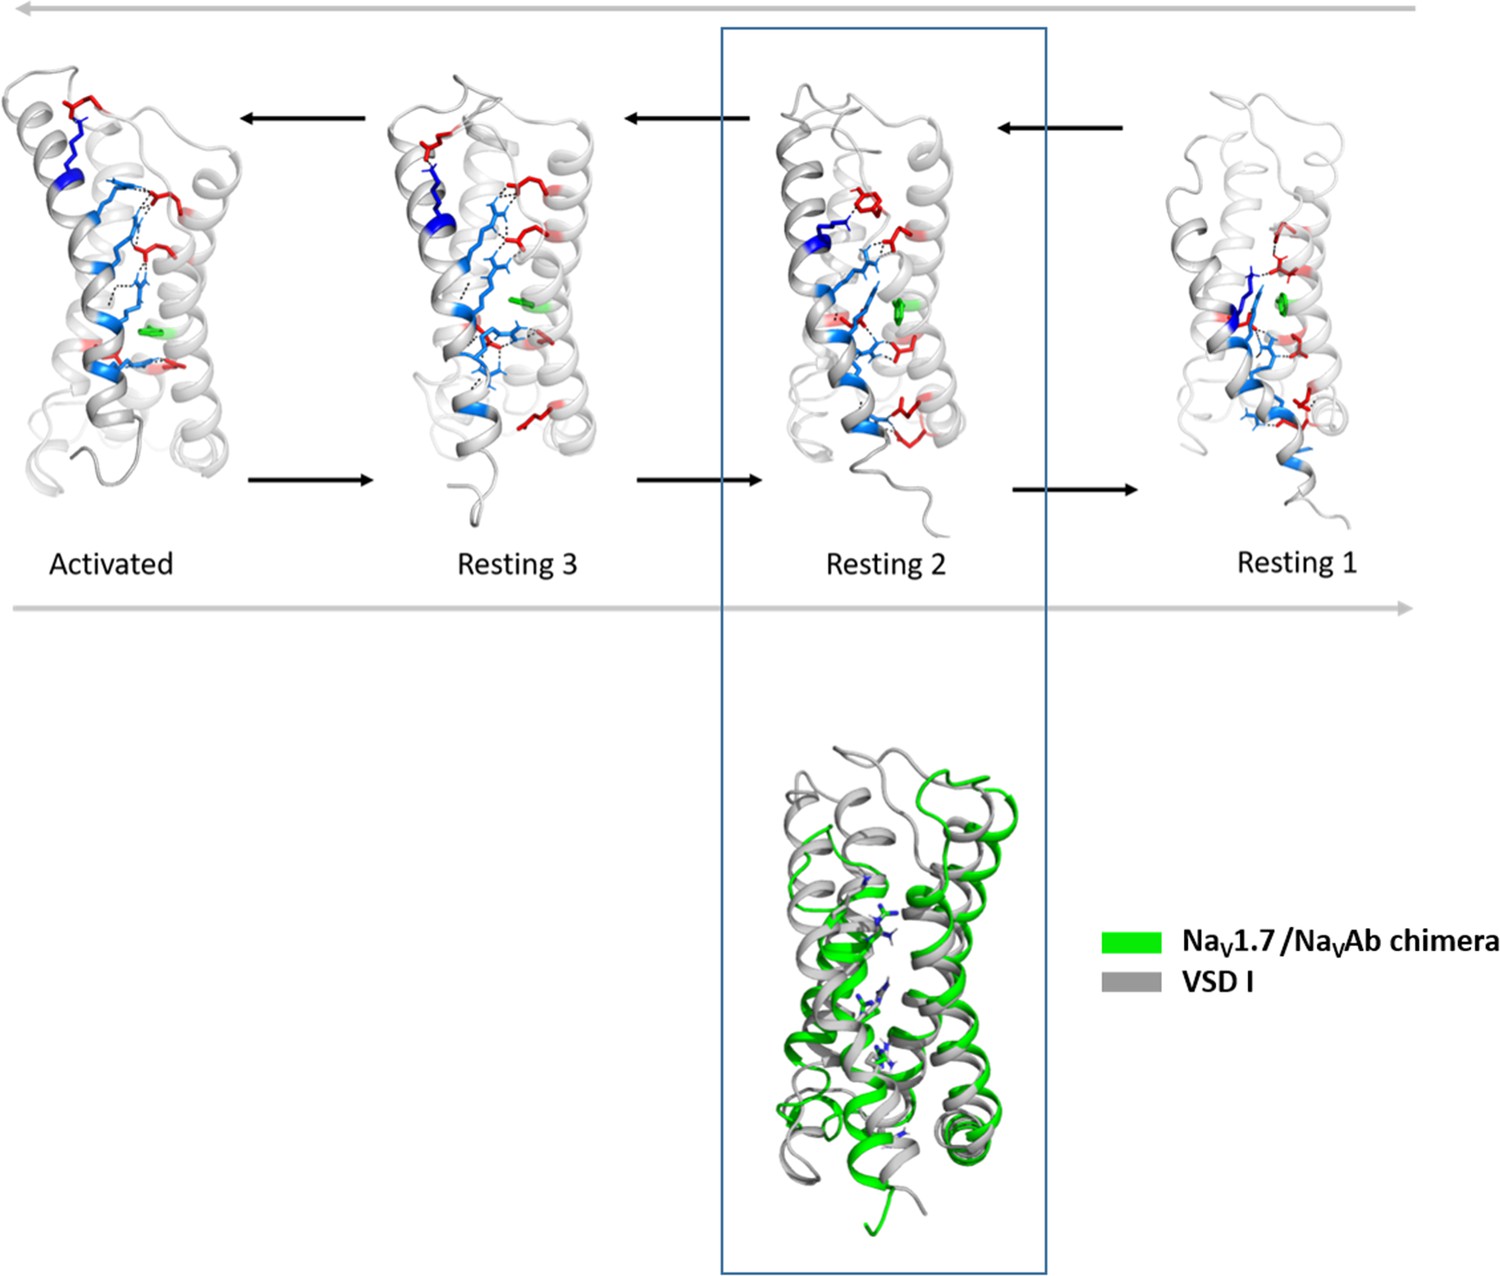
Structural comparison of the CaV1.1 voltage sensing domain (VSD) I resting states with the experimentally determined resting state structure of a NaV1.7/NaVAb chimera.
Comparison of the cryo-electron microscopy (cryo-EM) structure of VSD II of NaV1.7/NaVAb stabilized in a resting state by toxin binding (PDB accession code 6N4R) (Xu et al., 2019) (green), with the resting states of CaV1.1 VSD I obtained by our molecular dynamics (MD) simulation. We observed the highest structural similarity of the VSD II of NaV1.7/NaVAb with our resting state 2 (gray) (Cα root-mean-square deviation [RMSD] of 1.9 Å).
Figure 2—figure supplement 5
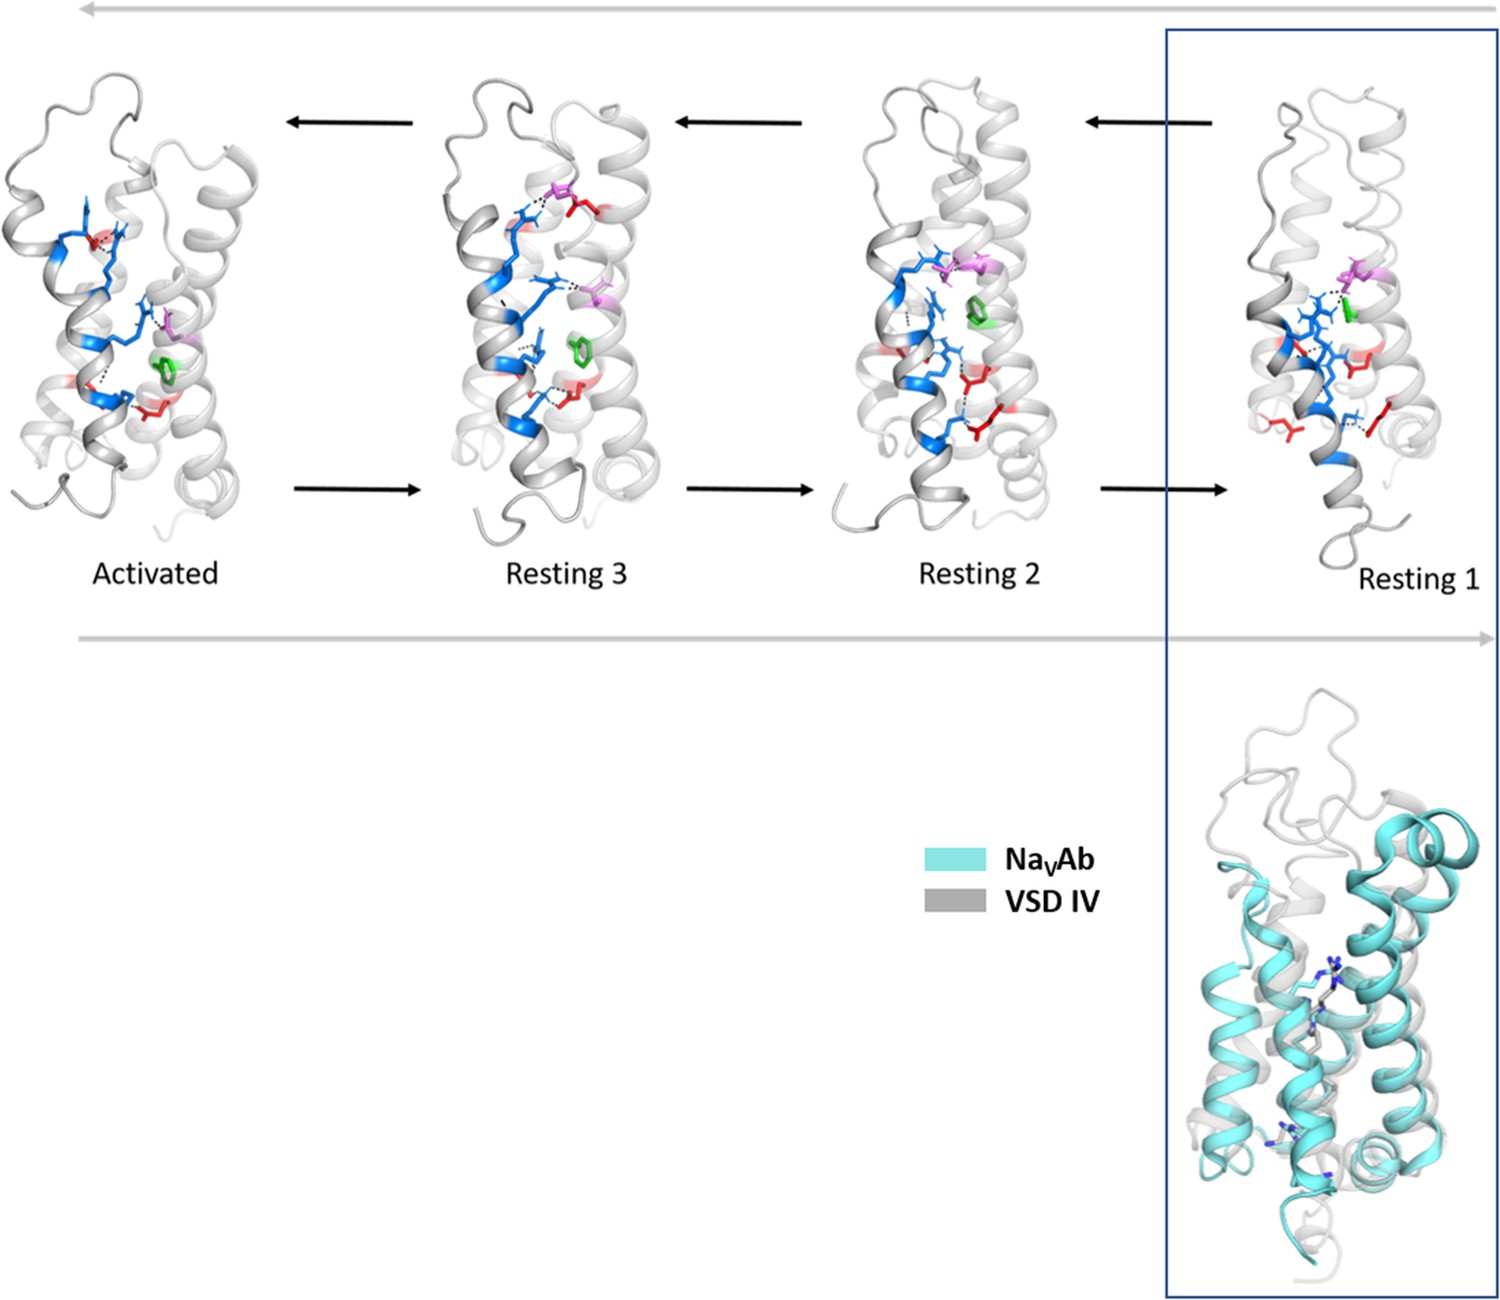
Structural comparison of the CaV1.1 voltage sensing domain (VSD) IV resting states with the experimentally determined resting state structure of NaVAb.
Comparison of the cryo-electron microscopy (cryo-EM) structure of VSD of NaVAb stabilized in a resting state by toxin binding (PDB accession code 6P6W) (Wisedchaisri et al., 2019) (cyan), with the resting states of CaV1.1 VSD IV obtained by our molecular dynamics (MD) simulation. We observed the highest structural similarity of the NaVAb VSD with our resting state 1 (gray) (Cα root-mean-square deviation [RMSD] of 1.7 Å).
Figure 3
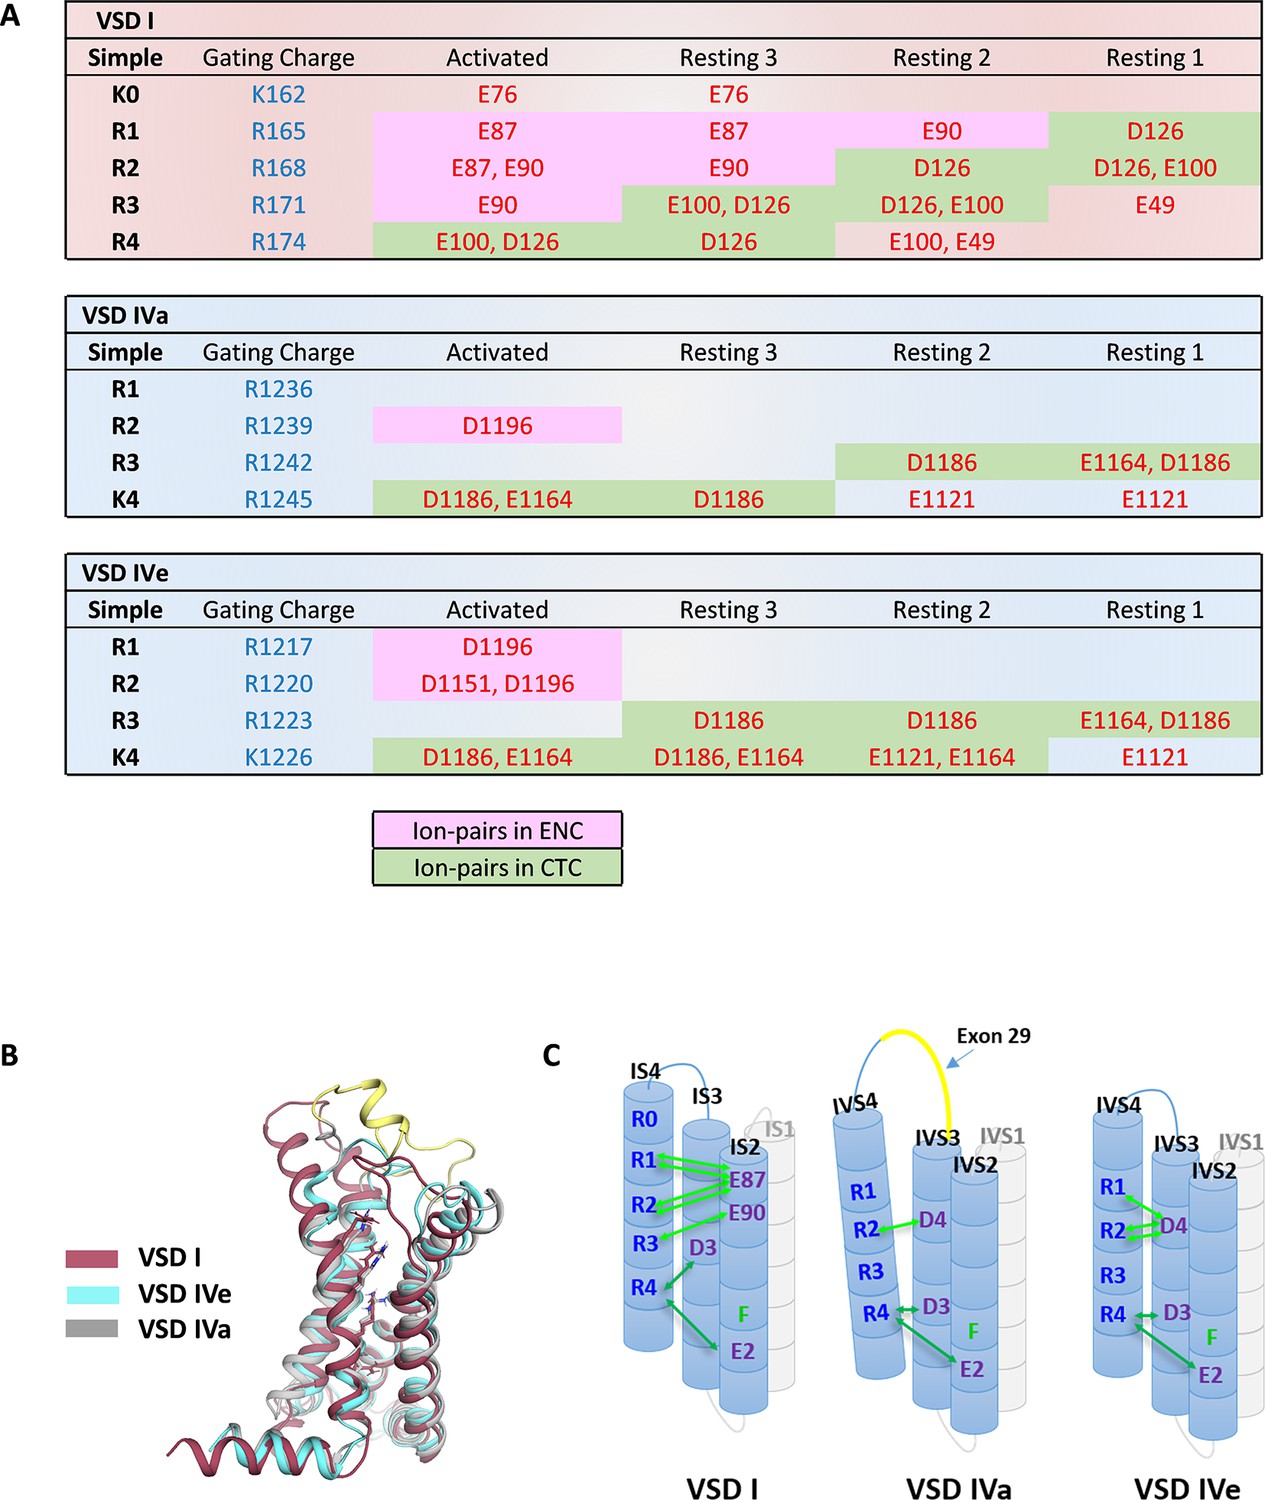
Ion-pair partners of CaV1.1 voltage sensing domains (VSDs) I and IV gating charges in activated and resting states.
(A) Tabular overview of ion-pair interactions of the positive gating charges (blue) with countercharges (red) observed in the activated and three resting states of VSDs I, IVa, and IVe. Fields shaded in green show the sequential interaction with the ion-pair partners of the intracellular negative cluster (INC). In VSD I this transition through the charge transfer center (CTC) involves R4, R3, R2, R1, whereas in VSD IV only R4 and R3 participate in equivalent interactions. Ion-pair formation with the extracellular negative cluster (ENC) (pink shading) of VSD I involved three gating charges (R3, R2, R1) in the activated and intermediate resting states 2 and 3. In VSD IV ion-pair formation with the ENC is limited to the activated state, and it is further reduced by inclusion of exon 29 in VSD IVa. (B) Structure overlay of VSD I, VSD IVa (including exon 29; yellow), and VSD IVe in the activated state. (C) Schematic representation of the three VSDs indicating similar ion-pair formation in the INC, representing the conserved CTC (dark green), but highly distinct ion-pair formation in the ENC (light green) of the three analyzed VSDs.
Figure 4 with 2 supplements
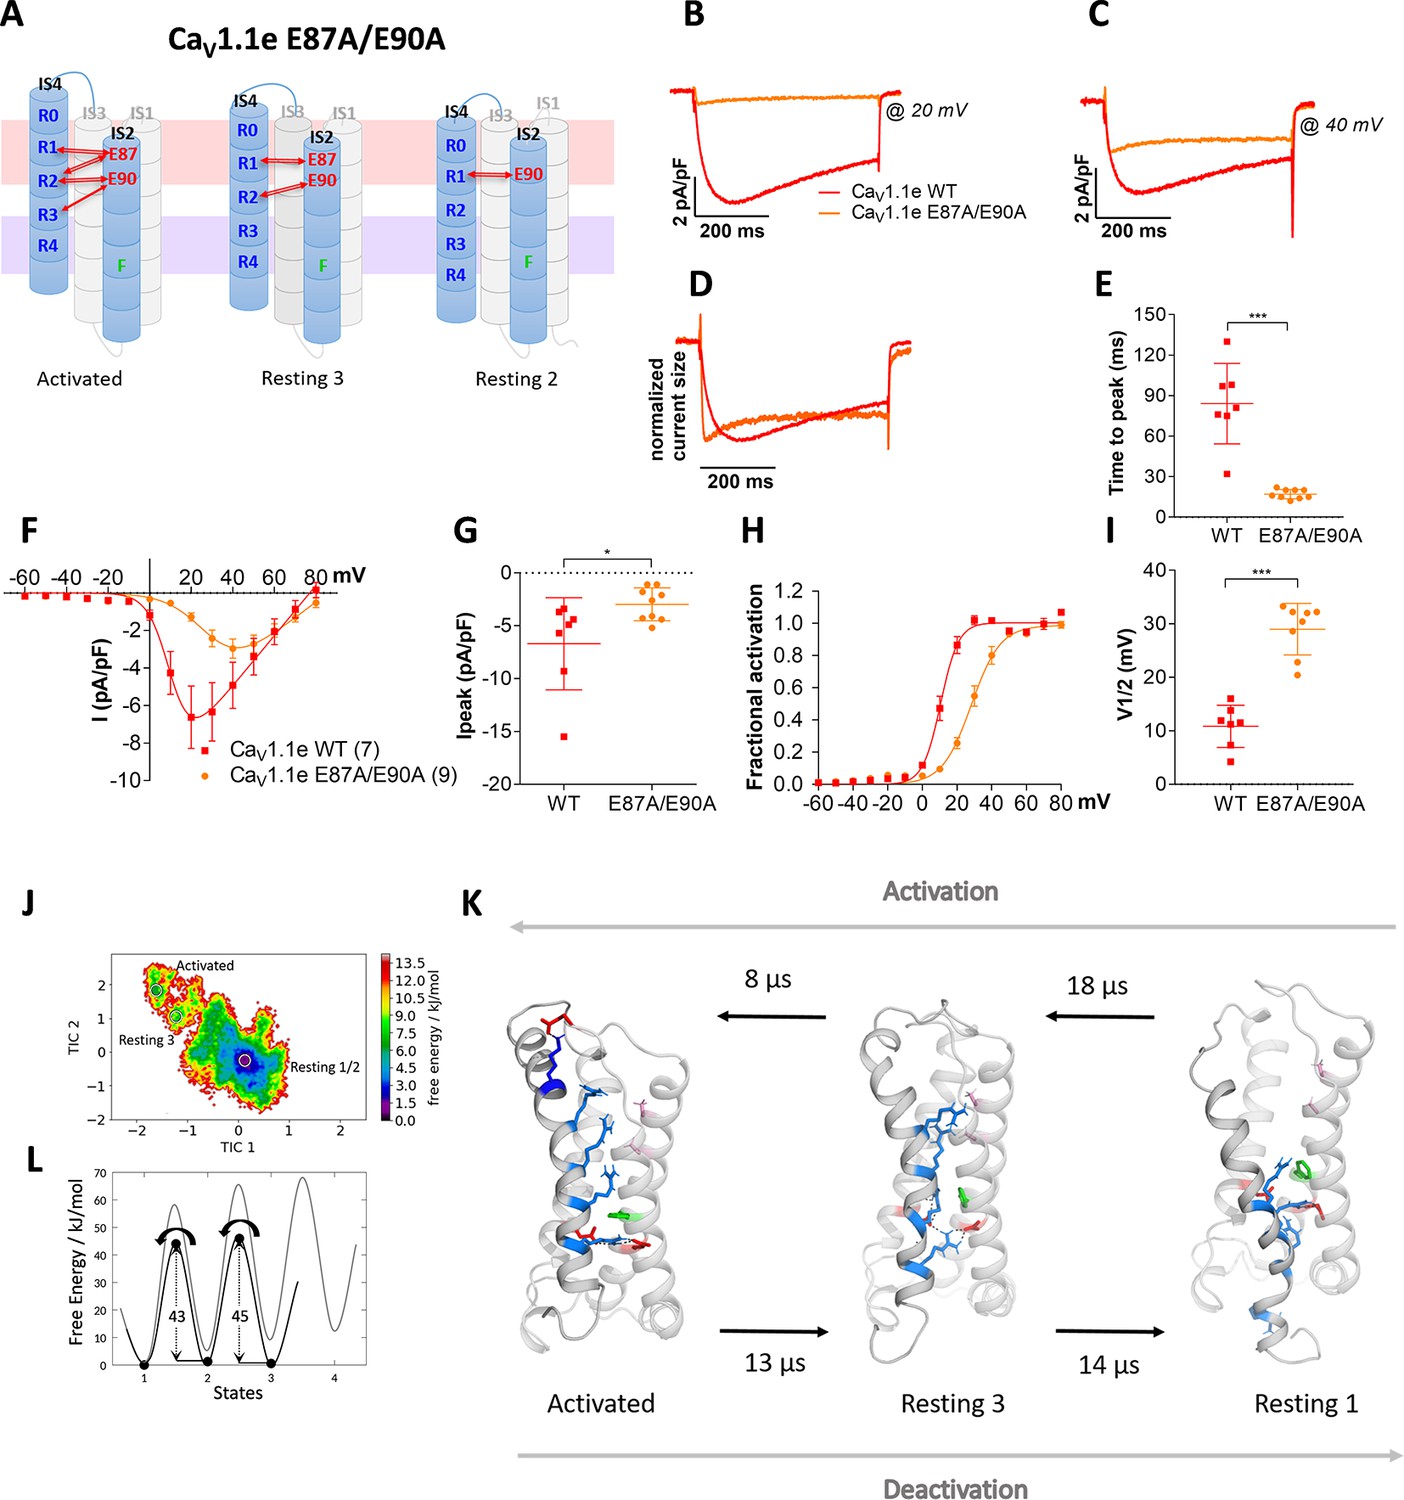
Countercharges E87 and/or E90 in IS2 determine the voltage dependence and kinetics of CaV1.1 current activation and voltage sensing domain (VSD) transitions.
(A) Schematic model of VSD I in the activated and resting states, showing the putative loss of interactions between gating charges and countercharges E87 and E90 upon their mutation to alanine. (B–I) In CaV1.1e the double mutation E87A/E90A (orange) accelerated activation kinetics and right-shifted the voltage dependence of activation, compared to wildtype (WT) CaV1.1e (red). (B,C) Representative current traces at Vmax of WT CaV1.1e (20 mV) and CaV1.1e E87A/E90A (40 mV), respectively, and normalized currents at Vmax (D). (E) Scatter plot of the time to peak; (F) current-voltage relationship; (G) scatterplot of maximum current density (p=0.03); (H) voltage dependence of activation; (I) scatter plot of the voltage at half-maximal activation (V½). Mean ± SEM; p-values calculated with Student’s t-test, ***p<0.00001. (J,K) The time-lagged independent component analysis (tICA) free energy surface of CaV1.1e E87A/E90A displays three macrostates with structures corresponding to the activated state and resting states 1 and 3, and transition kinetics in the low μs timescale. (L) The 1D energy plot shows substantially lower calculated energy barriers between the states of the double mutant (black) compared to the WT VSD I (gray).
Figure 4—figure supplement 1
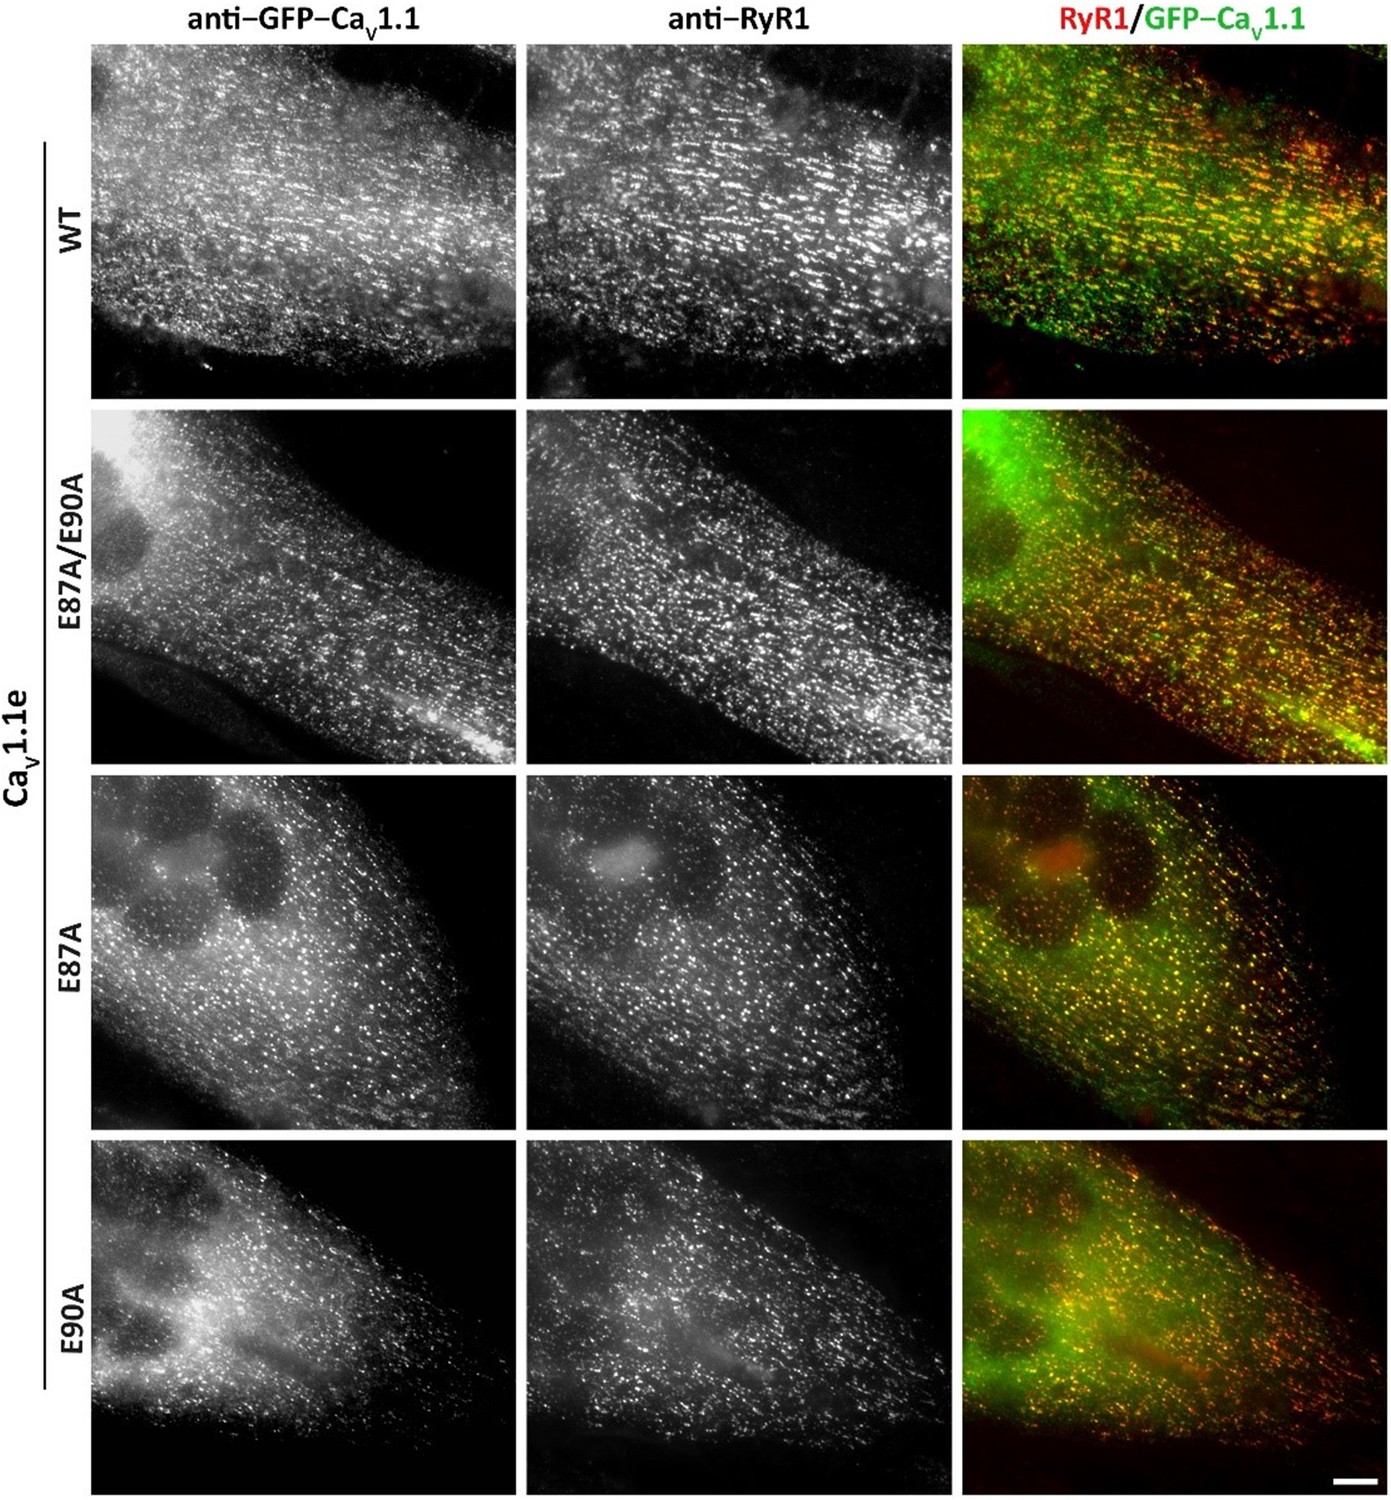
Expression and triad targeting of wildtype (WT) and E87A, E90A mutant GFP-CaV1.1e channels in dysgenic myotubes.
Dysgenic (CaV1.1-null) myotubes were transfected with the indicated GFP-CaV1.1e constructs and myotubes were fixed and double immunofluorescence labeled with anti-GFP (to localize the CaV1.1 construct) and anti-RyR1 (as a triad marker). Colocalization of GFP-CaV1.1e constructs with RyR1 in clusters indicates its normal incorporation into triadic calcium channel complexes of skeletal myotubes. All three used GFP-CaV1.1e mutants (E87A/E90A, E87A, and E90A) showed similar expression and distribution as the WT GFP-CaV1.1e. Scale bars, 10 µm.
Figure 4—figure supplement 2
Putative countercharge E90, but not E87, determines slow activation kinetics of voltage sensing domain (VSD) I of CaV1.1e.
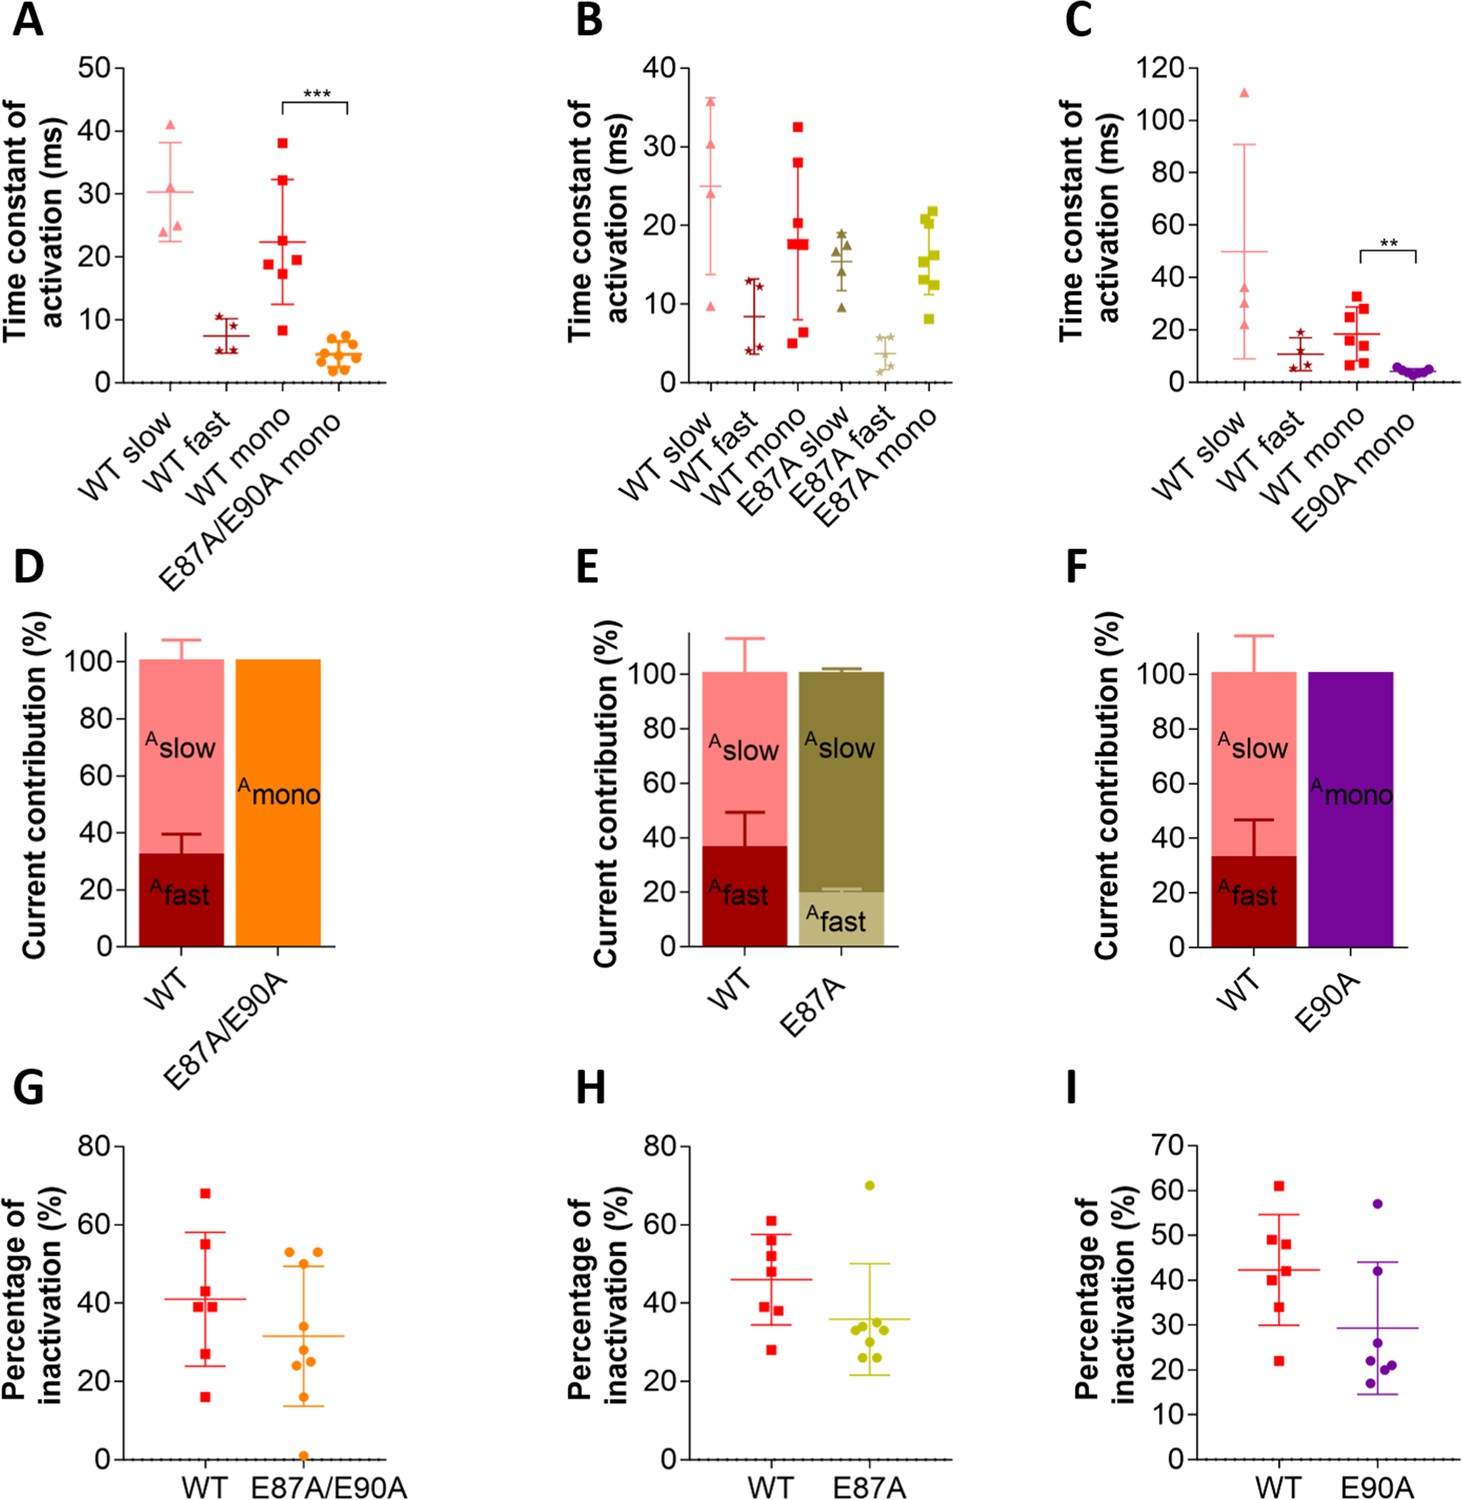
(A–C) Scatter plots of the time constant of activation, when fitted to a bi-exponential function (fast and slow component) or to a mono-exponential function (mono). (A) This scatter plot shows that, when countercharges E87 and E90 are simultaneously neutralized, kinetics of activation becomes best described by a mono-exponential function due to the loss of the slow component; this time constant of E87A/E90A is faster than that of the mono-exponential fit of CaV1.1e wildtype (WT) (WT mono, red; E87A/E90A mono, orange; p=0.0003 calculated with the Student’s t-test) and even faster than WT fast (maroon) when CaV1.1e WT activation is fitted to a bi-exponential function. (B) The scatter plot for E87A shows that, when only this countercharge is neutralized, activation is still best fitted to a bi-exponential function as in CaV1.1e WT. No significant differences were found between WT slow vs. E87A slow (p=0.24, Student’s t-test) and WT fast vs. E87A fast (p=0.20, Student’s t-test). When activation is forced to a mono-exponential function, no differences were found between WT mono and E87A mono (p=0.84, Student’s t-test). (C) When countercharge E90 alone is neutralized, kinetics of activation is best described by a mono-exponential function due to a complete loss of the slow component; the time constant of E90A is faster than the mono-exponential fit of CaV1.1e WT (WT mono, red; E90A mono, purple; p=0.003) and even faster than WT fast (maroon) when CaV1.1e WT activation is fitted to a bi-exponential function. (D–F) Bar graphs show the current contribution of the slow vs. fast component of activation, when fitted best to a bi-exponential function (CaV1.1e WT in D, E, and F and CaV1.1e E87A in E). (D) CaV1.1e WT is best fitted to a bi-exponential function with a 31.9:68.1% ratio of fast:slow. CaV1.1e E87A/E90A can only be described by a mono-exponential function, indicating a 100% contribution of the fast component. (E) Activation of both CaV1.1e WT and E87A are best described bi-exponentially, with a somewhat bigger current contribution of the slow component (Aslow) in the mutant (Aslow WT vs. E87A is 63.8% vs. 80.8%, p=0.052 calculated with the Student’s t-test). (F) E90A can only be described by a mono-exponential function, indicating a loss of the slow component. (G–I) Scatter plots showing the fractional inactivation at the end of the 500 ms test pulse. None of the mutations affected the inactivation properties of CaV1.1 (p-values calculated with the Student’s t-test are 0.31 in G, 0.16 in H, and 0.10 in I, see Supplementary file 1).
Figure 5 with 1 supplement
Countercharges E87 and E90 differentially regulate kinetics of voltage sensing domain (VSD) I transitions and current activation.
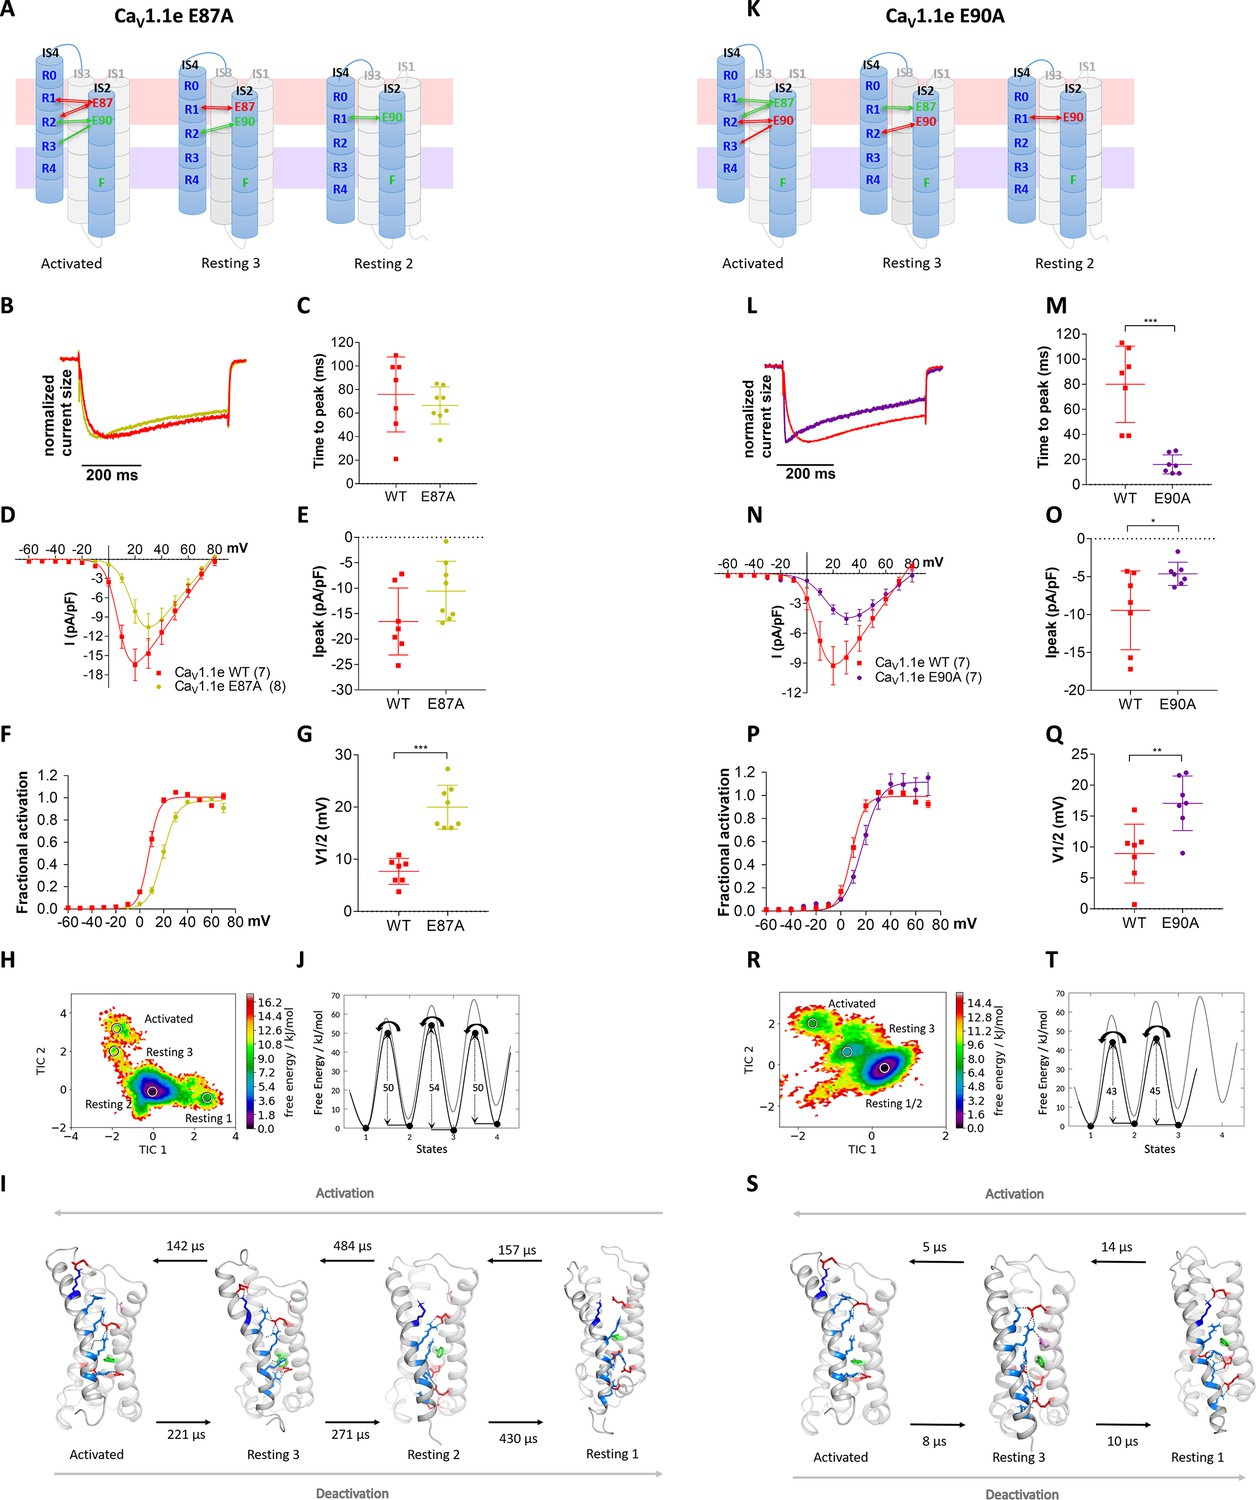
(A,K) Schematic of VSD I in activated and resting states, showing the loss of ionic interactions upon mutation of E87A or E90A. (B–G) In CaV1.1e E87A right-shifted voltage dependence of activation without affecting kinetics (wildtype [red], E87A [lime]). (L–Q) The E90A mutation accelerated kinetics >4-fold and right-shifted voltage dependence of activation (wildtype [red], E87A [purple]). (B,L) Normalized representative currents show acceleration of activation in E90A (L) but not in E87A (B). (C,M) Time to peak (p=0.47 in C, p=0.00017 in M); (D,N) current-voltage relationship; (E,O) maximum current density (p=0.08 in E, p=0.04 in O); (F,P) voltage dependence of activation; (G,Q) voltage at half-maximal activation (V½) (p=0.000014 in G, p=0.008 in Q). Mean ± SEM; p-values calculated with Student’s t-test. (H–J) The time-lagged independent component analysis (tICA) free energy surface and schematic 1D representation of E87A show four macrostates corresponding to resting states 1, 2, 3 and the activated state with energy barriers similar to wildtype (gray) and transition kinetics in the higher μs timescale. (R–T) E90A shows three macrostates corresponding to the resting states 1 and 3 and the activated state, reduced energy barriers, and transition kinetics in the low μs timescale.
Figure 5—figure supplement 1
Deactivation kinetics are fast in CaV1.1e wildtype (WT) and in slowly (E87A) and fast-activating (E90A) voltage sensing domain (VSD) I mutants.
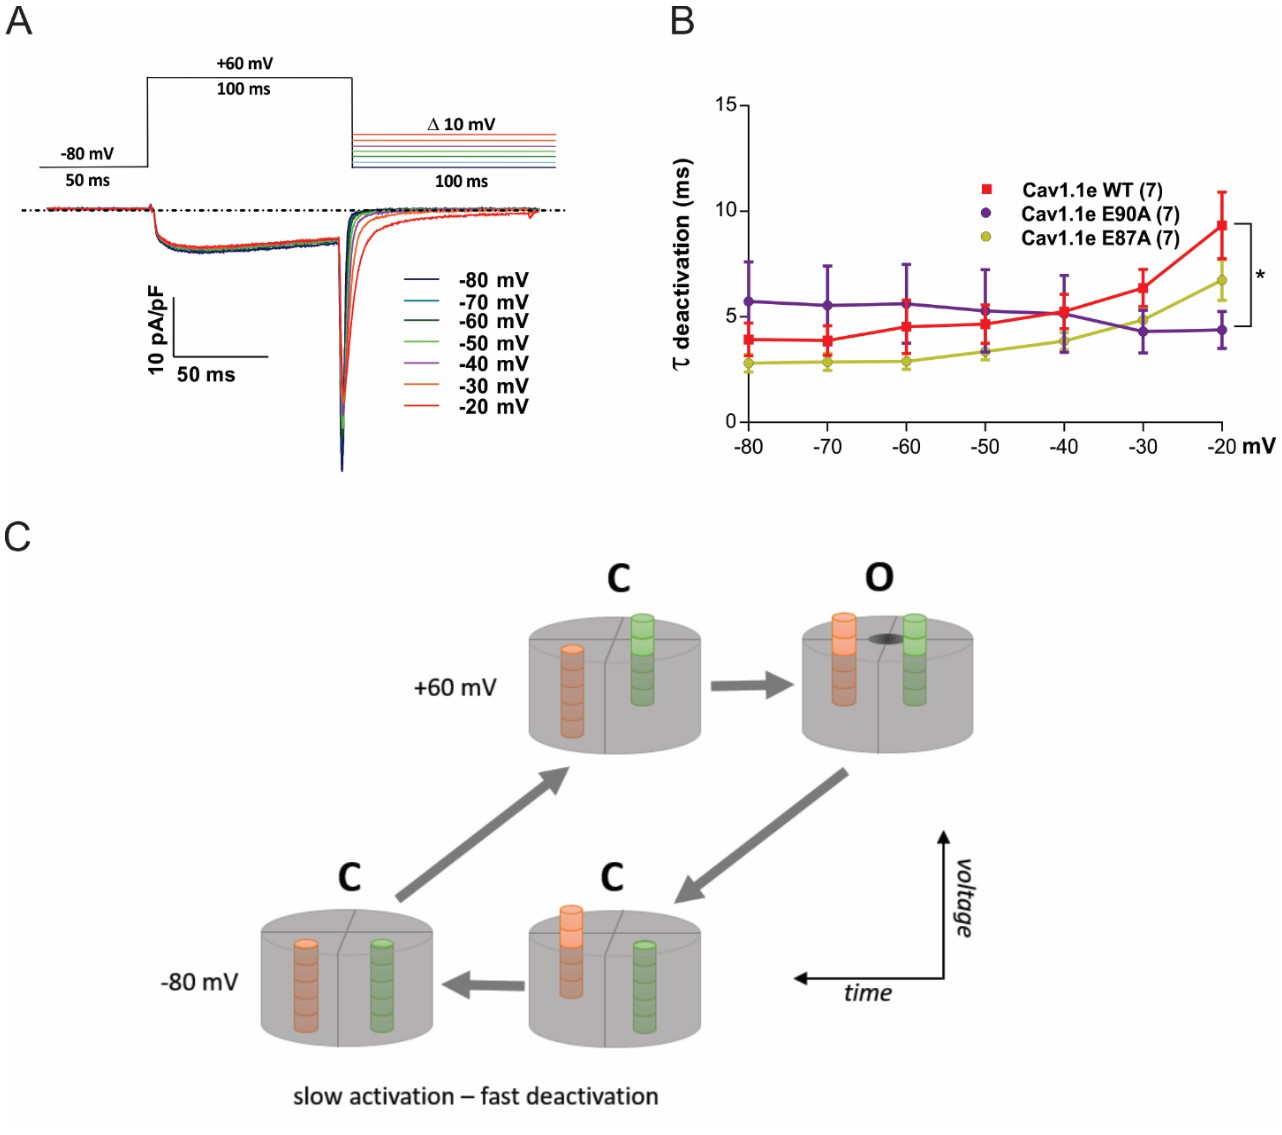
(A) Voltage clamp protocol used to examine deactivation kinetics (top) and representative current traces (bottom). Upon repolarization from +60 mV to varying negative potentials (at 10 mV increments), activated channels conduct a transient inward calcium current (downward spike) before they deactivate and close the channel pore. The decay of this so-called tail current was fitted with a mono-exponential function to determine the time constants of deactivation. (B) The time constants of deactivation are equally fast in CaV1.1e WT, E90A, and E87A (in contrast to their distinct activation kinetics; cf. Figure 5—figure supplement 2). At −20 mV significant kinetic differences start to occur, because at such weak repolarization part of the channels fail to deactivate and thus contaminate the tail current with a slowly inactivating current component (p=0.019; two-way repeated measures ANOVA and Holm-Sidak post hoc test). (C) Simplified model explaining slow activation and fast deactivation of the channel. We assume that at least two VSDs need to be in the up-state for the channel gate to open (at +60 mV). In response to the depolarizing voltage step, the slow VSD (orange; VSD I in CaV1.1) will be rate-limiting and thus endow the channel with slow activation kinetics. On repolarization, the rapid downward movement of another VSD (green) will close the channel gate with fast deactivation kinetics, thus masking the continuing downward movement of the slow VSD.
Videos
Video 1
Movement of wildtype CaV1.1e voltage sensing domain (VSD) I upon activation and deactivation, highlighting the ion-pair interactions formed between the S4 gating charges (blue) and relevant countercharges (red) in the S2 and S3 helices.
Video 2
Movement of the E87A/E90A double mutant of CaV1.1e voltage sensing domain (VSD) I upon activation and deactivation, highlighting the ion-pair interactions formed between the S4 gating charges (blue) and relevant countercharges (red) in the S2 and S3 helices.
Video 3
Movement of the E87A mutant of CaV1.1e voltage sensing domain (VSD) I upon activation and deactivation, highlighting the ion-pair interactions formed between the S4 gating charges (blue) and relevant countercharges (red) in the S2 and S3 helices.
Video 4
Movement of the E90A mutant of CaV1.1e voltage sensing domain (VSD) I upon activation and deactivation, highlighting the ion-pair interactions formed between the S4 gating charges (blue) and relevant countercharges (red) in the S2 and S3 helices.
Tables
Key resources table
| Reagent type (species) or resource | Designation | Source or reference | Identifiers | Additional information |
|---|---|---|---|---|
| Gene (human) | CACNA1S | Wu et al., 2016 | Q13698 | |
| Gene (rabbit) | CACNA1S | Grabner et al., 1998 | P07293 | |
| Cell line (mouse) | GLT, dysgenic skeletal myotubes | Powell et al., 1996 | GLT; mdg/mdg | CaV1.1-null |
| Transfected construct (rabbit) | GFP-CaV1.1e (wild type) | Tuluc et al., 2009 | CaV1.1- D exon 29 | |
| Transfected construct (rabbit) | GFP-CaV1.1e -E87A/E90A, -E87A, -E90A | This paper | ||
| Antibody | Rabbit polyclonal anti-GFP | Invitrogen Thermo Fisher | A-6455, RRID:AB_221570 | IF (1:10,000) |
| Antibody | Mouse monoclonal anti-RyR | Invitrogen Thermo Fisher | (MA3-925) 34 C RRID: AB_2254138 | IF (1:500) |
| Software, algorithm | AMBER simulation software | AmberMD | RRID: SCR_014230 | |
| Software, algorithm | AmberTools 19 | AmberMD | RRID: SCR_018497 | |
| Software, algorithm | PyMOL | Schrödinger | RRID: SCR_000305 | |
| Software, algorithm | Clampex | Clampex | Version 10.2 RRID:SCR_011323 | |
| Software, algorithm | Clampfit | Clampfit | Version 10.7 RRID:SCR_011323 | |
| Software, algorithm | SigmaPlot | SigmaPlot | Version 12.0 RRID:SCR_003210 | |
| Software, algorithm | GraphPad Prism | GraphPad Prism | Version 7 RRID:SCR_002798 |
Additional files
-
Supplementary file 1
Mean values and confidence intervals for probabilities and mean first passage times calculated from the Bayesian Markov state modeling (MSM), and the confidence intervals are calculated at a confidence level of 95%.
- https://cdn.elifesciences.org/articles/64087/elife-64087-supp1-v2.docx
-
Supplementary file 2
Current properties of E87A/E90A, E87A, E90A, and wildtype (WT) controls.
- https://cdn.elifesciences.org/articles/64087/elife-64087-supp2-v2.docx
-
Supplementary file 3
Linear interaction energy (LIE) calculations with the program cpptraj for the two voltage sensing domains (VSDs) and the mutants to calculate the electrostatic interactions of the S4 helix with all other parts of the voltage sensor.
- https://cdn.elifesciences.org/articles/64087/elife-64087-supp3-v2.docx
-
Supplementary file 4
Summary table of the modeled loops in the voltage sensors with ab initio Rosetta (Robetta).
- https://cdn.elifesciences.org/articles/64087/elife-64087-supp4-v2.docx
-
Supplementary file 5
Primers used for site-directed mutagenesis.
- https://cdn.elifesciences.org/articles/64087/elife-64087-supp5-v2.docx
-
Supplementary file 6
Input scripts.
- https://cdn.elifesciences.org/articles/64087/elife-64087-supp6-v2.docx
-
Transparent reporting form
- https://cdn.elifesciences.org/articles/64087/elife-64087-transrepform-v2.pdf
Download links
A two-part list of links to download the article, or parts of the article, in various formats.
Downloads (link to download the article as PDF)
Open citations (links to open the citations from this article in various online reference manager services)
Cite this article (links to download the citations from this article in formats compatible with various reference manager tools)
Structural determinants of voltage-gating properties in calcium channels
eLife 10:e64087.
https://doi.org/10.7554/eLife.64087


