Single-cell chromatin accessibility profiling of glioblastoma identifies an invasive cancer stem cell population associated with lower survival
- Princess Margaret Cancer Centre, University Health Network, Canada
- Developmental and Stem Cell Biology Program and Arthur and Sonia Labatt Brain tumor Research Centre, The Hospital for Sick Children, Canada
- Clark Smith Brain Tumour Centre, Arnie Charbonneau Cancer Institute, University of Calgary, Canada
- Alberta Children’s Hospital Research Institute, University of Calgary, Canada
- Department of Biochemistry and Molecular Biology, Cumming School of Medicine, University of Calgary, Canada
- Leslie Dan Faculty of Pharmacy, University of Toronto, Canada
- Department of Medical Biophysics, University of Toronto, Canada
- Hotchkiss Brain Institute, University of Calgary, Canada
- Department of Cell Biology & Anatomy, University of Calgary, Canada
- Institute of Biomaterials and Biomedical Engineering, University of Toronto, Canada
- Department of Pathology and Laboratory Medicine, University of Calgary, Canada
- Division of Neurosurgery, University of Toronto, Canada
- Departments of Molecular Genetics and Surgery, University of Toronto, Canada
- Department of Computer Science, University of Toronto, Canada
- Ontario Institute for Cancer Research, Canada
- Vector Institute, Canada
- Department of Physiology & Pharmacology, University of Calgary, Canada
- Department of Biochemistry, Faculty of Medicine, University of Toronto, Canada
Figures
Figure 1 with 1 supplement
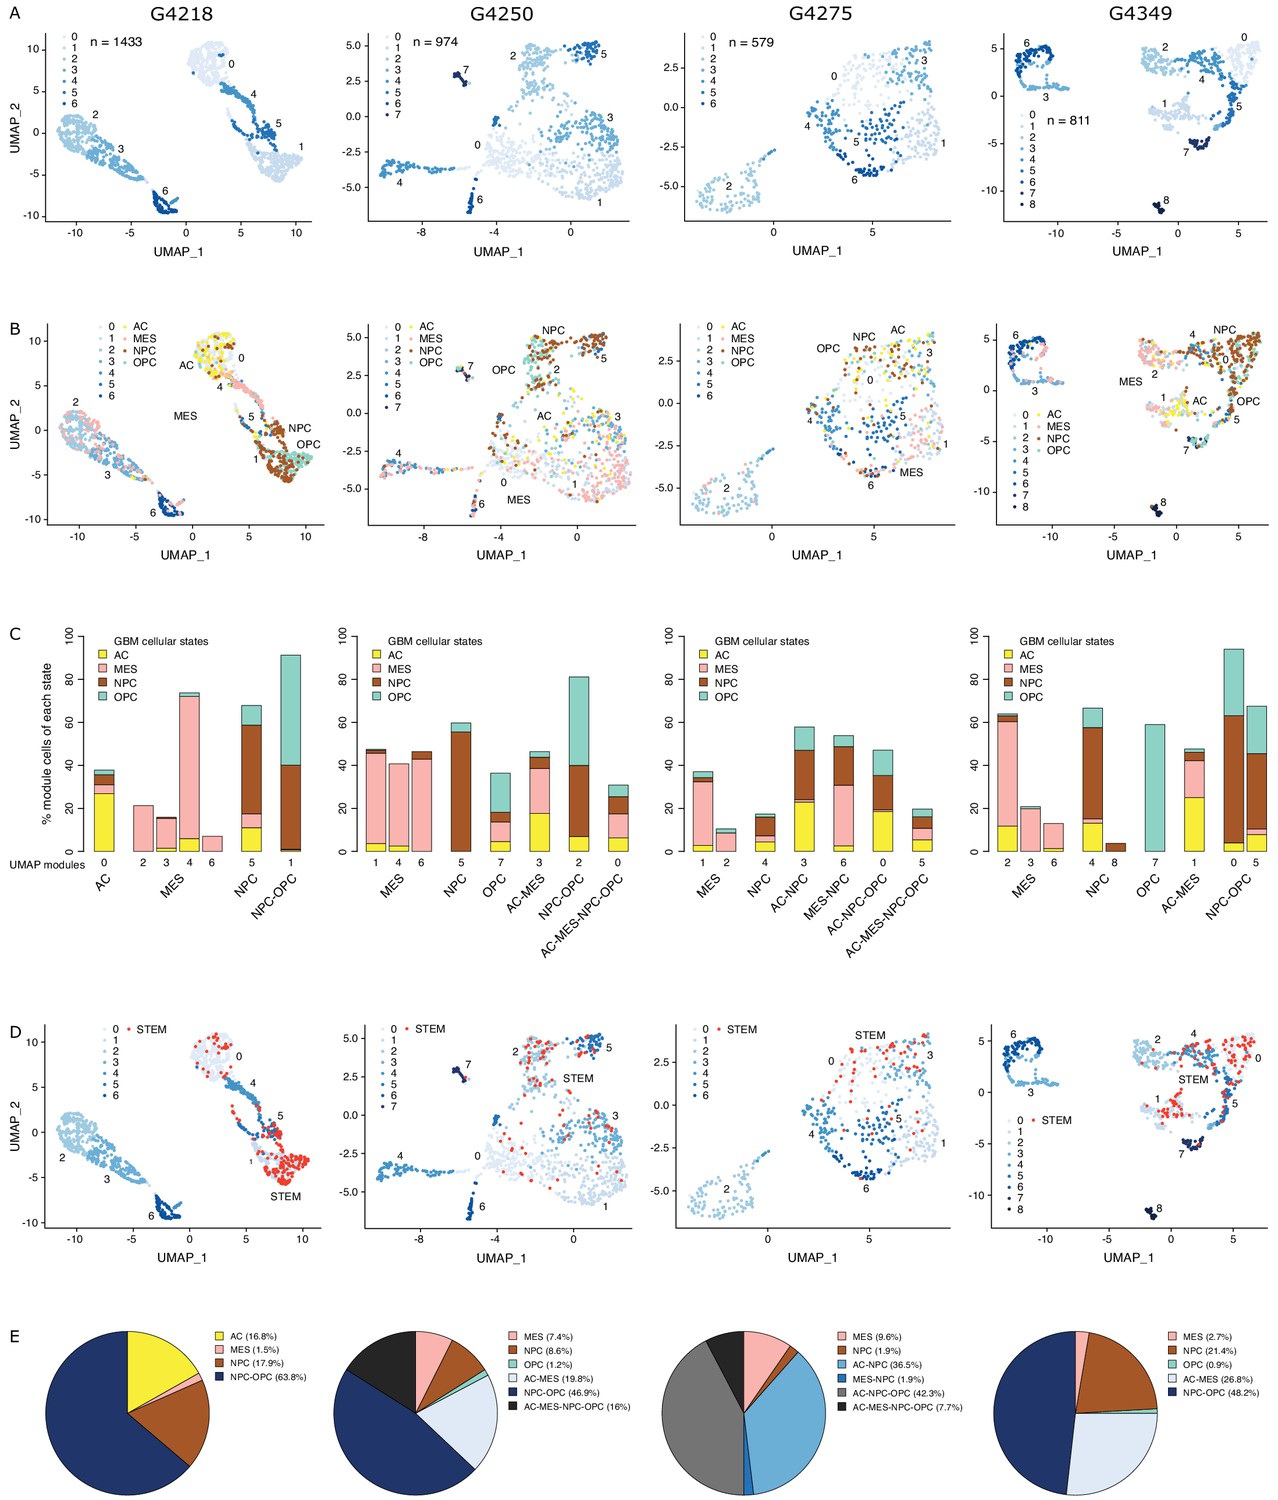
The diverse glioblastoma (GBM) cancer stem cell pool.
(A) UMAP (Uniform Manifold Approximation and Projection) representation of chromatin accessibility across four primary GBM. (B) UMAPs with tumor cells assigned to cellular states. (C) UMAP modules are grouped by dominant cellular state. (D) UMAPs with cancer stem cells highlighted based on the enrichment of GBM cancer stem transcription factor promoters. (E) Distribution of cancer stem cells across the modules dominated by each cellular state.
Figure 1—figure supplement 1
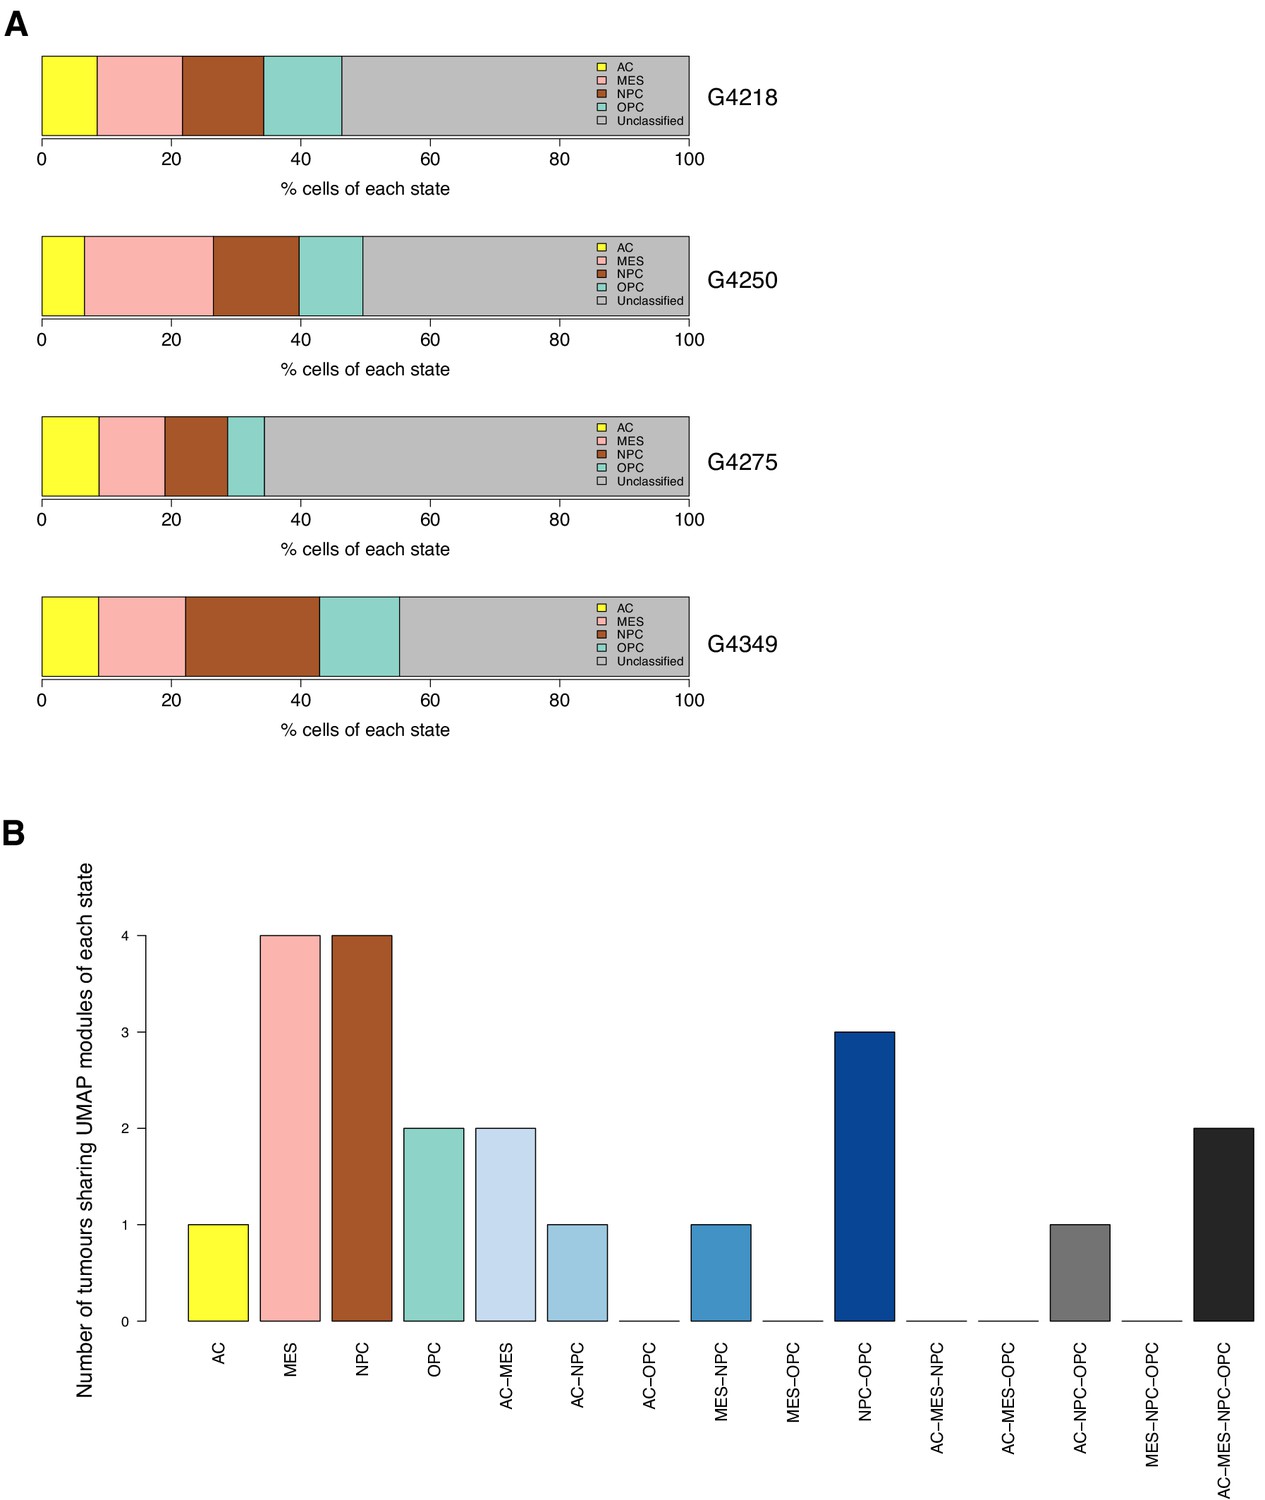
The distribution of cell states across tumor cells.
(A) Percentage of each tumor’s cells significantly enriched with each state’s signature genes. (B) Number of tumors with at least one UMAP module dominated by a given cell state.
Figure 2 with 1 supplement

GSCs recapitulate the glioblastoma (GBM) cancer stem cell population.
(A) Schematic representation of the GSC derivation process, from patient tumor to GSC-enriched population. (B) Genomic feature enrichment of accessible chromatin peaks. (C) Saturation curve for the 27 GSCs. (D) UMAPs with GSCs highlighted based on the enrichment of shared accessible regions across GSCs. (E) Proportion of UMAP modules assigned to cancer stem cells and GSCs. (F) Correlation of z-scores for each signature for each cell in each primary GBM.
Figure 2—figure supplement 1
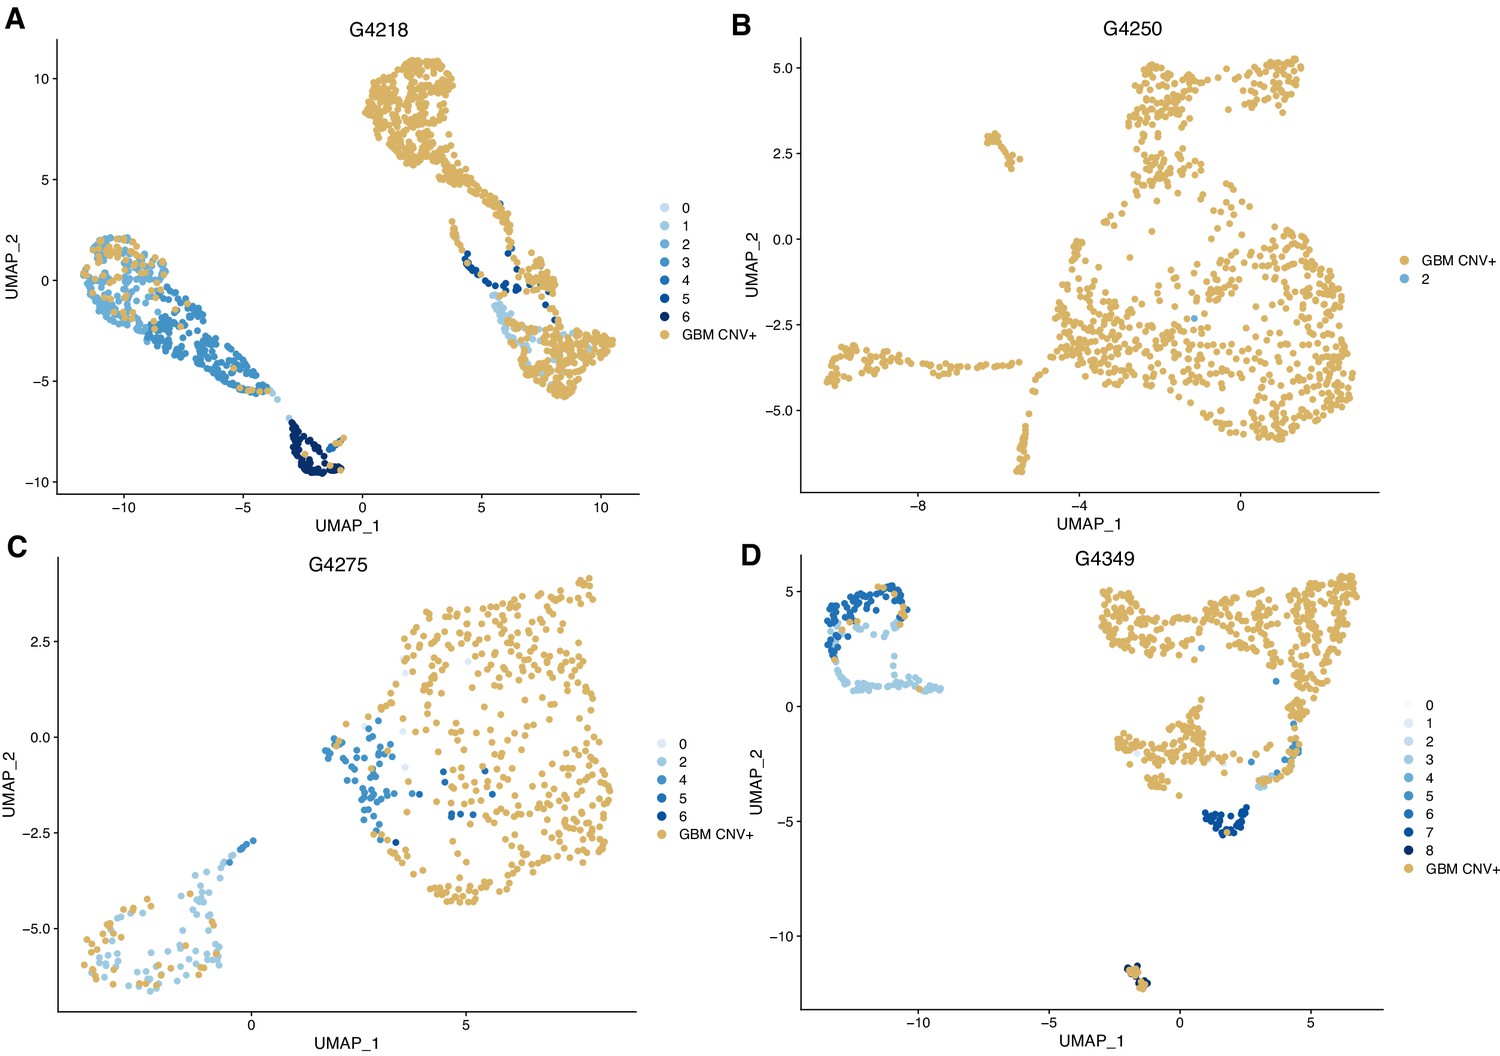
Identification of tumor cells through characteristic copy number changes.
(A–D) UMAPs showing cells confirmed to be GBM tumor cells, with gains of chr7 or losses of chr10. A: G4218, B: G4250, C: G4275; D: G4349.
Figure 3 with 1 supplement
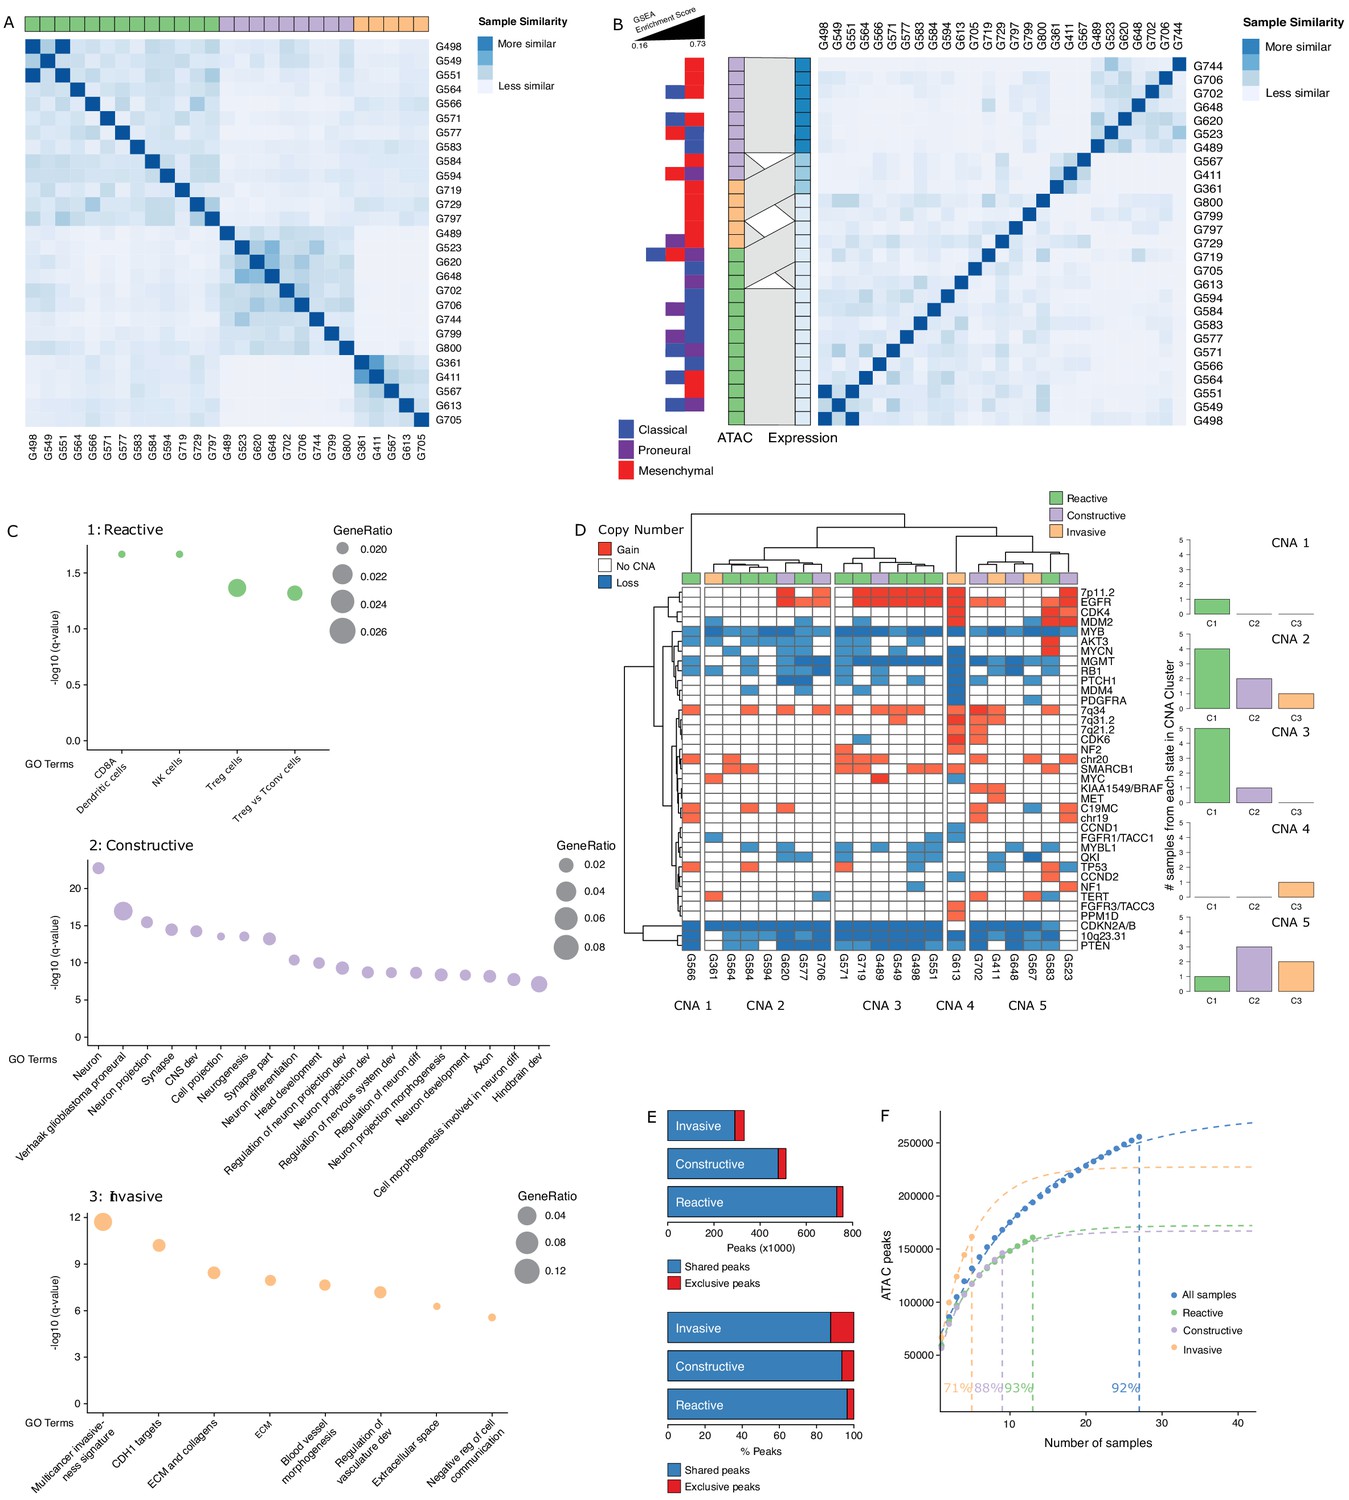
Three glioblastoma stem cell (GSC) states driven by chromatin accessibility.
(A) Spectral clustering of ATAC-seq signal across peaks in 27 GSCs. (B) Spectral clustering of gene expression across GSCs and comparison to chromatin-derived GSC states. Enrichment of TCGA subtypes across GSCs and comparison to GSC states as determined by ATAC. The GSEA (Gene Set Enrichment Analysis) gene sets each contained 50 genes and the enrichment scores ranged from 0.16 to 0.73. (C) Gene set enrichment analysis in each GSC state. All displayed terms are significantly enriched (q-value < 0.05). (D) Copy number alterations (CNAs) across GSCs identified from DNA methylation array data cluster GSCs into five subgroups. (E) Number and percentage of peaks unique and shared in each GSC state. (F) Saturation analysis of each individual state.
Figure 3—figure supplement 1
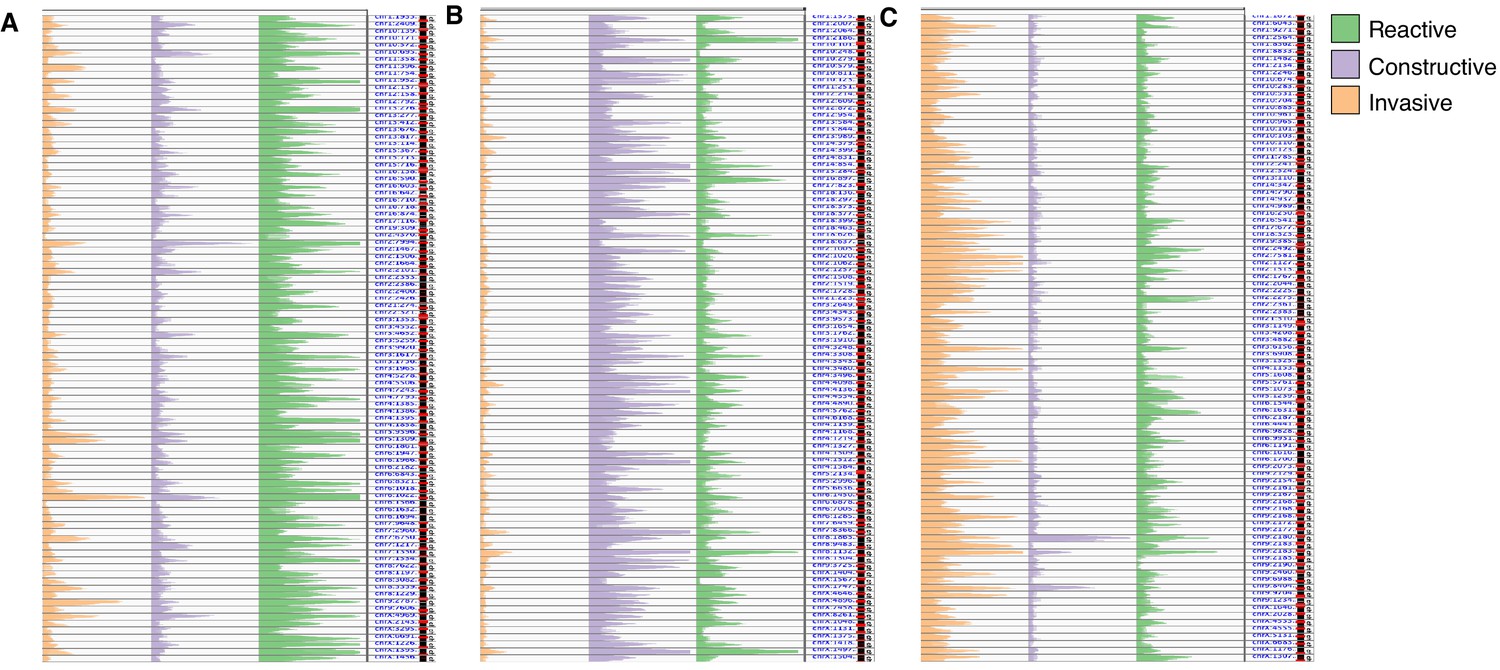
Distinct chromatin accessibility profiles across glioblastoma stem cell states.
(A–C) Overlaid ATAC signal tracks for the 27 GSCs at the 92 most differentially accessible regions between GSC states as determined by pairwise Wilcoxon test and a median signal fold change equal or greater than 2. The region coordinates can be found in the Supplementary file 2. (A) Most accessible in Reactive state GSCs. (B) Most accessible in Constructive state GSCs. (C) Most accessible in Invasive state GSCs.
Figure 4 with 1 supplement
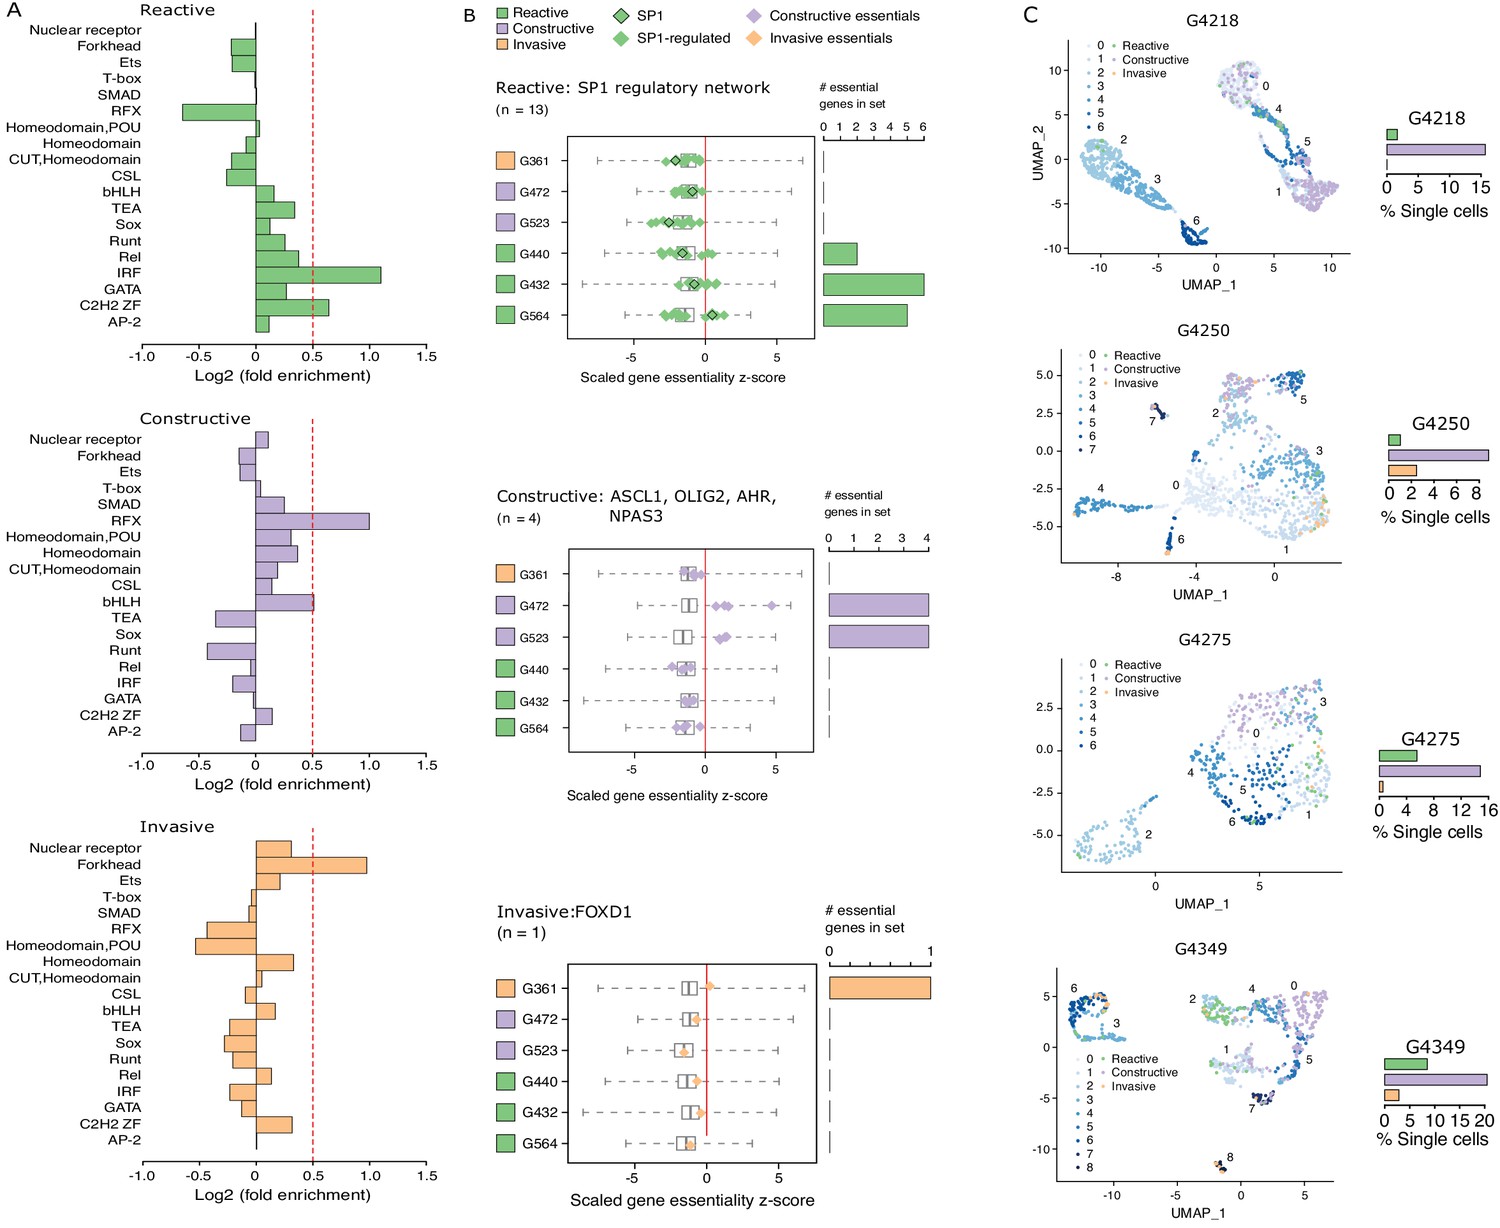
Functional diversity between glioblastoma stem cell (GSC) states and intra-tumor heterogeneity.
(A) Motif family enrichment in each cluster; log2(fold enrichment) > 0.5 threshold selected based on the distribution of values in each cluster (Figure 2—figure supplement 1). (B) Z-score distribution of key essential genes in each cluster. Red line corresponds to the empirically determined threshold for essentiality in each tested line, scaled, and adjusted to zero. Boxplot whiskers in this case extend to data extremes. Side barplots show the total count of the key cluster-specific regulators found essential in each subtype. (C) UMAPs with GSCs from each state highlighted based on the enrichment of the top differentially accessible regions in each GSC state.
Figure 4—figure supplement 1
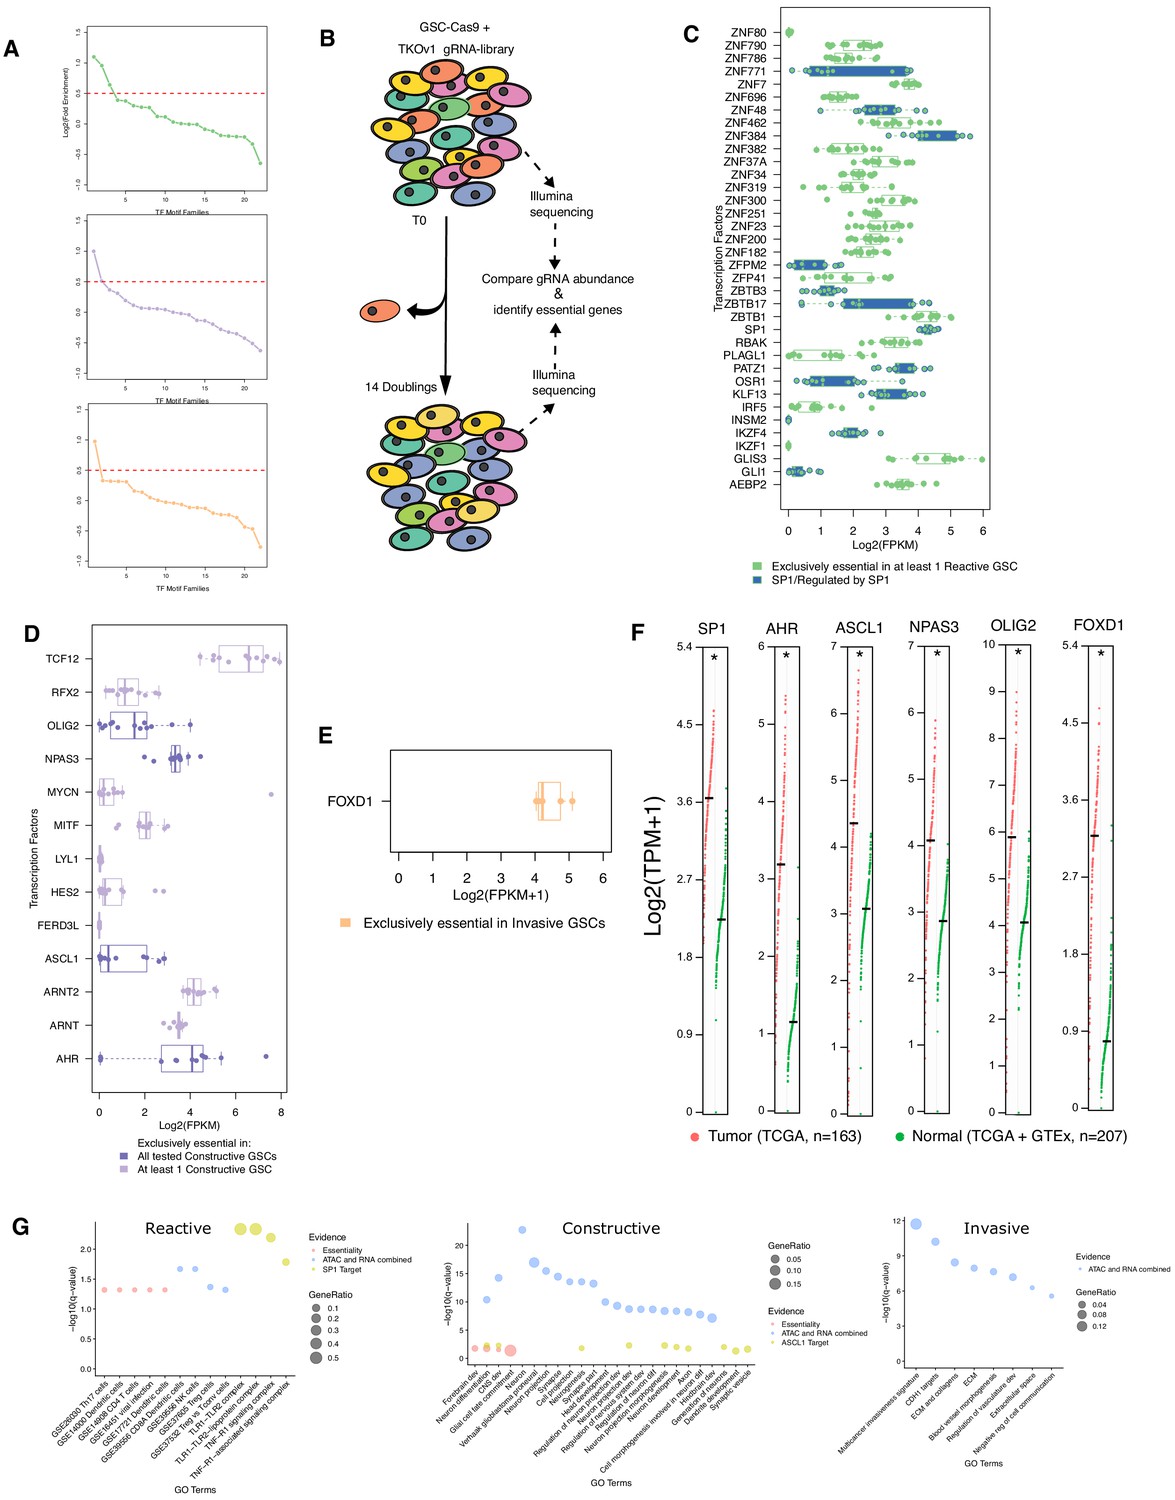
dentification and characterization of essential transcription factors across GSC states.
(A) The log2(fold enrichment) for all motif families were ordered and plotted. A cut-off threshold to select families for follow-up was selected based on the steep inflection of the curve above 0.5. (B) Schematic of drop-out essentiality screen using GSCs stably expressing Cas9 and gRNA libraries. (C–E) The expression values determined by RNA-seq for all transcription factors whose motif is enriched in each GSC state and exclusively essential in at least one GSC of each state is plotted. Bold colors highlight factors essential in all tested GSCs in that state. In the case of the Reactive state, blue boxplots correspond to SP1 and members of its regulatory network. (F) Expression levels of key transcription factors in tumor and normal samples analyzed and displayed using GEPIA (Tang et al., 2017). (G) Gene enrichment analysis of subtype-specific essential genes (Essentiality), upregulated and differentially accessible genes (ATAC and RNA combined), and putative targets of key transcription factors.
Figure 5 with 2 supplements
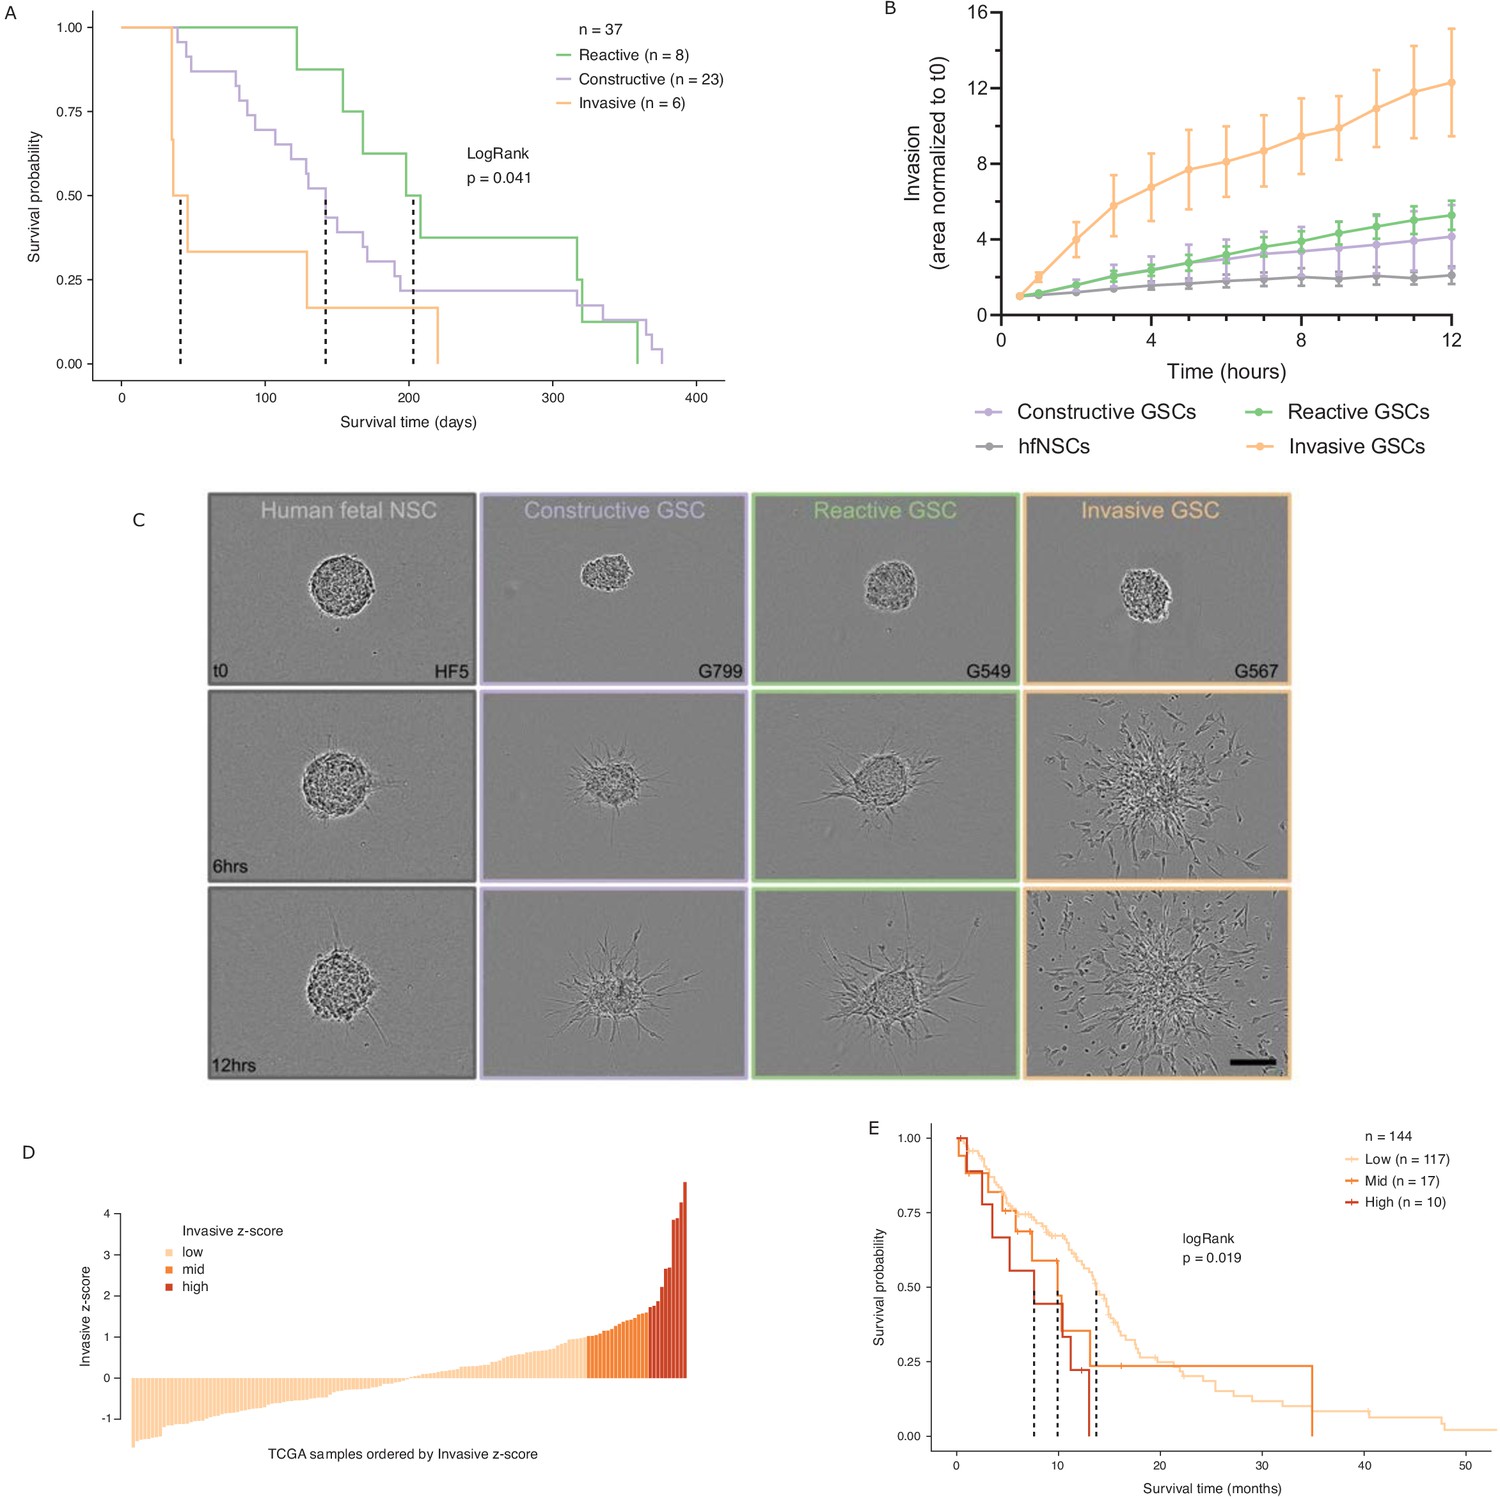
Glioblastoma stem cell (GSC) invasiveness is associated with survival in glioblastoma (GBM).
(A) Kaplan–Meier plot for orthotopic xenografts grouped by GSC state. For each of the 37 GSCs used in the xenograft survival analysis, the median survival value was used from multiple mice injected with cells from each GSC (average number of mice injected/GSC = 5). The dotted lines indicate median survival. The pairwise p-values are also significant for Invasive vs Reactive (p=0.02) and Invasive vs Constructive (p=0.045) but not for Reactive vs Constructive (p=0.45). (B) Invaded area over time normalized to t0 by three to four representative GSCs of each GSC state and human fetal neural stem cells (hfNSCs) used as controls. See Figure 5—figure supplement 1A for individual GSC invasion. (C) Invasion images of representative hfNSCs and GSCs at t0, 6 hr, and 12 hr. Scale bar is 150 µm. (D) TCGA samples ordered by increasing concordance with Invasive GSCs and grouped into three subgroups: <1, 1–1.65, >1.65. (E) Kaplan–Meier plot for TCGA samples grouped by concordance with Invasive GSCs. The dotted line indicates median survival. When considering pairwise comparisons, only the Invasive-high and Invasive-low subgroups were significantly different (p=0.0043). Further subgrouping of the TCGA samples into smaller intervals of concordance z-score yielded no benefit, preserving the Invasive-high subgroup as the only one with significantly poorer prognosis (Figure 5—figure supplement 2B,C).
Figure 5—figure supplement 1

Invasive properties across glioblastome stem cell states.
(A) Invaded area over time normalized to t0 by three to four representative GSCs of each GSC state and hfNSCs used as controls. For the most invasive GSCs, data collection was stopped when invasion from neighboring spheres converged. (B–C) Human-specific staining of mouse brains injected with Invasive GSCs G411 (B) and G837 (C) with higher magnification (black inset) at the mass boundaries.
Figure 5—figure supplement 2
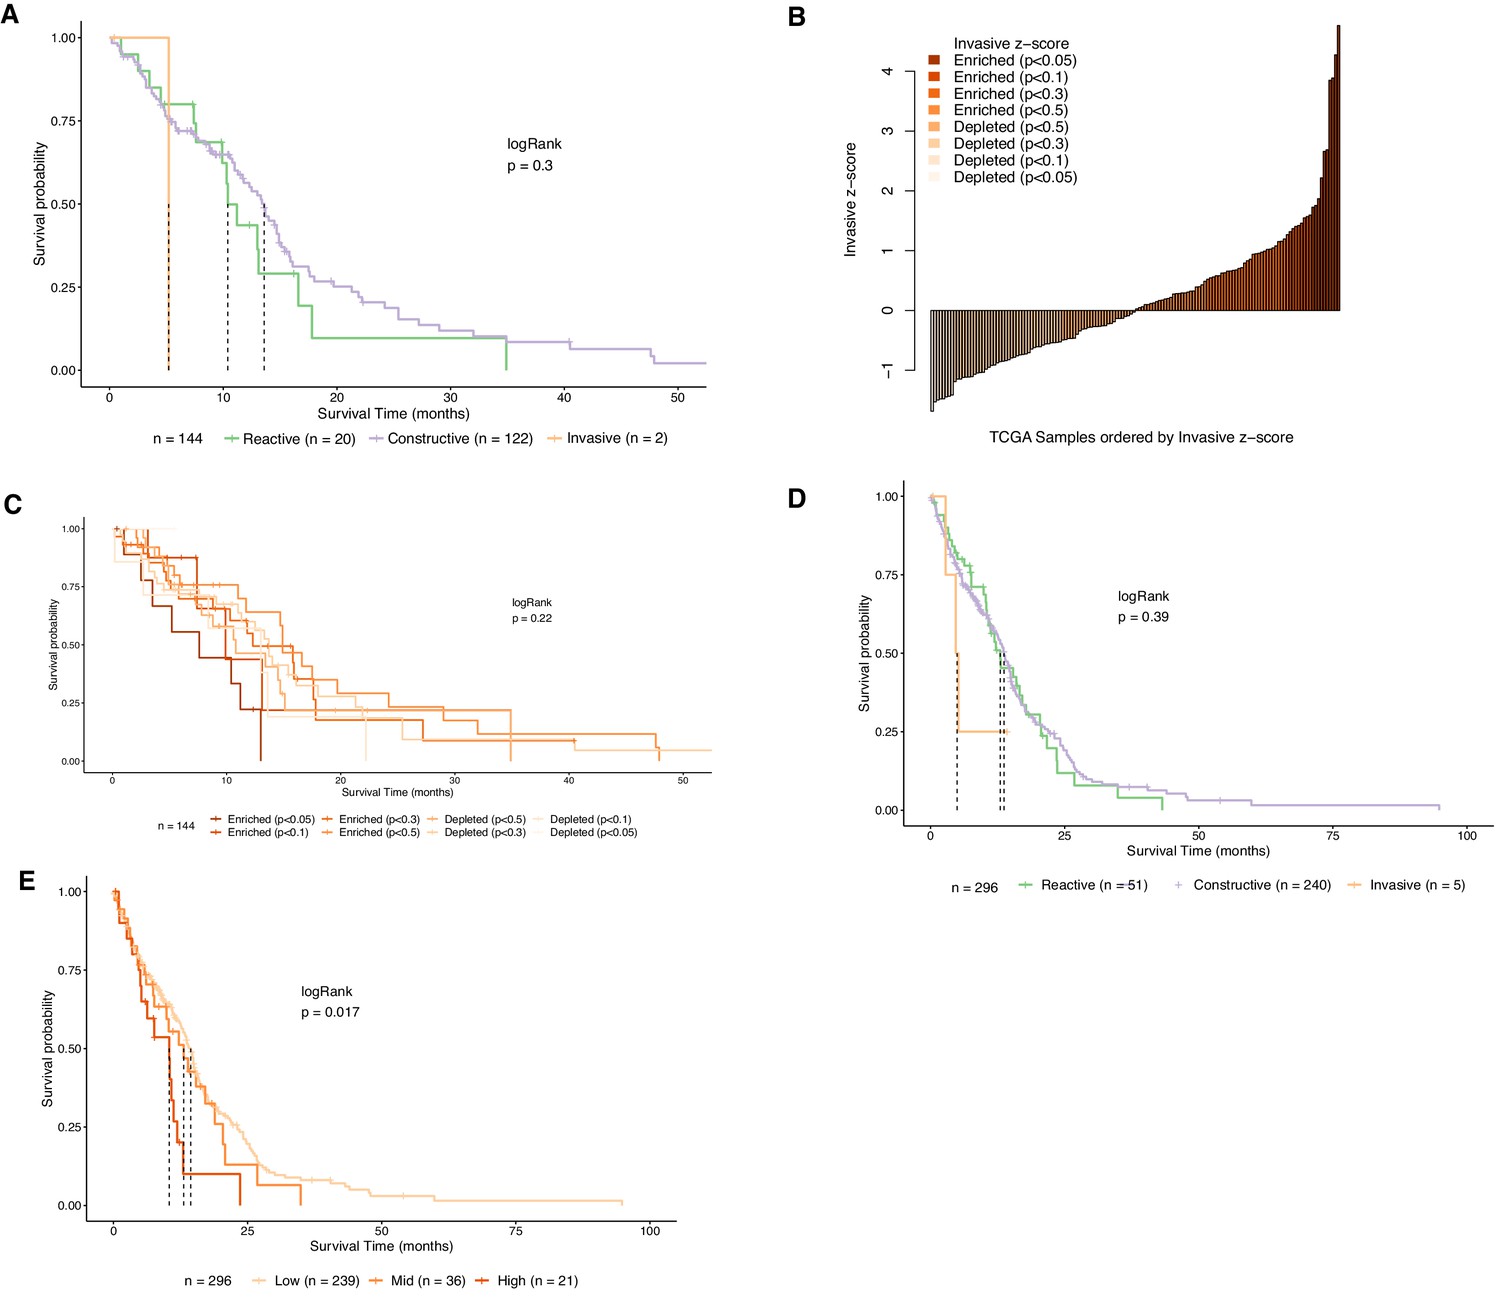
Assessment of Invasive GSC score classification.
(A) Kaplan–Meier plot for TCGA samples grouped by GSC state. The dotted lines indicate median survival. (B) TCGA samples ordered by increasing concordance with Invasive GSCs and grouped into eight subgroups. (C) Kaplan–Meier plot for TCGA samples grouped by concordance with Invasive GSCs. The dotted line indicates median survival. (D) Kaplan–Meier plot for TCGA samples from both RNA-seq and microarray-based expression grouped by GSC state. The dotted lines indicate median survival. (E) Kaplan–Meier plot for TCGA samples from both RNA-seq and microarray-based expression grouped by concordance with Invasive GSCs. The dotted line indicates median survival.
Additional files
-
Supplementary file 1
List of GSC state labels, patient age, and sex.
- https://cdn.elifesciences.org/articles/64090/elife-64090-supp1-v2.zip
-
Supplementary file 2
Coordinates of discriminating ATAC regions for each GSC state.
- https://cdn.elifesciences.org/articles/64090/elife-64090-supp2-v2.zip
-
Transparent reporting form
- https://cdn.elifesciences.org/articles/64090/elife-64090-transrepform-v2.docx
Download links
A two-part list of links to download the article, or parts of the article, in various formats.
Downloads (link to download the article as PDF)
Open citations (links to open the citations from this article in various online reference manager services)
Cite this article (links to download the citations from this article in formats compatible with various reference manager tools)
Single-cell chromatin accessibility profiling of glioblastoma identifies an invasive cancer stem cell population associated with lower survival
eLife 10:e64090.
https://doi.org/10.7554/eLife.64090


