NirD curtails the stringent response by inhibiting RelA activity in Escherichia coli
- Laboratoire de Chimie Bactérienne, Institut de Microbiologie de la Méditerranée, CNRS-Aix Marseille Univ (UMR7283), France
- Protein Expression Facility, Institut de Microbiologie de la Méditerranée, CNRS-Aix Marseille Univ, France
Figures
Figure 1 with 1 supplement
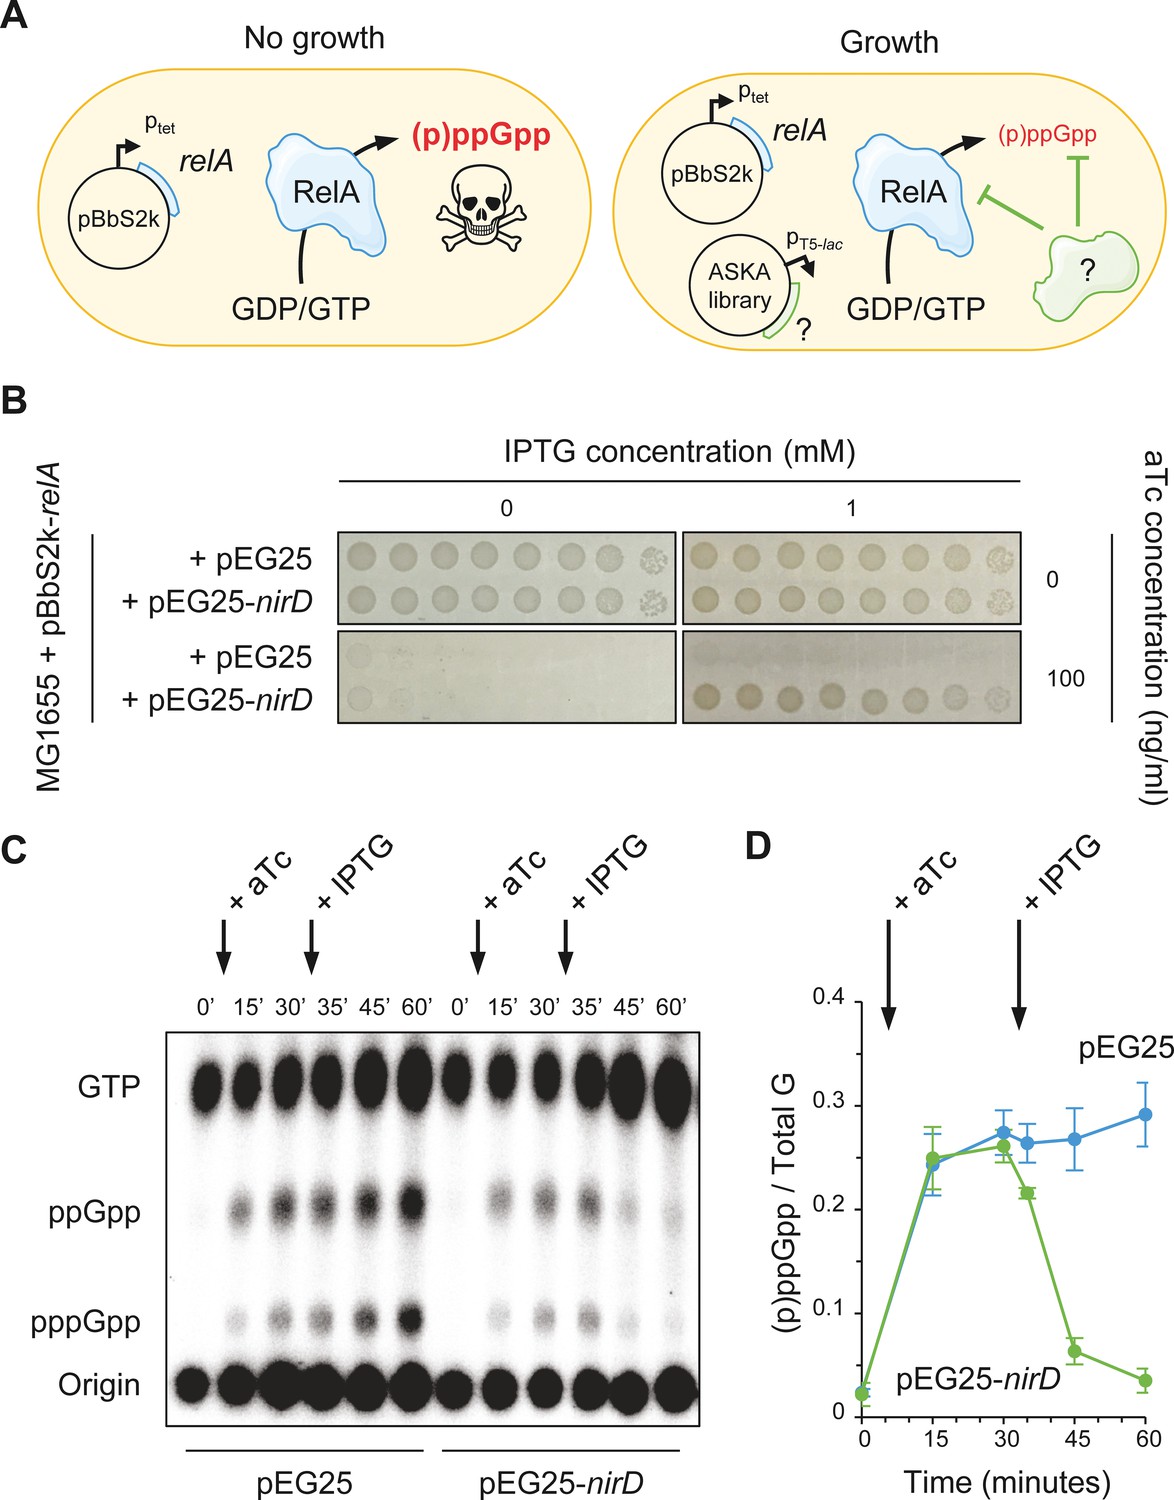
NirD can limit the RelA-dependent accumulation of (p)ppGpp.
(A) Schematic representation of the genetic assay using ASKA library to identify genes that in multiple copies would suppress the growth defect associated with toxic over-accumulation of (p)ppGpp. Question marks denote a putative candidate that limits RelA-dependent accumulation of (p)ppGpp. (B) NirD suppresses the growth defect associated with RelA overproduction. Wild-type E. coli MG1655 cells were co-transformed with the plasmid derivatives pBbS2k-relA and pEG25-nirD inducible by anhydrotetracycline (aTc) and isopropyl β-D-1-thiogalactopyranoside (IPTG), respectively. Serial dilutions of stationary-phase cultures were spotted on NA plates containing the indicated concentrations of inducers. Additional controls and inducer concentrations are shown in Figure 1—figure supplement 1A. The results are representative of three independent experiments with similar results. (C, D) In vivo (p)ppGpp dynamic in E. coli MG1655 cells carrying pBbS2k-relA and pEG25-nirD after consecutive expression of the relA and nirD genes using 100 ng/mL aTc and 1 mM IPTG, respectively. Nucleotides extracted from samples collected at the indicated times were separated by thin layer chromatography. The autoradiogram (C) is representative of three independent experiments, and the curves of the relative levels of (p)ppGpp (D) are represented as the means of the three independent experiments, the error bars depicting the SDs.
-
Figure 1—source data 1
Raw autoradiogram.
- https://cdn.elifesciences.org/articles/64092/elife-64092-fig1-data1-v1.zip
-
Figure 1—source data 2
Quantification of (p)ppGpp.
The amount of (p)ppGpp was normalized to total amount of G nucleotides observed in each sample. Total G is the sum of GTP and (p)ppGpp detected. The source data are provided for the relative levels of (p)ppGpp in Figure 1D, which are represented as the means and SDs of three independent experiments.
- https://cdn.elifesciences.org/articles/64092/elife-64092-fig1-data2-v1.zip
Figure 1—figure supplement 1
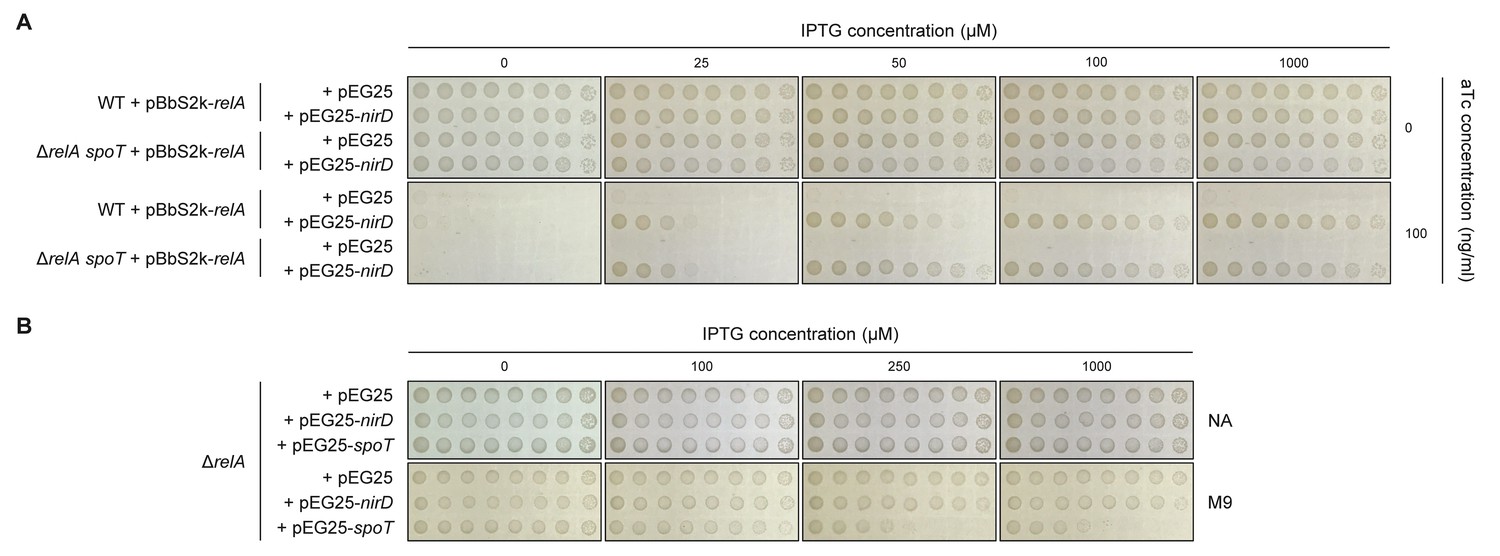
NirD can inhibit RelA-dependent (p)ppGpp synthesis.
(A) Growth assay of the E. coli MG1655 wild-type strain and its isogenic ΔrelA spoT mutant co-transformed with the plasmid derivatives pBbS2k-relA (sd4) and pEG25-nirD inducible by anhydrotetracycline (aTc) and isopropyl β-D-1-thiogalactopyranoside (IPTG), respectively. Serial dilutions of stationary-phase cultures were spotted on NA plates containing the indicated concentrations of inducers. The results are representative of three independent experiments. (B) Growth assay of the ΔrelA mutant carrying pEG25-nirD or pEG25-spoT. Serial dilutions of stationary-phase cultures were spotted on M9-glucose minimal medium plates containing the indicated concentrations of IPTG. The results are representative of three independent experiments.
Figure 2
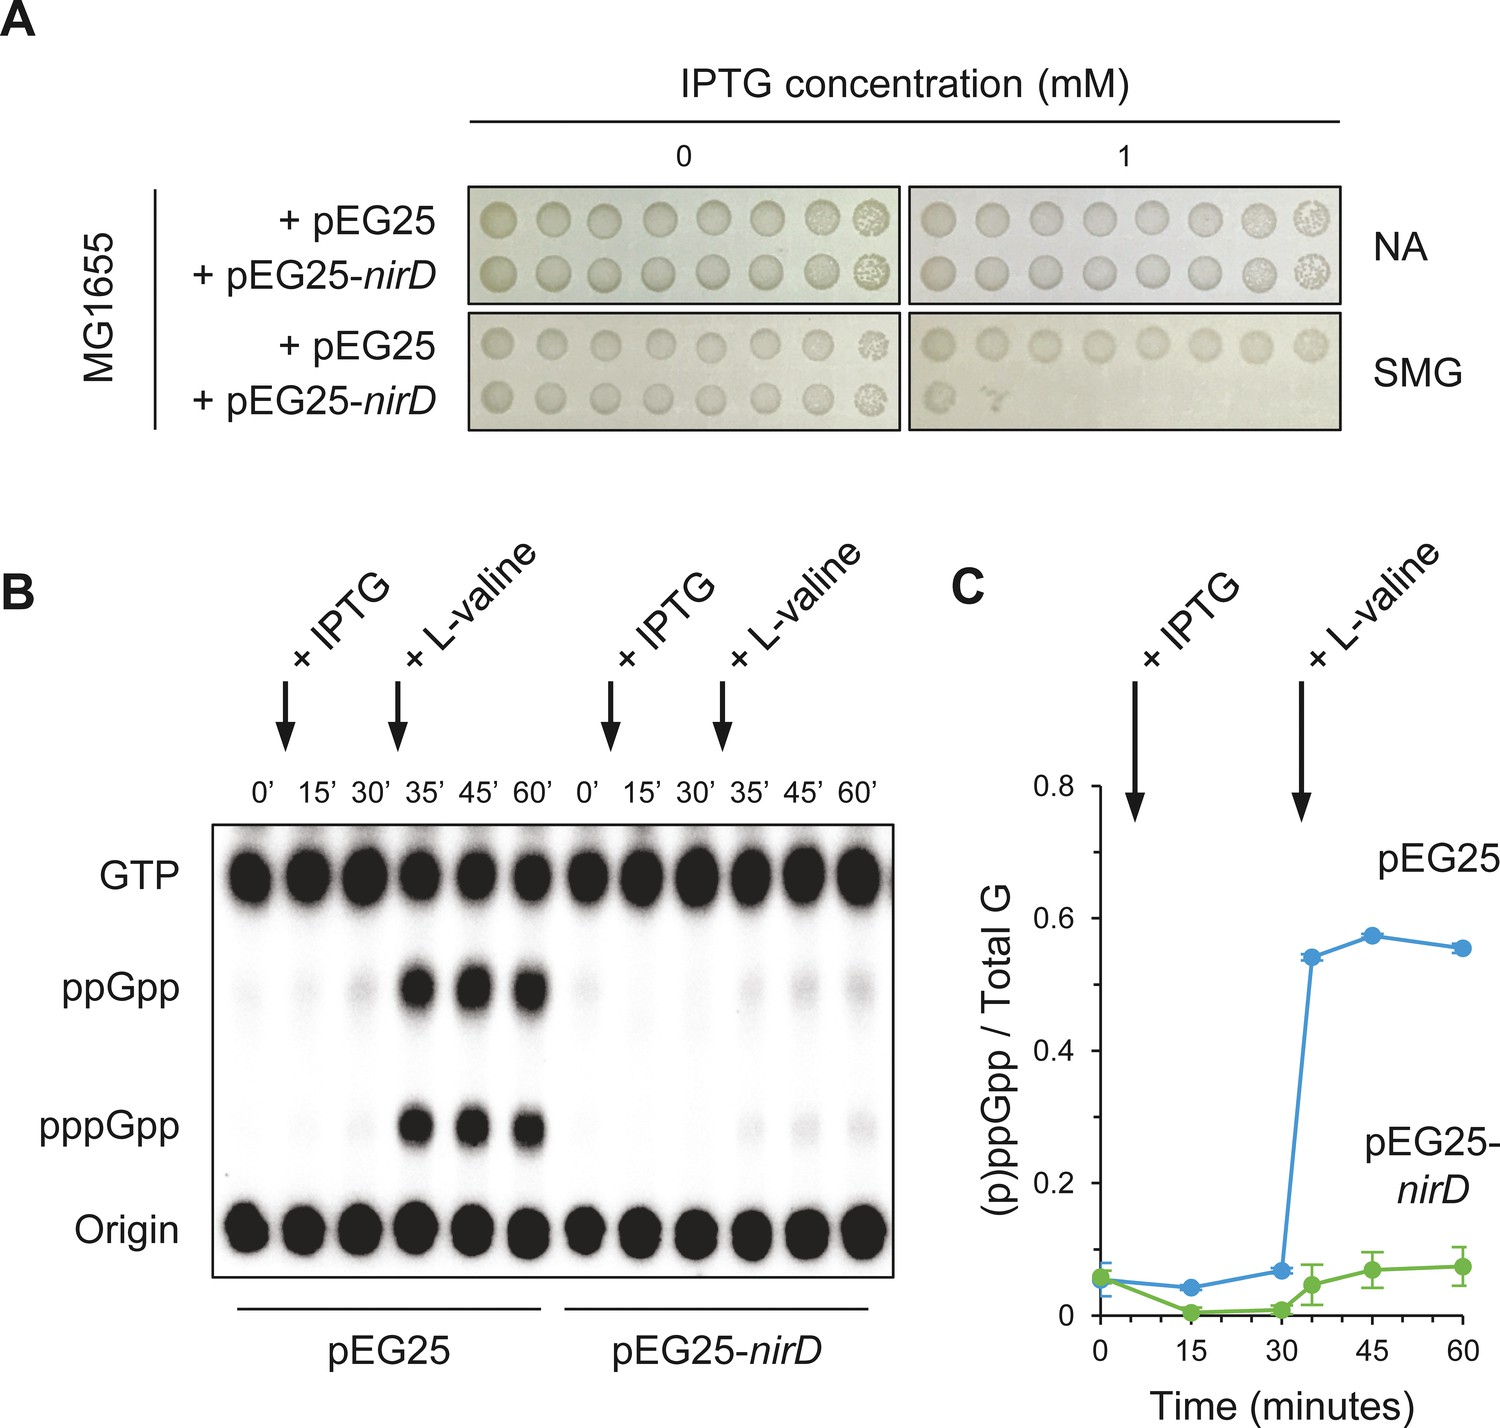
NirD inhibits accumulation of (p)ppGpp upon amino acid starvation.
(A) NirD inhibits cell growth on M9-glucose minimal medium supplemented with serine, methionine, and glycine (SMG). Stationary-phase cultures of wild-type E. coli MG1655 strain harboring pEG25-nirD or pEG25-spoT were spotted on NA and SMG plates containing the indicated concentrations of isopropyl β-D-1-thiogalactopyranoside (IPTG). The results are representative of three independent experiments. (B, C) Exponentially growing cells of wild-type E. coli MG1655 harboring pEG25 or pEG25-nirD were challenged for amino acid starvation by addition of 500 µg/mL of L-valine. nirD is induced by the addition of 1 mM of IPTG. Nucleotides were extracted and separated by thin layer chromatography. The autoradiogram (B) is representative of three independent experiments, and the curves of the relative levels of (p)ppGpp (C) are represented as the means of the three independent experiments, the error bars depicting the SDs.
-
Figure 2—source data 1
Raw autoradiogram.
- https://cdn.elifesciences.org/articles/64092/elife-64092-fig2-data1-v1.zip
-
Figure 2—source data 2
Quantification of (p)ppGpp.
The amount of (p)ppGpp was normalized to total amount of G nucleotides observed in each sample. Total G is the sum of GTP and (p)ppGpp detected. The source data are provided for the relative levels of (p)ppGpp in Figure 2C, which are represented as the means and SDs of three independent experiments.
- https://cdn.elifesciences.org/articles/64092/elife-64092-fig2-data2-v1.xlsx
Figure 3 with 1 supplement
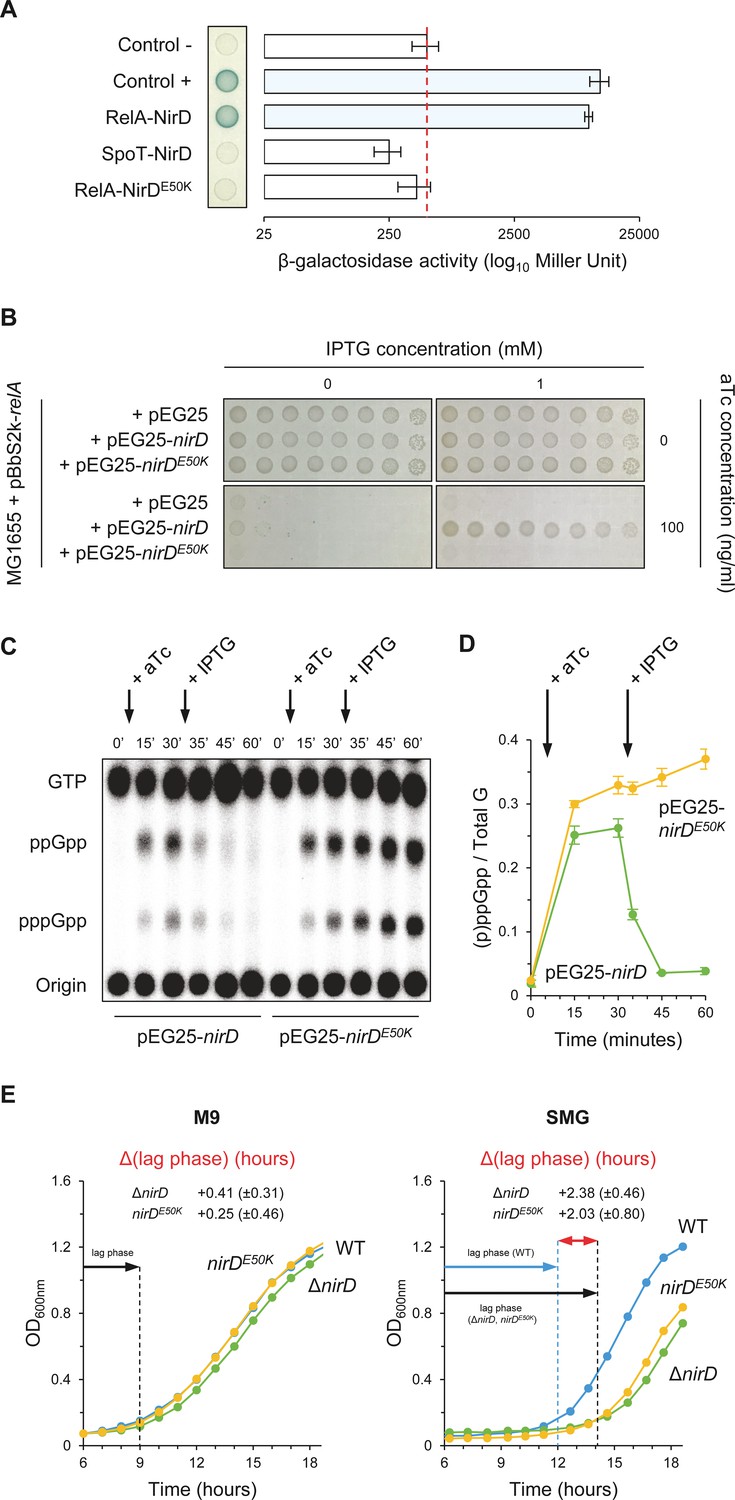
NirD can inhibit RelA-dependent accumulation through physical interaction in vivo.
(A) Bacterial two-hybrid assay using E. coli BTH101 cells co-transformed with plasmid derivatives pKT25-relA or pKT25-spoT and pUT18C-nirD or pUT18C-nirDE50K. Stationary-phase cultures were spotted on NA plates containing X-Gal as a blue color reporter for positive interaction. The bars showing β-galactosidase activity are represented as the means of three independent experiments, and the error bars depict the SDs. (B) Growth assay of E. coli MG1655 cells co-transformed with the plasmid derivatives pBbS2k-relA and pEG25-nirD or pEG25-nirDE50K inducible by anhydrotetracycline (aTc) and isopropyl β-D-1-thiogalactopyranoside (IPTG), respectively. Serial dilutions of stationary-phase cultures were spotted on NA plates containing the indicated concentrations of inducers. The results are representative of three independent experiments. (C, D) In vivo (p)ppGpp level dynamic in E. coli MG1655 cells carrying pBbS2k-relA and pEG25-nirD or pEG25-nirDE50K after successive inductions of expression of the relA and nirD or nirDE50K genes using 100 ng/mL aTc and 1 mM IPTG, respectively. Nucleotides extracted from samples collected at the indicated times were separated by thin layer chromatography. The autoradiogram (C) is representative of three independent experiments, and the curves of the relative levels of (p)ppGpp (D) are represented as the means of the three independent experiments, the error bars depicting the SDs. (E) Growth curves of wild-type (WT) cells, ΔnirD, and nirDE50K mutants under anaerobiosis in M9-glucose minimal medium without amino acids (left panel) or supplemented with 1 mM serine, methionine, and glycine (SMG) (right panel) (see Materials and methods). The growth curves are representative of at least three independent experiments, and the Δ(lag phase) are represented as the means (± SD) of the independent experiments.
-
Figure 3—source data 1
Determination of β-galactosidase activity.
The relative β-galactosidase activity was calculated as follows:. Slope is estimated by linear regression, and V is the volume of culture used (in mL). The source data are provided for the bar chart showing β-galactosidase activity in Figure 3A, which is represented as the means and SDs of three independent experiments.
- https://cdn.elifesciences.org/articles/64092/elife-64092-fig3-data1-v1.xlsx
-
Figure 3—source data 2
Raw autoradiogram.
- https://cdn.elifesciences.org/articles/64092/elife-64092-fig3-data2-v1.zip
-
Figure 3—source data 3
Quantification of (p)ppGpp.
The amount of (p)ppGpp was normalized to total amount of G nucleotides observed in each sample. Total G is the sum of GTP and (p)ppGpp detected. The source data are provided for the relative levels of (p)ppGpp in Figure 3D, which are represented as the means and SDs of three independent experiments.
- https://cdn.elifesciences.org/articles/64092/elife-64092-fig3-data3-v1.xlsx
-
Figure 3—source data 4
Determination of Δ(lag phase).
The Δ(lag phase) corresponds to the time that separates the growth recovery of the wild-type (WT) (lag phase [WT]) from that of the ΔnirD or nirDE50K (lag phase [ΔnirD, nirDE50K]). For each strain, the duration of the lag phase was calculated for an OD600nm corresponding to the entry into the exponential growth phase. The equation for this calculation was estimated by linear regression on the log phase of each growth curve. The source data are provided for the Δ(lag phase) in Figure 3E, which are represented as the means and SDs of at least three experiments.
- https://cdn.elifesciences.org/articles/64092/elife-64092-fig3-data4-v1.xlsx
Figure 3—figure supplement 1
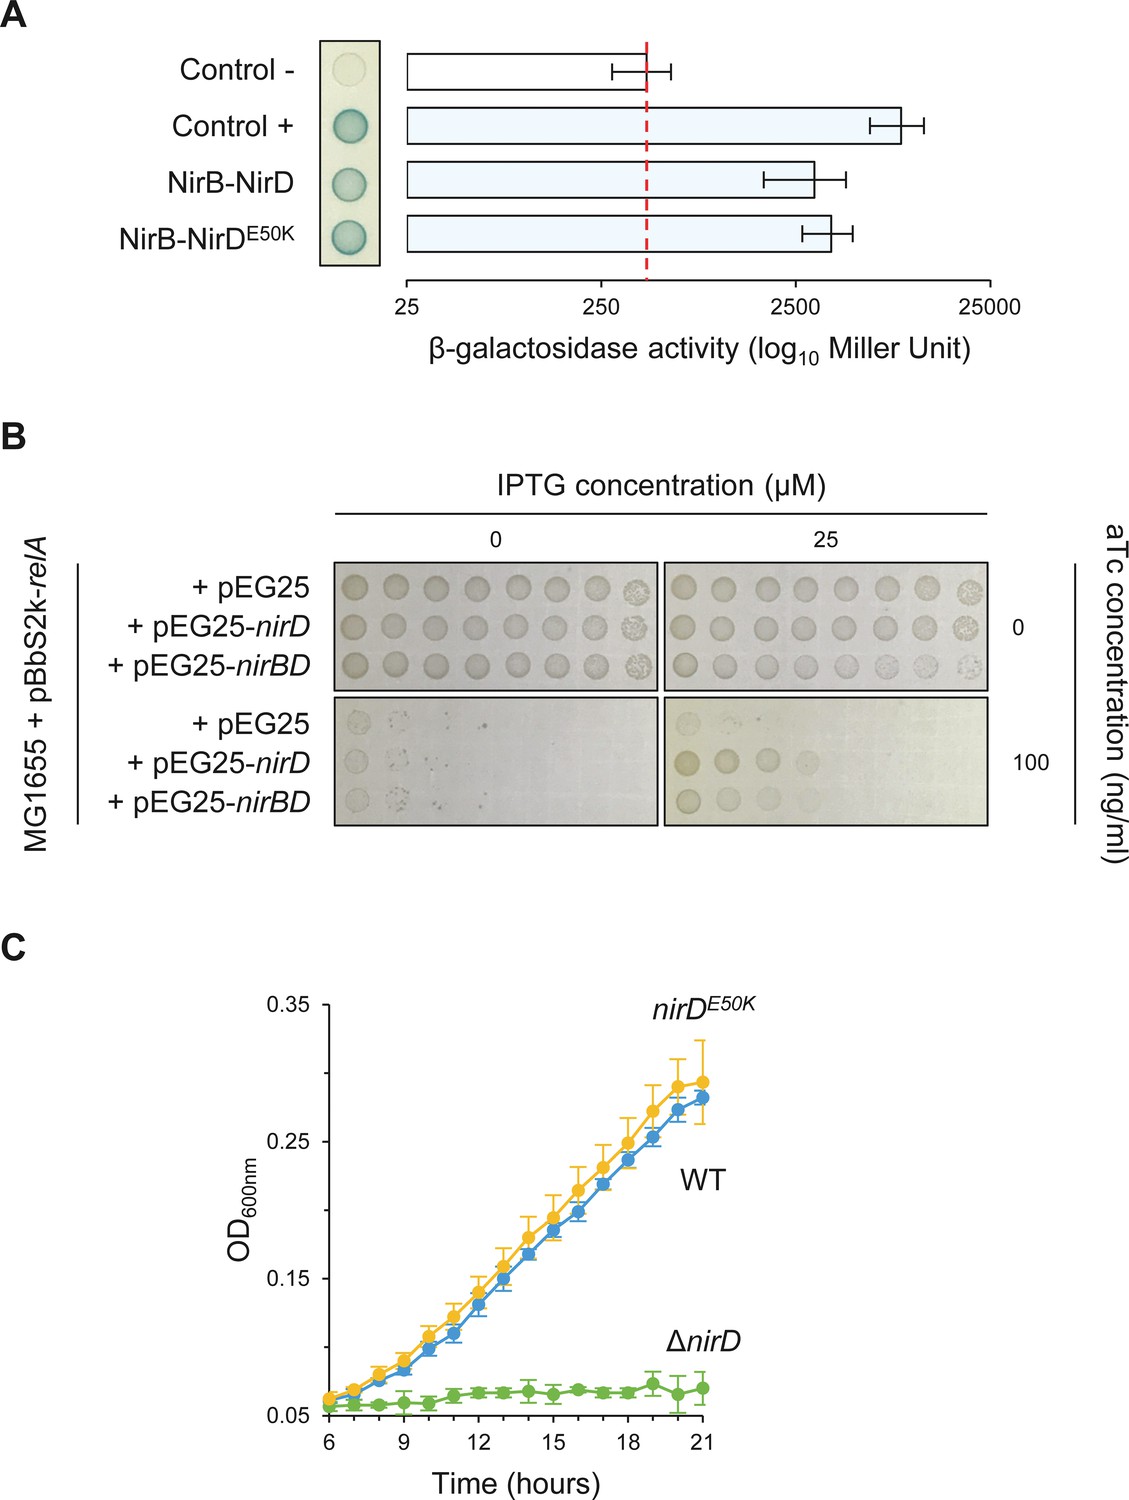
NirDE50K functionally interacts with NirB.
(A) Bacterial two-hybrid assay using E. coli BTH101 cells co-transformed with plasmid derivatives pKT25-nirB and pUT18C-nirD or pUT18C-nirDE50K. Stationary-phase cultures were spotted on NA plates containing X-Gal as a blue color reporter for positive interaction. The bars showing β-galactosidase activity are represented as the means of three independent experiments, and the error bars depict the SDs. (B) Growth assay of E. coli MG1655 cells co-transformed with the plasmid derivatives pBbS2k-relA and pEG25-nirD or pEG25-nirBD inducible by anhydrotetracycline (aTc) and isopropyl β-D-1-thiogalactopyranoside (IPTG), respectively. Serial dilutions of stationary-phase cultures were spotted on NA plates containing the indicated concentrations of inducers. The results are representative of three independent experiments. (C) Growth curves of wild-type (WT) cells, ΔnirD, and nirDE50K mutants under anaerobiosis in defined glycerol minimal medium supplemented with nitrate as the sole electron acceptor and as the sole nitrogen source (see Materials and methods). Under nitrate respiration, nitrate is converted to nitrite, which is subsequently converted to ammonium (NH4) by the cytosolic NADH-dependent nitrite reductase NirBD. Bacteria can then utilize NH4 as nitrogen source. Therefore, an active NADH-dependent nitrite reductase activity is required for anaerobic growth when nitrate is the sole nitrogen source (Wang et al., 2019b).
-
Figure 3—figure supplement 1—source data 1
Determination of β-galactosidase activity.
The relative β-galactosidase activity was calculated as follows:. Slope is estimated by linear regression, and V is the volume of culture used (in mL). The source data are provided for the bar chart showing β-galactosidase activity in Figure 3—figure supplement 1A, which is represented as the means and SDs of three independent experiments.
- https://cdn.elifesciences.org/articles/64092/elife-64092-fig3-figsupp1-data1-v1.xlsx
-
Figure 3—figure supplement 1—source data 2
Raw data for growth curves.
The source data are provided for the growth curves in Figure 3—figure supplement 1C, which are represented as the means and SDs of three independent experiments.
- https://cdn.elifesciences.org/articles/64092/elife-64092-fig3-figsupp1-data2-v1.xlsx
Figure 4 with 1 supplement
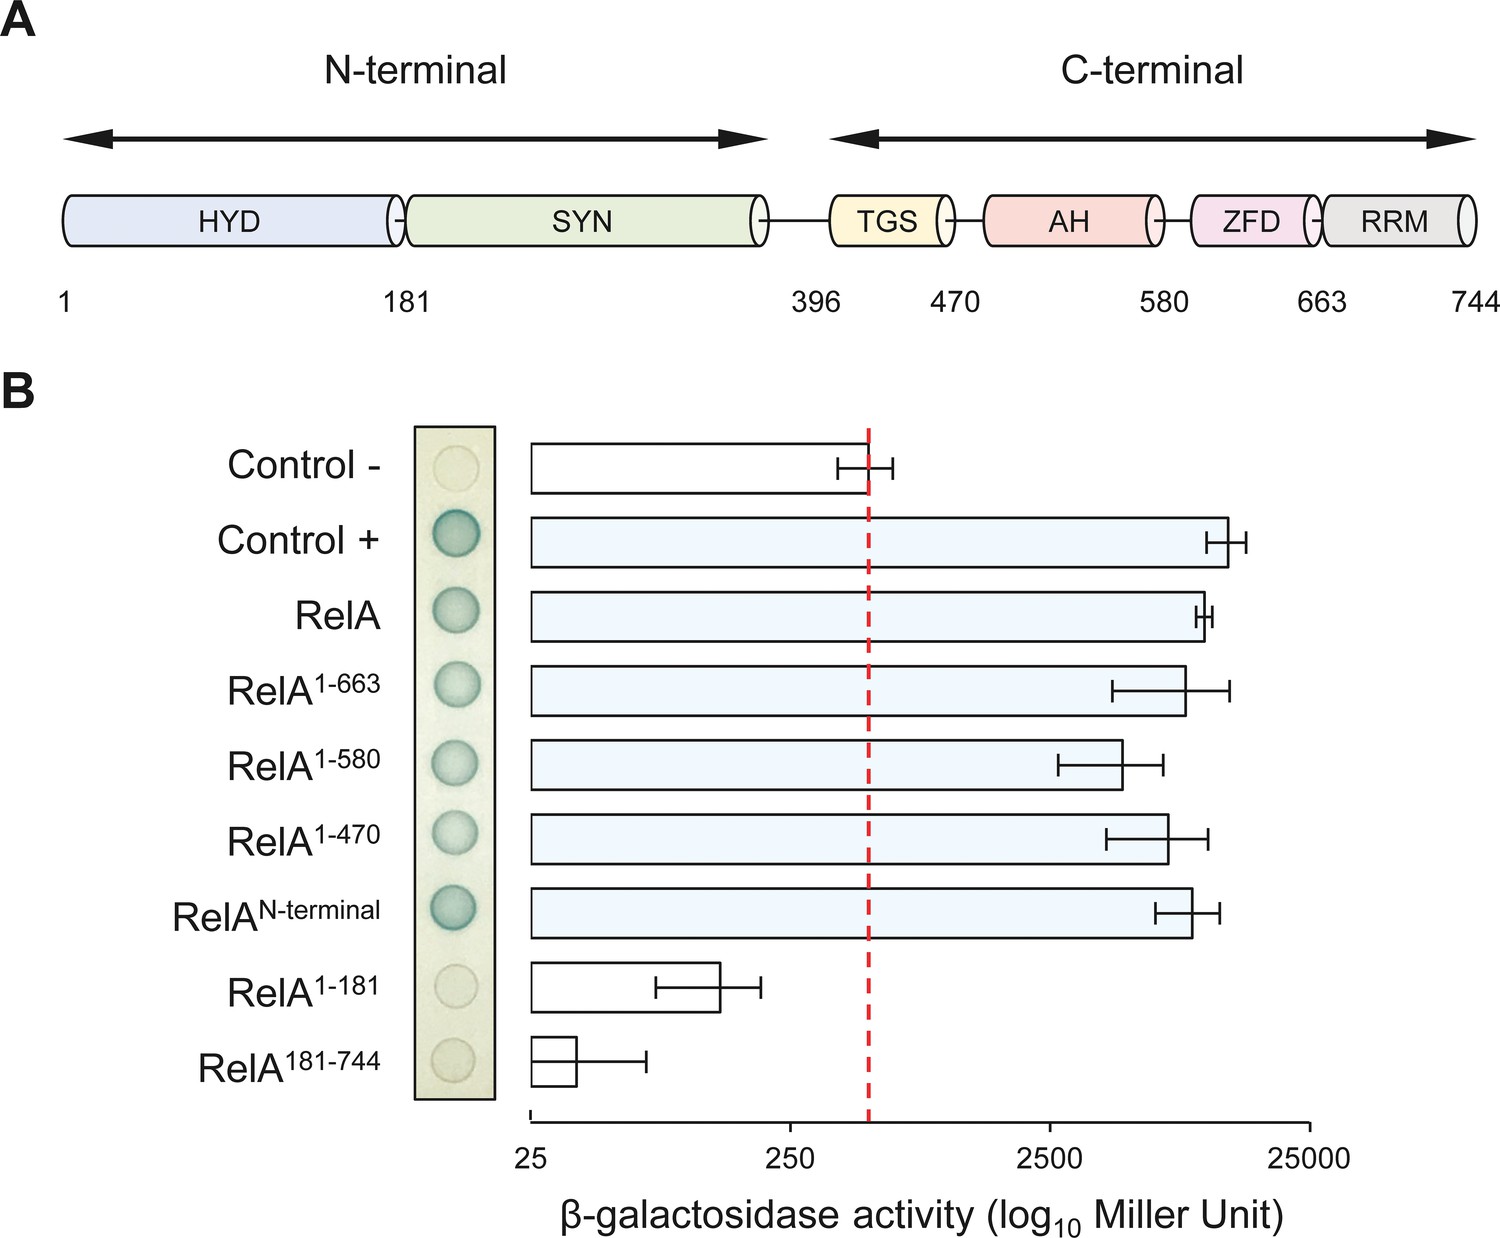
NirD can interact with the catalytic N-terminal region of RelA.
(A) Schematic representation of RelA and its protein domains. (B) Bacterial two-hybrid assay using E. coli BTH101 cells co-transformed with plasmid derivatives pUT18C-nirD and pKT25 with the full-length or truncated relA gene as indicated. Stationary-phase cultures were spotted on NA plates containing X-Gal as a blue color reporter for positive interaction. The bars showing β-galactosidase activity are represented as the means of three independent experiments, and the error bars depict the SDs.
-
Figure 4—source data 1
Determination of β-galactosidase activity.
The relative β-galactosidase activity was calculated as follows:. Slope is estimated by linear regression, and V is the volume of culture used (in mL). The source data are provided for the bar chart showing β-galactosidase activity in Figure 4B, which is represented as the means and SDs of three independent experiments.
- https://cdn.elifesciences.org/articles/64092/elife-64092-fig4-data1-v1.xlsx
Figure 4—figure supplement 1
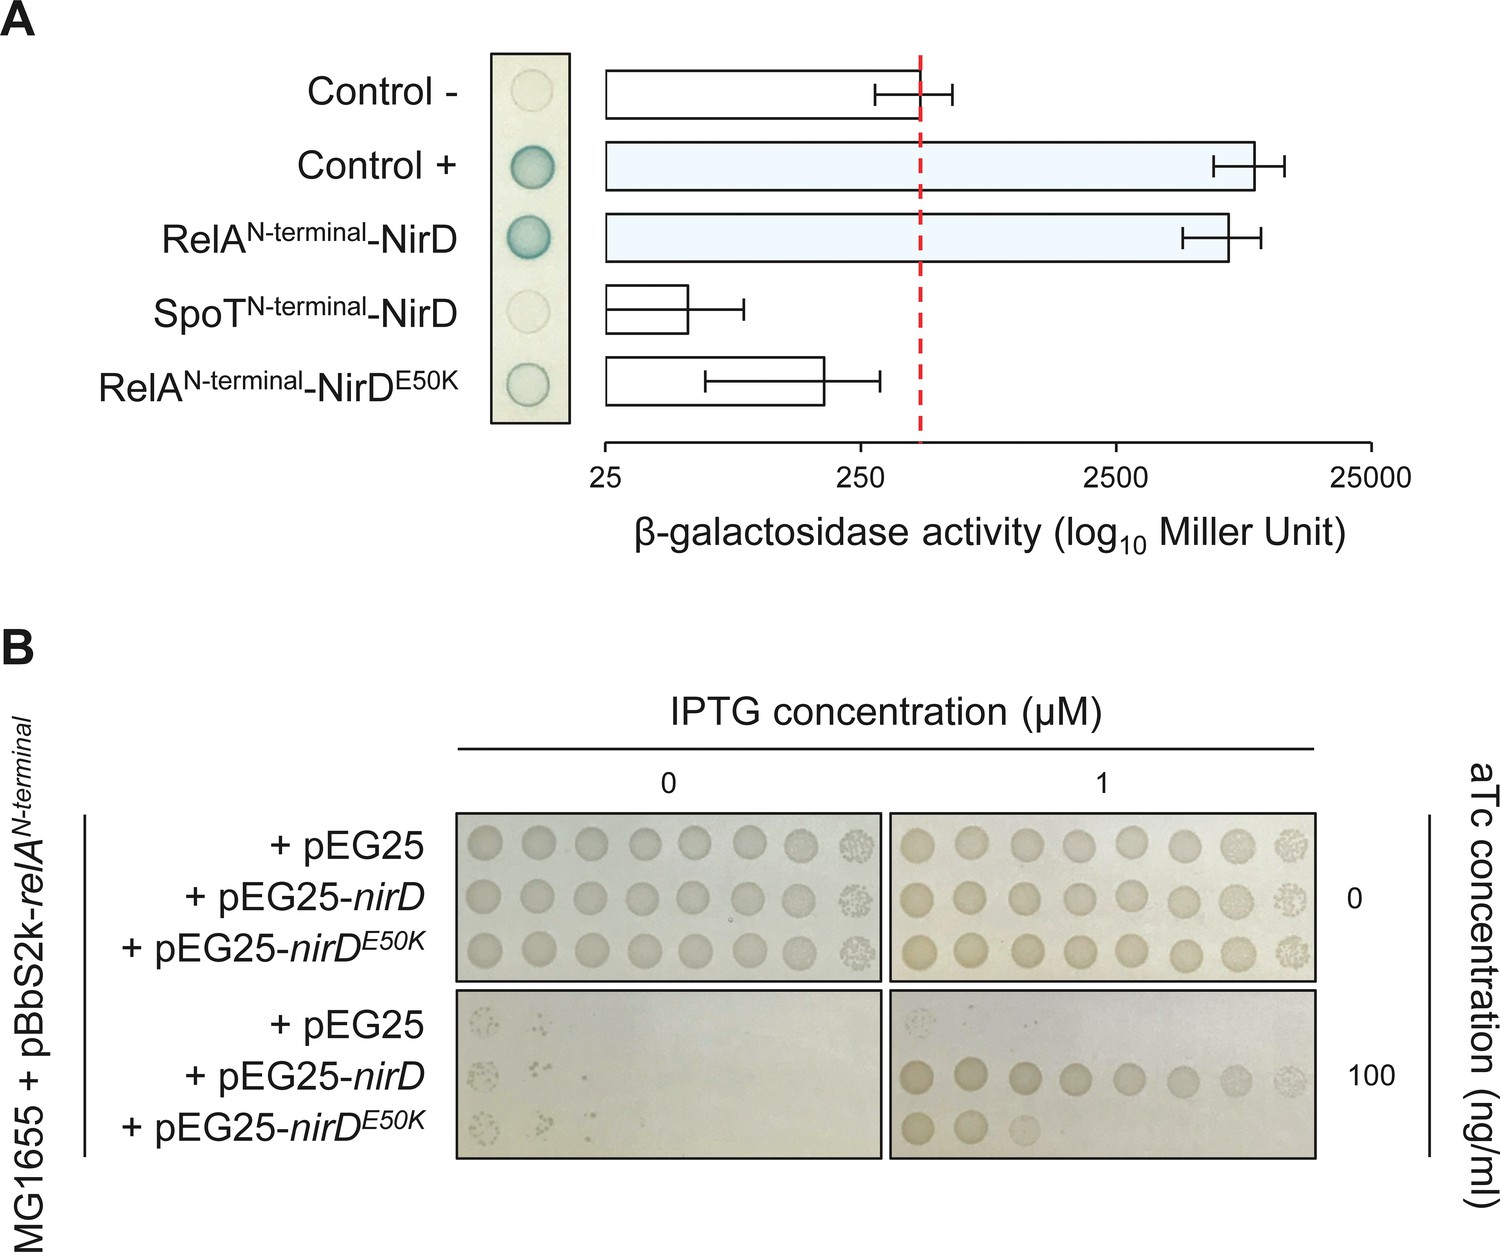
The RelAN-terminal-NirD interaction appears specific.
(A) Bacterial two-hybrid assay using E. coli BTH101 cells co-transformed with plasmid derivatives pKT25-relAN-terminal or pKT25-spoTN-terminal and pUT18C-nirD or pUT18C-nirDE50K. Stationary-phase cultures were spotted on NA plates containing X-Gal as a blue color reporter for positive interaction. The bars showing β-galactosidase activity are represented as the means of three independent experiments, and the error bars depict the SDs. (B) Growth assay of E. coli MG1655 cells co-transformed with the plasmid derivatives pBbS2k-relAN-terminal and pEG25-nirD or pEG25-nirDE50K inducible by anhydrotetracycline (aTc) and isopropyl β-D-1-thiogalactopyranoside (IPTG), respectively. Serial dilutions of stationary-phase cultures were spotted on NA plates containing the indicated concentrations of inducers. The results are representative of three independent experiments.
-
Figure 4—figure supplement 1—source data 1
Determination of β-galactosidase activity.
The relative β-galactosidase activity was calculated as follows:. Slope is estimated by linear regression, and V is the volume of culture used (in mL). The source data are provided for the bar chart showing β-galactosidase activity in Figure 4—figure supplement 1A, which is represented as the means and SDs of three independent experiments.
- https://cdn.elifesciences.org/articles/64092/elife-64092-fig4-figsupp1-data1-v1.xlsx
Figure 5 with 1 supplement

NirD directly interact with the catalytic N-terminal region of RelA.
(A) Biolayer interferometric assay of RelAN-terminal on NirD or NirDE50K. Biotinylated NirD or NirDE50K were immobilized on streptavidin biosensors and probed with RelAN-terminal at concentrations ranging from 0.1 to 30 µM. The curves are represented as the means of the subtracted reference binding responses during association and dissociation from three experiments, the error bars depicting the SDs. The inset curve shows the specific biolayer interferometry (BLI) response (nm) 10 s before the end of association as a function of RelAN-terminal concentration. Data are represented as the means of the three experiments, the error bars depicting the SDs. (B, C) Isothermal titration calorimetry profiles corresponding to the binding of RelAN-terminal 30–300 µM NirD (B) or 300 µM NirDE50K (C) at 25°C. The upper panels show raw data for titration of NirD or NirDE50K with RelAN-terminal, and the lower panels show the integrated heats of binding obtained from the raw data. The data were fitted using a ‘One Set of Sites’ model in the PEAQ-ITC Analysis Software.
-
Figure 5—source data 1
Raw data for biolayer interferometry (BLI) experiments.
The source data are provided for the BLI experiments in Figure 5A, which are represented as the means and SDs of three independent experiments.
- https://cdn.elifesciences.org/articles/64092/elife-64092-fig5-data1-v1.xlsx
-
Figure 5—source data 2
Raw data for isothermal titration calorimetry experiment run with NirD.
- https://cdn.elifesciences.org/articles/64092/elife-64092-fig5-data2-v1.xlsx
-
Figure 5—source data 3
Raw data for isothermal titration calorimetry experiment run with NirDE50K.
- https://cdn.elifesciences.org/articles/64092/elife-64092-fig5-data3-v1.xlsx
Figure 5—figure supplement 1
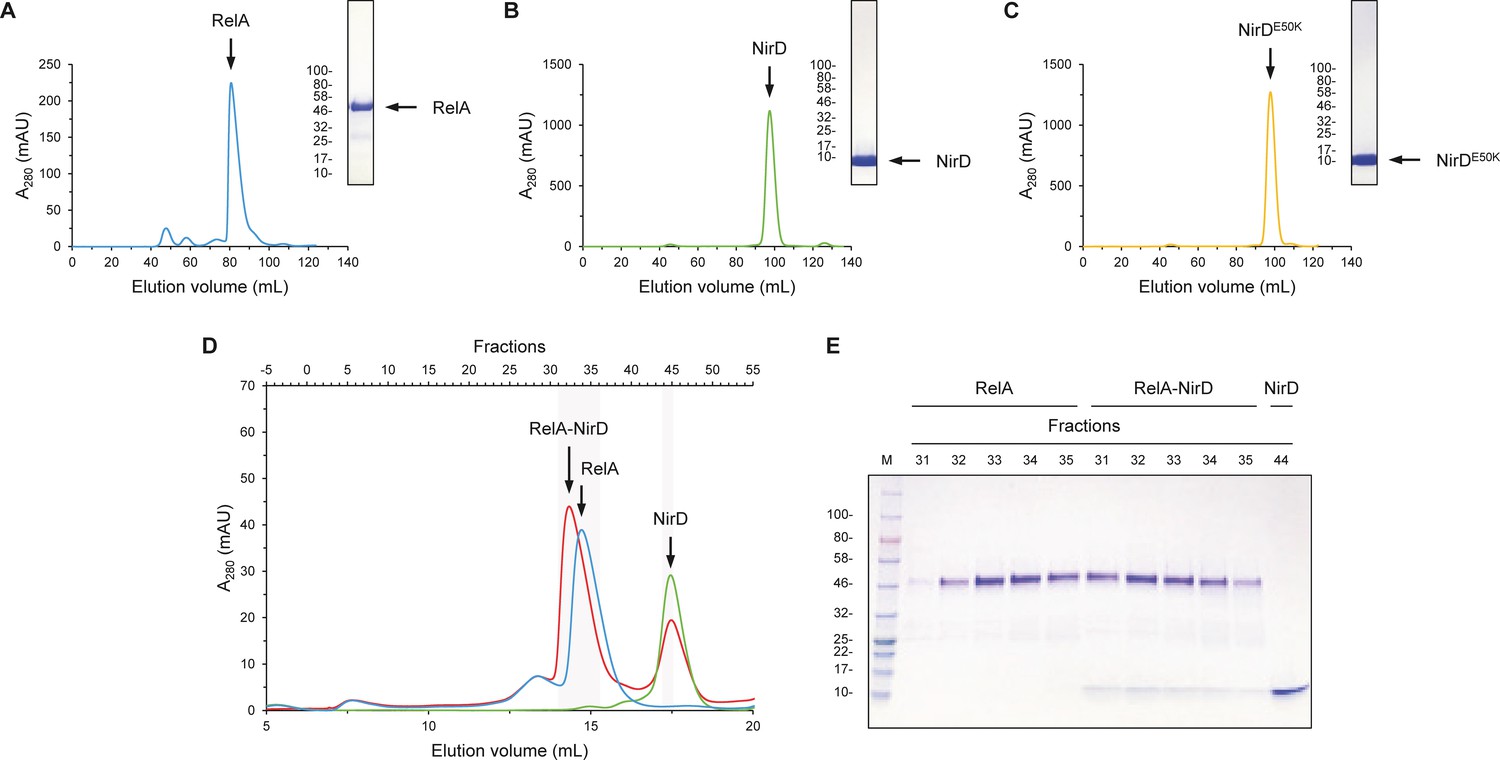
NirD can directly interact with the catalytic N-terminal region of RelA.
(A–C) Purification of RelAN-terminal (A), NirD (B), and NirDE50K (C) using size-exclusion chromatography (SEC). The curves show the absorbance at 280 nm as a function of the elution volume. The SEC elution fractions indicated by arrows were analyzed by 12% SDS-PAGE. For SDS-PAGE, molecular weight markers are expressed in kDa. (D, E) SEC experiment separating RelAN-terminal and NirD alone or pre-mixed. (D) The curves show the absorbance at 280 nm as a function of the elution volume. The SEC elution fractions highlighted were analyzed by 12% SDS-PAGE (E). For SDS-PAGE, molecular weight markers are expressed in kDa.
-
Figure 5—figure supplement 1—source data 1
Raw data for purification of RelAN-terminal.
- https://cdn.elifesciences.org/articles/64092/elife-64092-fig5-figsupp1-data1-v1.xlsx
-
Figure 5—figure supplement 1—source data 2
Raw SDS-PAGE for RelAN-terminal purification.
- https://cdn.elifesciences.org/articles/64092/elife-64092-fig5-figsupp1-data2-v1.zip
-
Figure 5—figure supplement 1—source data 3
Raw data for purification of NirD.
- https://cdn.elifesciences.org/articles/64092/elife-64092-fig5-figsupp1-data3-v1.xlsx
-
Figure 5—figure supplement 1—source data 4
Raw SDS-PAGE for NirD purification.
- https://cdn.elifesciences.org/articles/64092/elife-64092-fig5-figsupp1-data4-v1.zip
-
Figure 5—figure supplement 1—source data 5
Raw data for purification of NirDE50K.
- https://cdn.elifesciences.org/articles/64092/elife-64092-fig5-figsupp1-data5-v1.xlsx
-
Figure 5—figure supplement 1—source data 6
Raw SDS-PAGE for NirDE50K purification.
- https://cdn.elifesciences.org/articles/64092/elife-64092-fig5-figsupp1-data6-v1.zip
-
Figure 5—figure supplement 1—source data 7
Raw data for size-exclusion chromatography experiment separating RelAN-terminal and NirD alone or pre-mixed.
- https://cdn.elifesciences.org/articles/64092/elife-64092-fig5-figsupp1-data7-v1.xlsx
-
Figure 5—figure supplement 1—source data 8
Raw SDS-PAGE for size-exclusion chromatography experiment.
- https://cdn.elifesciences.org/articles/64092/elife-64092-fig5-figsupp1-data8-v1.zip
Figure 6
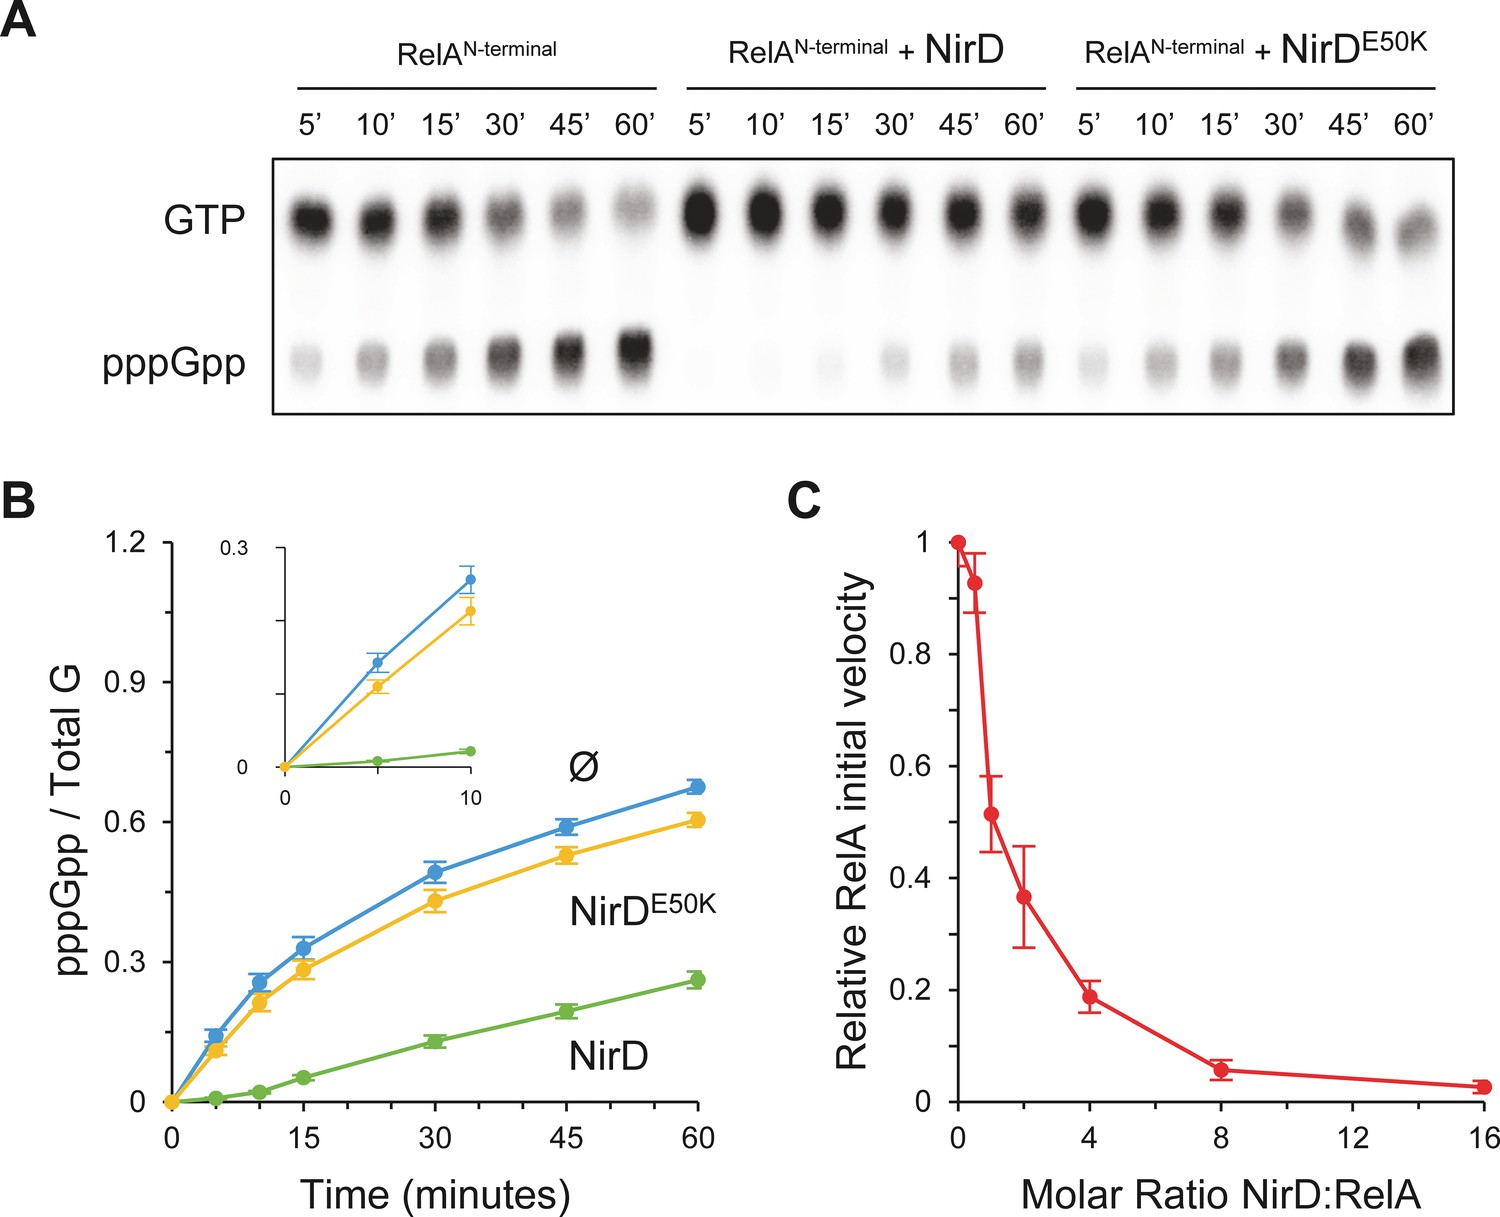
NirD inhibits RelA activity in vitro.
(A, B) In vitro pppGpp formation by 1 µM RelAN-terminal in the presence or absence of 4 µM NirD or NirDE50K. Samples collected at the indicated times were separated by thin layer chromatography (TLC). The autoradiogram (A) is representative of three experiments, and the curves of the relative levels of pppGpp (B) are represented as the means of the three experiments, the error bars depicting the SDs. (C) Relative initial velocity of RelA as a function of NirD:RelA molar ratio. The in vitro formation of pppGpp by 1 µM RelAN-terminal was assayed in the presence or absence of NirD at concentrations ranging from 0.5 to 16 µM. Samples were collected every 30 s over a period of 150 s and separated by TLC to determine the relative initial velocity (estimated by linear regression using five data points). Results are represented as the means of three experiments, and the error bars depict the SDs.
-
Figure 6—source data 1
Raw autoradiogram.
- https://cdn.elifesciences.org/articles/64092/elife-64092-fig6-data1-v1.zip
-
Figure 6—source data 2
Quantification of pppGpp.
The amount of pppGpp was normalized to total amount of G nucleotides observed in each sample. Total G is the sum of GTP and pppGpp detected. The source data are provided for the relative levels of pppGpp in Figure 6B, which are represented as the means and SDs of three independent experiments.
- https://cdn.elifesciences.org/articles/64092/elife-64092-fig6-data2-v1.xlsx
-
Figure 6—source data 3
Determination of the relative initial velocity.
The relative initial velocity was estimated on the linear part of the in vitro pppGpp formation by linear regression at the very beginning of the reaction. The source data are provided for the results in Figure 6C, which are represented as the means and SDs of three experiments.
- https://cdn.elifesciences.org/articles/64092/elife-64092-fig6-data3-v1.xlsx
Author response image 1
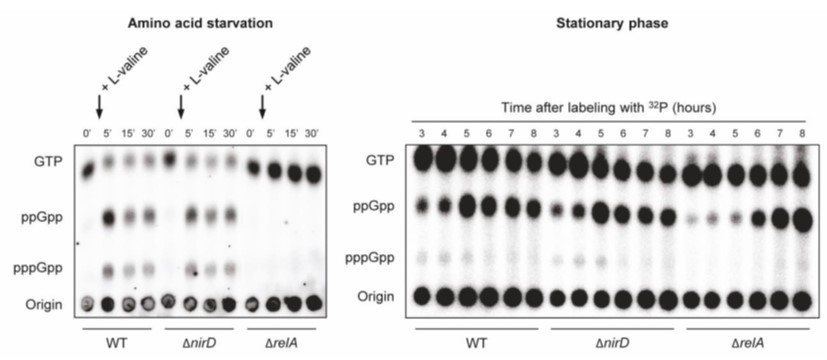
nirD does not seem to impact accumulation of (p)ppGpp during amino acid starvation or in stationary phase under aerobic conditions.
Author response image 2
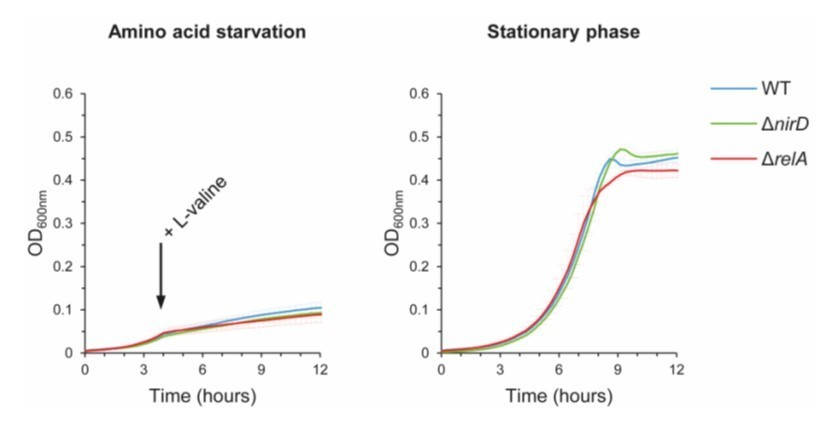
nirD does not seem to affect growth during amino acid starvation or in stationary phase under aerobic conditions.
Tables
Appendix 1—key resources table
| Reagent type (species) or resource | Designation | Source or reference | Identifiers | Additional information |
|---|---|---|---|---|
| strain, strain background (Escherichia coli) | BTH101 | Karimova et al., 1998 doi: 10.1073/pnas.95.10.5752 | F– cya-99 araD139 galE15 galK16 rpsL(StrR) hsdR2 mcrA1 mcrB1 relA1 | |
| strain, strain background (E. coli) | BL21 (DE3) | New England Biolabs | B F– ompT gal | |
| strain, strain background (E. coli) | MG1655; WT | Lab collection | Wild-type | |
| strain, strain background (E. coli) | nirDE50K | This paper | MG1655 nirDE50K | |
| strain, strain background (E. coli) | ΔnirD | This paper | MG1655 nirD::FRT; P1 from KEIO collection (resistance cassette has been flipped out) (Baba et al., 2006) | |
| strain, strain background (E. coli) | ΔrelA | Germain et al., 2019 doi: 10.1038/s41467-019-13764-4 | MG1655 relA::FRT | |
| strain, strain background (E. coli) | ΔrelA spoT | This paper | MG1655 relA::FRT spoT207::cat; P1 transduction from CF1693 (Baba et al., 2006) in MG1655 relA::FRT | |
| recombinant DNA reagent | pBbS2k-rfp | Lee et al., 2011 doi: 10.1186/1754-1611-5-12 | KanR, Ptet, rfp | |
| recombinant DNA reagent | pBbS2k-relA | This paper | KanR, Ptet, relA; primers 16/17; Maisonneuve lab | |
| recombinant DNA reagent | pBbS2k-relA (sd4) | This paper | KanR, Ptet, sd4, relA; primers 163/17; Maisonneuve lab | |
| recombinant DNA reagent | pBbS2k-relAN-terminal | This paper | KanR, Ptet, relAN-terminal; primers 16/557; Maisonneuve lab | |
| recombinant DNA reagent | pEG25 | Germain et al., 2019 doi: 10.1038/s41467-019-13764-4 | AmpR, PT5-lac | |
| recombinant DNA reagent | pEG25-nirD | This paper | AmpR, PT5-lac, nirD; primers 386/387; Maisonneuve lab | |
| recombinant DNA reagent | pEG25-spoT (sd8U) | Germain et al., 2019 doi: 10.1038/s41467-019-13764-4 | AmpR, PT5-lac, sd8U, spoT | |
| recombinant DNA reagent | pEG25-nirDE50K | This paper | AmpR, PT5-lac, nirDE50K; primers 386/387; Maisonneuve lab | |
| recombinant DNA reagent | pEG25-nirD (WTsd) | This paper | AmpR, PT5-lac, WTsd, nirD; primers 555/387; Maisonneuve lab | |
| recombinant DNA reagent | pEG25-nirBD (WTsd) | This paper | AmpR, PT5-lac, WTsd, nirBD; primers 553/544; Maisonneuve lab | |
| recombinant DNA reagent | pEG25-relAN-terminal | Germain et al., 2019 doi: 10.1038/s41467-019-13764-4 | AmpR, PT5-lac, relAN-terminal | |
| recombinant DNA reagent | pKD46 | Datsenko and Wanner, 2000 doi: 10.1073/pnas.120163297 | AmpR, Para, λ Red | |
| recombinant DNA reagent | pKT25 | Karimova et al., 1998 doi: 10.1073/pnas.95.10.5752 | KanR | |
| recombinant DNA reagent | pKT25-zip | Karimova et al., 1998 doi: 10.1073/pnas.95.10.5752 | KanR, zip | |
| recombinant DNA reagent | pKT25-relA | Germain et al., 2019 doi: 10.1038/s41467-019-13764-4 | KanR, relA | |
| recombinant DNA reagent | pKT25-spoT | Germain et al., 2019 doi: 10.1038/s41467-019-13764-4 | KanR, spoT | |
| recombinant DNA reagent | pKT25-nirB | This paper | KanR, nirB; primers 617/618; Maisonneuve lab | |
| recombinant DNA reagent | pKT25-relA1-663 | This paper | KanR, relA1-663; primers 497/502; Maisonneuve lab | |
| recombinant DNA reagent | pKT25-relA1-580 | This paper | KanR, relA1-580; primers 497/501; Maisonneuve lab | |
| recombinant DNA reagent | pKT25-relA1-470 | This paper | KanR, relA1-470; primers 497/500; Maisonneuve lab | |
| recombinant DNA reagent | pKT25-relAN-terminal | This paper | KanR, relAN-terminal; primers 497/499; Maisonneuve lab | |
| recombinant DNA reagent | pKT25-relA1-181 | This paper | KanR, relA1-181; primers 497/498; Maisonneuve lab | |
| recombinant DNA reagent | pKT25-relA181-744 | This paper | KanR, relA181-744; primers 531/533; Maisonneuve lab | |
| recombinant DNA reagent | pKT25-spoTN-terminal | Germain et al., 2019 doi: 10.1038/s41467-019-13764-4 | KanR, relAN-terminal | |
| recombinant DNA reagent | pUT18C | Karimova et al., 1998 doi: 10.1073/pnas.95.10.5752 | AmpR | |
| recombinant DNA reagent | pUT18C-zip | Karimova et al., 1998 doi: 10.1073/pnas.95.10.5752 | AmpR, zip | |
| recombinant DNA reagent | pUT18C-nirD | This paper | AmpR, nirD; primers 441/443; Maisonneuve lab | |
| recombinant DNA reagent | pUT18C-nirDE50K | This paper | AmpR, nirDE50K; primers 441/443; Maisonneuve lab | |
| recombinant DNA reagent | pET28a(+) | Germain et al., 2019 doi: 10.1038/s41467-019-13764-4 | KanR, Trx, His | |
| recombinant DNA reagent | pET28a(+)-nirD | This paper | KanR, Trx, His, TEV, nirD; primers 558/544; Maisonneuve lab | |
| recombinant DNA reagent | pET28a(+)-nirDE50K | This paper | KanR, Trx, His, TEV, nirDE50K; primers 558/544; Maisonneuve lab | |
| recombinant DNA reagent | pWRG99 | Blank et al., 2011 doi: 10.1371/journal.pone.0015763 | pKD46 with Ptet, I-SceI | |
| recombinant DNA reagent | pWRG100 | Karimova et al., 1998 doi: 10.1073/pnas.95.10.5752 doi: 10.1371/journal.pone.0015763 | pKD3 with I-SceI recognition site | |
| sequence-based reagent | Primer 16 | This paper | CCCCGAATTCGTCGACTCAAGGAGGTTTTATAAATGGTTGCGGTAAGAAGTGCA; restriction enzyme EcoRI; Maisonneuve lab | |
| sequence-based reagent | Primer 17 | This paper | CCCCGGATCCCTAACTCCCGTGCAACCGAC; restriction enzyme BamHI; Maisonneuve lab | |
| sequence-based reagent | Primer 163 | This paper | CCCCGAATTCGTCGACTCAAGGATTAAATGGTTGCGGTAAGAAGTGCA; restriction enzyme EcoRI; Maisonneuve lab | |
| sequence-based reagent | Primer 386 | This paper | CCCCGAATTCGTCGACTCAAGGAGGTTTTATAAATGAGCCAGTGGAAAGACAT; restriction enzyme EcoRI; Maisonneuve lab | |
| sequence-based reagent | Primer 387 | This paper | CCCCGGATCCTTAACCGCGCAGCTGCACCA; restriction enzyme BamHI; Maisonneuve lab | |
| sequence-based reagent | Primer 441 | This paper | CCCCTCTAGAAATGAGCCAGTGGAAAGACAT; restriction enzyme XbaI; Maisonneuve lab | |
| sequence-based reagent | Primer 443 | This paper | CCCCGGTACCTTAACCGCGCAGCTGCACCA; restriction enzyme KpnI; Maisonneuve lab | |
| sequence-based reagent | Primer 497 | This paper | CCCCTCTAGAAATGGTTGCGGTAAGAAGTGC; restriction enzyme XbaI; Maisonneuve lab | |
| sequence-based reagent | Primer 498 | This paper | CCCCGGTACCGATGTTGGTACACTCTTTTG; restriction enzyme KpnI; Maisonneuve lab | |
| sequence-based reagent | Primer 499 | This paper | CCCCGGTACCTTCGTCGAGCATTTCGCCGG; restriction enzyme KpnI; Maisonneuve lab | |
| sequence-based reagent | Primer 500 | This paper | CCCCGGTACCGTTCGGCTGTTTCTGGGTGA; restriction enzyme KpnI; Maisonneuve lab | |
| sequence-based reagent | Primer 501 | This paper | CCCCGGTACCAAGTTGCTTCAGCGCGGCGG; restriction enzyme KpnI; Maisonneuve lab | |
| sequence-based reagent | Primer 502 | This paper | CCCCGGTACCGGCGGAGTAGCTCTCACCCC; restriction enzyme KpnI; Maisonneuve lab | |
| sequence-based reagent | Primer 531 | This paper | CCCCTCTAGAATACGCACCGCTGGCTAACCG; restriction enzyme XbaI; Maisonneuve lab | |
| sequence-based reagent | Primer 533 | This paper | CCCCGGTACCCTAACTCCCGTGCAACCGAC; restriction enzyme KpnI; Maisonneuve lab | |
| sequence-based reagent | Primer 544 | This paper | CCCCAAGCTTTTAACCGCGCAGCTGCACCA; restriction enzyme HindIII; Maisonneuve lab | |
| sequence-based reagent | Primer 553 | This paper | CCCCGAATTCAATAGAAAAGAAATCGAGGCAAAAATGAGCAAAGTCAGACTCGC; restriction enzyme EcoRI; Maisonneuve lab | |
| sequence-based reagent | Primer 555 | This paper | CCCCGAATTCAGTAACTCTGGTGGAGGACAACGCATGAGCCAGTGGAAAGACAT; restriction enzyme EcoRI; Maisonneuve lab | |
| sequence-based reagent | Primer 557 | This paper | CCCCGGATCCTTATTCGTCGAGCATTTCGCCGG; restriction enzyme BamHI; Maisonneuve lab | |
| sequence-based reagent | Primer 558 | This paper | CCCCGGATCCGAGAACCTGTACTTCCAATCAATGAGCCAGTGGAAAGACAT; restriction enzyme BamHI; Maisonneuve lab | |
| sequence-based reagent | Primer 617 | This paper | CCCCTCTAGAAATGAGCAAAGTCAGACTCGC; restriction enzyme XbaI; Maisonneuve lab | |
| sequence-based reagent | Primer 618 | This paper | CCCCGGTACCTCATGCGTTGTCCTCCACCA; restriction enzyme KpnI; Maisonneuve lab | |
| sequence-based reagent | Primer 629 | This paper | ATGAGCCAGTGGAAAGACATCTGCAAAATCGATGACATCCTGCCTGAAACCGCCTTACGCCCCGCCCTGC; Maisonneuve lab | |
| sequence-based reagent | Primer 630 | This paper | TTAACCGCGCAGCTGCACCACGCCGTCTTTCACTCGCGCTTCGTAATGTTCTAGACTATATTACCCTGTT; Maisonneuve lab | |
| sequence-based reagent | Primer 655 | This paper | ATGAGCCAGTGGAAAGACAT; Maisonneuve lab | |
| sequence-based reagent | Primer 656 | This paper | TTAACCGCGCAGCTGCACCA; Maisonneuve lab | |
| chemical compound, drug | [α32P]GTP | PerkinElmer | Catalog number: BLU006H250UC | |
| chemical compound, drug | 32P | PerkinElmer | Catalog number: NEX053H001MC | |
| chemical compound, drug | EZ-Link NHS-PEG4-Biotin | Thermo Scientific | Catalog number: 21330 | |
| software, algorithm | BLItz Pro Software | https://www.sartorius.com/en/products/protein-analysis | ||
| software, algorithm | MicroCal PEAQ-ITC Analysis Software | Malvern Panalytical | https://www.malvernpanalytical.com/fr/products/product-range/microcal-range/microcal-itc-range/microcal-peaq-itc | |
| software, algorithm | Prism 5.0 software | GraphPad | https://www.graphpad.com/scientific-software/prism/ | |
| other | HiLoad 16/600 Superdex 200 column | GE Healthcare | Catalog number: GE28-9893-35 | |
| other | HiPrep 26/10 Desalting column | GE Healthcare | Catalog number: GE17-5087-01 | |
| other | HisTrap column | GE Healthcare | Catalog number: GE17-5248-02 | |
| other | Streptavidin Biosensors | FortéBio | Catalog number: 18-5117 | |
| other | Superdex 200 10/300 GL | GE Healthcare | Catalog number: GE28-9909-44 | |
| other | Zeba Spin Desalting column | Thermo Scientific | Catalog number: 89882 |
Additional files
-
Supplementary file 1
Media used in this work.
- https://cdn.elifesciences.org/articles/64092/elife-64092-supp1-v1.docx
-
Transparent reporting form
- https://cdn.elifesciences.org/articles/64092/elife-64092-transrepform-v1.docx
Download links
A two-part list of links to download the article, or parts of the article, in various formats.
Downloads (link to download the article as PDF)
Open citations (links to open the citations from this article in various online reference manager services)
Cite this article (links to download the citations from this article in formats compatible with various reference manager tools)
NirD curtails the stringent response by inhibiting RelA activity in Escherichia coli
eLife 10:e64092.
https://doi.org/10.7554/eLife.64092


