Graded titin cleavage progressively reduces tension and uncovers the source of A-band stability in contracting muscle
- Institute of Physiology II, University of Muenster, Germany
Figures
Figure 1
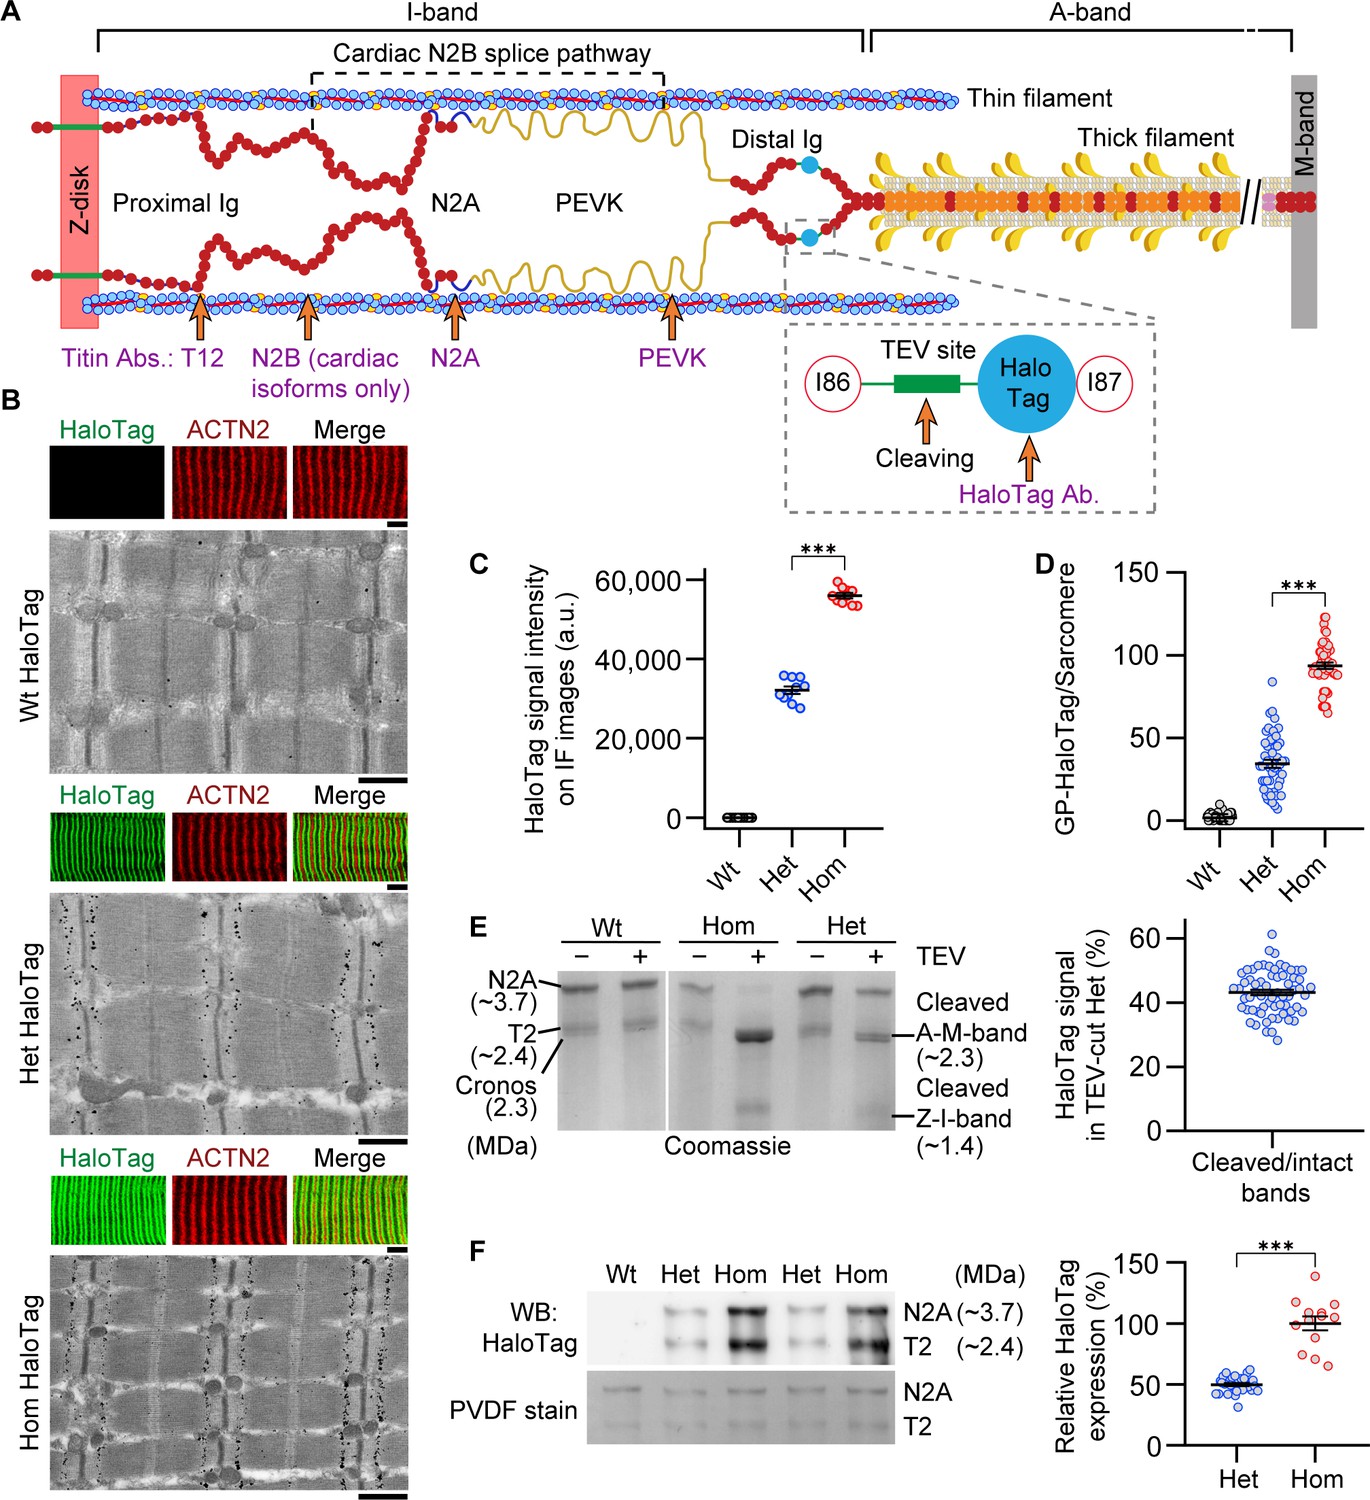
Mutant titin expression in skeletal muscles of different genotypes.
(A) Schematic of titin cleavage (TC) mouse half-sarcomere. Distal I-band titin holds a tobacco etch virus (TEV) protease-recognition site and a HaloTag. The epitope positions of titin and HaloTag antibodies are indicated. (B) Correlative immunofluorescence (IF) and immunogold electron microscopy of wild-type (Wt), heterozygous (Het), and homozygous (Hom) psoas muscle. Representative IF images of fibers (colored panels) labeled with HaloTag antibody (green) and counterstained for α-actinin (ACTN2, red), and immunoelectron micrograph showing HaloTag labeling. Scale bars, 5 μm (IF); 1 μm (IEM). (C) Quantification of HaloTag-expression level using IF intensities (HaloTag signals normalized to ACTN2 signals; n = 10 fiber averages; sarcomere length [SL] range, 2.7–2.9 µm). (D) Gold particle (GP) count per sarcomere, from HaloTag-stained IEM images (n = 50 sarcomeres/group; SL range, 2.7–2.9 µm). (E) Coomassie-stained, agarose-strengthened 1.8% sodium dodecyl sulfate–polyacrylamide gel electrophoresis (SDS–PAGE), titin gel analysis in different genotypes. Left: Representative gel with bands labeled. Right: Results of densitometric quantification of cleaved titin (A-M-band) intensity, compared to non-cleaved titin in Het (n = 65 samples; n = 5 different mice/group). (F) Western blot analysis of mutant titin (N2A) expression in different genotypes. Left: Representative immunoblot using anti-HaloTag (top) and Coomassie-stained PVDF membrane indicating protein load (bottom). Right: Densitometric results for Het vs. Hom anti-HaloTag signal intensities (n = 29 Het, 13 Hom). Stats: ANOVA with Tukey’s HSD post hoc procedure or Student’s t-test.
-
Figure 1—source data 1
Data, Stats, and uncropped gel/blot figures for Figure 1.
- https://cdn.elifesciences.org/articles/64107/elife-64107-fig1-data1-v2.xlsx
Figure 2
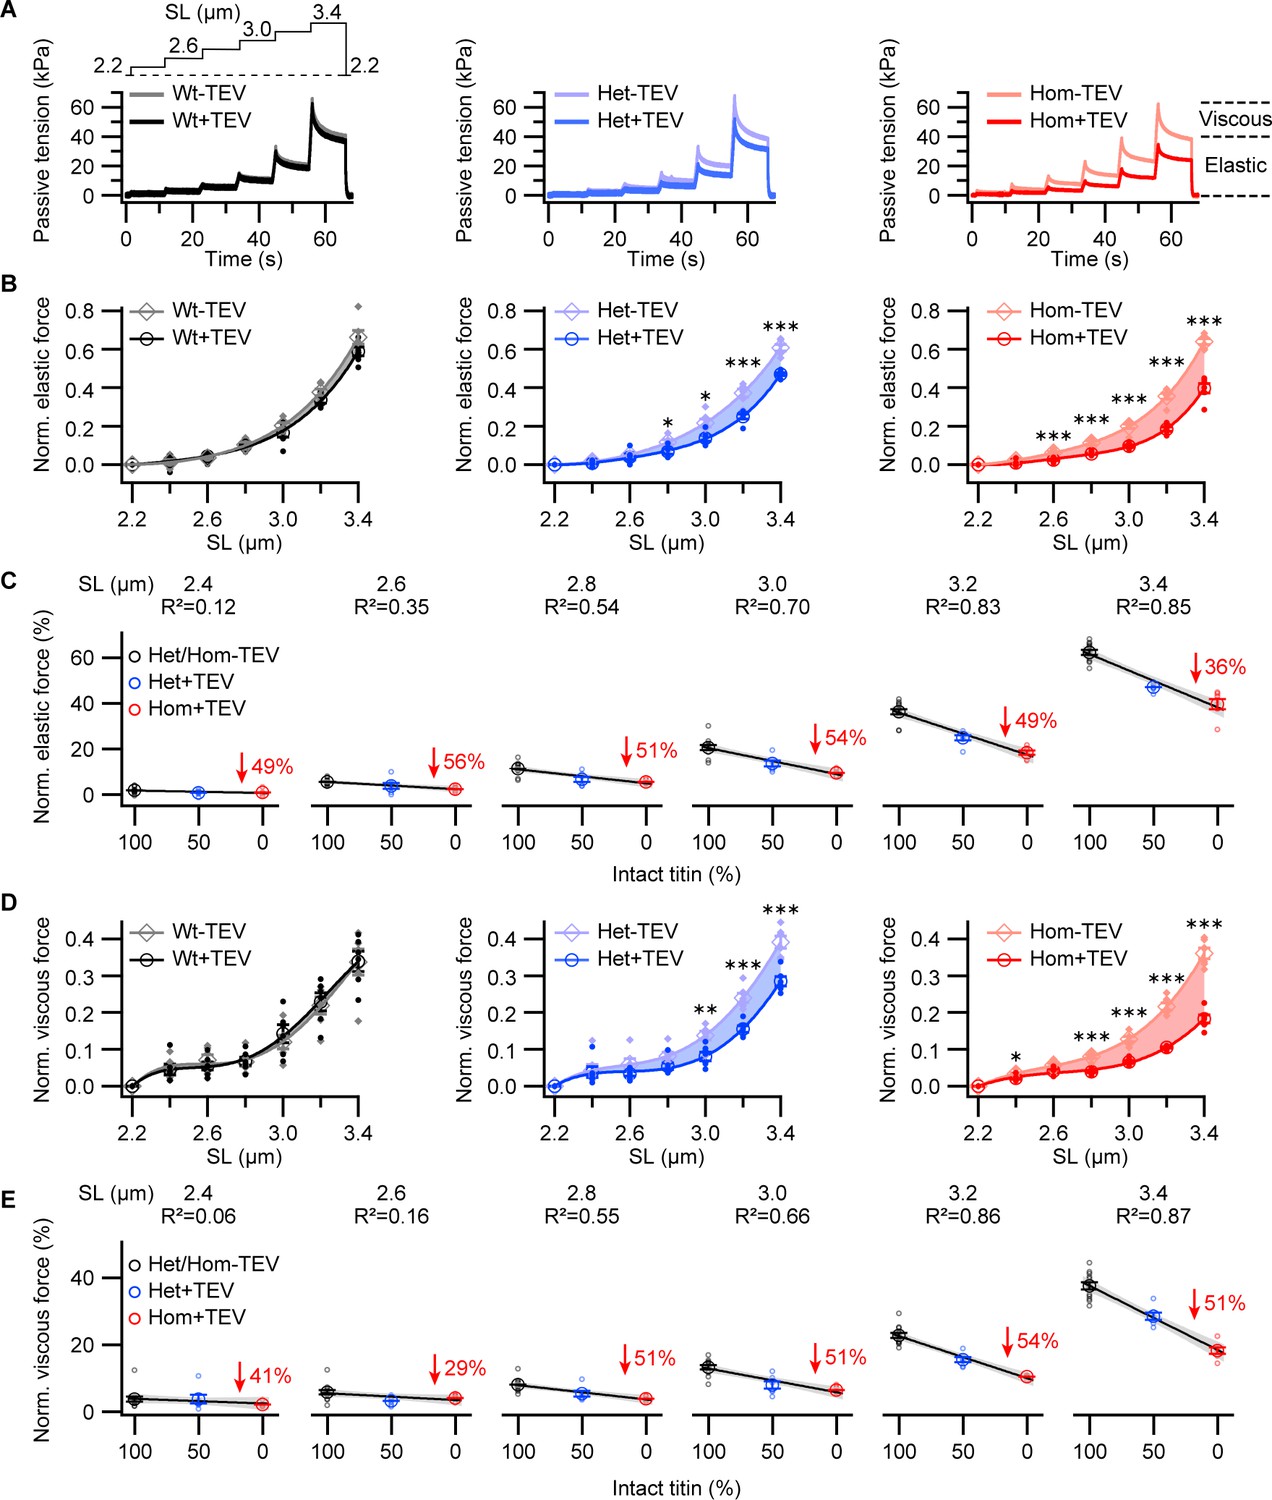
Passive forces of permeabilized titin cleavage (TC) fibers before and after titin cleavage.
(A) Representative tension-time traces from passive ramp experiments, for permeabilized Wt, Het, and Hom fiber bundles. Fibers were stretched stepwise (protocol on top, left), and passive force was recorded before and after 30 min of TEV-protease treatment. Data were normalized to maximum peak force before TEV treatment for analysis. (B) Average elastic and (D) viscous tension reduction with TEV-protease treatment, per genotype (n = 6 fiber bundles/group). Significant differences after TEV protease treatment are identified (asterisks). We further conducted a correlation analysis between passive force and intact titin content as a function of SL for both elastic (C) and viscous (E) components. A linear model was fit to force vs. intact titin data at each SL for Wt (black), Het (blue), and Hom (red) trials. Passive force drop between control and TEV-protease treatment for Hom shown in red. Gray shade around linear regressions indicates the 95% confidence interval. At short SLs, where titin-based forces are very small, no relationship, or a weak negative relationship, exists (R2 < 0.5), which becomes stronger at moderate and long SLs (R2 > 0.5). Stats: ANOVA with Tukey’s HSD post hoc procedure.
-
Figure 2—source data 1
Data and Stats for Figure 2.
- https://cdn.elifesciences.org/articles/64107/elife-64107-fig2-data1-v2.xlsx
Figure 3
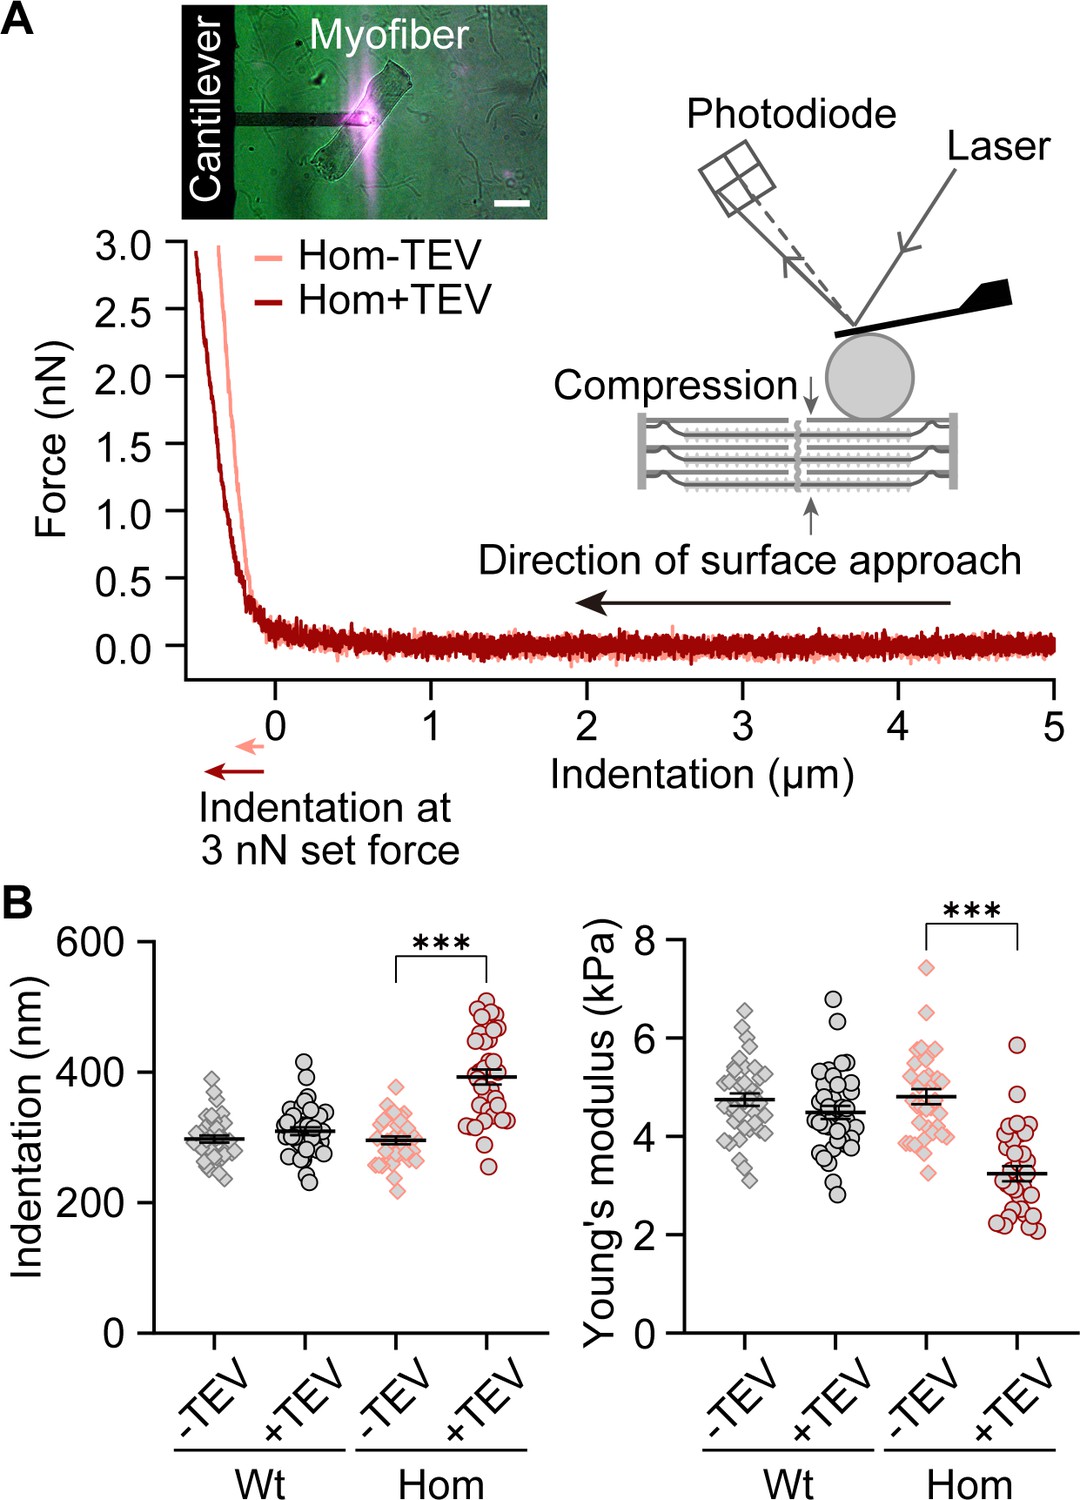
Transverse fiber stiffness upon titin cleavage by atomic force microscope (AFM) nanoindentation.
(A) Representative single force-indentation curves obtained from relaxed, permeabilized Hom psoas fibers before (orange) and after (red) TEV protease treatment. The principle of AFM measurement is depicted in the cartoon. Inset on upper left: image of a fiber during AFM experiments. Scale bar, 100 µm. (B) Indentation depth at 3 nN (left) and Young’s modulus (right) for Wt and Hom fibers before and after TEV protease treatment (Wt: n = 38 recordings, Hom: n = 34 recordings; six different fibers per group were analyzed). Stats: ANOVA with Tukey’s HSD post hoc procedure.
-
Figure 3—source data 1
Data and Stats for Figure 3B.
- https://cdn.elifesciences.org/articles/64107/elife-64107-fig3-data1-v2.xlsx
Figure 4
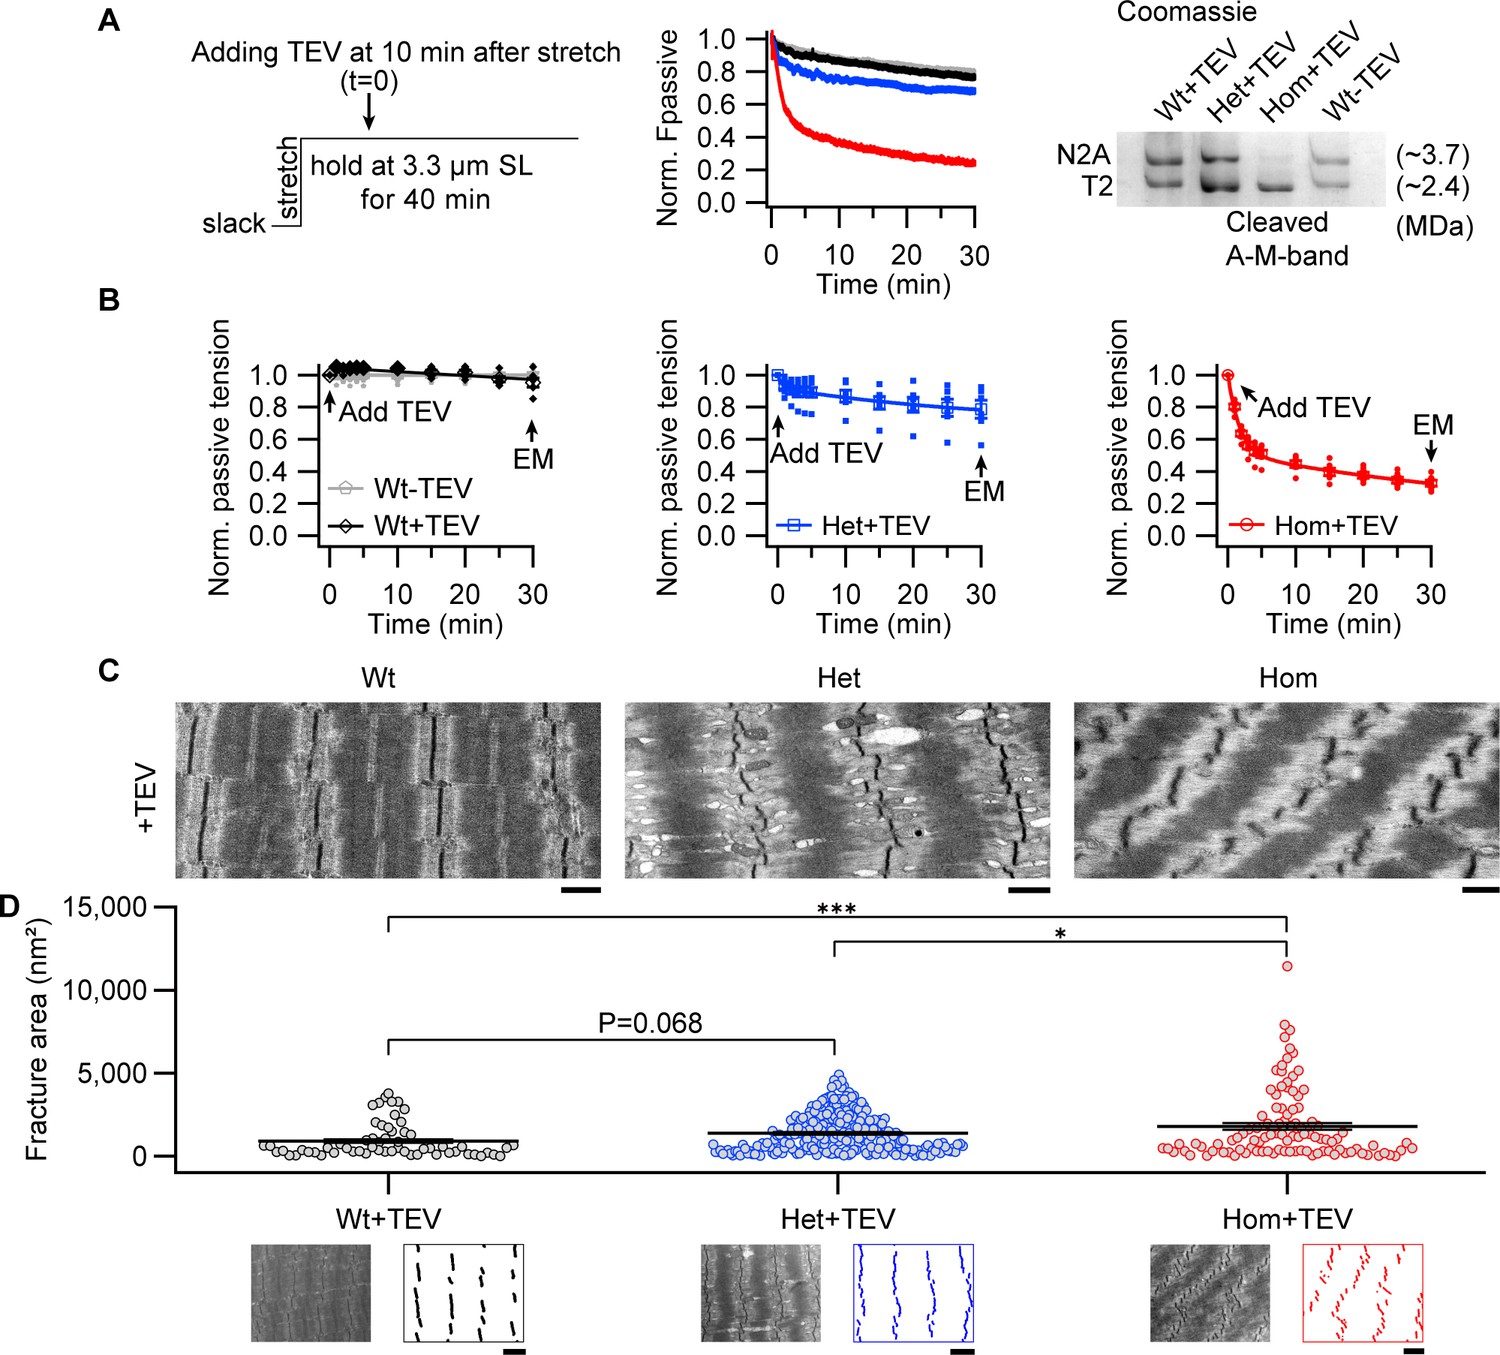
Z-disks become increasingly misaligned with progressive titin cleavage in the stretched state.
(A) Time-resolved passive tension decreases with or without TEV-protease treatment, at 3.3 µm SL; experimental protocol (left) and representative tension-time traces (middle). Raw data was normalized to the averaged time-matched tension without TEV protease treatment. Following mechanical measurements, a subset of fibers was analyzed by titin protein-gel electrophoresis to confirm expected cleavage (Coomassie-stained example, right). (B) Averaged values at 0, 1, 2, 3, 4, 5, 10, 15, 20, 25, and 30 min after TEV protease treatment or no treatment for control (n = 6 WT, 6 Het, 6 Hom animals). (C) Representative electron micrographs of relaxed Wt, Het, and Hom fibers after treatment with TEV protease while being held passively for 30 min at the stretched length. Scale bars, 1 µm. (D) Z-disk order of TEV protease treated fibers after hold protocol, quantified by fracture area (see Materials and methods; Wt+TEV: n = 60, Het+TEV: n = 239, Hom+TEV: n = 104). The images below the graph show representative electron micrographs and processed images used to calculate fracture area, for each genotype, after TEV treatment. Scale bars, 1.5 µm. Average length of sarcomeres on images, 3.3 μm (range, 3.0–3.6 µm). Stats: ANOVA with Tukey’s HSD post hoc procedure.
-
Figure 4—source data 1
Data, Stats and uncropped gel figure for Figure 4.
- https://cdn.elifesciences.org/articles/64107/elife-64107-fig4-data1-v2.xlsx
Figure 5 with 3 supplements
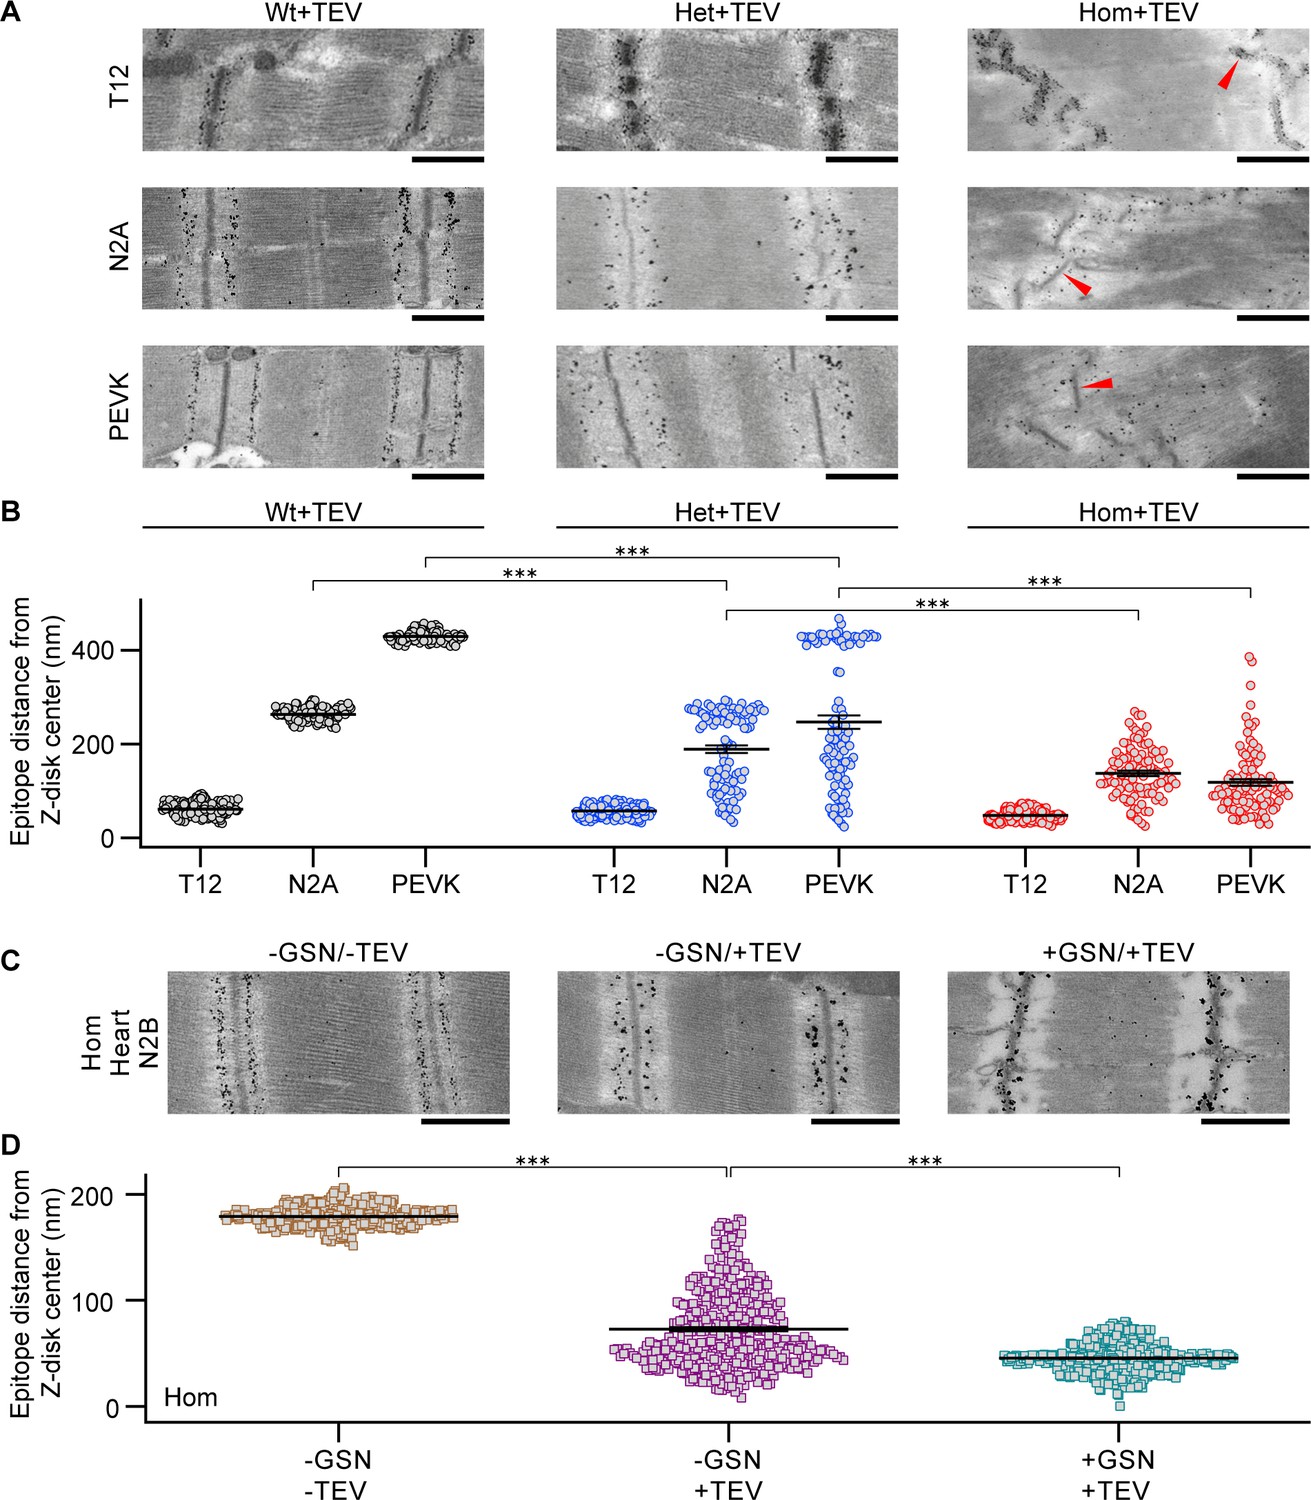
Incomplete elastic recoil of cleaved titin to the Z-disk.
(A) Nanogold immunoelectron micrographs of skeletal fibers labeled with different antibodies to I-band titin (T12, N2A, and proline-glutamate-valine-lysine-rich region (PEVK)). Shown are examples of Wt, Het, and Hom fibers after TEV protease treatment, held passively for 30 min at a stretched length. Red arrows point to Z-disks. (B) Recoil of elastic titin to the Z-disk in skeletal fibers quantified by measuring the antibody-epitope to Z-disk-center distance (n = 100 measurements/condition; SL range, 2.9–3.0 µm). (C) Passively fixed Hom TC cardiomyocytes labeled for the N2B titin element (central I-band) showing regular staining in controls (−GSN/−TEV; left). Titin cleavage by TEV protease (−GSN/+TEV, middle) or actin-removal by gelsolin treatment, followed by TEV treatment (+GSN/+TEV), caused partial (middle) or full (right) recoil of titin springs to Z-disks. (D) Quantification of titin recoil in Hom TC cardiomyocytes from images as in (C); measurement as in (B) (n = 200 measurements/group, evenly from 10 sarcomeres/group; SL range, 2.2–2.3 µm). Stats: ANOVAs with Tukey’s HSD post hoc procedure, further confirmed via ranked sum assessment (analysis not shown). Note: error bars are very small.
-
Figure 5—source data 1
Data and Stats for Figure 5.
- https://cdn.elifesciences.org/articles/64107/elife-64107-fig5-data1-v2.xlsx
Figure 5—figure supplement 1
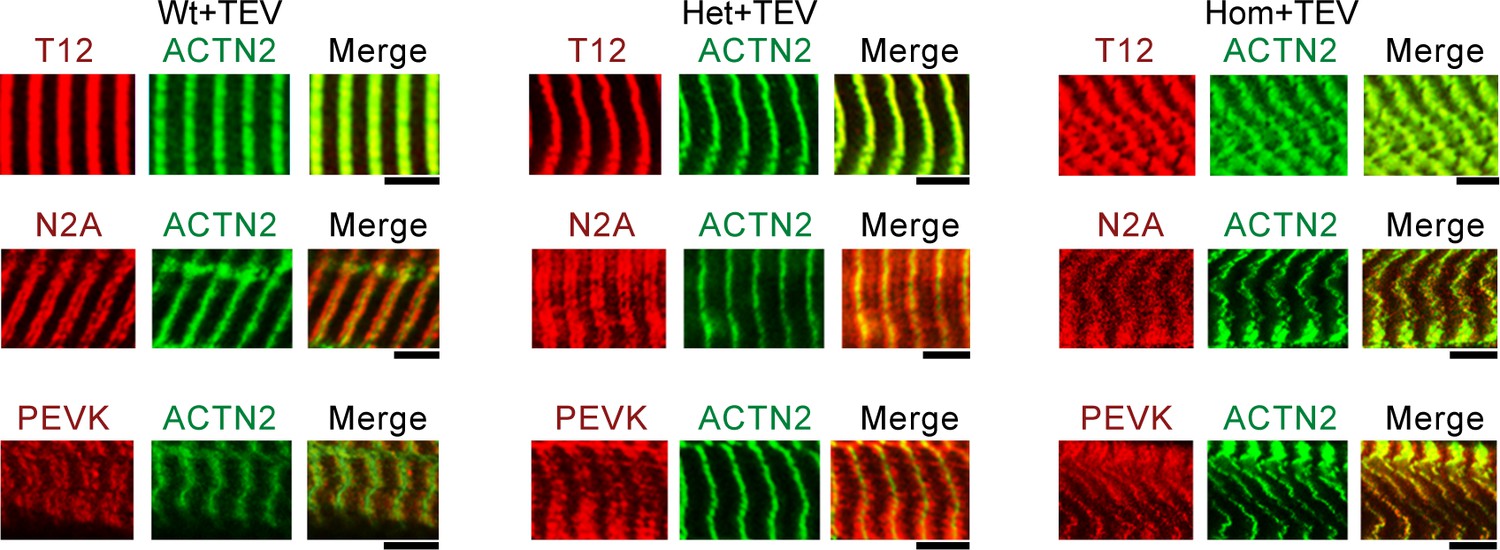
Immunofluorescence (IF) micrographs of skeletal fibers labeled with different antibodies to I-band titin (T12, N2A, and PEVK, red IF staining), and Z-disk marker α-actinin (ACTN2, green IF staining).
Shown are examples of Wt, Het, and Hom fibers after TEV-protease treatment, held passively for 30 min at a stretched length. Scale bars, 5 μm.
Figure 5—figure supplement 2
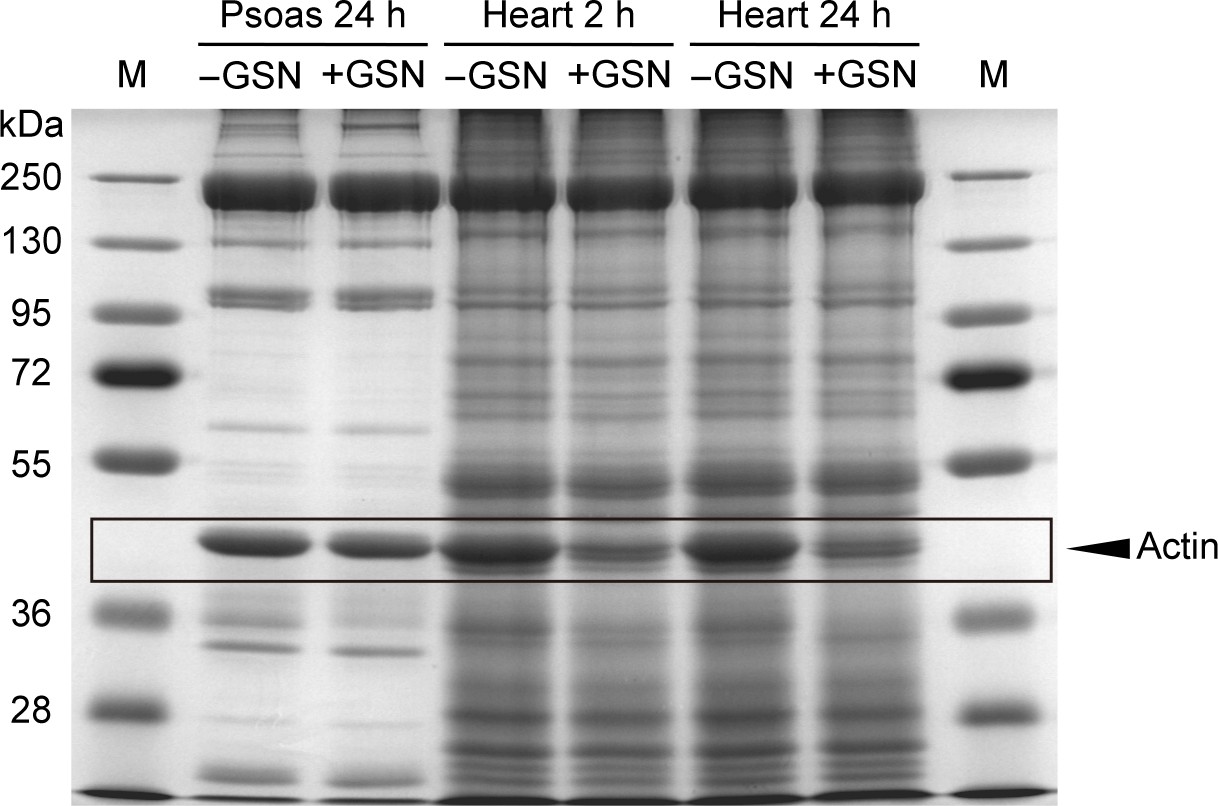
Coomassie-stained protein gel of skeletal (psoas) and cardiac muscle tissue.
Skeletal muscle tissue was treated for 24 hr with Ca2+-independent gelsolin fragment (GSN), while cardiac tissue was treated for 2 or 24 hr. While cardiac actin is degraded by gelsolin, skeletal actin is not, as reported (Linke et al., 1997). Note that actin in the Z-disk is not degraded by the gelsolin fragment and can account for any remaining actin in cardiac tissue. These findings are supported by cardiac EM images, where gelsolin treatment leaves no visible thin filaments in the I-band (Figure 5C). M, marker.
Figure 5—figure supplement 3

Representative images of passively fixed, gelsolin-treated but not TEV-treated (+GSN/−TEV), Hom TC cardiomyocytes examined by transmission electron microscopy (EM) (left) or immuno-EM using antibodies to the N2B element of cardiac titin and nanogold-conjugated secondary antibodies (right).
With thin filaments removed, I-band titin filaments can be observed with the characteristic higher density at the N2-line (red arrow). Thus, titin filaments are still intact after gelsolin treatment, suggesting that TEV-protease treatment is the cause of titin recoil toward the Z-disk (Figure 5C). Scale bar, 1 μm.
Figure 6

Effect of titin cleavage on actively contracting fibers.
(A) Representative active force traces before and after TEV-protease treatment for Wt (black), Het (blue), and Hom (red) psoas skinned fibers. Each sample was activated once without treatment and once after TEV treatment (SL, 2.6 µm). (B) Pooled force data after 2 min of activation at pCa five before/after TEV-protease treatment, normalized to the steady-state active force before TEV treatment (n = 6 Wt-TEV, 7 Wt+TEV, 7 Het-TEV, 9 Het+TEV, 7 Hom-TEV, and 13 Hom+TEV fibers). The average % active force decrease is indicated in red. (C) Representative electron micrographs of TEV-treated fibers after active contraction and stretched in the relaxed state. Arrows denote Z-disks. (D) A subset of samples were loaded onto Coomassie-stained, loose gels to measure the myosin heavy chain:titin (MyHC/titin), titin/nebulin (titin/NEB), and MyHC/NEB protein ratios after TEV treatment and active contraction. A representative gel (left) and a summary of results (right) are shown (n = 5 fibers/group). Stats: ANOVA with Tukey’s HSD post hoc procedure.
-
Figure 6—source data 1
Data, Stats and uncropped gel figure for Figure 6.
- https://cdn.elifesciences.org/articles/64107/elife-64107-fig6-data1-v2.xlsx
Figure 7
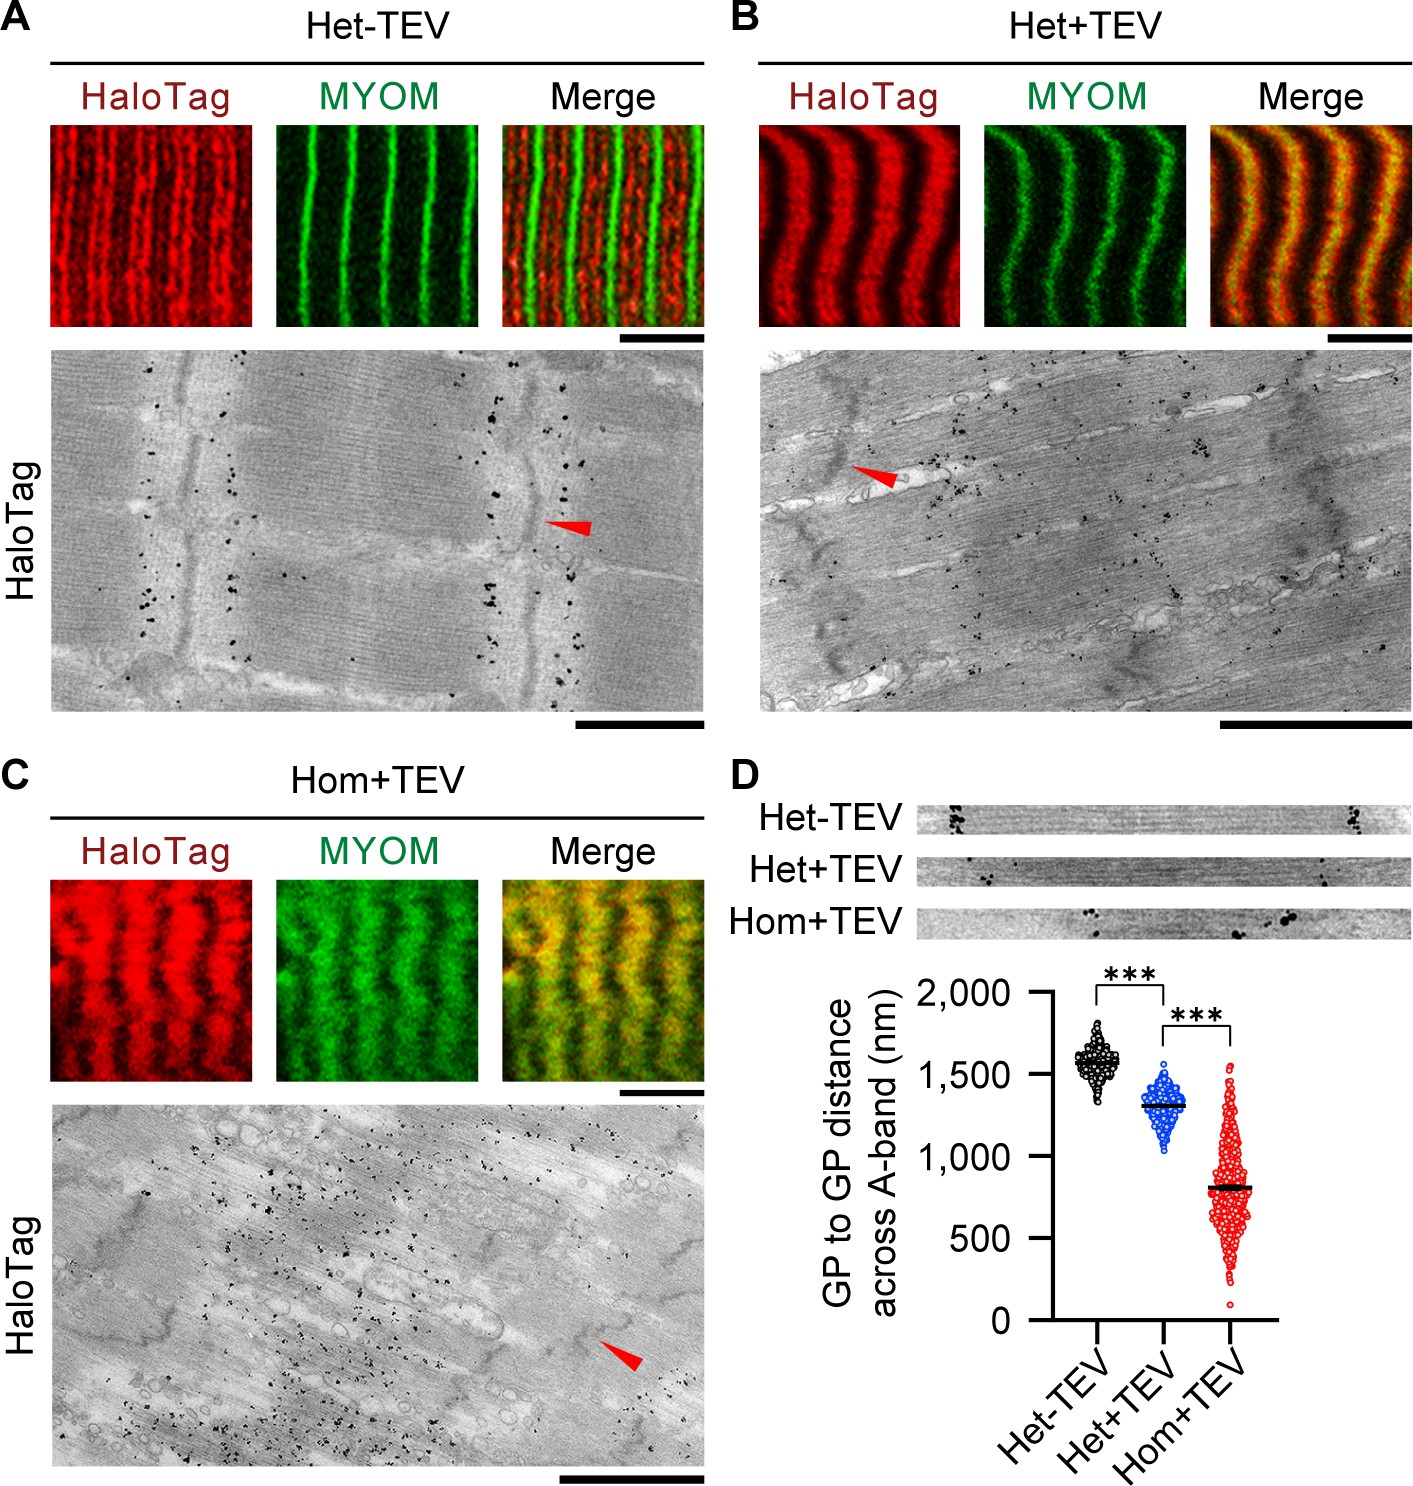
Effect of titin cleavage on A-band structure during active contraction.
(A–C) A-band disorder visualized by tracking the HaloTag position by antibody labeling (red fluorescent secondary antibodies or nanogold particles), using correlative immunofluorescence (IF) and immunoelectron microscopy (IEM). MYOM, anti-myomesin antibody (M-band marker; green). Red arrows indicate Z-disks. Scale bars, 5 μm (IF); 1 μm (IEM). (D) HaloTag-to-HaloTag distance after active contraction as a measure of thick filament length, for the three experimental groups, measured on IEM images (n = 50 sarcomeres/group; n = 500 measurements/group; SL, 2.9–3.0 µm). Insets on top show representative examples used for the analysis. Stats: ANOVA with Tukey’s HSD post hoc procedure.
-
Figure 7—source data 1
Data and Stats for Figure 7D.
- https://cdn.elifesciences.org/articles/64107/elife-64107-fig7-data1-v2.xlsx
Figure 8

Summary of the effects of titin cleavage on sarcomere stability.
Representative electron microscopy images (left) and cartoon interpretations (right) of the sarcomere structures for Hom TC permeabilized fibers at a stretched length, as follows: control fibers not treated with TEV protease (A), passive fibers treated with TEV protease but never activated (B), and activated fibers treated with TEV protease, broken up into early (C), intermediate (D), and late (E) levels of deterioration. Red arrows denote groups of adjacent thick filaments that moved toward opposite Z-disks. Letters D, C, P, and M (top right) refer to the different zones along the thick-filament structure. More details given in Results. Scale bars, 1 µm.
Author response image 1
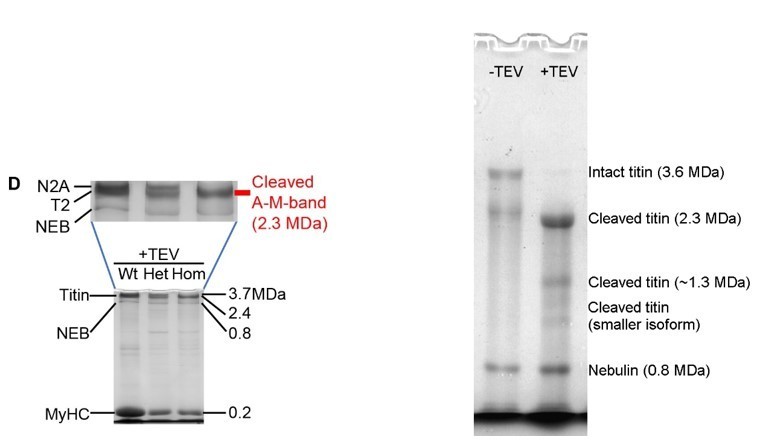
The left gel is from Figure 6D (2.4% SDS-PAGE), the right gel is a more typical titin gel of 1.8% polyacrylamide (all gels are agarose-strengthened), where the nebulin band position is where most people would expect it.
Tables
Key resources table
| Reagent type (species) or resource | Designation | Source or reference | Identifiers | Additional information |
|---|---|---|---|---|
| Gene Mus musculus | Ttn | Ensembl | ENSMUSG00000051747 | |
| Strain background Mus musculus | C57BL/6J | Rivas-Pardo et al., 2020, UKM animal facility | RRID:IMSR_JAX:000664 | Approved by LANUV NRW, 81–02.04.2019.A472 |
| Genetic reagent Mus musculus | Ttn sequence between exons 224 and 234 | doi: 10.1038/s41467-020-15465-9 | HaloTag-TEV knock-in cassette | |
| Antibody | Anti-titin PEVK, rabbit polyclonal | Eurogentec, Belgium | Custom-made | IEM ‘(1:500)’, IF ‘(1:400)’ |
| Antibody | Anti-titin N2A, rabbit polyclonal | Eurogentec, Belgium | Custom-made | IEM ‘(1:400)’, IF ‘(1:400)’ |
| Antibody | Anti-titin T12, mouse monoclonal | Provided by Dr. D.O. Fürst, Bonn, Germany | Custom-made | IEM ‘(1:100)’, IF ‘(1:100)’ |
| Antibody | Anti-titin N2B, rabbit polyclonal | Myomedix, Mannheim, Germany | TTN-3 | IEM ‘(1:500)’ |
| Antibody | Anti-HaloTag, rabbit polyclonal | Promega | Cat. # G928A, RRID:AB_713650 | IEM ‘(1:100)’, IF ‘(1:100)’, WB ‘(1:1000)’ |
| Antibody | Anti-actinin alpha 2, mouse monoclonal | Sigma | Cat. # A7811, RRID:AB_476766 | IF ‘(1:100)’ |
| Antibody | Anti-myomesin-1, mouse monoclonal | Provided by Dr. E. Ehler, London, UK | Custom-made | IF ‘(1:100)’ |
| Antibody | Mouse IgG F(ab')two antibody fluorescein conjugated, goat polyclonal | Rockland | Cat. # 610–1204, RRID:AB_219653 | IF ‘(1:400)', secondary antibody |
| Antibody | Cythree affinipure goat anti-rabbit IgG, goat polyclonal | Jackson ImmunoResearch | Cat. # 111-165-003, RRID:AB_2338000 | IF ‘(1:100)”, secondary antibody |
| Antibody | Anti-rabbit IgG 1.4 nm nanogold, goat polyclonal | Nanoprobes | Cat. # 2003 | IEM ‘(1:100)”, secondary antibody |
| Recombinant DNA reagent | pMHT238Delta | doi: 10.1016/j.pep.2007.04.013 | Used to produce TEV protease | |
| Sequence-based reagent | Pmin | doi: 10.1038/s41467-020-15465-9 | PCR primers | CGTGGTGGCTTATCTTCTAGC |
| Sequence-based reagent | PRmin | doi: 10.1038/s41467-020-15465-9 | PCR primers | CTGTTGGTTCATGCATCTCC |
| Peptide, recombinant protein | AcTEV protease | ThermoFisher Scientific | Cat. # 12575023 | Used at 10 units μl−1 |
| Software, algorithm | MATLAB | https://github.com/UKMPhysII/QuantitativeFractureCode | For quantifying the fracture area of Z-disk lines of sarcomeres | |
| Other | Titin | UniProt | A2ASS6-1 | Consensus titin sequence |
Additional files
Download links
A two-part list of links to download the article, or parts of the article, in various formats.
Downloads (link to download the article as PDF)
Open citations (links to open the citations from this article in various online reference manager services)
Cite this article (links to download the citations from this article in formats compatible with various reference manager tools)
Graded titin cleavage progressively reduces tension and uncovers the source of A-band stability in contracting muscle
eLife 9:e64107.
https://doi.org/10.7554/eLife.64107


